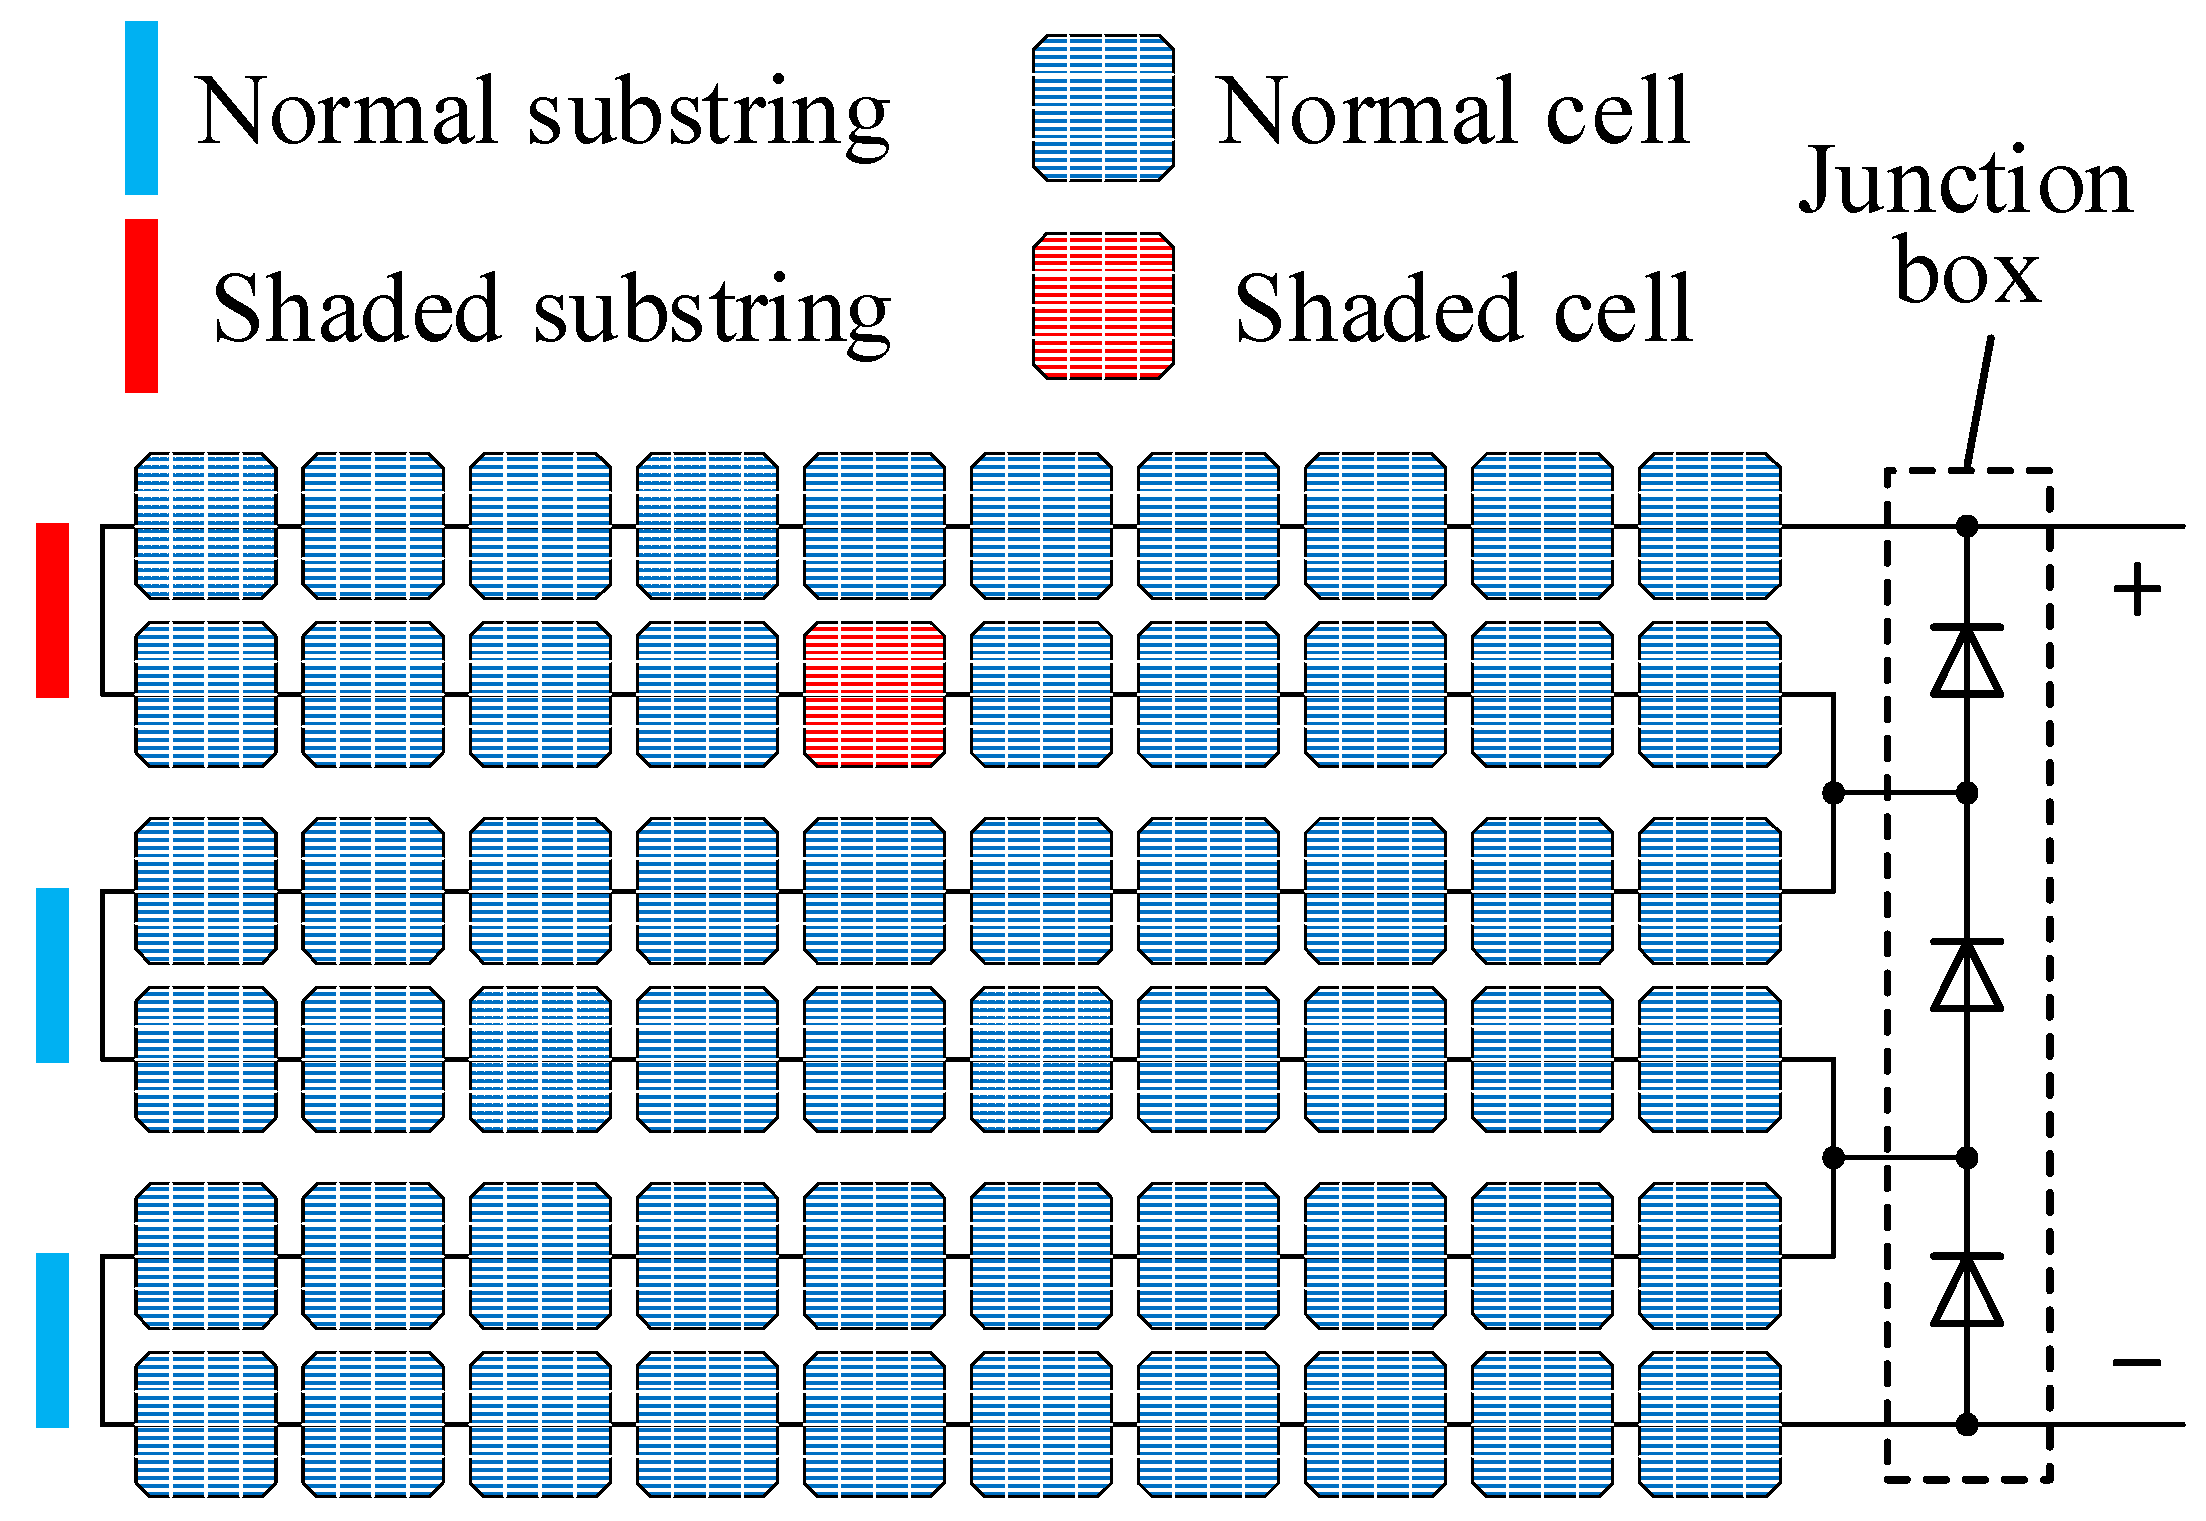
2.1. Analysis of the Diode On–Off Situation
The 300 W PV module is taken as an example from the current model. After 20 PV cells are connected in series to form a substring, 3 substrings are connected in series to form a PV module. One bypass diode is connected in reverse parallel to the output of each substring, and, finally, the bypass diode and its connecting wires are concentrated in the junction box. When a substring appears with shaded cells, this substring is referred to as the shaded substring. The internal wiring structure of the 300 W PV module is shown in
Figure 1 [
28].
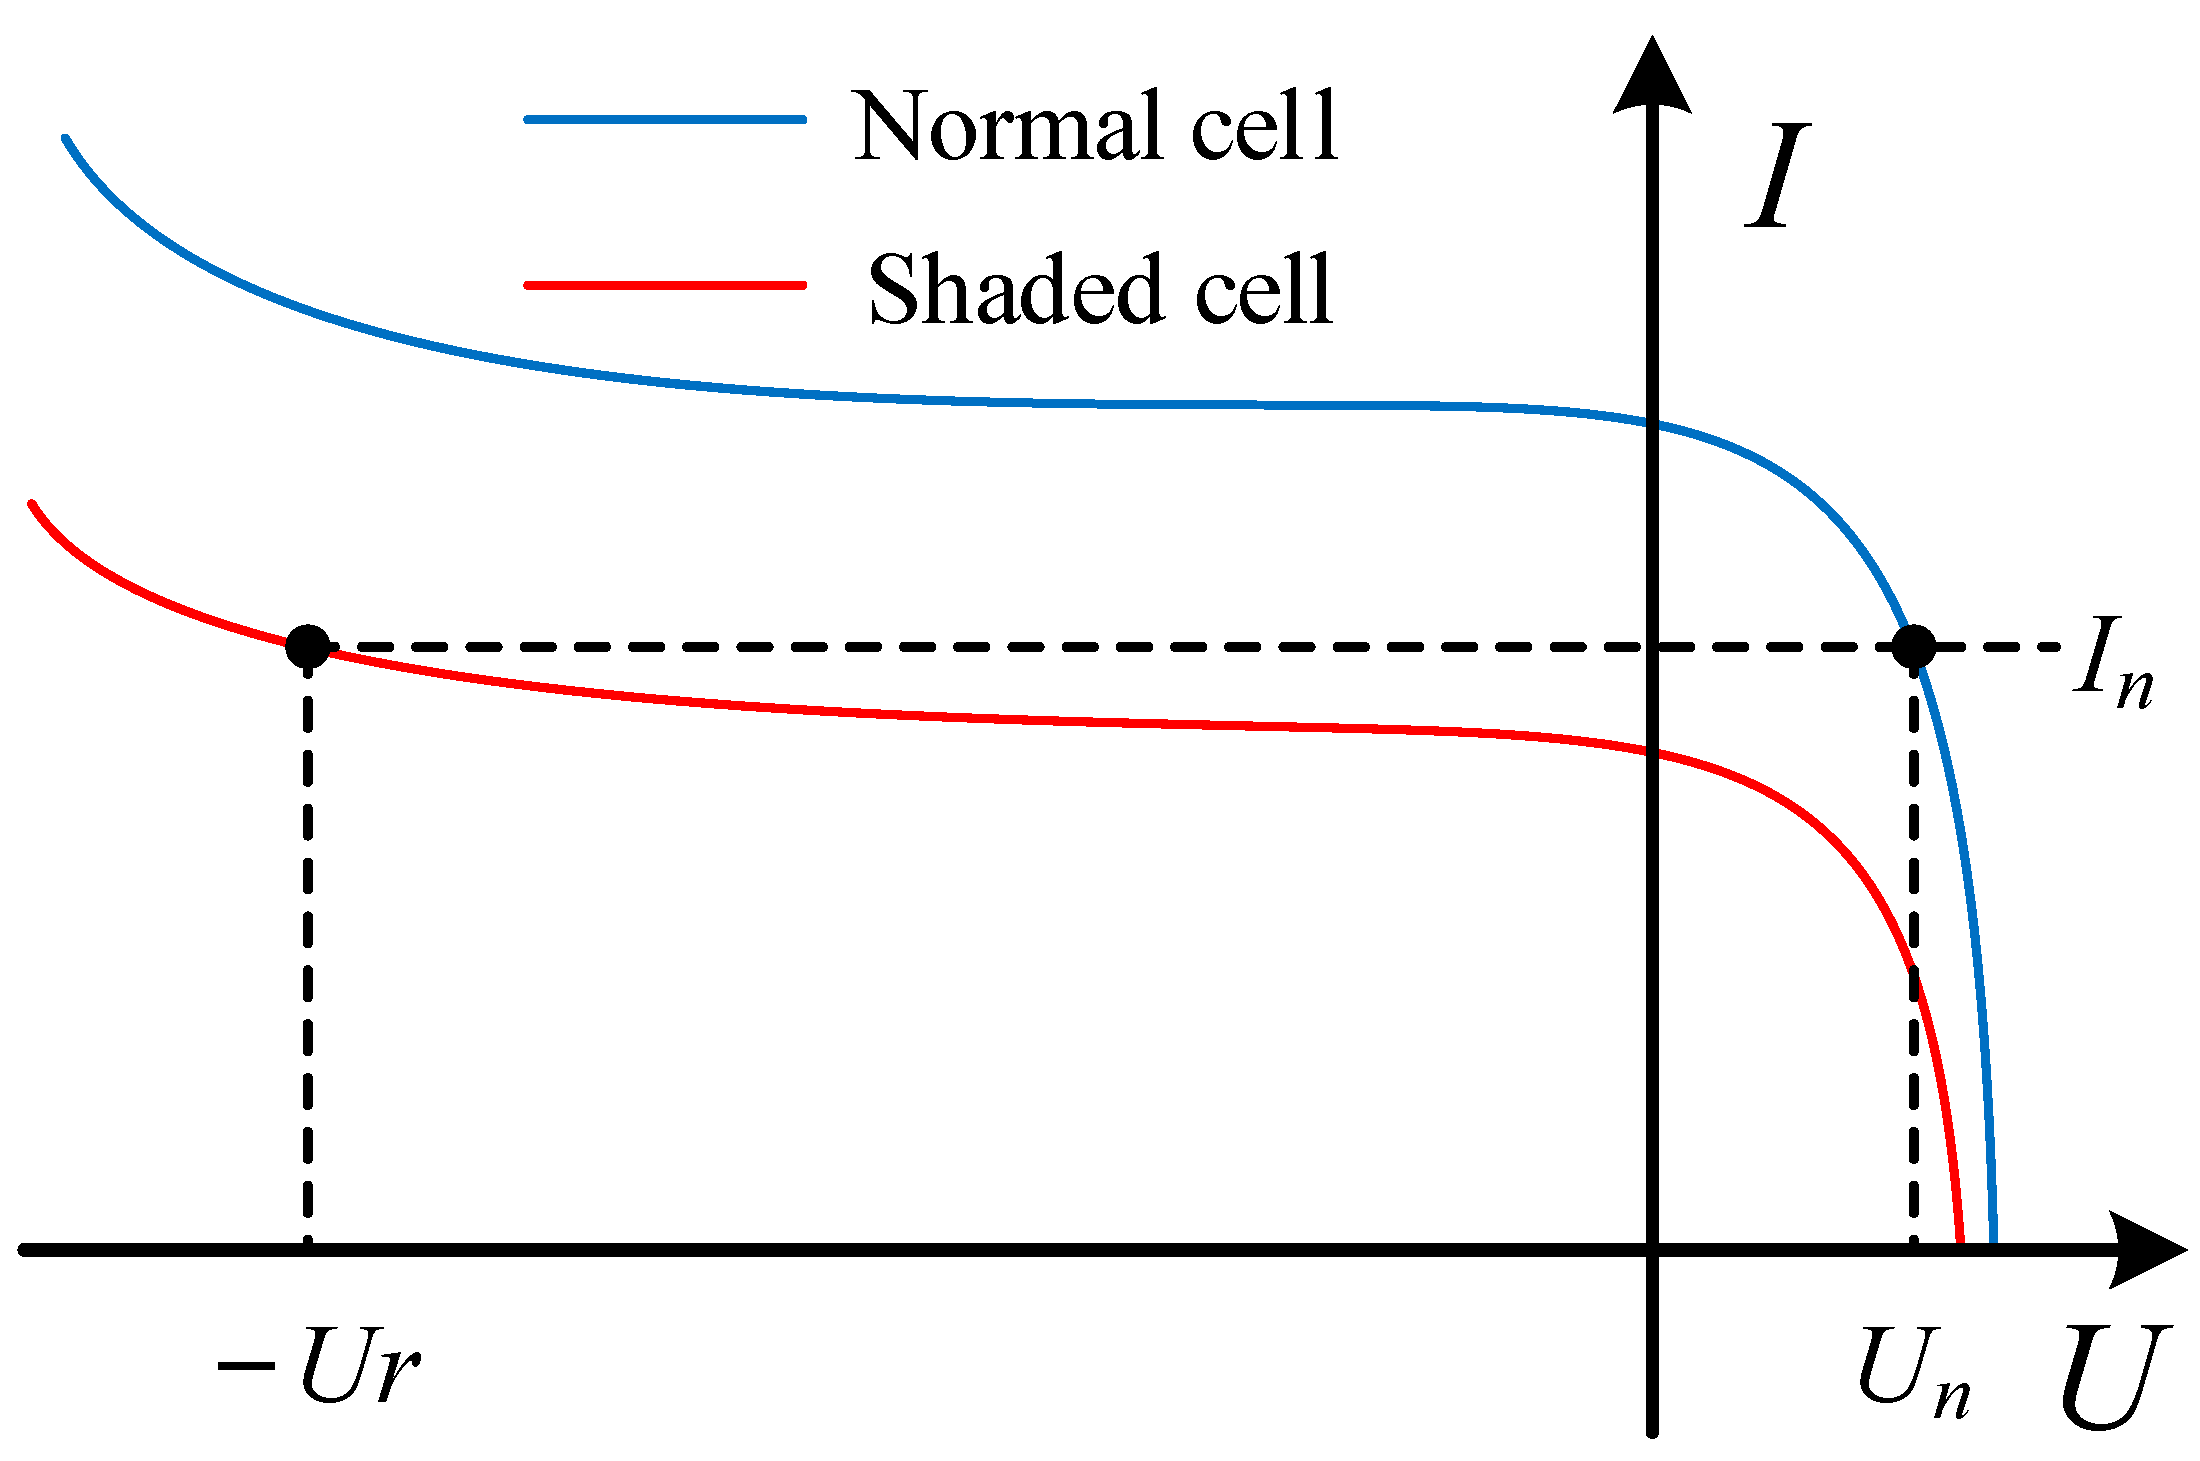
As shown in
Figure 2, within the same substring, the output current
and voltage
of the PV cell in normal conditions operate in the first quadrant. When a PV cell has a short-circuit current drop due to shading, the output current
of the normal PV cells in series with it is higher, resulting in the higher reverse bias voltage
of the shaded cell, whose current–voltage curve works in the second quadrant, consuming power and generating a certain amount of heat.
The on–off state of the bypass diode is analyzed. Assuming that there is one shaded cell in the substring and the rest are normal cells, the bypass diode will turn on when the output voltage of the substring is reverse-biased and higher than the conduction voltage of the bypass diode
. Thus, the following is satisfied [
29]:
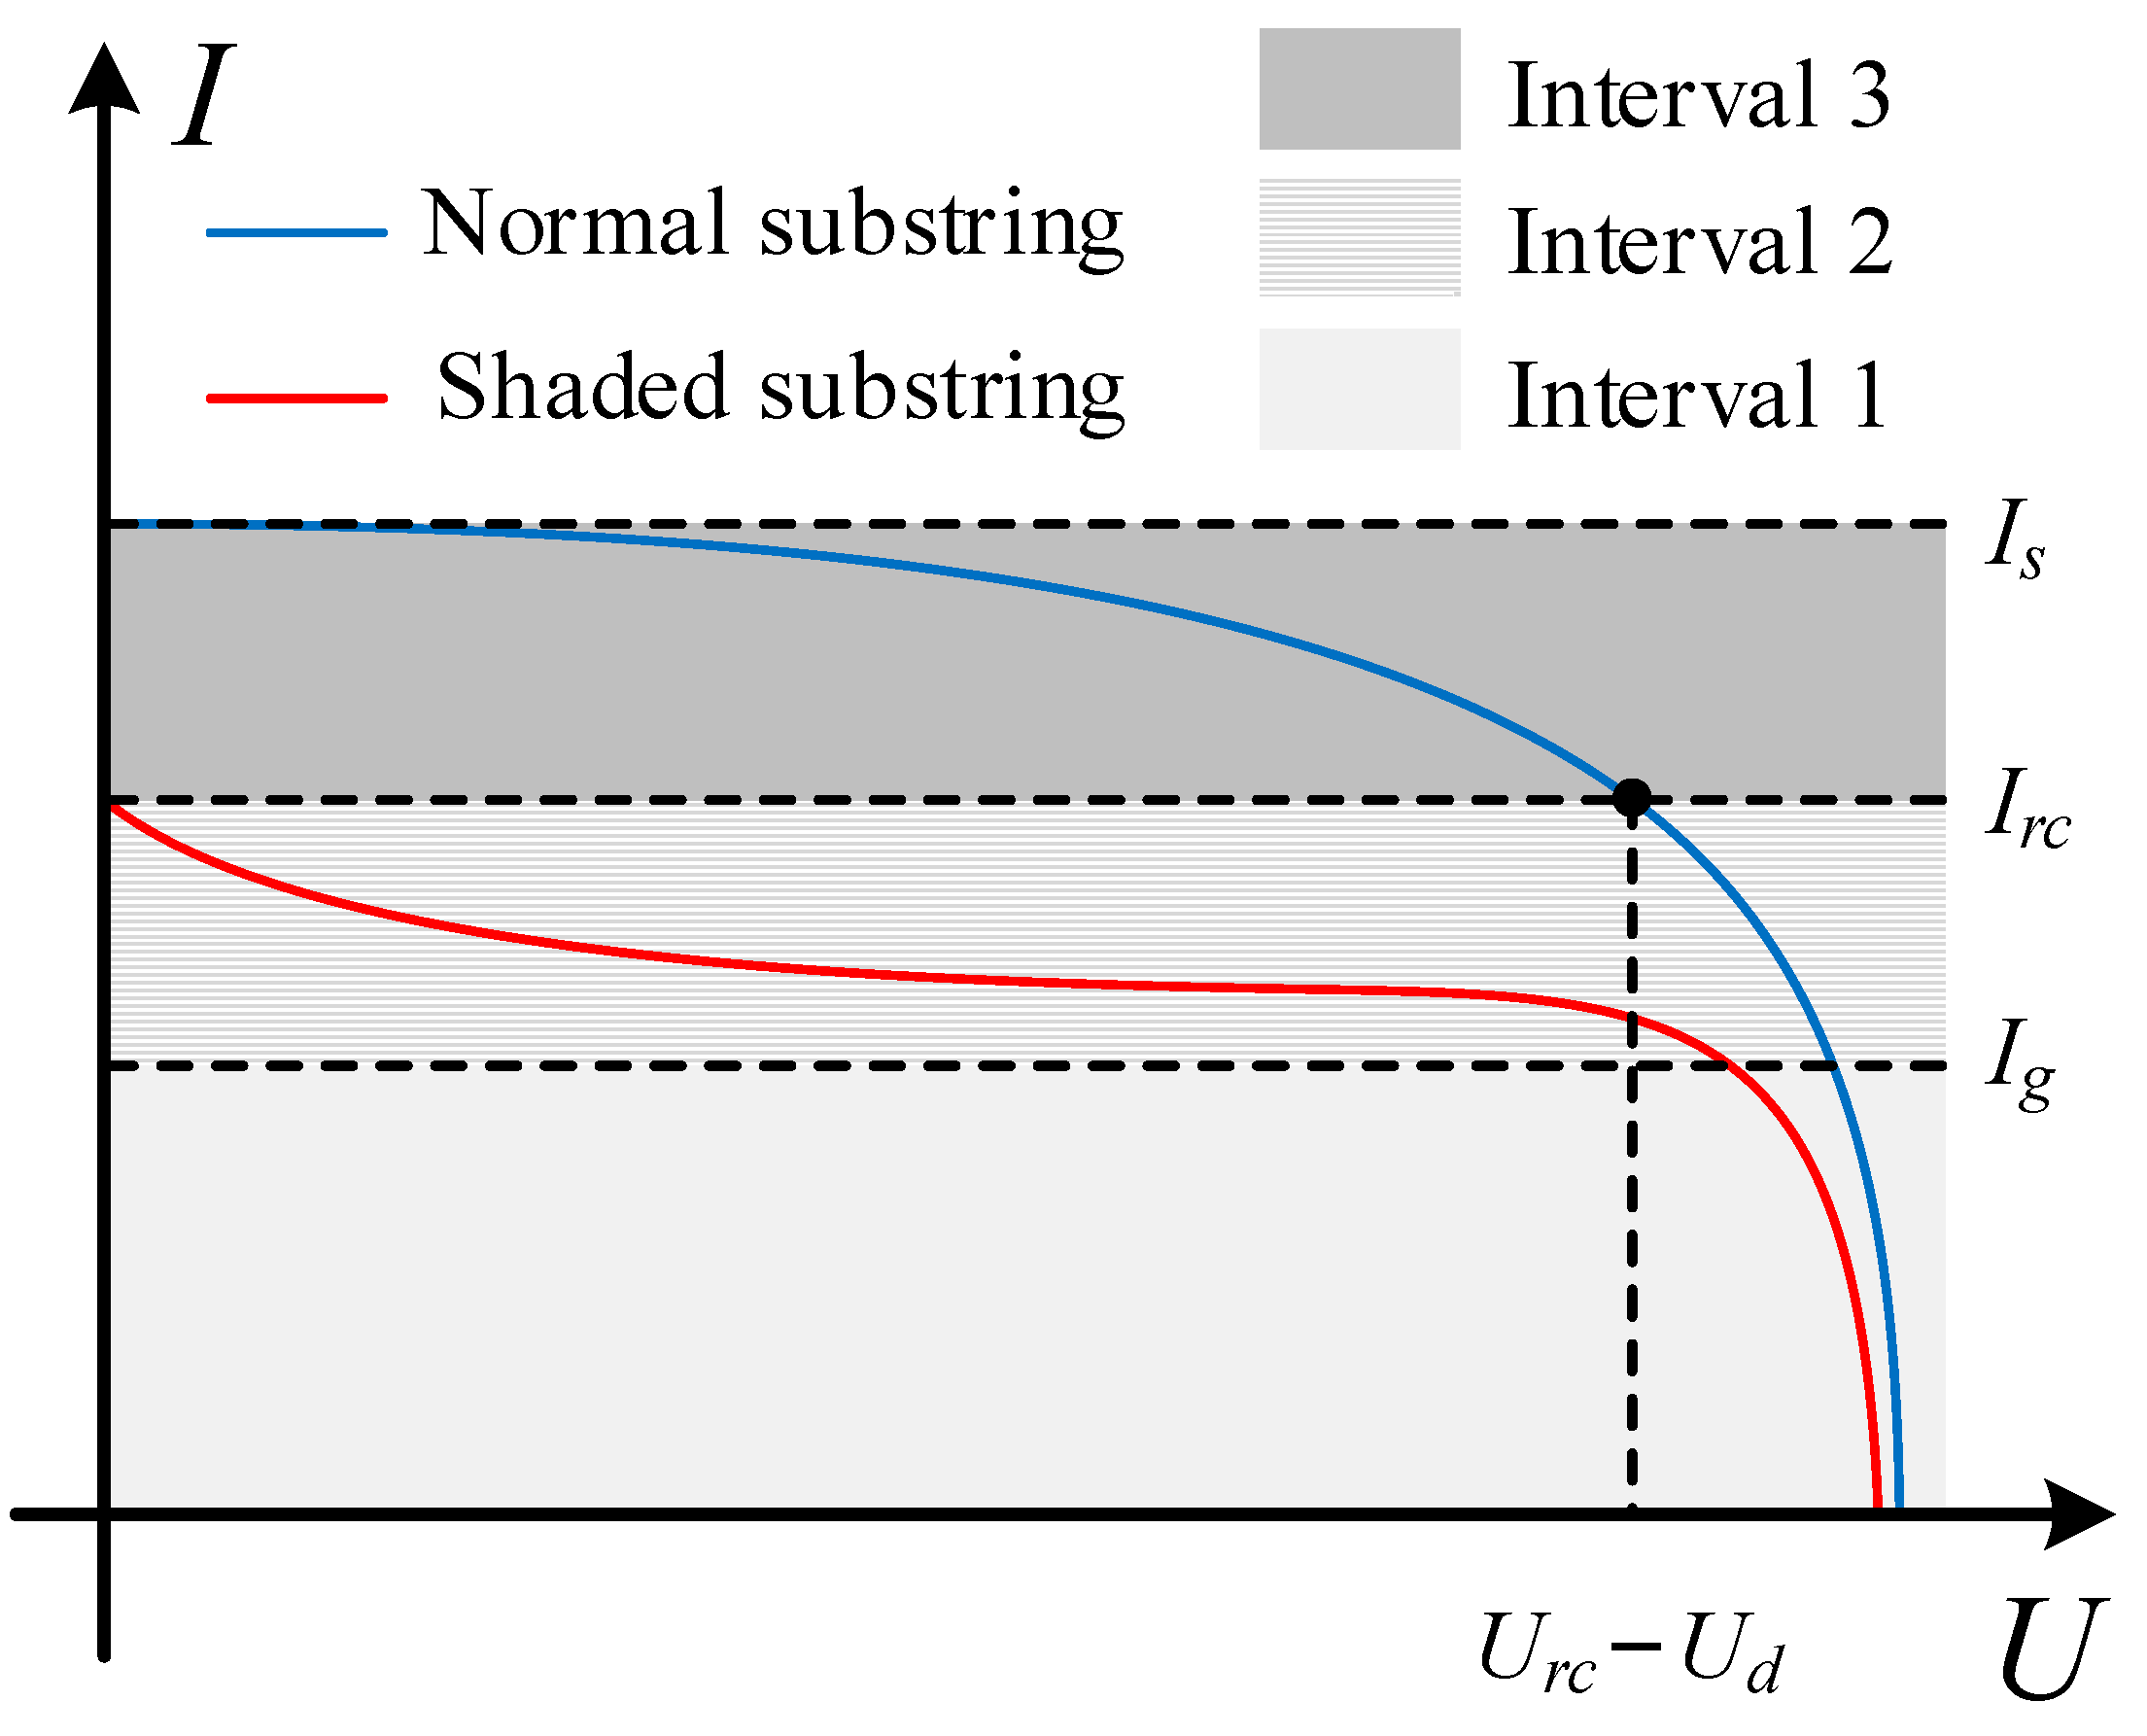
As shown in
Figure 3,
is the short-circuit current of the normal substring and cell,
is the short-circuit current of the shaded substring,
is the short-circuit current of the shaded cell, and
is the critical reverse bias voltage of the shaded cell when the diode is switched on.
When the operating current of the substring is in interval 1, the output voltage of all cells within the substring operates is found in the first quadrant. Each cell outputs power, and each diode is switched off.
When the operating current of the substring is in interval 2, the shaded cell consumes power because its output voltage is reverse-biased. However, the output voltage of the substring is still in the first quadrant, making Equation (1) not valid and the diode is still switched off. Therefore, the current range in this interval is referred to as the bypass diode operating blind zone.
When the operating current of the substring is in interval 3, the output voltage of the shaded cell is reverse-biased and exceeds the critical value , so that Equation (1) becomes valid, and thus the diode conducts. Therefore, an appropriate increase in the operating current can turn on the bypass diode that works in the operating blind zone.
According to the results of the above analysis, due to the special wiring structure inside the PV module, the on–off state of the bypass diode is related to the interval where the operating current of the PV module is located under shading conditions.
By adjusting the operating current of the PV string, the bypass diode of the corresponding PV substring turns on and generates a specific magnetic field at a spatial location when there is a shading problem in the PV string. Detecting and locating this magnetic field helps to identify and localize the shading problems.
2.2. Analysis of the Response Mechanism of Magnetostrictive Materials under the Specific Magnetic Field Environment
Magnetostrictive materials are characterized by high permeability, low coercivity, easy magnetization, easy demagnetization, and small hysteresis line envelope area, which can be used to detect the location of specific magnetic fields in space over long distances. Under the action of the magnetic field, the length of magnetostrictive material in the direction of magnetic inductance changes from
to
and satisfies [
30]:
In Equation (2), is the line magnetostriction coefficient, which can be classified as a positive or negative magnetostriction coefficient according to its plus or minus value. The magnetostriction coefficient of a magnetostrictive material at saturation magnetic induction intensity is called the saturation magnetostriction coefficient .
The magnetostrictive waveguide wire with radius
has a uniform cross-sectional current distribution when a pulse current with amplitude
and pulse width
passes, and the surface current density
can be expressed as:
According to Ampere’s law of circulation, the current
passing through a circular section of radius
inside the waveguide wire, with the axis as the center, is [
31]:
Furthermore, the intensity of the pulsed magnetic field
inside the waveguide wire at the position of distance
from the axis is obtained as:
Equation (5) shows that the pulsed magnetic field is highest at the surface position of the waveguide wire with the value
:
The relative magnetic permeability of the waveguide wire surface when only subjected to the pulsed magnetic field is
. Based on the value of absolute magnetic permeability
of vacuum as 4π × 10
−7 Wb/(A·m), the pulsed magnetic induction intensity
can be calculated as [
32]:
Under the action of this magnetic induction intensity
, the magnetostriction coefficient of the waveguide wire is
, the circumferential magnetostriction deformation produced on the surface of the waveguide wire is
, and the original circumference of the circular section of the waveguide wire is
. Thus, the following is satisfied:
The magnetic induction intensity distribution on the surface of the waveguide wire can be analyzed when a permanent magnet generating axial magnetic field exists at the local position of the waveguide wire. With the center of the waveguide wire cross-section circle as the origin, the axial direction of the waveguide wire as the
y-axis direction, and the waveguide wire cross-section as the plane where the
xz-axis is located, a right-angle coordinate system is established, as shown in
Figure 4.
Taking the first quadrant of the
xyz axis as an example, the coordinates of a point on the surface of the waveguide wire can be expressed as:
The magnetic induction intensity vector generated within the waveguide wire when subjected only to the constant axial magnetic field of the permanent magnet is
, which is expressed as:
In Equation (10),
denotes the unit magnetic induction intensity vector in the positive direction of the
y-axis. Under the action of magnetic induction intensity
, the relative magnetic permeability of the waveguide wire is
. By substituting the coordinate point (9) to Equation (7), the pulse magnetic induction intensity vector
at this point can be expressed as:
By superimposing the axial magnetic induction intensity vector
with the circumferential pulse magnetic induction intensity vector
, the torsional magnetic induction intensity vector
is calculated as follows:
In Equation (12), , , and denote the unit magnetic induction intensity vectors in the positive direction of the x, y, and z axes, respectively. Under the action of torsional magnetic induction intensity , the magnetostriction coefficient of the waveguide wire is .
During the action of the circumferential pulsed magnetic induction intensity vector
, the axial magnetic induction intensity vector
does not change, so the direction of magnetostrictive deformation on the surface of the waveguide wire remains circumferential. The deformation variable
generated by the torsional magnetic field acting on the surface of the waveguide wire can be expressed as:
When the waveguide wire is mechanically stretched and fixed at both ends without allowing its deformation, a shear stress will be generated on the surface of the waveguide wire and transmitted along the waveguide wire in the form of a torque wave.
The shear modulus of the waveguide wire is
. According to the shear Hooke law, the relationship between the shear stress
and the relative deformation variable
can be expressed as [
33]:
Substituting Equations (8) and (13) into Equation (14) yields:
The initial permeability of the waveguide wire in the absence of magnetic field influence is
, the permeability of its surface under the action of the shear stress
is
, the saturation magnetic induction intensity of the waveguide wire material is
, and the corresponding saturation magnetostriction coefficient is
. Then, according to the inverse magnetostriction effect, the following relationship exists between the change in the permeability of the waveguide wire and the stress applied to the waveguide wire [
34]:
From Equation (16), it can be deduced that:
Substituting Equation (15) into Equation (17) yields:
A detection coil is installed along the axial direction of the waveguide wire, at a position far from the permanent magnet
, to detect the torque wave generated by the shear stress
. By combining a permanent magnet with magnetic field intensity
with the detection coil, the magnetic induction intensity
induced by the waveguide wire with absolute permeability
at the position of the detection coil satisfies:
Substituting Equation (19) into Equation (18) yields:
According to Faraday’s law of electromagnetic induction, the number of turns of the detection coil is
, and the area of the coil facing the magnetic field is
. Therefore, the induced electromotive force
caused by the transmission of the torque wave to the detection coil is:
Substituting Equation (20) into Equation (21) yields:
The magnetostriction coefficients of the waveguide wire are
and
when the pulsed magnetic induction intensity
and the torsional magnetic induction intensity
are acting on the waveguide wire, respectively. Substituting them with the pulse width
of the pulsed current into Equation (22) yields:
The transmission speed of the torque wave is
. Based on the transmission time
of the torque wave from the position of the permanent magnet to the detection coil, the position information of the permanent magnet
can be further calculated as [
35]:
Since the transmission speed of the torque wave is a constant on the waveguide wire, the torque wave generated from multiple permanent magnet positions at different distances can be transmitted sequentially to the detection coil. Wave-absorbing rubbers are installed at both ends of the waveguide wire to reduce signal interference, thus enabling the non-contact long-distance detection of multiple magnetic fields.
According to Equation (23), it can be seen that the induced electromotive force of the detection coil is positively related to the amount of variation in the magnetostriction coefficient of the waveguide wire at the position of the permanent magnet, so the axial magnetic field generated by the permanent magnet is the key influencing factor.
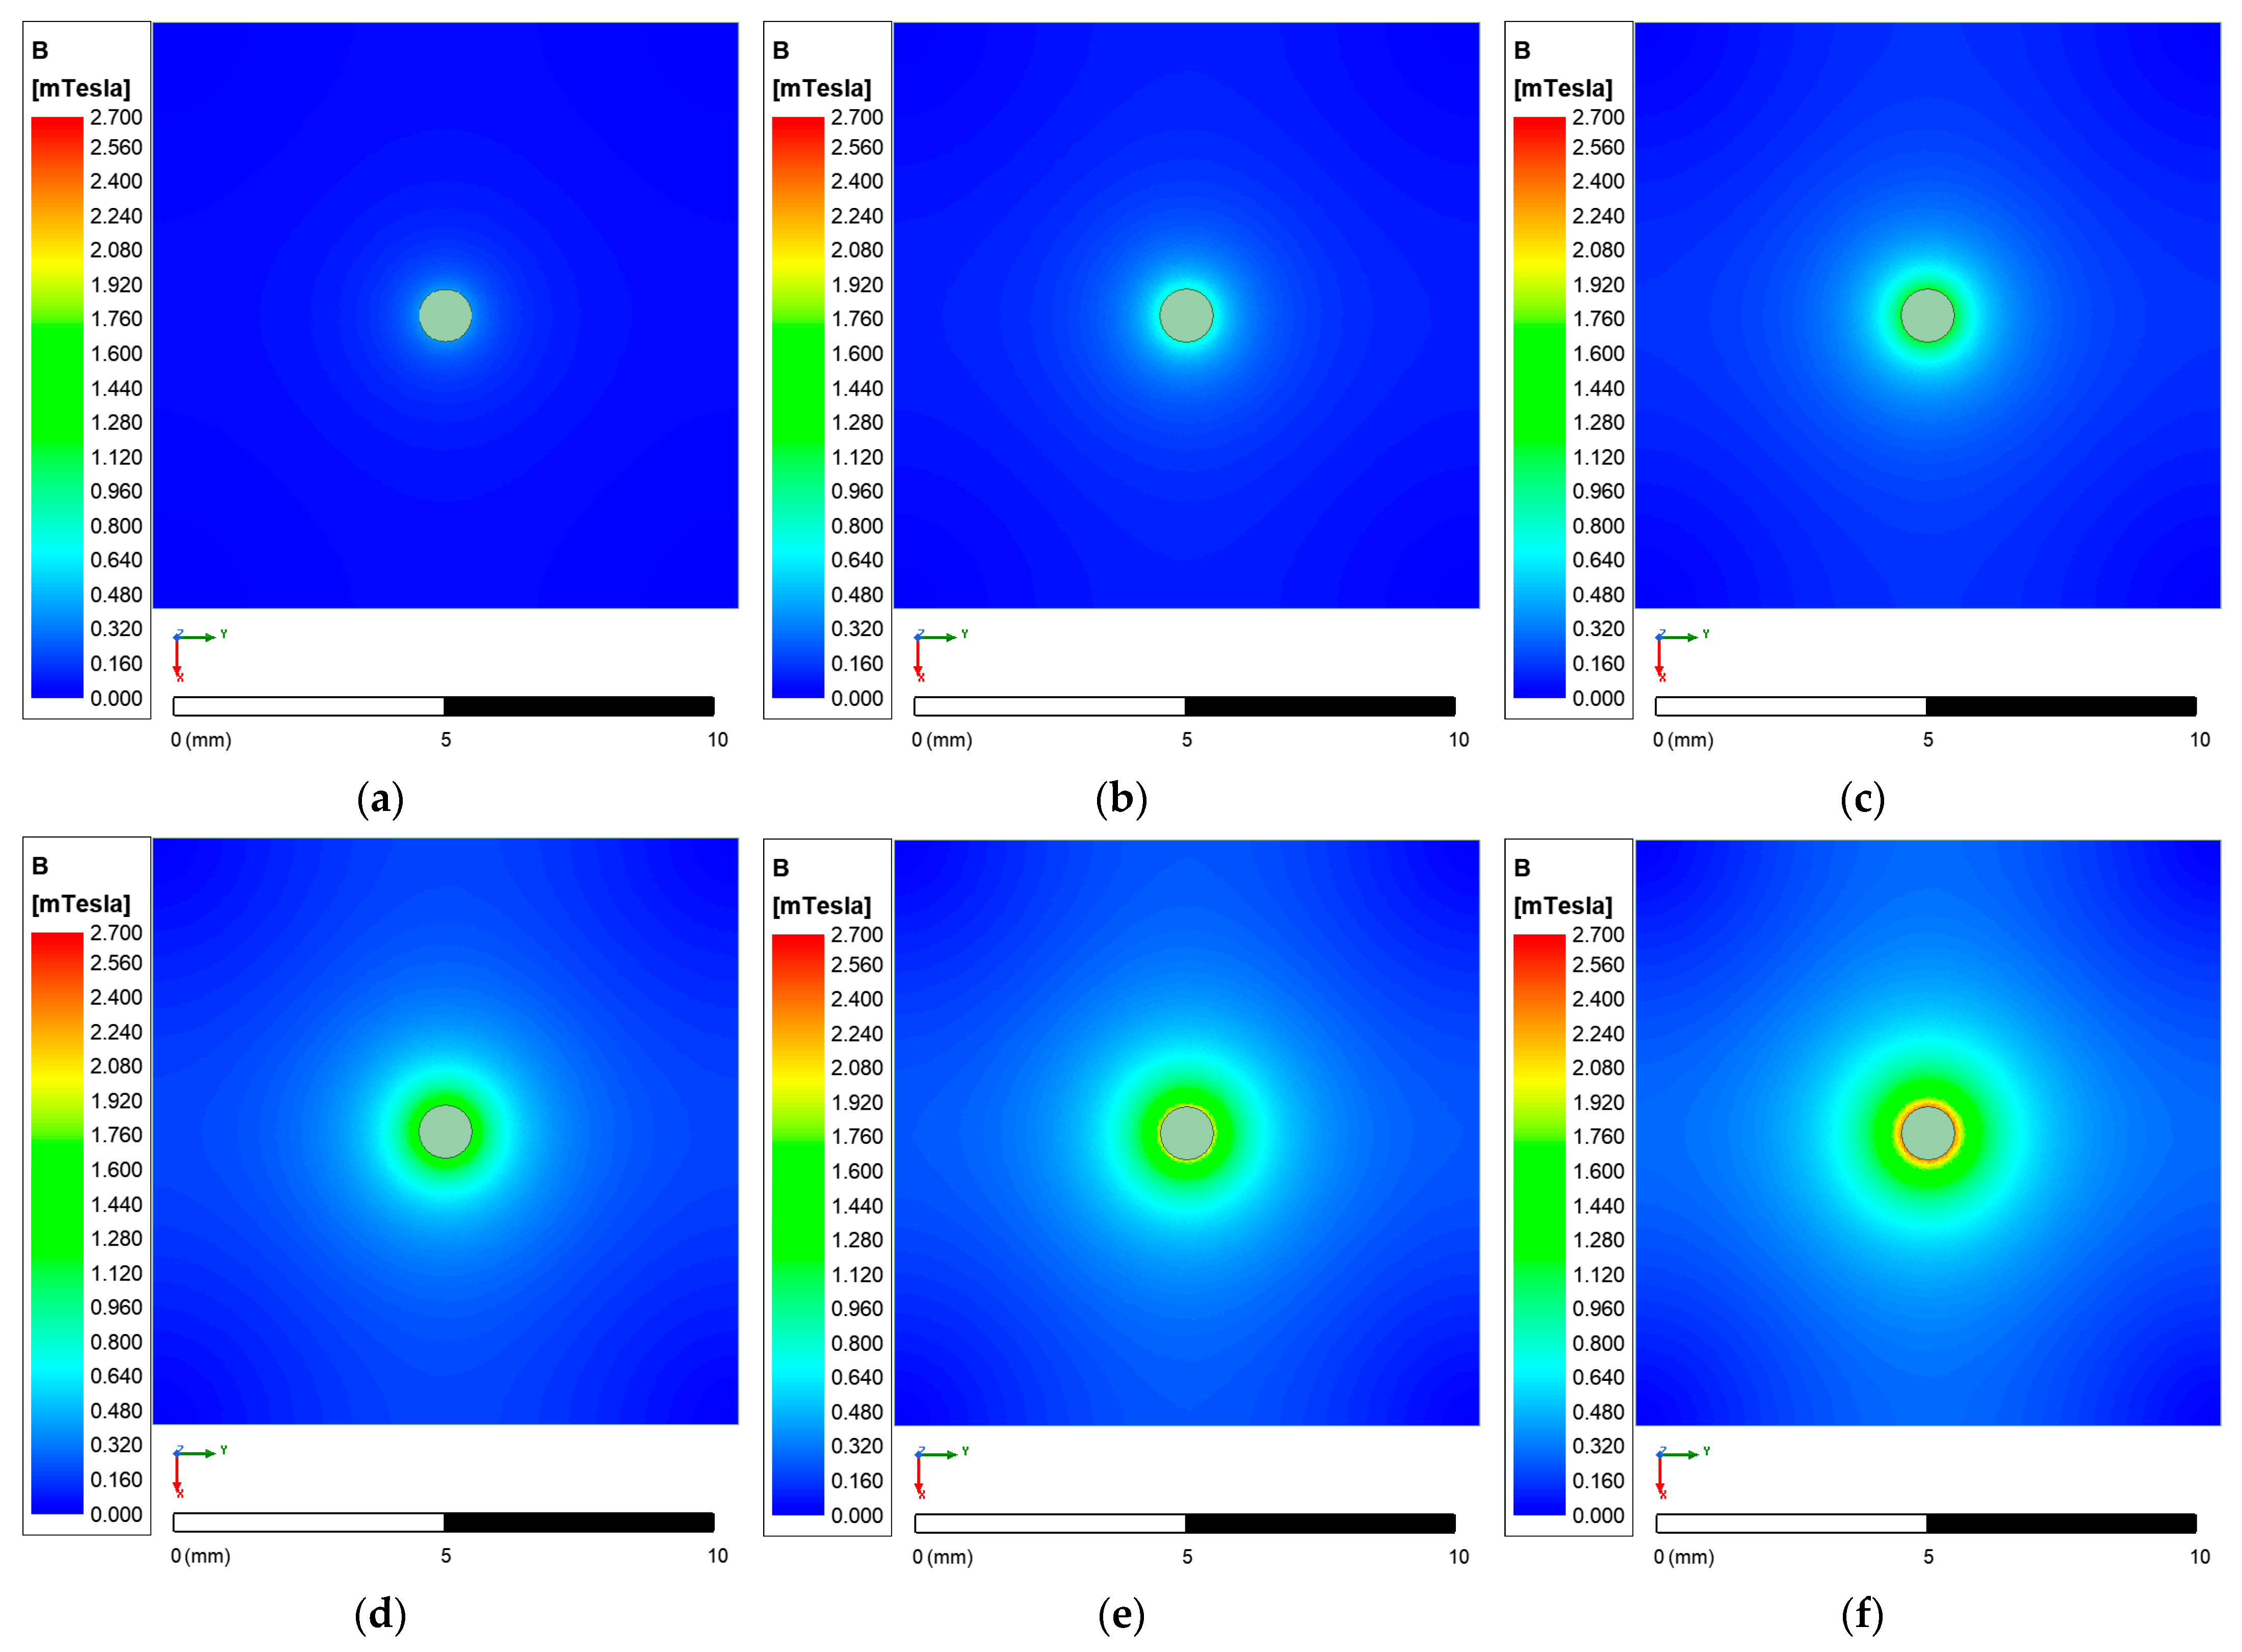
According to the simulation results in
Figure 5 and
Figure 6, the size and direction of this magnetic field are not uniformly distributed, and are vulnerable to interference from the magnetic field generated by the internal energized conductor of the junction box and the external PV cells at work. This is not conducive to the direct detection of this magnetic field by magnetostrictive material.
2.4. Structure Design of Coil Connected in Series with the Diode
To increase the magnetic field strength generated by the current in the branch where the bypass diode is conducting and to distribute it more uniformly in a fixed direction, part of the conductor inside the branch is designed as a coil structure. The coil is densely winded so that the adjacent wire turns are closely spaced to reduce magnetization leakage after conduction. The coil of this structure is called the magnetic field coil.
Enameled copper wire is selected as the winding material. The winding length of the magnetic field coil is , the inner radius is , the diameter of the enameled wire is , the diameter of the winding copper core is , the cross-sectional area of the winding copper core is , the thickness of the lacquer coating is , and the maximum number of winding layers is .
According to the maximum safe load current
of copper, the short-circuit current 5.85 A of the PV module is chosen as the maximum on-state current
of the branch where the coil is located, and the maximum cross-sectional area of the copper core
is calculated as:
The corresponding minimum diameter of copper core
is:
When the bypass diode is conducted with the maximum value
, the minimum equivalent resistance of the diode
is calculated based on the on-state voltage
:
The forward conduction current–voltage curve of the 10A10MIC rectifier diode is shown in
Figure 7.
Based on the forward conduction current–voltage curve of the diode in
Figure 7, the parameters in Equation (27) are selected and calculated, as shown in
Table 3.
To reduce the impact of the magnetic field coil in the branch circuit due to voltage division on the protective effect of the diode, its maximum resistance value
should be much smaller than the minimum equivalent resistance value of the diode
. Thus, the following is satisfied:
According to the resistivity
of copper, the maximum winding length of the coil wire
is satisfied:
The number of each layer turns of the magnetic field coil winding can be calculated to be 1 and the perimeter of each layer can be calculated. The maximum value of the winding length
and the maximum number of winding layers
satisfy:
According to the above calculation process, the winding length
limits the structure of the magnetic field coil, and the selection and calculation results of the parameters in relation to the magnetic field coil are shown in
Table 4.
According to the parameters of
Table 4, the maximum number of winding layers
is calculated in correspondence to the number of each layer turns. In the ANSYS finite element simulation software, the physical models are built sequentially, and 5.41 A is selected as the magnetic field coil conduction current
to characterize the operating current.
The maximum value of magnetic induction intensity
at the position of the magnetic field coil central axis is recorded, according to the magnetic field simulation results. According to the calculation and simulation results, the corresponding curve between the maximum value of magnetic induction intensity
and the serial number of structures of magnetic field coil is shown in
Figure 8.
The specific numerical correspondence between the maximum value of magnetic induction intensity
, the serial number of the structure, the total turns, and the number of each layer turns is shown in
Table 5.
According to the simulation results, it can be seen that the maximum value of magnetic induction intensity generated at the position of the magnetic field coil central axis is the largest when the on-state current is the same and the 5th winding structures of 3 turns in layer 1, 2 turns in layer 2, and 1 turn in layer 3 are used. Based on this winding structure, experiments are carried out to verify the method used in this paper.


