Article

Influence of Pre-Chamber Volume, Orifice Diameter and Orifice Number on Performance of Pre-Chamber SI Engine—An Experimental and Numerical Study

Faculty of Mechanical Engineering and Naval Architecture, University of Zagreb, Ivana Lučića 5, 10002 Zagreb, Croatia
*
Author to whom correspondence should be addressed.
Energies 2023, 16(6), 2884; https://doi.org/10.3390/en16062884
Submission received: 1 March 2023 / Revised: 13 March 2023 / Accepted: 16 March 2023 / Published: 21 March 2023
(This article belongs to the Special Issue Advances in Sustainable Propulsion Systems)

Abstract

:
This paper presented an experimental and numerical study of pre-chamber volume, number of orifices and orifice diameter influence on engine performance and emissions. All the measurements were performed on a single cylinder test engine at fixed engine speed of 1600 rpm, while engine load was varied by a change of the excess air ratio in the main chamber from a stochiometric mixture to a lean limit. The total of nine pre-chamber variants comprised three different pre-chamber volumes, two orifice number combinations (six and four orifices) and nine different orifice diameters. It was observed that the pre-chamber volume affects the indicated efficiency in a trend which is mostly independent of excess air ratio, with the efficiency gain between the best and worst results ranging from 1 to 4.4%. While keeping the same pre-chamber volume and the total cross-sectional area of the orifices, the larger number of orifices show better performance on two out of three investigated pre-chamber volumes, with the efficiency gains more pronounced at higher excess air ratios. Finally, on a fixed pre-chamber volume and number of orifices, the variation of orifice diameter leads to a trend in efficiency gains which favor larger orifice diameter. The comparison of the obtained efficiencies between all pre-chamber variants identified two pre-chambers, differing in each of the varied geometrical parameters, that show the best performance depending on excess air ratio range. On the other hand, a single variant which showed the worst performance on each excess ratio was identified. An additional investigation was performed by the application of the cycle-simulation model to quantify the share of emissions which are formed in the pre-chamber. The presented results showed that when PC volume is lowered, PC emission shares of NOX and CO grow larger. The influence of orifice number and size has a minor effect on the pre-chamber emissions shares. The maximum PC emission shares of 54.8% and 80.6% are achieved at lean limit (λ = 2.2) for NOX and CO, respectively. THC emission share, on the other hand, is not affected in a significant manner by either the pre-chamber geometry or operating conditions.

1. Introduction

Pre-chamber spark ignited engines attract a lot of research attention since they represent lean burn combustion that can increase engine efficiency (CO2 reduction), significantly reduce nitrogen oxides (NOx) emissions and can be easily integrated into existing spark ignited engine architectures [1,2,3,4,5,6]. Due to the high ignition energy released by the combustion process in a pre-chamber volume, the lean mixtures in the main chamber can be successfully ignited by strong jets of combustion products that flow through the specific number of orifices. The amount of released energy in the pre-chamber and pre-chamber geometry parameters (such as volume, orifice number, orifice diameter, etc.) affect the ignition and combustion progress in the main chamber and consequently influence the overall engine performance [3,7,8,9,10].
The comparison of engine performance achieved with a conventional spark ignition and with application of the active pre-chamber showed that a fuel economy improvement of 18% can be reached [1] due to operation with lean mixtures. Such a lean burn concept is often also complemented by the usage of alternative fuels. Similar to the conventional SI engines [11], the combustion characteristics in a pre-chamber spark ignition engine are affected by the fuel used [12,13]. It was shown that the lean limit significantly depends on the fuel type used for main chamber due to different minimum ignition energies. The combustion characteristics in a pre-chamber spark ignition engine using different fuels were investigated in [12,13] The active pre-chamber with an injection of gaseous methane was applied ensuring 13% of total supplied fuel energy. With the same pre-chamber geometry, it was found that the lean limit for methane is λ = 2.3 and for a primary reference fuel (PRF) is λ = 3.0, while the maximum value of λ = 3.2 was reached for methanol. Active pre-chambers can significantly extend the lean limit compared to passive pre-chambers [14] due to the higher ignition energy transferred to the main chamber. It was observed that a larger pre-chamber volume increased lean limit and shortened combustion duration, while the change of nozzle diameter with fixed pre-chamber volume mainly affected combustion duration with minor effect on NOX emissions [7]. An experimental study of different passive pre-chamber volumes was presented in [14]. The pre-chamber, with 3.8% of the main combustion chamber volume, showed the best option among the evaluated volumes, with reductions in around 13% of total hydrocarbons (THC) and nitrogen oxides (NOx) emissions. The influence of three different orifice diameters on constant pre-chamber volume with six orifices in an active pre-chamber engine fueled by natural gas on engine performance was experimentally investigated in [15]. It was shown that the best gross indicated efficiency of 44% can be achieved with the main chamber air excess ratio equal to 2.0 and an orifice diameter of 1.6 mm, while the lowest NOx emissions are achieved with an orifice diameter of 1.4 mm. It was suggested that, for a small size spark ignition engine to achieve best performance and emission results, an optimal pre-chamber volume is 2–3% with an orifice area of 0.003 to 0.004 mm−1 and a length to diameter ratio of the orifice of 0.5 [8,9,10]. In [3,4], in addition to volume ratio, orifice area and orifice number, the influence of orifice position and orifice-initiated swirl on engine performance and emissions was also investigated. In [3], with the introduction of orifice-induced swirl had a positive effect on combustion stability and PN and THC emissions, but an excess air ratio of 1.8 with the normal non-swirl six orifice pre-chamber system yielded the highest indicated efficiency of 40.2%. In the study presented in [4], the highest indicated efficiencies were achieved at an excess air ratio of 2.7 with an orifice cap with six orifices and, similarly to [3] orifice-inducing swirl cap version did not yield better performance and emission data. The influence of temperature conditions in the main chamber was studied in [16]. It was concluded that under high temperature conditions in the main chamber, the spherical flame propagation will occur rather than the development of a normal jet flame typical for pre-chamber combustion. The mentioned phenomenon induced more stable combustion behavior.
The literature overview indicates the lack of studies related to the analysis of PC emissions and contribution of PC emission in overall exhaust gas emission. The experimental study of NOX emissions generated in the PC was presented in [17] on an industrial gas engine. It was shown that PC injection pressure significantly affects NOX concentration (expressed in ppm) in PC volumes exceeding the overall engine concentration of NOX. If the measured results are recalculated on mass basis and on the overall exhaust mass flow, the PC NOX emissions are responsible for 75% of total engine out NOX emissions. The application of 1D/0D simulation model for the analysis of NOX emissions from PC was presented in [18]. The model was calibrated on the overall engine out emissions and NOX mass transfer from PC to main chamber was used to quantify the contribution of PC combustion on total NOX emissions. For exhaust air excess ratios (λ) below 1.8 it was found that PC NOX share is up to 10%, while at lean limits (λ > 2.3) PC NOX share can reach maximum values of 83%. The main novelty in this study represents the upgrade of emission sub-models of 1D/0D simulation and its application to numerically quantify the PC emission share in total exhaust gas emissions. The applied combustion and turbulence model were already presented in our previous study [19] in finding the optimal PC geometry and injected fuel mass in PC in terms of best indicated efficiency, but exhaust gas emissions were not considered. The numerical results indicated that the pre-chamber NOX and CO emissions share is significantly affected by pre-chamber geometry and excess air ratios, while the pre-chamber THC emission share is almost independent of the modification of pre-chamber geometry and engine operating parameters.
In the experimental part of study, the influence of nine different pre-chamber designs on engine efficiency, combustion stability, emissions, and lean limit was investigated. Compared to our previous experimental study published in [20] where only three PC designs (6 orifices) with different volumes were investigated, this study included variations of the orifice numbers, diameters and volumes, providing insights of those parameters on engine performance and emissions. Depending on the desired engine performance and emissions, different pre-chamber designs can be adopted to maximize engine efficiency or to minimize the specific raw emissions of NOX, THC and CO.

2. Methodology

The presented study is a combined experimental and numerical study with the aim of evaluating the influence of pre-chamber geometry parameters on engine performance and emissions. In the experimental part of the study, measurements of in-cylinder pressure, intake and exhaust manifold pressure and temperature, air and fuel flow and emission measurements (THC, CO, NOX) were performed on the experimental pre-chamber spark-ignited engine at the Laboratory of Internal Combustion Engines and Motor Vehicles at the Faculty of Mechanical Engineering and Naval Architecture at the University of Zagreb. The measurements were conducted with various pre-chamber variants with varying geometry features and at various loads achieved with modification of exhaust excess air ratio (λ). For each level of exhaust air excess ratio, the spark sweeps were imposed to capture the operating point with the best-indicated efficiency or best efficiency limited by imposed thresholds of combustion stability and knock combustion, as illustrated in Figure 1.
The combustion stability limit was set with coefficient of variation of indicated mean effective pressure (CoV IMEP) to 5% [12], while the engine operation with knock combustion was detected when more than 5% of cycles with maximum amplitude of pressure oscillation (MAPO) is higher than 1 bar [21,22]. Each pre-chamber geometry knock criterion was met at stoichiometric mixture, while unstable combustion directly defined the lean operation limits.
To quantify the effect of pre-chamber combustion and consequently emissions share from pre-chamber to main chamber, a numerical study was performed with a 1D/0D simulation model on several pre-chamber variants. The experimental and numerical study are further elaborated in the following subsections.

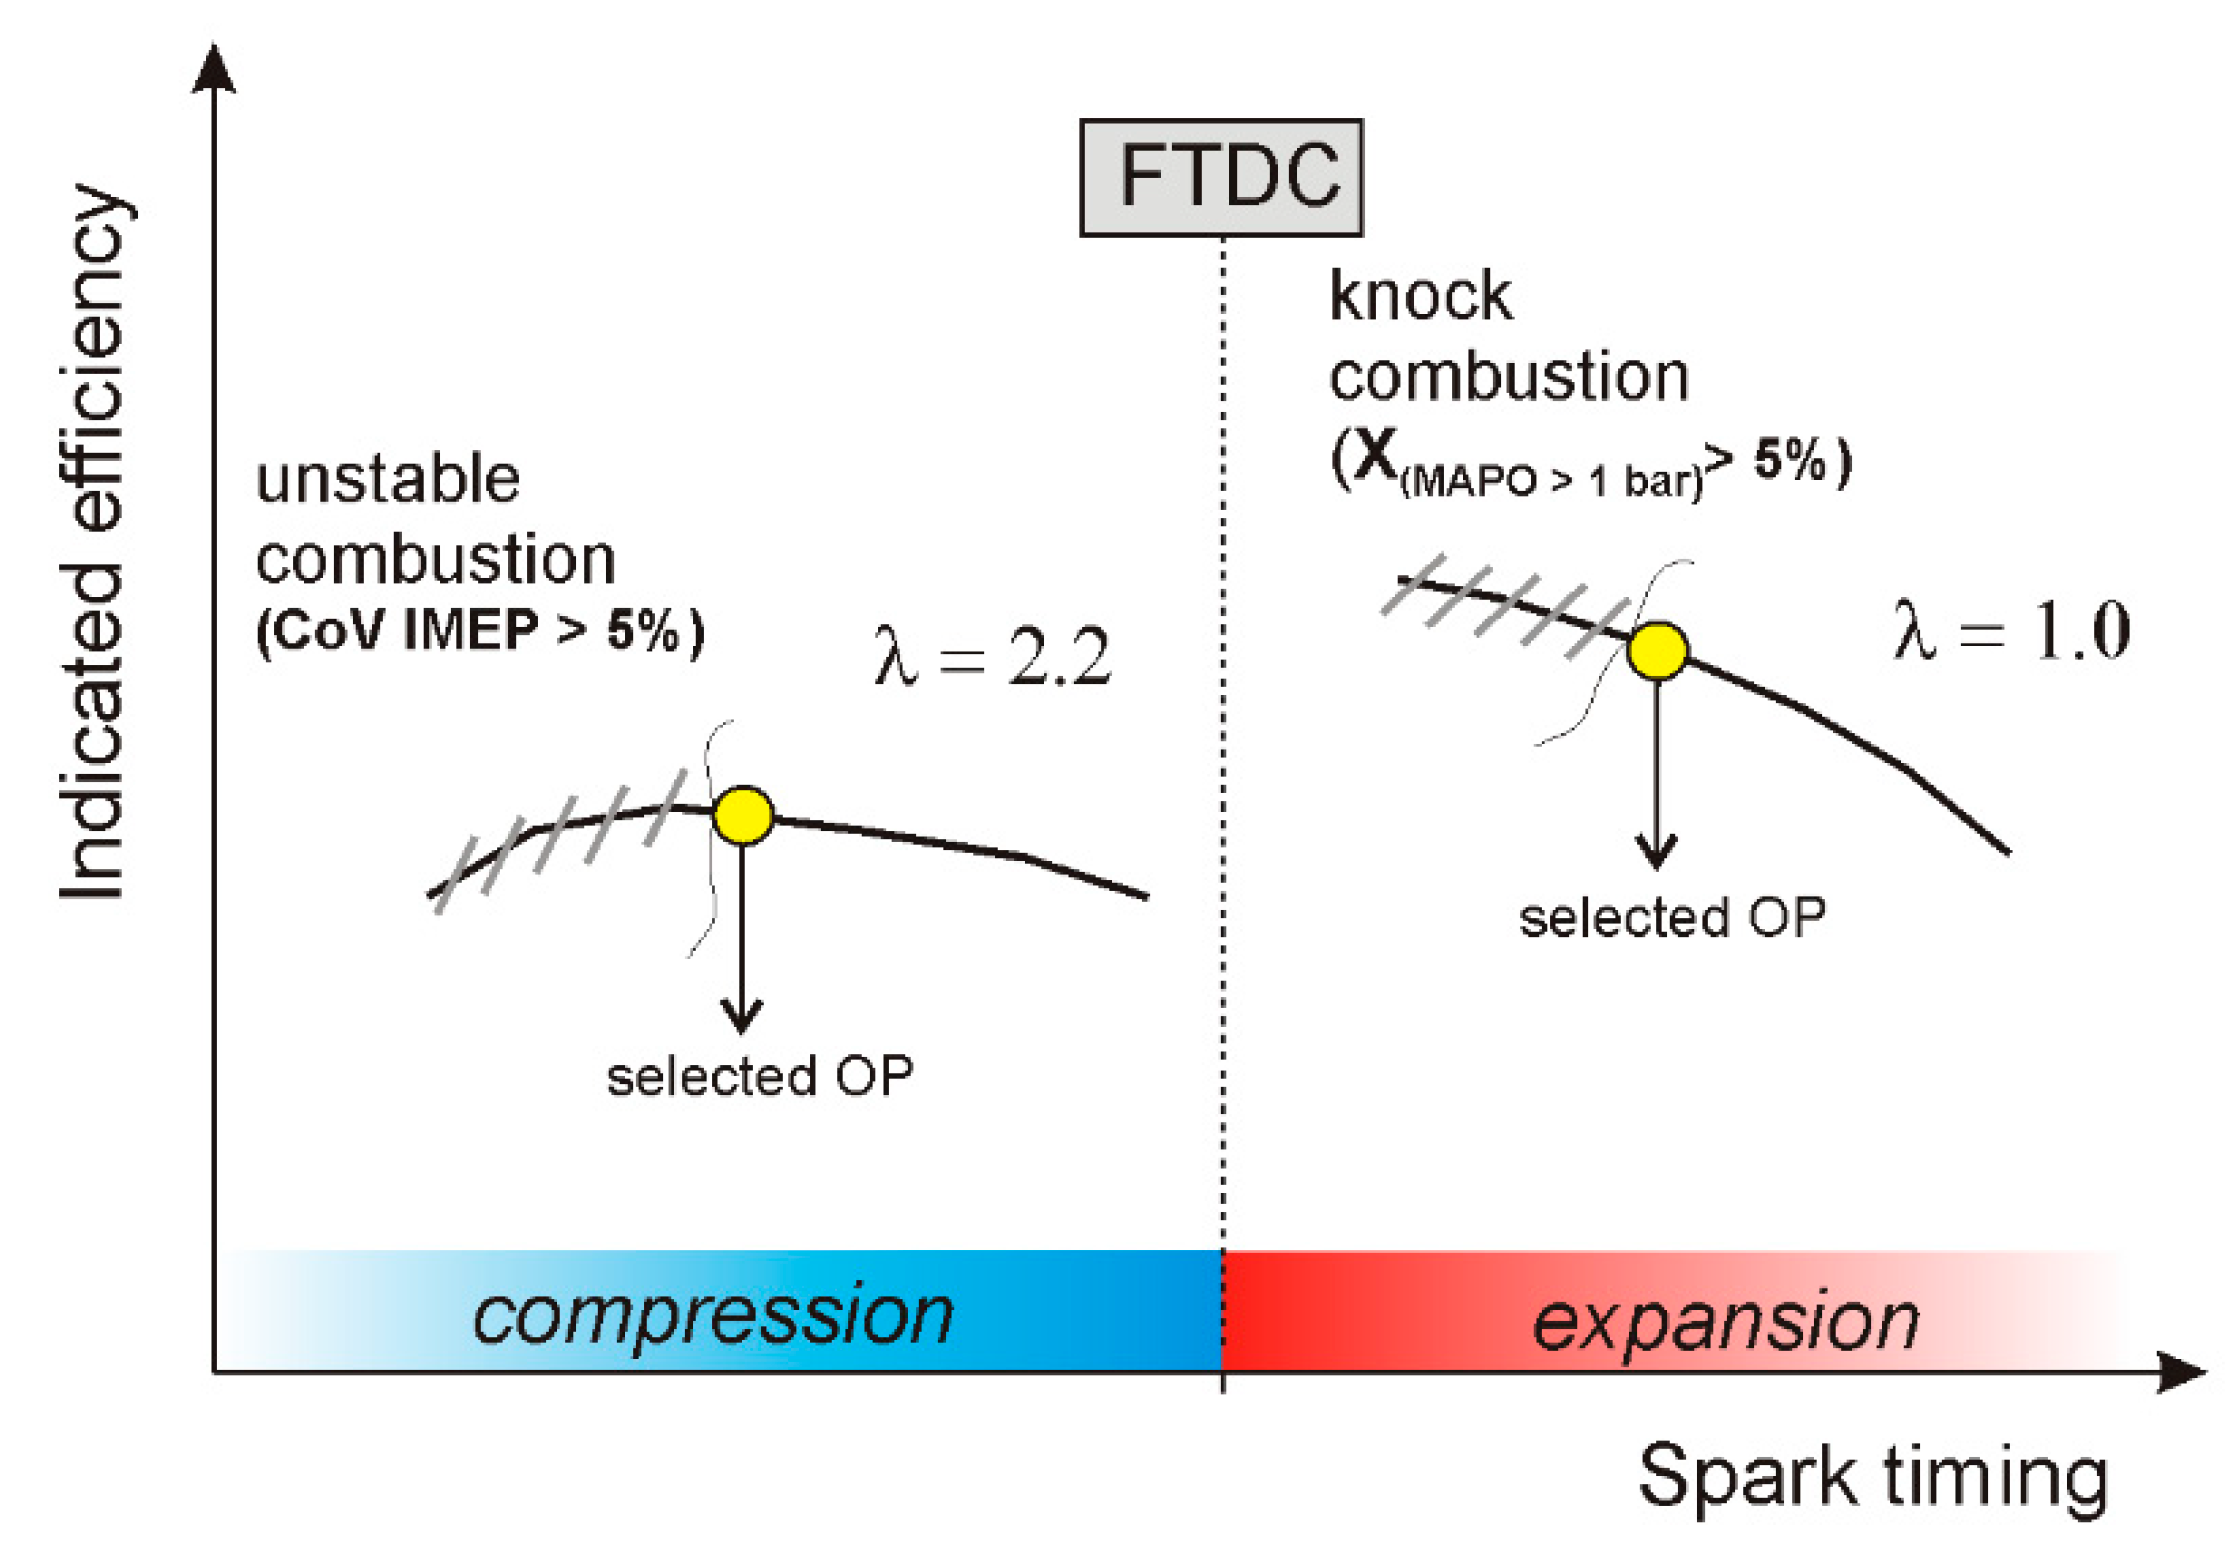
2.1. Experimental Study

The experiments were performed on nine different pre-chamber variants which varied in volume, number of orifice and orifice diameter. The overview of used pre-chamber variants and related specific parameters of pre-chambers are listed in Table 1.
The first three pre-chamber variants (IN, V1 and V2) that have six orifices represent the variation of pre-chamber volume (VR) with a fixed orifice area to volume ratio (OA). The following three pre-chamber variants (V3, V4 and V5) utilize the same variation of pre-chamber volume and fixed OA but with four orifices. Due to design limits, the variation of orifice diameter from 1.00 to 2.50 mm was made at constant pre-chamber volume equal to 3.27% of compression volume with four orifices, resulting with variations of orifice area to volume ratio (OA) equal to 0.002 mm−1 (V6), 0.007 mm−1 (V7) and 0.010 mm−1 (V8).
The engine performance (indicated efficiency, IMEP, CoV IMEP, knock occurrence) and exhaust gas emissions (NOX, THC and CO) achieved with each pre-chamber variant were analyzed and compared.
The measurements were conducted at constant engine speed fixed to 1600 rpm, as the engine speed which results in the highest delivery ratio, with wide open throttle (WOT) conditions. Since the testbed room was not equipped with an air conditioning system, the temperature of intake air was set to 33 °C by using intake air heater. Therefore, the variations of testbed conditions for different measurements performed over different periods (days) were reduced to the minimum level. The injection pressure, phase and duration for pre-chamber were kept constant while the variation of exhaust air excess ratio was made with the modification of injection duration at port fuel injector. For each pre-chamber variant, the levels of exhaust air excess ratio analyzed in this study were set to 1.0, 1.4, 1.6, 1.8, 2.0 and 2.2, as specified in Table 2. For each excess air ratio, the spark timings were varied to capture the operation with the maximum indicated efficiency or were limited due to the occurrence of knock combustion at mixtures near stochiometric conditions (λ = 1.0 and λ = 1.4). On the other hand, the combustion stability limit defined with the coefficient of variation of indicated mean effective pressure (CoV IMEP ≤ 5%) defined the lean limit operation.
It was expected that different engine speeds would mostly affect the imposed operating parameters due to physical phenomena which are time dependent. Hence the scavenging and mixture formation in the PC would be affected with direct impact on the combustion stability (lean limit) which would require modification of PC fueling and spark timing. Although this study was performed at a fixed engine speed, the authors strongly believe that extending the investigations on different engine speeds would not affect the conclusions and fulfillment of the objective in any significant way.

2.2. Numerical Study

For the selected pre-chamber geometries, simulations of operating points with different exhaust air excess ratios were performed. The simulation models were made in an upgraded version of a pre-chamber combustion model in AVL Boost™ that is based on 1D/0D approach, already presented within a previous study [23,24].
The calibration of the simulation model was defined in the following steps. First, the boundary conditions such as intake temperature and fuel vapor concentration at intake system boundary were adopted to achieve an agreement of measured and simulated fuel flow (caused by port fuel injection) with accuracy of ±2%. In the second step, the calibration of combustion model parameters for pre-chamber and main chamber were performed to achieve the agreement of pressure traces close to experimental data of pressure traces (averaged over 300 consecutive cycles) considering the peak pressures and positions of peak pressures. As a result, the differences between experimentally defined and simulated IMEP were achieved in the range of ±5%. Once the calibration of combustion model was made, the emission sub-models for NOx, THC and CO were calibrated so that the difference between the measured and simulated emissions were within the accuracies of exhaust gas analyzers. Since the calibration constants of emission sub-models were the same for the pre-chamber and main chamber volume for each operating point, the influence of pre-chamber emission share to total exhaust gas emission can be calculated with the upgraded emission models. Calibration results of exhaust gas emissions and pre-chamber emission shares of NOx, THC and CO were compared for different pre-chamber geometries.

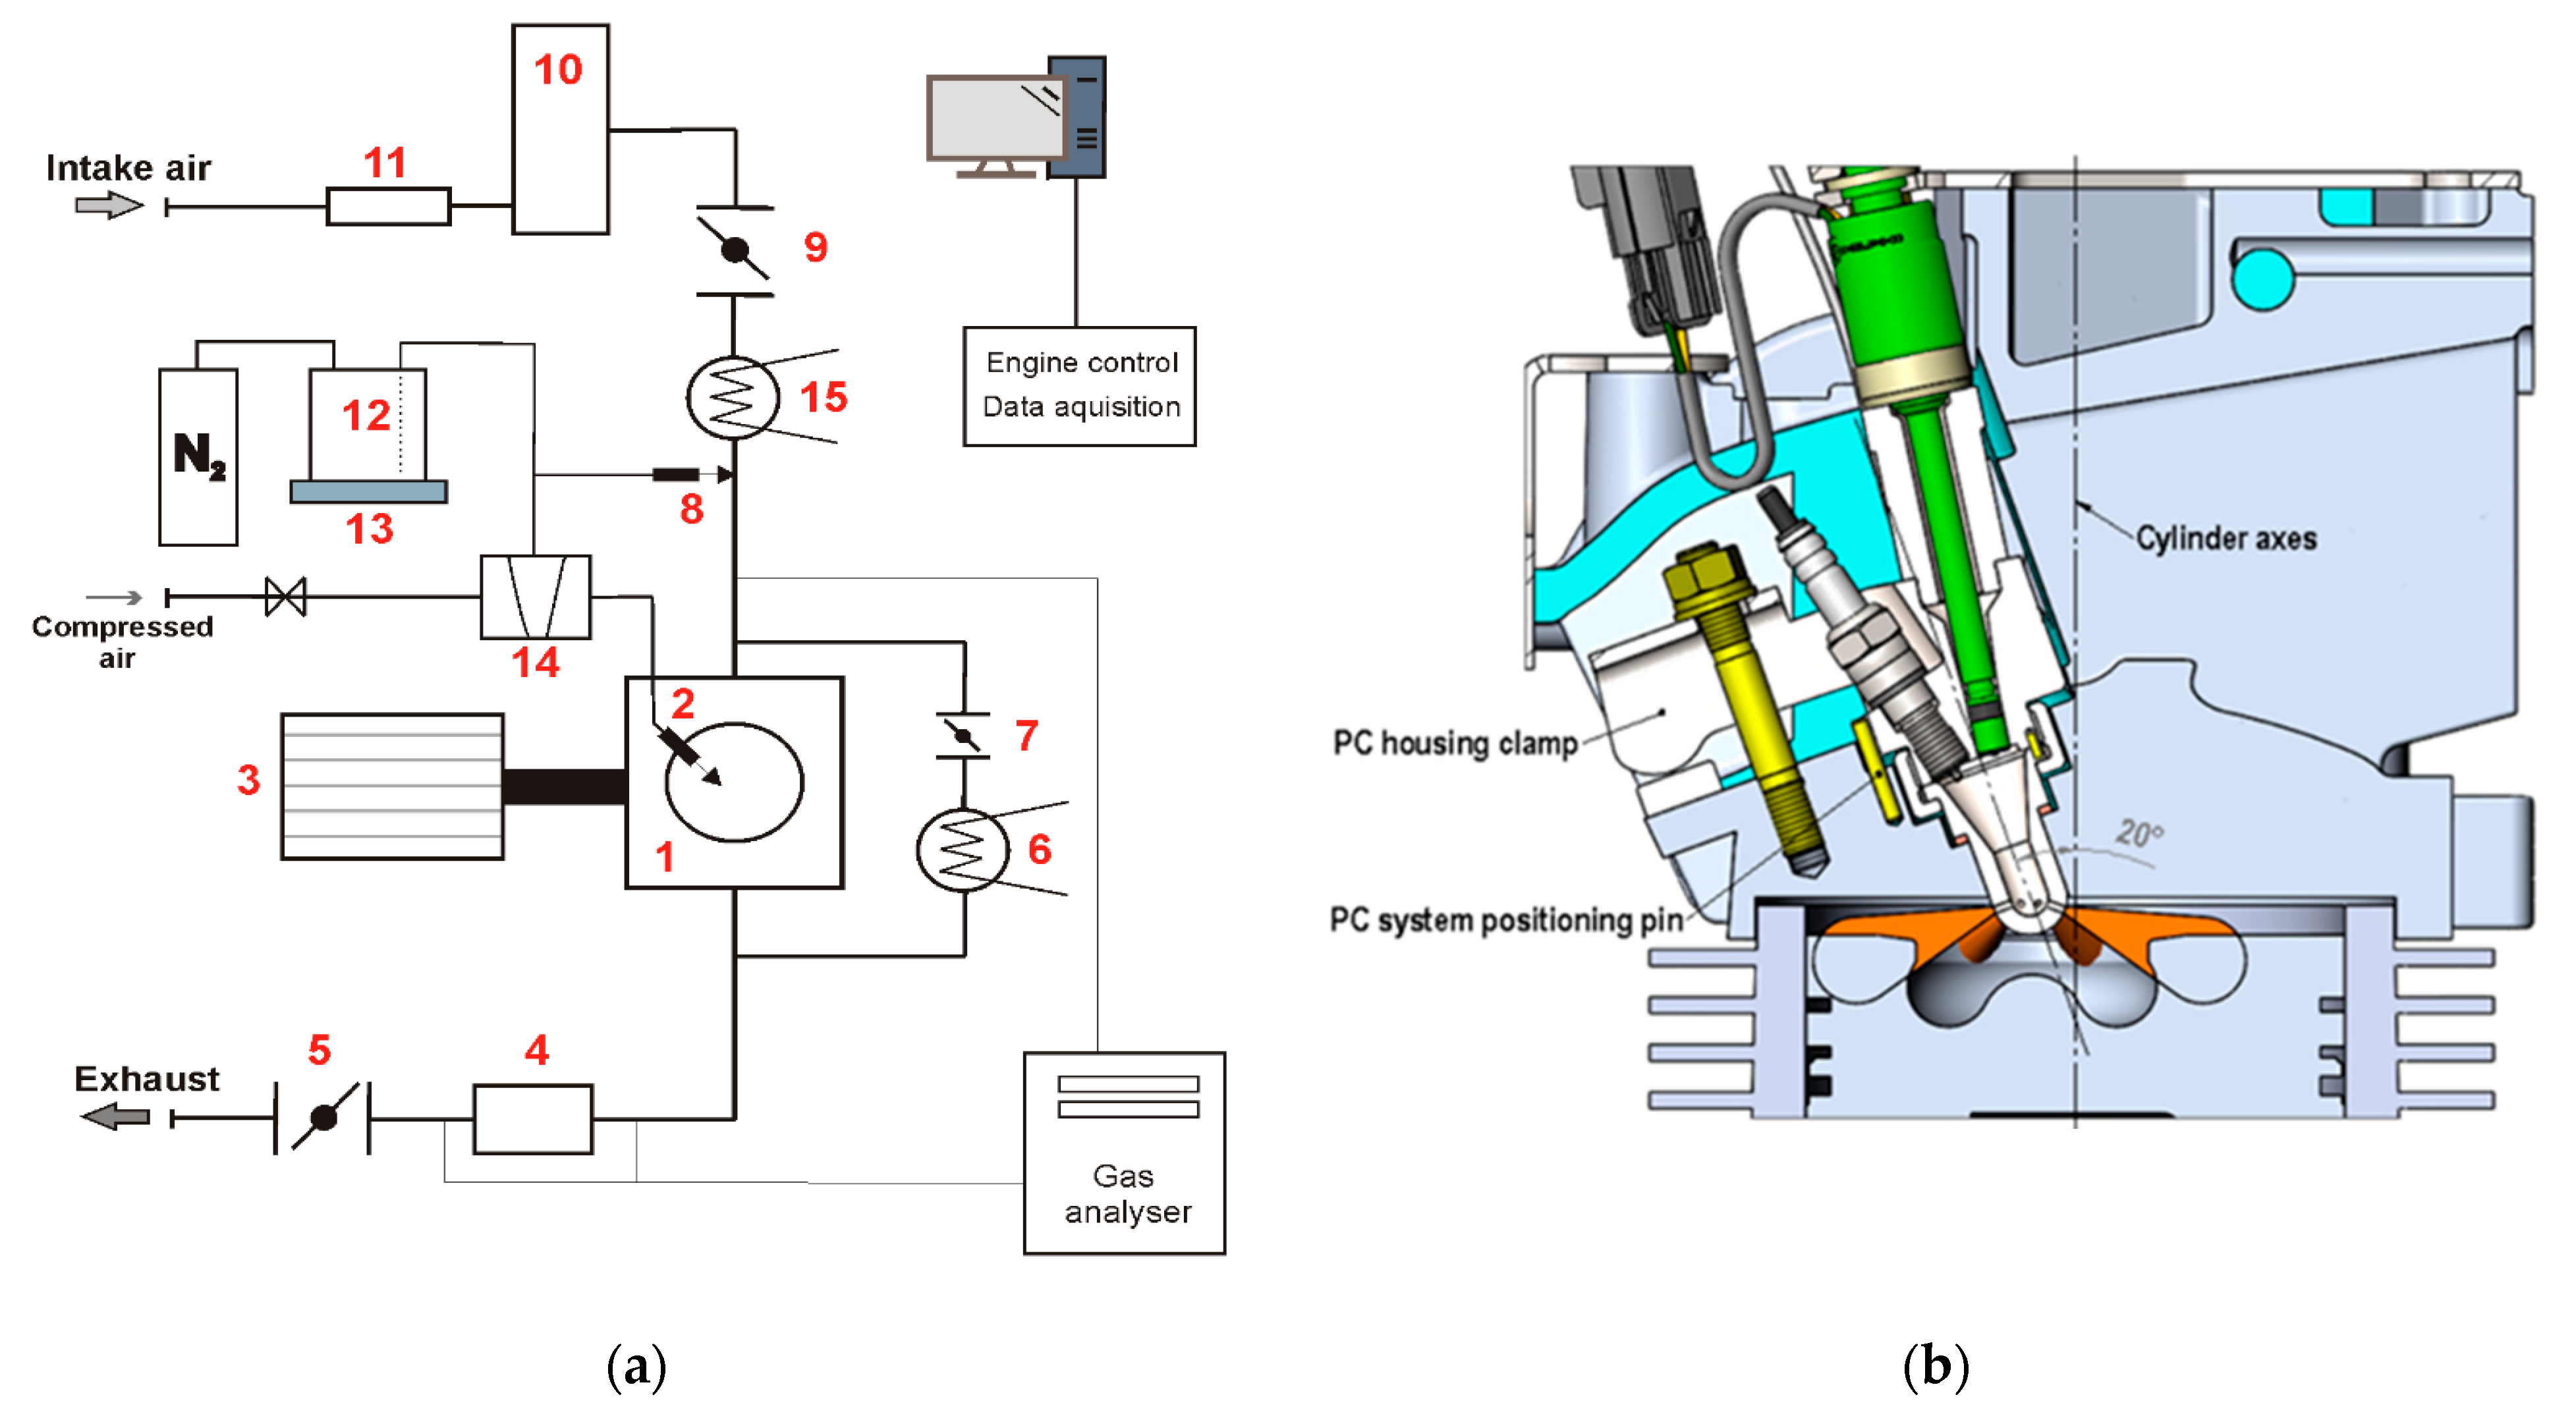
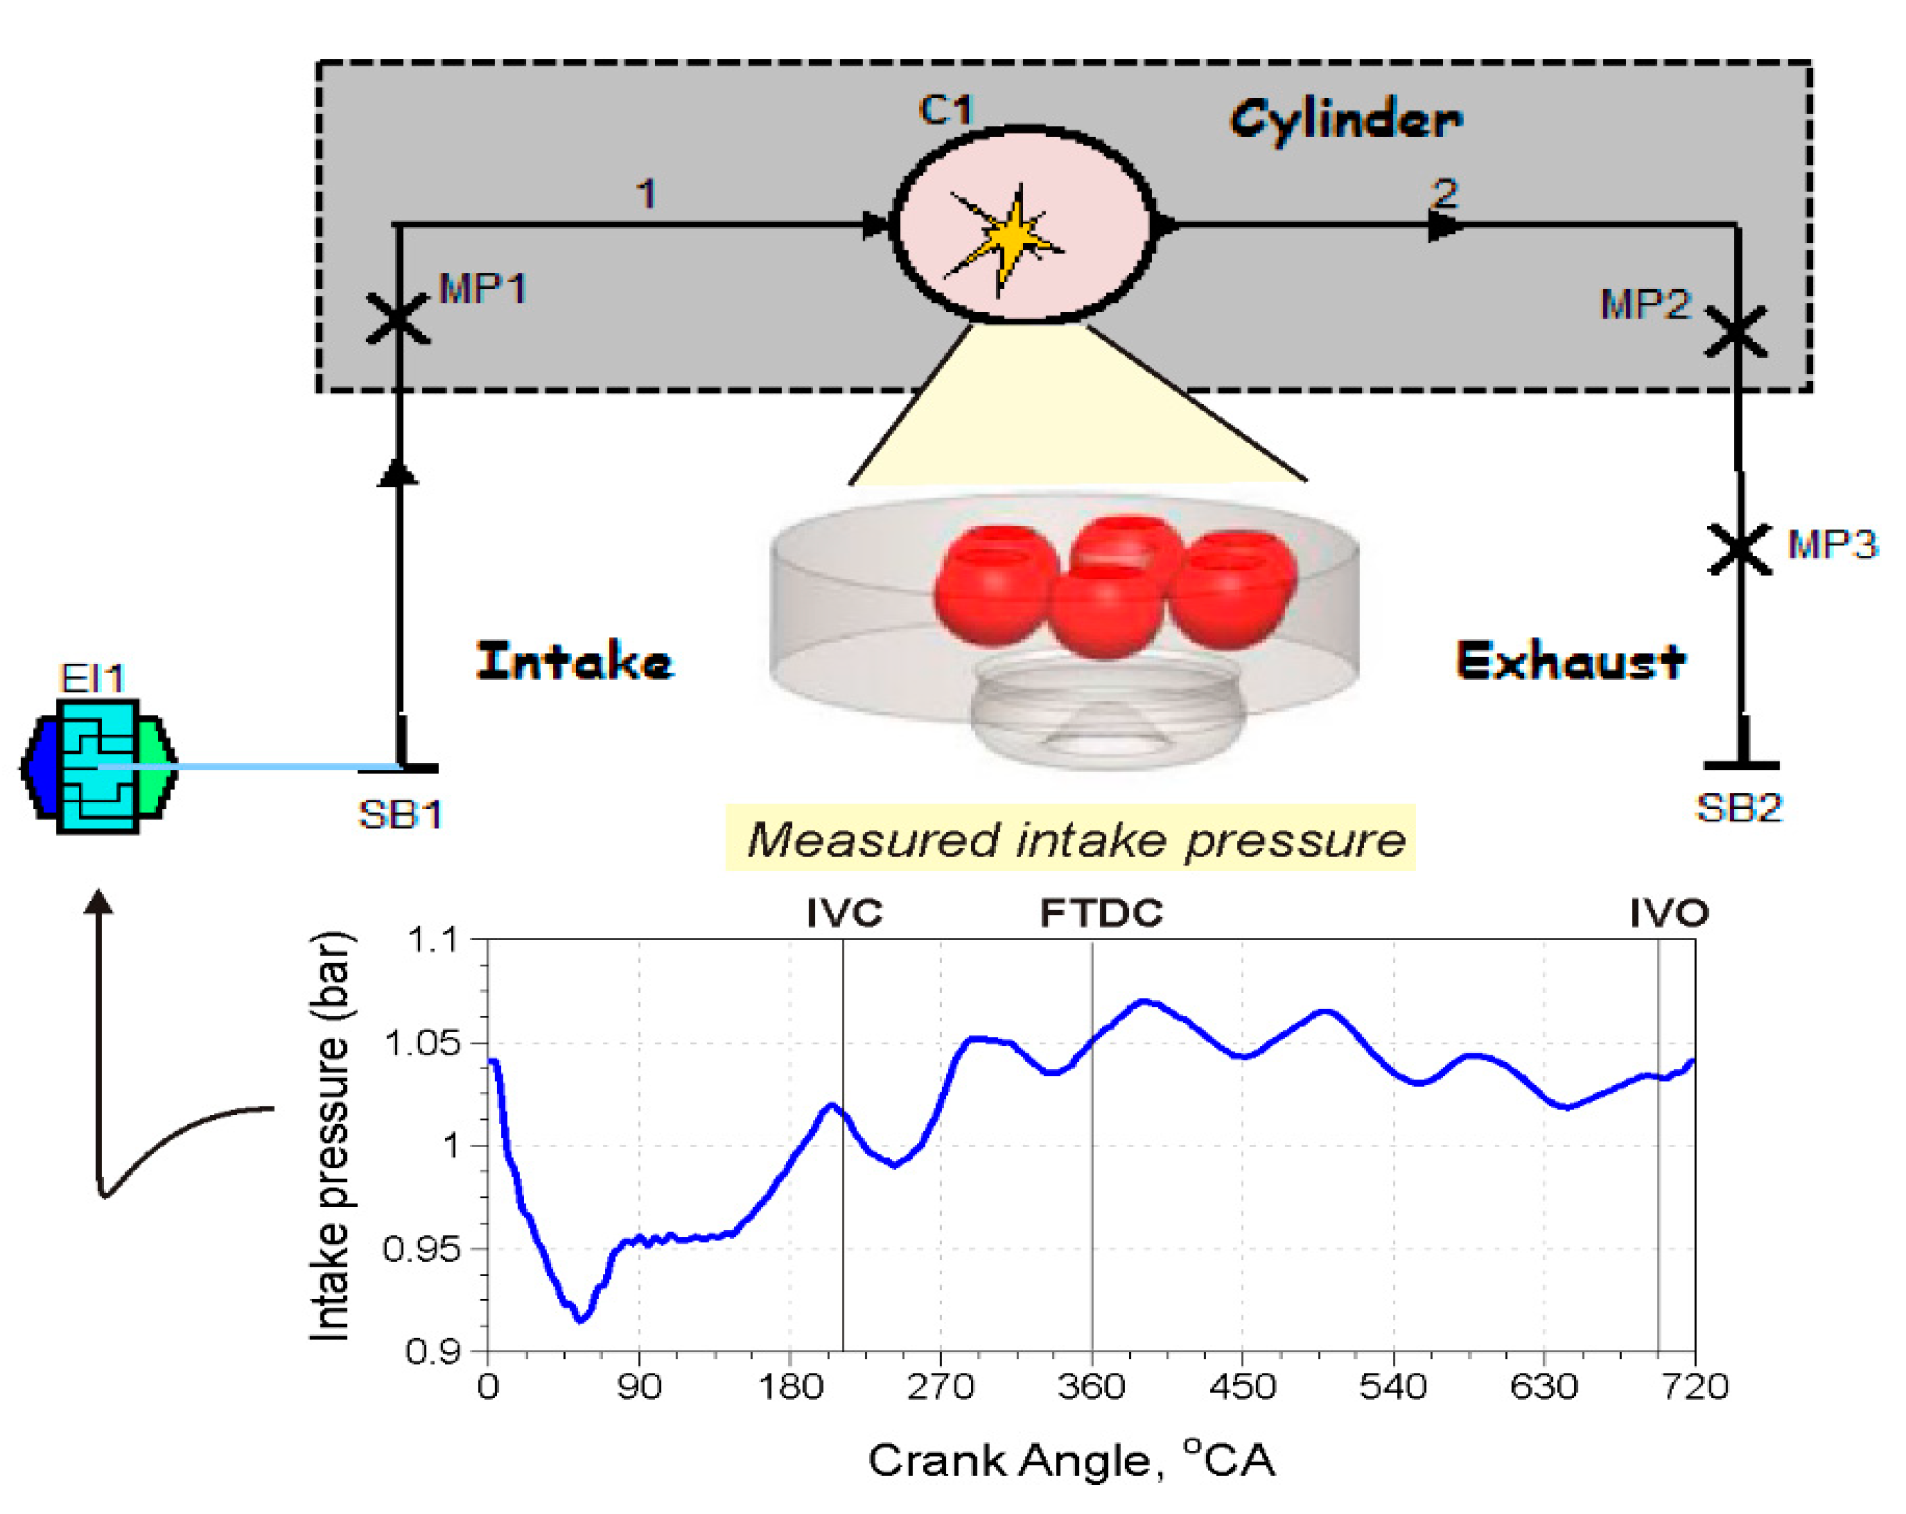
3. Experimental Setup

All the measurements for this study were conducted on the experimental setup at the Laboratory of IC Engines and Motor Vehicles of the Faculty of Mechanical Engineering and Naval Architecture at the University of Zagreb. The testbed is equipped with AC dynamometer with maximum brake power of 30 kW at 4000 rpm. The test engine is a highly modified single cylinder Hatz 1D81Z engine. Specifications of the engine are given in Table 3. For the ongoing investigations, the engine has a pre-chamber spark ignition setup. It has a modified cylinder head which incorporates an in-house designed modular active pre-chamber assembly and a reduced compression ratio of 12.8 to avoid excessive knock combustion. The mixture in the pre-chamber and in the main chamber are prepared separately. The mixture in the main chamber is prepared via port fuel injection, while the pre-chamber assembly incorporates a dedicated low flow direct fuel injector, thus requiring a separate high pressure injection system.
The schematic layout of the experimental setup is given in Figure 2a.
The engine’s intake system is comprised of a laminar flow meter (11) with a measurement range from 60 to 6000 L/min with a full-scale accuracy of ±0.2%, 60L air tank (10) for pressure oscillation damping, electronically controlled valve as throttle body (9) and 18 kW air heater (15).
The fuel supply comprises of a high-pressure and low-pressure system. All systems are supplied from a common fuel tank pressurized to 4 bars with nitrogen. The low-pressure system supplies the fuel injector (8) for port injection. In the high-pressure system, the supplied fuel is pressurized in the air-driven Maximator S100 pump (14) and can be pressurized up to 1000 bar of constant pressure. The exhaust system is equipped with a catalytic converter housing (4) which allows the use of different catalytic converter types and an electronically controlled valve for backpressure adjustment (5). An exhaust gas recirculation (EGR) line connects the exhaust end intake line where the exhaust gas backflow can be regulated via the control valve (7) and its temperature via the water-cooled heat exchanger (6). The experimental setup can measure the in-cylinder pressure profile in the main chamber and pre-chamber via two AVL XH14DK pressure transducers and the AVL 365C angle encoder. The intake pressure profile is measured via AVL LP11DA absolute pressure sensor. Intake air temperature is measured in the intake manifold near the cylinder head. Fuel flow is measured by continuously measuring the fuel mass in the fuel tank (12) with a precise digital scale (accuracy of 0.1 g). Total fuel mass flow is derived from the change in mass over the sampling period. Fuel flow through the high-pressure fuel supply system is calculated from the high-pressure fuel injector spray time and injector flow characteristic. Exhaust pressure and temperature are measured in the exhaust manifold 100 mm from the cylinder head exhaust port.
Exhaust temperature is also measured at the catalyst housing inlet and outlet. The excess air ratio (λ) and NOX emissions are measured by ECM NOx 5210t device. THC emissions are measured with the Environnement Graphite 52M analyzer, while CO and CO2 are measured with Environnement MIR 2M. Specifications of the exhaust gas analyzers are given in Table 4. Exhaust sampling for emissions measurement was done at the catalyst housing inlet and outlet.

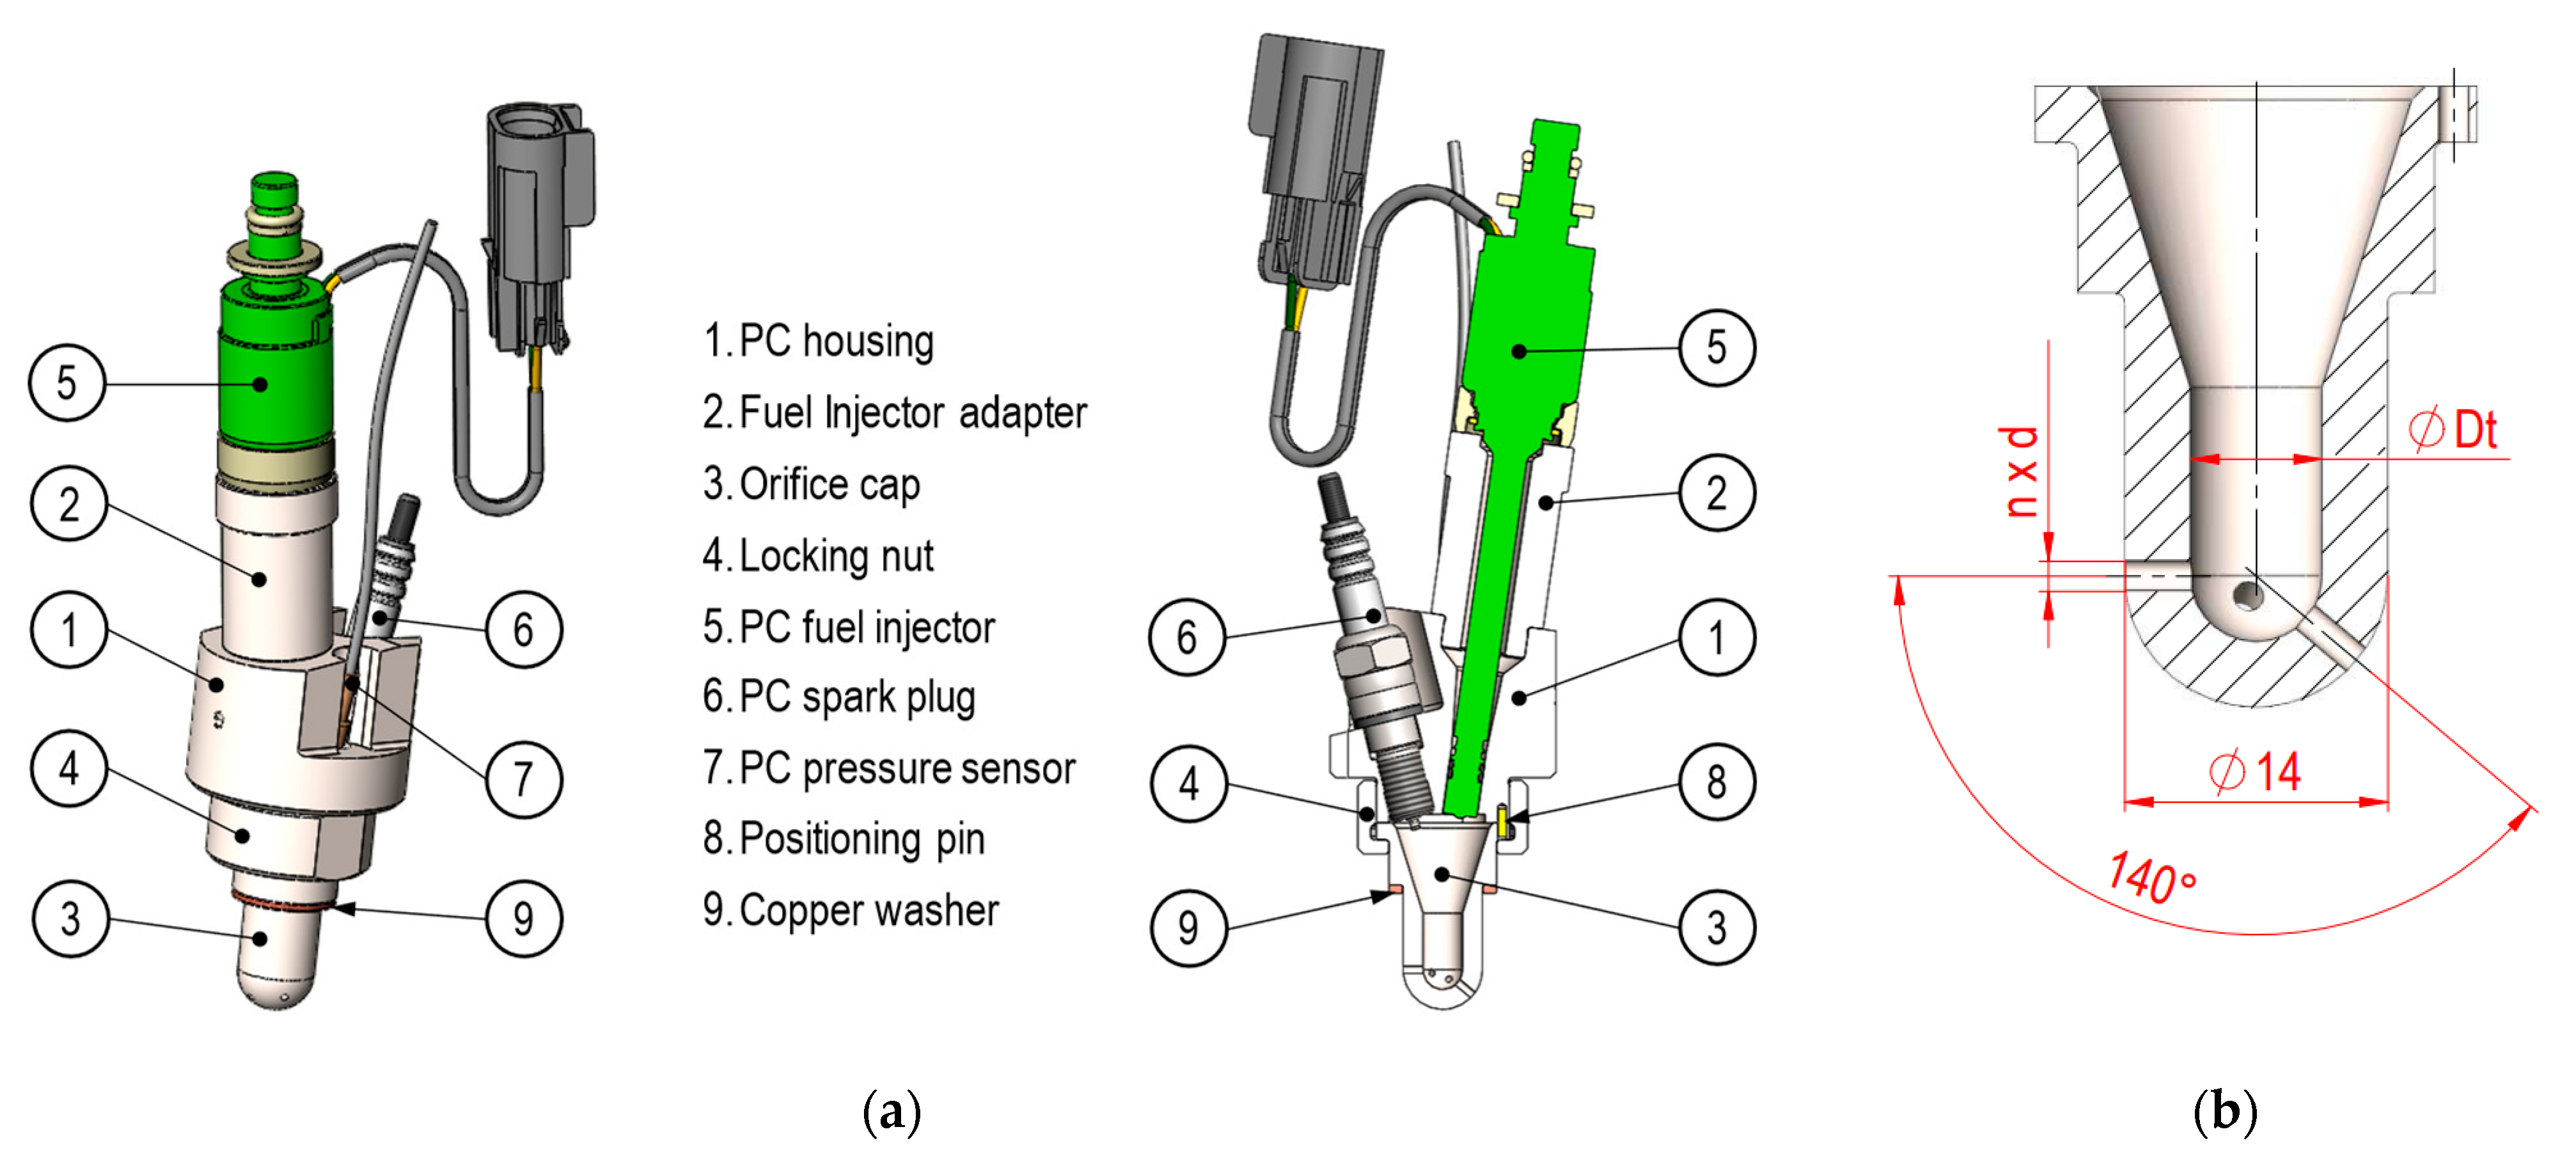
Pre-Chamber Ignition System Design

Under the ongoing research project, a modular pre-chamber was developed which would allow for the variations in pre-chamber volume and number, size (bore diameter) and position of the orifices.
The final design is shown in Figure 3a. The pre-chamber ignition system is comprised of a housing (1), Orifice cap (3) and locking nut (4). The housing accommodates the fuel injector (5), the spark plug (NGK EPR10ES) (8) and the pressure sensor (AVL GH14DK) (7). To use the low flow injector, an additional adapter for the fuel injector (2) is added because it is a long tip injector. The locking nut holds the orifice cap in place. Pre-chamber cap position is fixed with a positioning pin (8). The pre-chamber volume, orifice diameter and number are defined with orifice cap inner geometry. The system is placed into the position where originally the diesel fuel injector was. For that reason, the pre-chamber assembly is tilted 20° to cylinder axes (Figure 3b). The position of the pre-chamber ignition system is secured via a positioning pin in the cylinder head and held in place with a bolted clamp. To accommodate the pre-chamber ignition system, the cylinder head had to be significantly modified. A large part of the heads cooling fins is milled off and the bore for the diesel fuel injector is enlarged to 14 mm. To change the pre-chamber volume and orifice size, number, and position only the orifice cap must be changed.

4. Numerical Model of the Experimental Engine

The reduced 1D/0D simulation model of the experimental engine was made in AVL Boost™. It consists of short intake (1) and exhaust pipe (2) with the imposed boundary conditions from the experiment, as shown in Figure 2. Measured intake pressure traces for each operating point of engine were imposed on the simulation model by using engine interface element (EI1). An example of intake pressure profile for wide open throttle (WOT) condition is plotted in Figure 4.
The previously upgraded quasi-dimensional combustion model (PCSI) was used which integrates K-k-ε turbulence modeling approach and multiple flame propagation in the main chamber [19,23]. To evaluate emissions of NOX, CO, and THC the emission sub-models are upgraded to consider the emission mass transfer between pre-chamber and main chamber. In the case of NOX and CO the following equation was used to describe to total change of emission in the pre-chamber (PC) or main chamber (MC) volume:
d   m y d t t o t   =   d   m y d t r e a c t i o n   +   d   m y d t m a s s   f l o w   ,
where index y refers to NOX or CO emission. The first term on the right-hand side of Equation (1) is calculated with reaction rate mechanisms for NOX and CO that are already described in the previous study [24]. The second term includes the change of emission mass caused by the mass flow through pre-chamber orifices.
  d   m y d t m a s s   f l o w   =   ±   d   m y d t o r i f i c e   ·   x y ,
where xy is mass ratio of NOX or CO at specific volume (pre-chamber or main chamber) depending on the mass transfer direction. When the emission mass flow for pre-chamber volume is calculated and if the pre-chamber mass is increasing it means that the mass from main chamber flows into pre-chamber. Hence the mass ratios for NOX and CO of the main chamber are used. If the pre-chamber mass is decreasing the mass from pre-chamber flows into main chamber and mass ratios of emissions in pre-chamber are used in Equation (2). The same analogy was applied when the balance of NOX and CO emissions of main chamber is calculated. If the second term of Equation (1) is deactivated (set to 0) the influence of pre-chamber NOX and CO emissions on the main chamber volume can be numerically evaluated. An example of NOX mass profiles in the pre-chamber and main chamber are plotted in Figure 5. Dashed lines are referenced to NOX mass generated in each volume when mass transfer of NOX is deactivated, while solid lines define NOx mass in each zone calculating the mass flow of NOX, as described by Equation (2). Difference between the NOX emissions in the main chamber achieved with activated and deactivated mass flow of NOX defines the influence of PC combustion and emission on the overall exhaust gas emission.
The THC emission model was extended to evaluate the partial burn effect considering the mass of fuel that remains unburned at exhaust valve opening (EVO). Since the quasi-dimensional combustion model was used in this study, the combustion burning speed depended on engine operating parameters (such as spark timing, air excess ratio, engine speed, etc.) and there was a certain amount of unburned fuel available at EVO. The pre-chamber and main chamber volume continually exchange mass, and therefore the unburned fuel in the main chamber has part of the fuel that is transferred from pre-chamber. The integration of fuel mass flow from pre-chamber to main chamber results with the total fuel mass transferred from pre-chamber to main chamber:
m f ,   P C MC   =   I V C E V O d m d t · x f ,   PC · d t   ,
where x f ,   PC is actual mass ratio of fuel in the pre-chamber mass, while the mass flow is limited only to one direction when mass flows from pre-chamber to main chamber.
Under the assumption of perfect mixing inside the main chamber the final contribution of pre-chamber fuel flow is evaluated in terms of total THC emissions:
  m f ,   P C p a r t i a l _ b u r n = m f ,   P   C MC · m f ,   UB ,   MC · P m f ,   SHP ,   MC ,
where m f ,   UB ,   MC is the mass of fuel in the main chamber that remains unburned at EVO (exhaust valve opening) event, P is calibration user-defined constant, while m f ,   SHP ,   MC is total fuel mass available at SHP (start of high pressure). An example of fuel mass profile in the main chamber (red line) and the fuel mass that flows from PC to MC and contributing to partial burn in MC (blue profile calculated by Equation (4)) are plotted in Figure 6. The final influence of PC to THC emission in MC is evaluated at EVO event so that the fuel mass calculated by Equation (4) is divided by fuel mass that remains unburned in MC.
In addition to the partial burn effect that depends on the combustion quality, there are several other sources of THC emissions, such as the crevice volume effect, adsorption of fuel vapor in the oil layers and deposits on the combustion chamber walls during intake and compression stroke. In the upgraded THC emission model for main chamber volume, the partial burning effect was only modified and correlated to unburned fuel at EVO, as already discussed in [24].

5. Results and Discussions

5.1. Experimental Results

To evaluate the influence of varying pre-chamber geometry parameters on engine performance and emissions, the measured and processed data were grouped into two data sets. The first set represents the influence of pre-chamber volume and orifice number (Figure 7 and Figure 8) and the second set represents the influence of orifice diameter (Figure 9 and Figure 10). All depicted data represent the best indicated efficiency points which are in the stable operating range defined in the methodology (Section 2.1).
The investigation of the influence of pre-chamber volume and the number of orifices was performed by comparing data for pre-chamber (PC) types IN, V1, V2, V3, V4 and V5. All the prechamber types had the same orifice area to volume ratio OA = 0.003 mm−1 (Table 1). The compared volume ratios (VR) were 3.27, 4.07 and 5.08 %. The compared number of orifices were four and six orifices. The influence of different VR and orifice numbers on engine performance is presented in Figure 7 and the influence on exhaust gas emissions is presented in Figure 8. The used performance indicators included: indicated efficiency (Figure 7a), indicated mean effective pressure (IMEP) (Figure 7b), combustion efficiency (Figure 7c) and coefficient of variation of IMEP (CoVIMEP, Figure 7d). Indicated efficiency, IMEP and CoVIMEP were calculated from the measured pressure traces and fuel flow data. The combustion efficiency was calculated from the emissions data. Emissions data were comprised of THC (Figure 8a), CO (Figure 8b) and NOx (Figure 8c,d) values. The emission values were calculated from the analyzer data, air and fuel mass flow and effective engine power calculated from IMEP data and an assumption that the engine mechanical efficiency is 90%.
From Figure 7 it can be seen that stable operating conditions on all measured excess air ratios were only achieved with PC types V1 and V3. The achieved IMEP values ranged from 3.83 bar (V3, excess air ratio 2.2) to 8.47 bar (V4, excess air ratio 1). The load range where highest efficiencies were achieved is at excess air ratios 1.4, 1.6 and 1.8. The achieved average indicated efficiency of all PC types at those excess air ratios is around 33.6 ± 0.5%. The overall highest indicated efficiency is achieved with PC type IN at the excess air ratio of 1.8 (36.5%) and the lowest with V3 at excess air ratio 2.2 (27%) leading to brake specific fuel consumptions equal to 257 g/kWh and 348 g/kWh, respectively. Overall, the least-efficient PC type is V5, with an average indicated efficiency of 31.3% over the whole load range and the most efficient in the dataset shown in Figure 7 is IN with an overall average indicate efficiency of 34.7%. V4 achieves an overall highest indicated efficiency at excess air ratio 1 (32%) which is also supported by the highest achieved IMEP value (8.47 bar) in Figure 7b that results with maximum brake power equal to 6.8 kW. Excess air ratio 1 is also the load case at which the largest differences in indicated efficiencies and IMEP between the PC types were observed; there was a 4.4% difference between the highest (V4) and lowest efficiency (V5).
As observed with the achieved indicated efficiencies, the largest differences in achieved IMEP values were at excess air ratio 1 where the difference between the highest (V4) and lowest (V5) IMEP value was 1.2 bar. At all other excess air ratios, the IMEP differences were in the range of 0.7 bar. It should be noted that the measurement error in fuel and air flow and the fact that the intake air is not conditioned are affecting the calculated amount of total energy in the engine as can be seen by comparing the IMEP and efficiency values for PC type V4 and IN. For the same excess air ratio, the IN-PC type has a higher indicated efficiency value but lower IMEP values then V4.
In general, from the data depicted in Figure 7 it can be observed that for almost all volume ratios (VR) the PC types that have six orifices have higher indicated efficiencies and slightly higher combustion efficiencies, especially at higher excess air ratios. The differences are less evident with a smaller volume ratio and higher loads (smaller excess air ratios). Also, for six orifices, the volume ratio influence on indicated efficiency is not as pronounced as it is for four orifices where the indicated efficiency is higher at smaller volume ratios. Regarding the combustion stability, there is no noticeable influence of pre-chamber volume ratio and orifice number on the CoVIMEP values (Figure 7d). As expected, the CoVIMEP values become larger at high loads (excess air ratio 1) due to intensified knock occurrence and at low loads (excess air ratio > 1.6) due to incomplete combustion and misfire in lean mixture conditions. The influence of pre-chamber volume ratio and orifice number on exhaust gas emissions is shown on Figure 8. The THC values (Figure 8a) show a trend where PC types with 6 orifices emit less THC emissions, which is more pronounced at higher excess air ratios and larger volume ratios. The influence of volume ratio on THC emissions is not so pronounced as it is for the number of orifices, but the data indicated that smaller volume ratios yield less THC emissions. Similar trends can be observed in case of CO emissions (Figure 8b). On the other hand, the NOx emissions (Figure 8c,d) show a logical trend where the emissions decrease with higher excess air ratios but no clear trend regarding volume ratio and orifice number influence can be observed. NOx emission results show that by using pre- chamber combustion technology Euro VI (0.2 g/kWh) and expected Euro VII emission limits (0.2 g/kWh) [25] can be reached independently of PC type and orifice number in the range of excess air ratios greater than 2.
The influence of orifice diameter on engine performance and emissions is presented in Figure 9 and Figure 10. For the depicted data to be comparable, all the compared PC types had the same volume (VR = 3.27%) and four orifices. With the imposed knock and combustion stability limits compared PC types (V4, V6, V7 and V8) could not achieve excess air ratios greater than 2. The indicated efficiency data on Figure 9a is showing that a larger orifice area (OA) or larger orifice diameter at constant pre-chamber volume and orifice number is more favorable regarding indicated efficiency at excess air ratios 1.4 and 1.6. At excess air ratios 1, 1.8 and 2 the indicated efficiency values for OA = 0.003 m−1 (V4) and OA = 0.01 m−1 (V8) were very similar but are slightly larger in the case of the V8 PC type. The highest efficiencies were achieved at excess air ratios 1.4 and 1.6, which is in the range of 37.6%. The highest gain in efficiency with the increase of OA (from 0.001 m−1 to 0.07 m−1) is at the excess air ratio 1.4 with 2% absolute increase or 6% relative to indicated efficiency at OA = 0.001 m−1.
Achieved IMEP values (Figure 9b) do not suggest a strict correlation with OA. Only at excess air ratio 2 did the IMEP values steadily increase with the decrease of OA. It is interesting to see that the OA suggested by the literature has the highest combustion efficiencies (Figure 9c), the highest IMEP values at excess air ratios 1.8 and 2 and the most stable combustion behavior (Figure 9d).
When comparing THC (Figure 10a) and CO (Figure 10b) emissions, the OA suggested by the literature, PC type V4 yielded the overall lowest emission values. As expected, the mentioned PC type yielded the highest NOx emissions, especially at excess air ratio 1. In the case of THC and CO emissions a trend of higher emission values with the increase of OA values can be observed. In the case of NOx emissions, their trend is opposite, with the emission values decreasing with the increase in OA values.
It should be mentioned that when looking at indicated efficiency values over the whole load range, PC type V8 an IN provide the overall highest values, although V8 yielded slightly higher values.

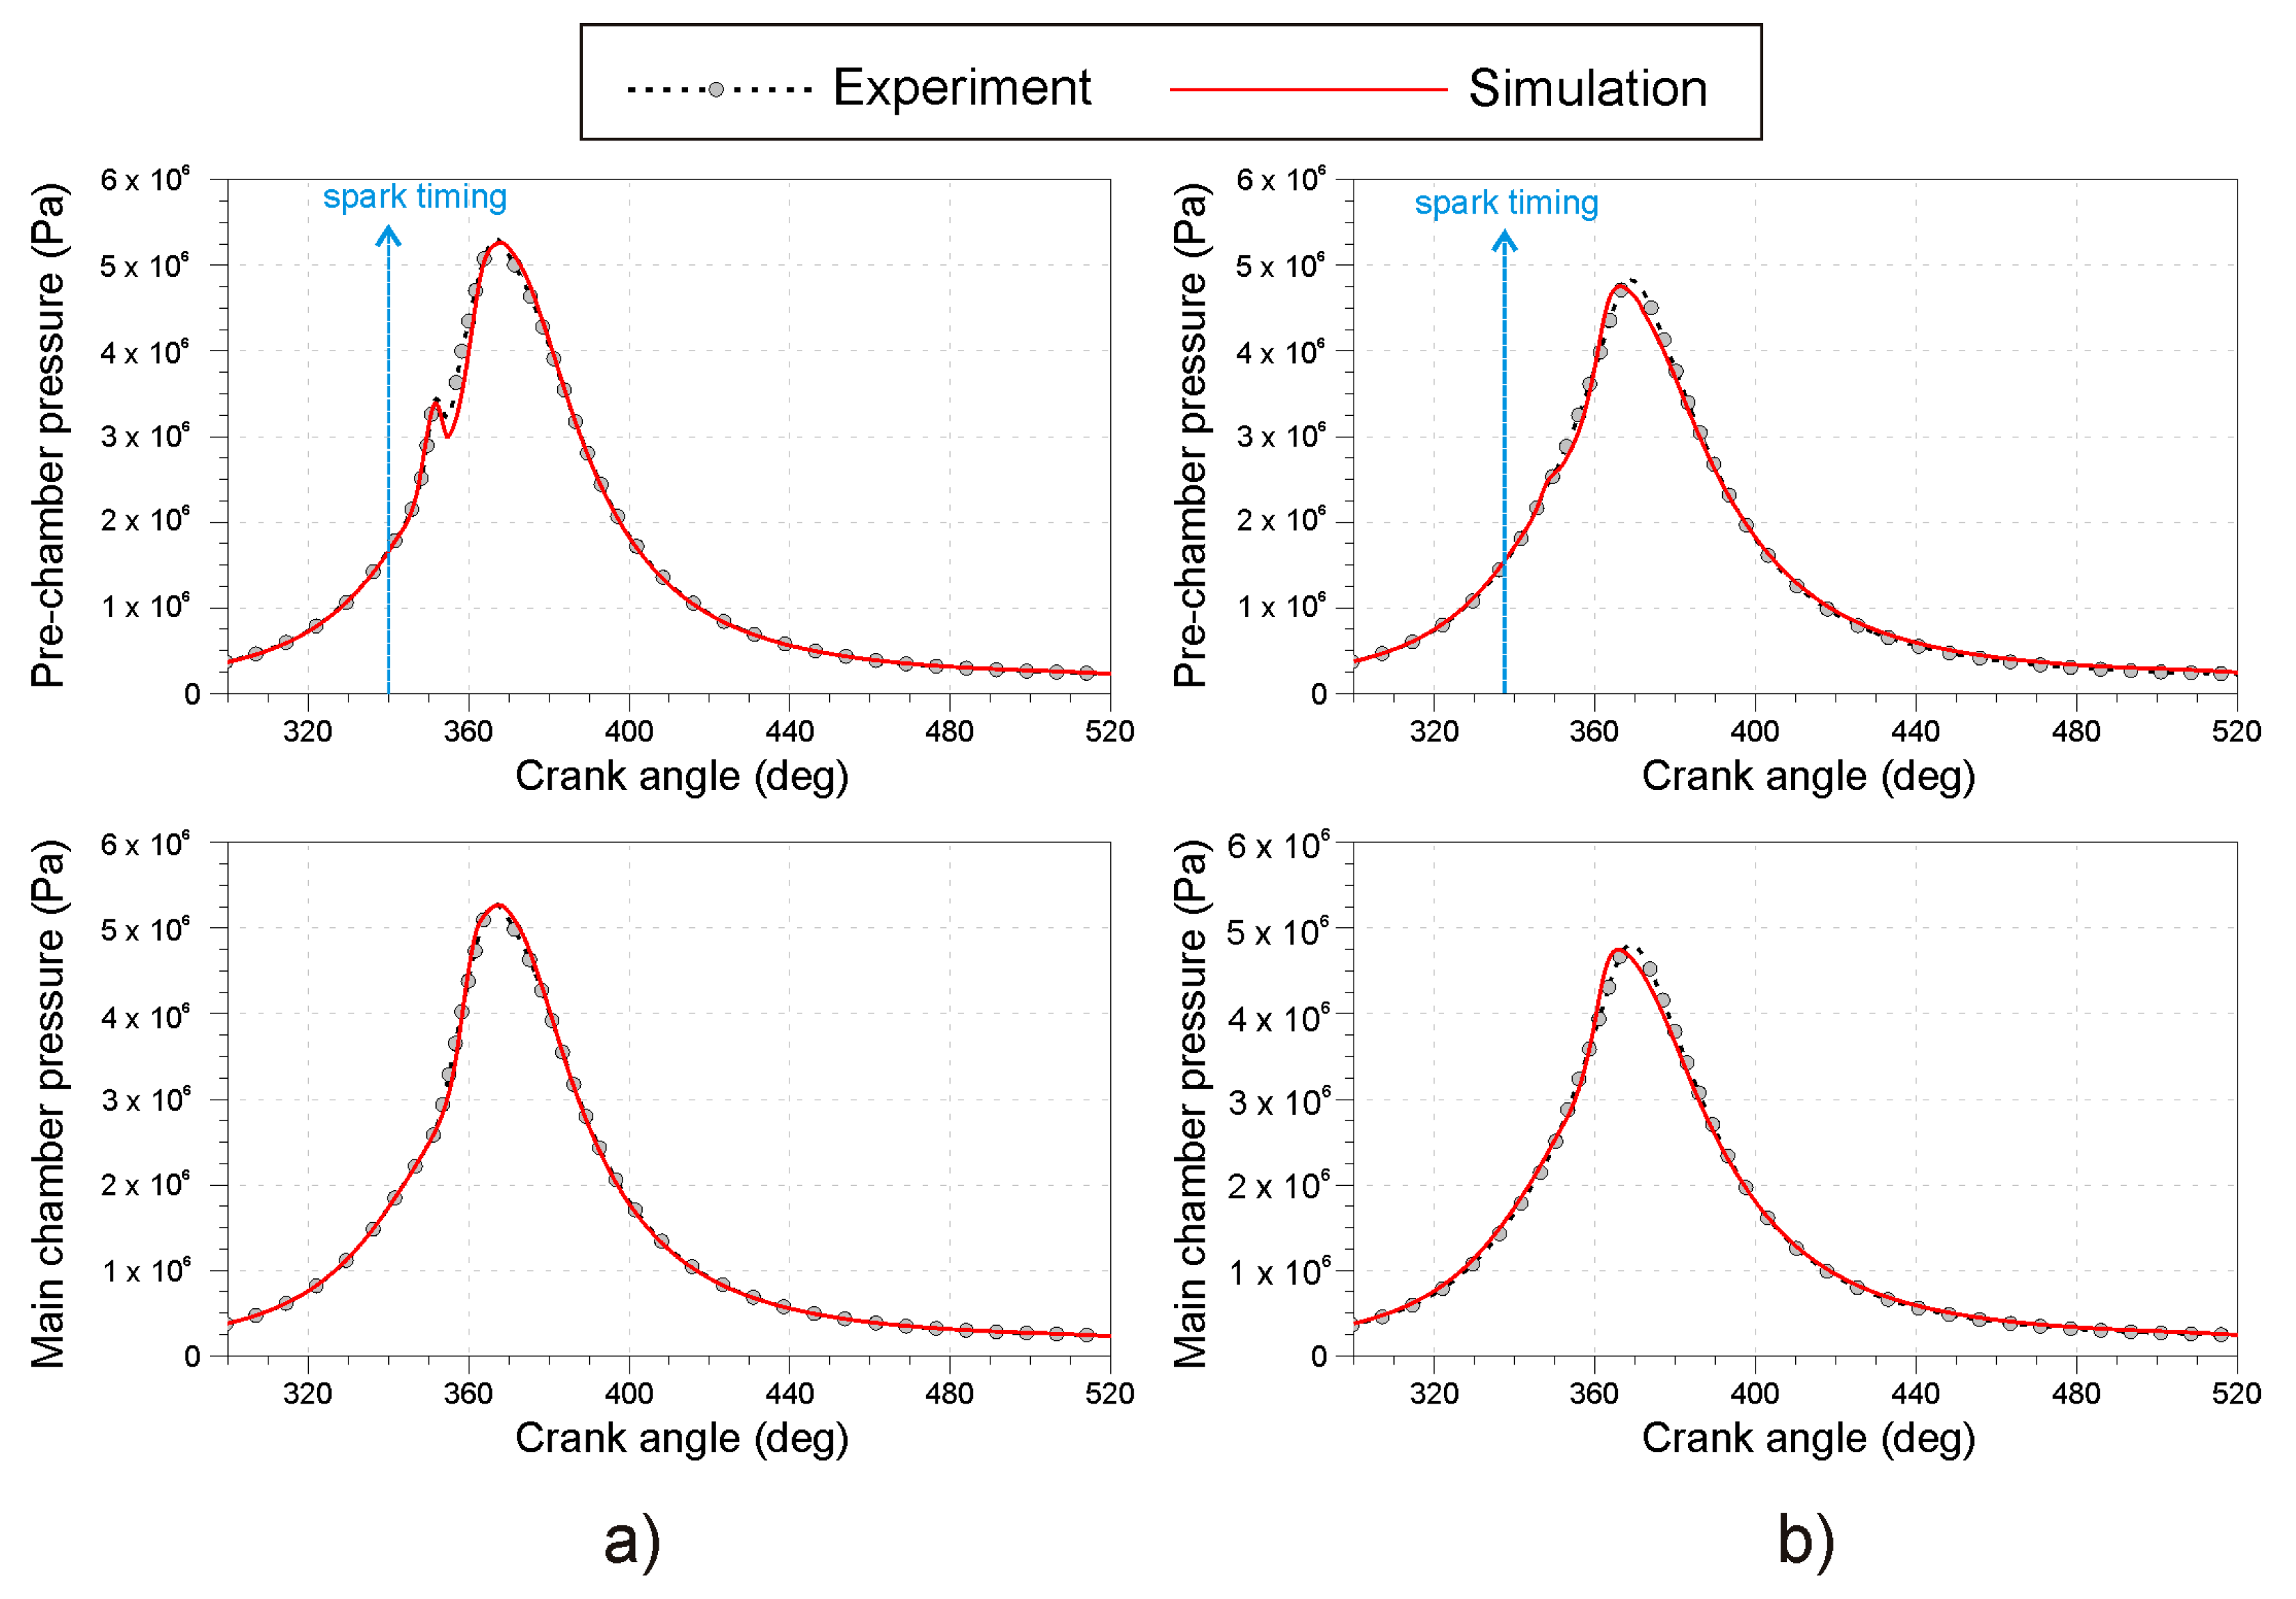
5.2. Numerical Results

After the adoption of intake boundary conditions (fuel vapor concentration and intake temperature), the calibration of combustion model parameters (for pre-chamber and main chamber) was performed to achieve a good agreement in pressure traces for both chambers. An example of calibration results of averaged pressure traces for pre-chamber and main chamber is given in Figure 11.
The calibration results shown in Figure 11 are referenced to operating points with the best-indicated efficiencies at an exhaust air excess ratio of 1.8, where Figure 11a is related to initial pre-chamber design (IN) with 6 orifices, while Figure 11b is referenced to V8 design with four orifices. Simulated peak pressures and peak pressure positions for both chambers matched the experimental data well, resulting in the correct prediction of IMEP. In this study, the allowed difference between experimentally defined and simulated IMEP was set to ±5%. Once the combustion parameters were calibrated, the calibration of emission model parameters was performed in the second step. During the emission model calibration, the transport of the emission component between the pre-chamber and main chamber was activated. The main chamber emissions included the effect of pre-chamber and main chamber combustion and were compared with the measured results. Calibration of the emission models for NOX, THC and CO was performed until the difference between the simulated and experimental result was within the accuracy of exhaust gas analyzers. In the last step, the transport of the emission component between the pre-chamber and main chamber was deactivated, enabling the quantification of pre-chamber emission share in total exhaust gas emissions.
Pre-chamber emission share for NOX, THC and CO over imposed spark and excess air ratio sweeps are plotted in Figure 12. The numerical study was made over four selected pre-chamber designs (IN, V1, V2 and V8), including the variations of orifice number and pre-chamber volume. The influences of spark timings on pre-chamber emission share are plotted in Figure 12a, while the effect of exhaust excess air ratio is plotted in Figure 12b.
For considered pre-chamber designs there was no significant influence of spark timing on pre-chamber emission share, especially for THC emissions that did not exceed values of 3.5% for any operating condition. Retarding the spark timing resulted in a higher fuel energy share in the PC, which should have notably increased the NOx emission share. However, this effect was somewhat suppressed by keeping the PC injection duration constant, which resulted in a leaner mixture as the spark timing was retarded. When results of PC emission share achieved with six orifices for V1 (volume ratio 3.27%), IN (volume ratio 4.07%) and V2 (volume ratio 5.08%) were compared, it was evident that the minimum PC volume has maximum emission share of NOX and CO, while the THC emission share was minimum. Since the same PC injection duration was applied in this study, the minimum PC volume results with maximum peak temperatures in the PC increased the generation of NOx and CO. On the other hand, the minimum PC volume had the lowest mass transfer from PC to main chamber resulting in a minimum THC emission share of around 1.8%. The PC emission share of NOX and CO significantly depends on the exhaust air excess ratio and on the pre-chamber volume, as can be seen in Figure 12b. The maximum PC emission share for NOX was achieved at lean limit (λ = 2.2) with minimum PC volume and was equal to 54.8%. Te PC emission share for NOX at lean limit conditions could be even higher if the PC fueling is increased to achieve more stable combustion. At the lean limit (λ = 2.2) and with a minimum PC volume, the combustion in PC was responsible for the maximum value of 80.6% of total exhaust CO emissions. The numerical results plotted in Figure 12b indicate the potential for additional reductions of exhaust gas emissions by the optimization of PC fueling and combustion.

6. Conclusions

In the presented article, the influence of pre-chamber volume, orifice number and orifice size on engine performance and emissions was studied. An experimental study was conducted on nine different pre-chamber variants with different combinations of pre-chamber volume, orifice size and number at different loads. The compared geometry parameters were pre-chamber volume ratio (VR), orifice area to volume ratio (OA) and number of orifices. Additionally, a numerical study was performed by the application of the cycle-simulation model to quantify the share of emissions which are formed in the pre-chamber, as this could not be evaluated experimentally.
The presented study led to the following conclusions:
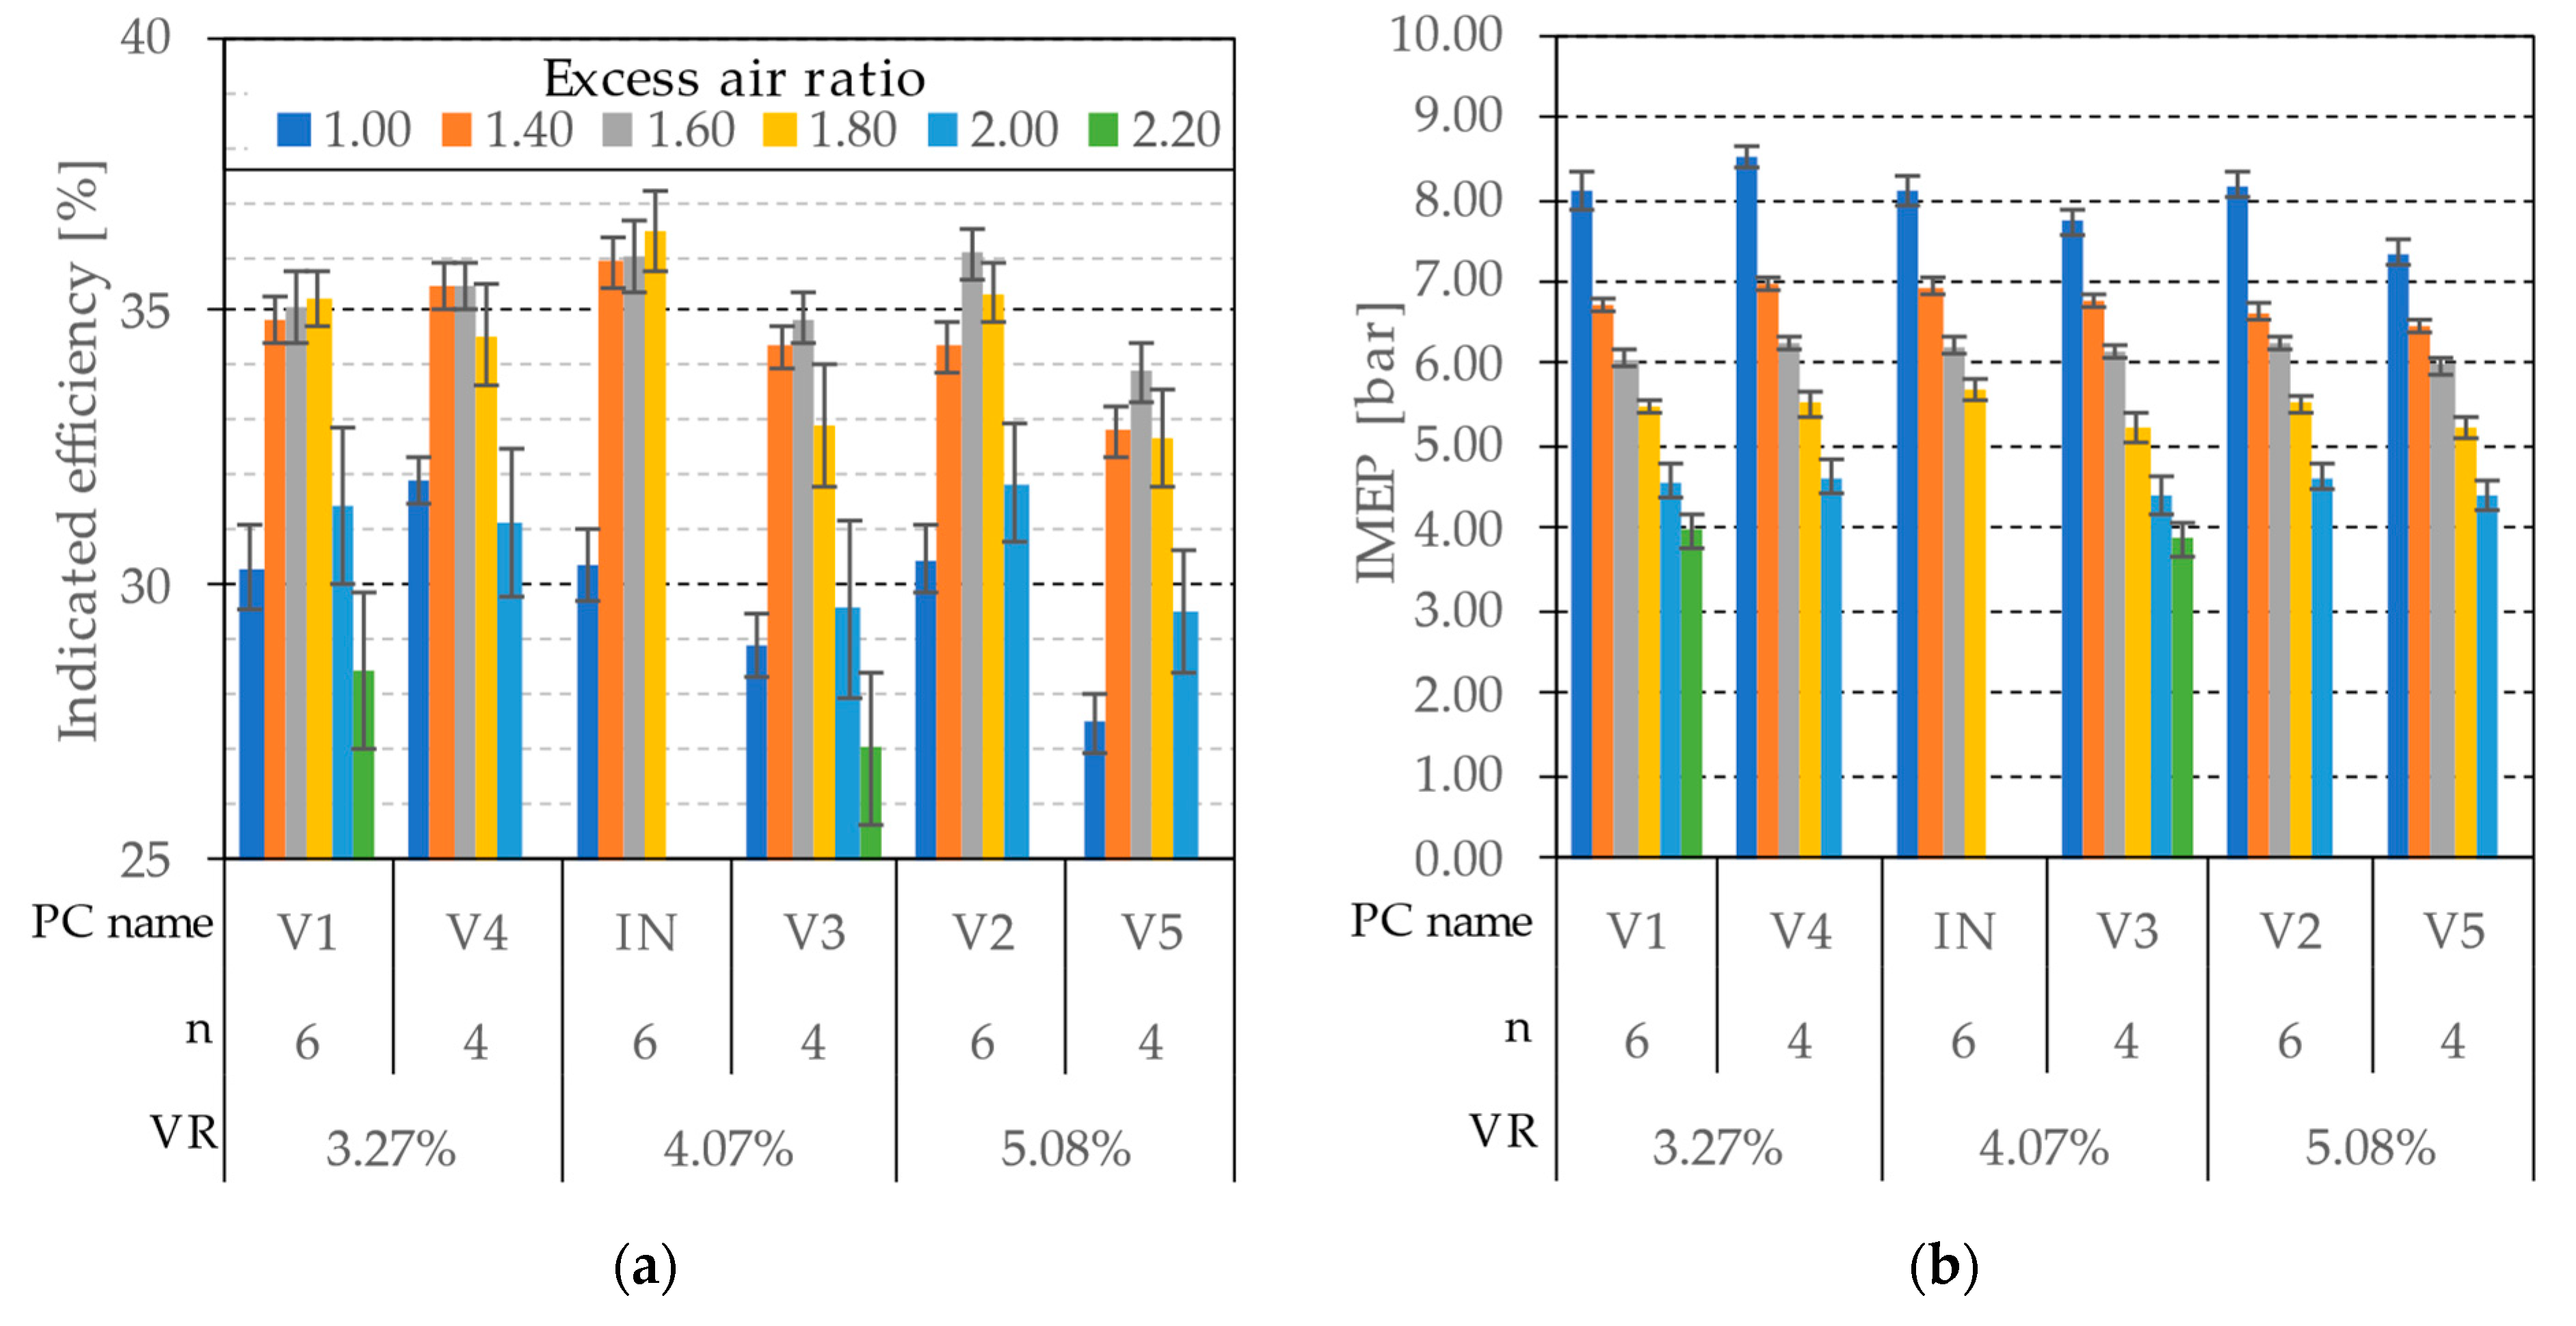
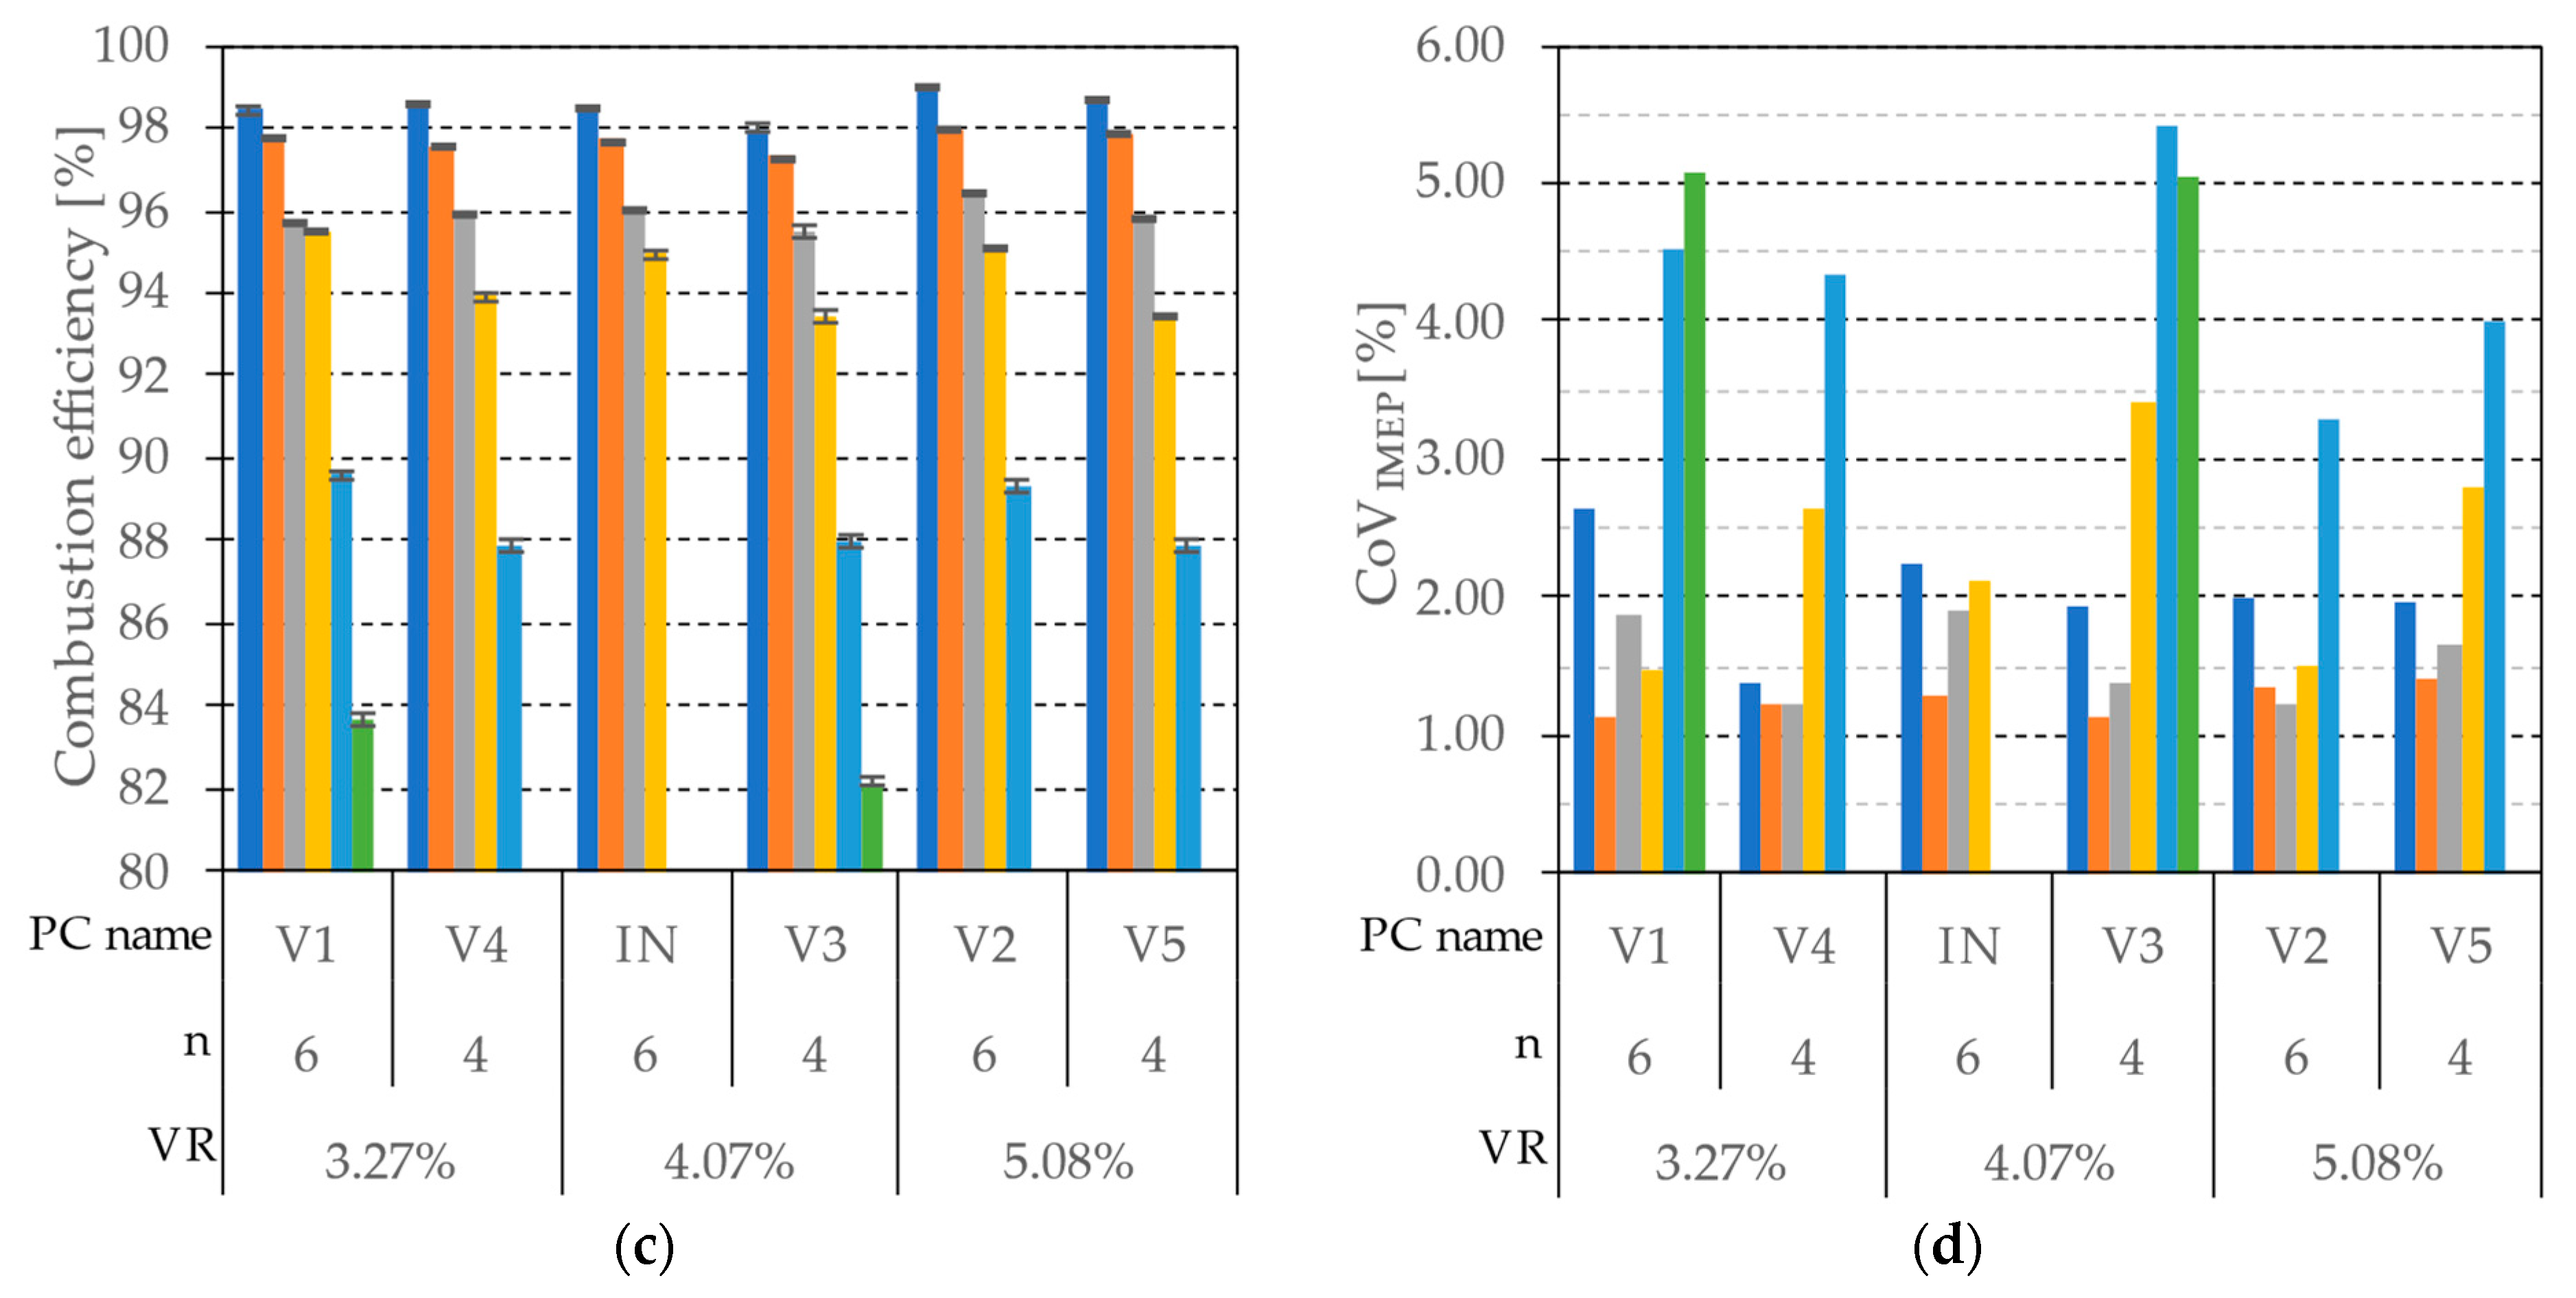
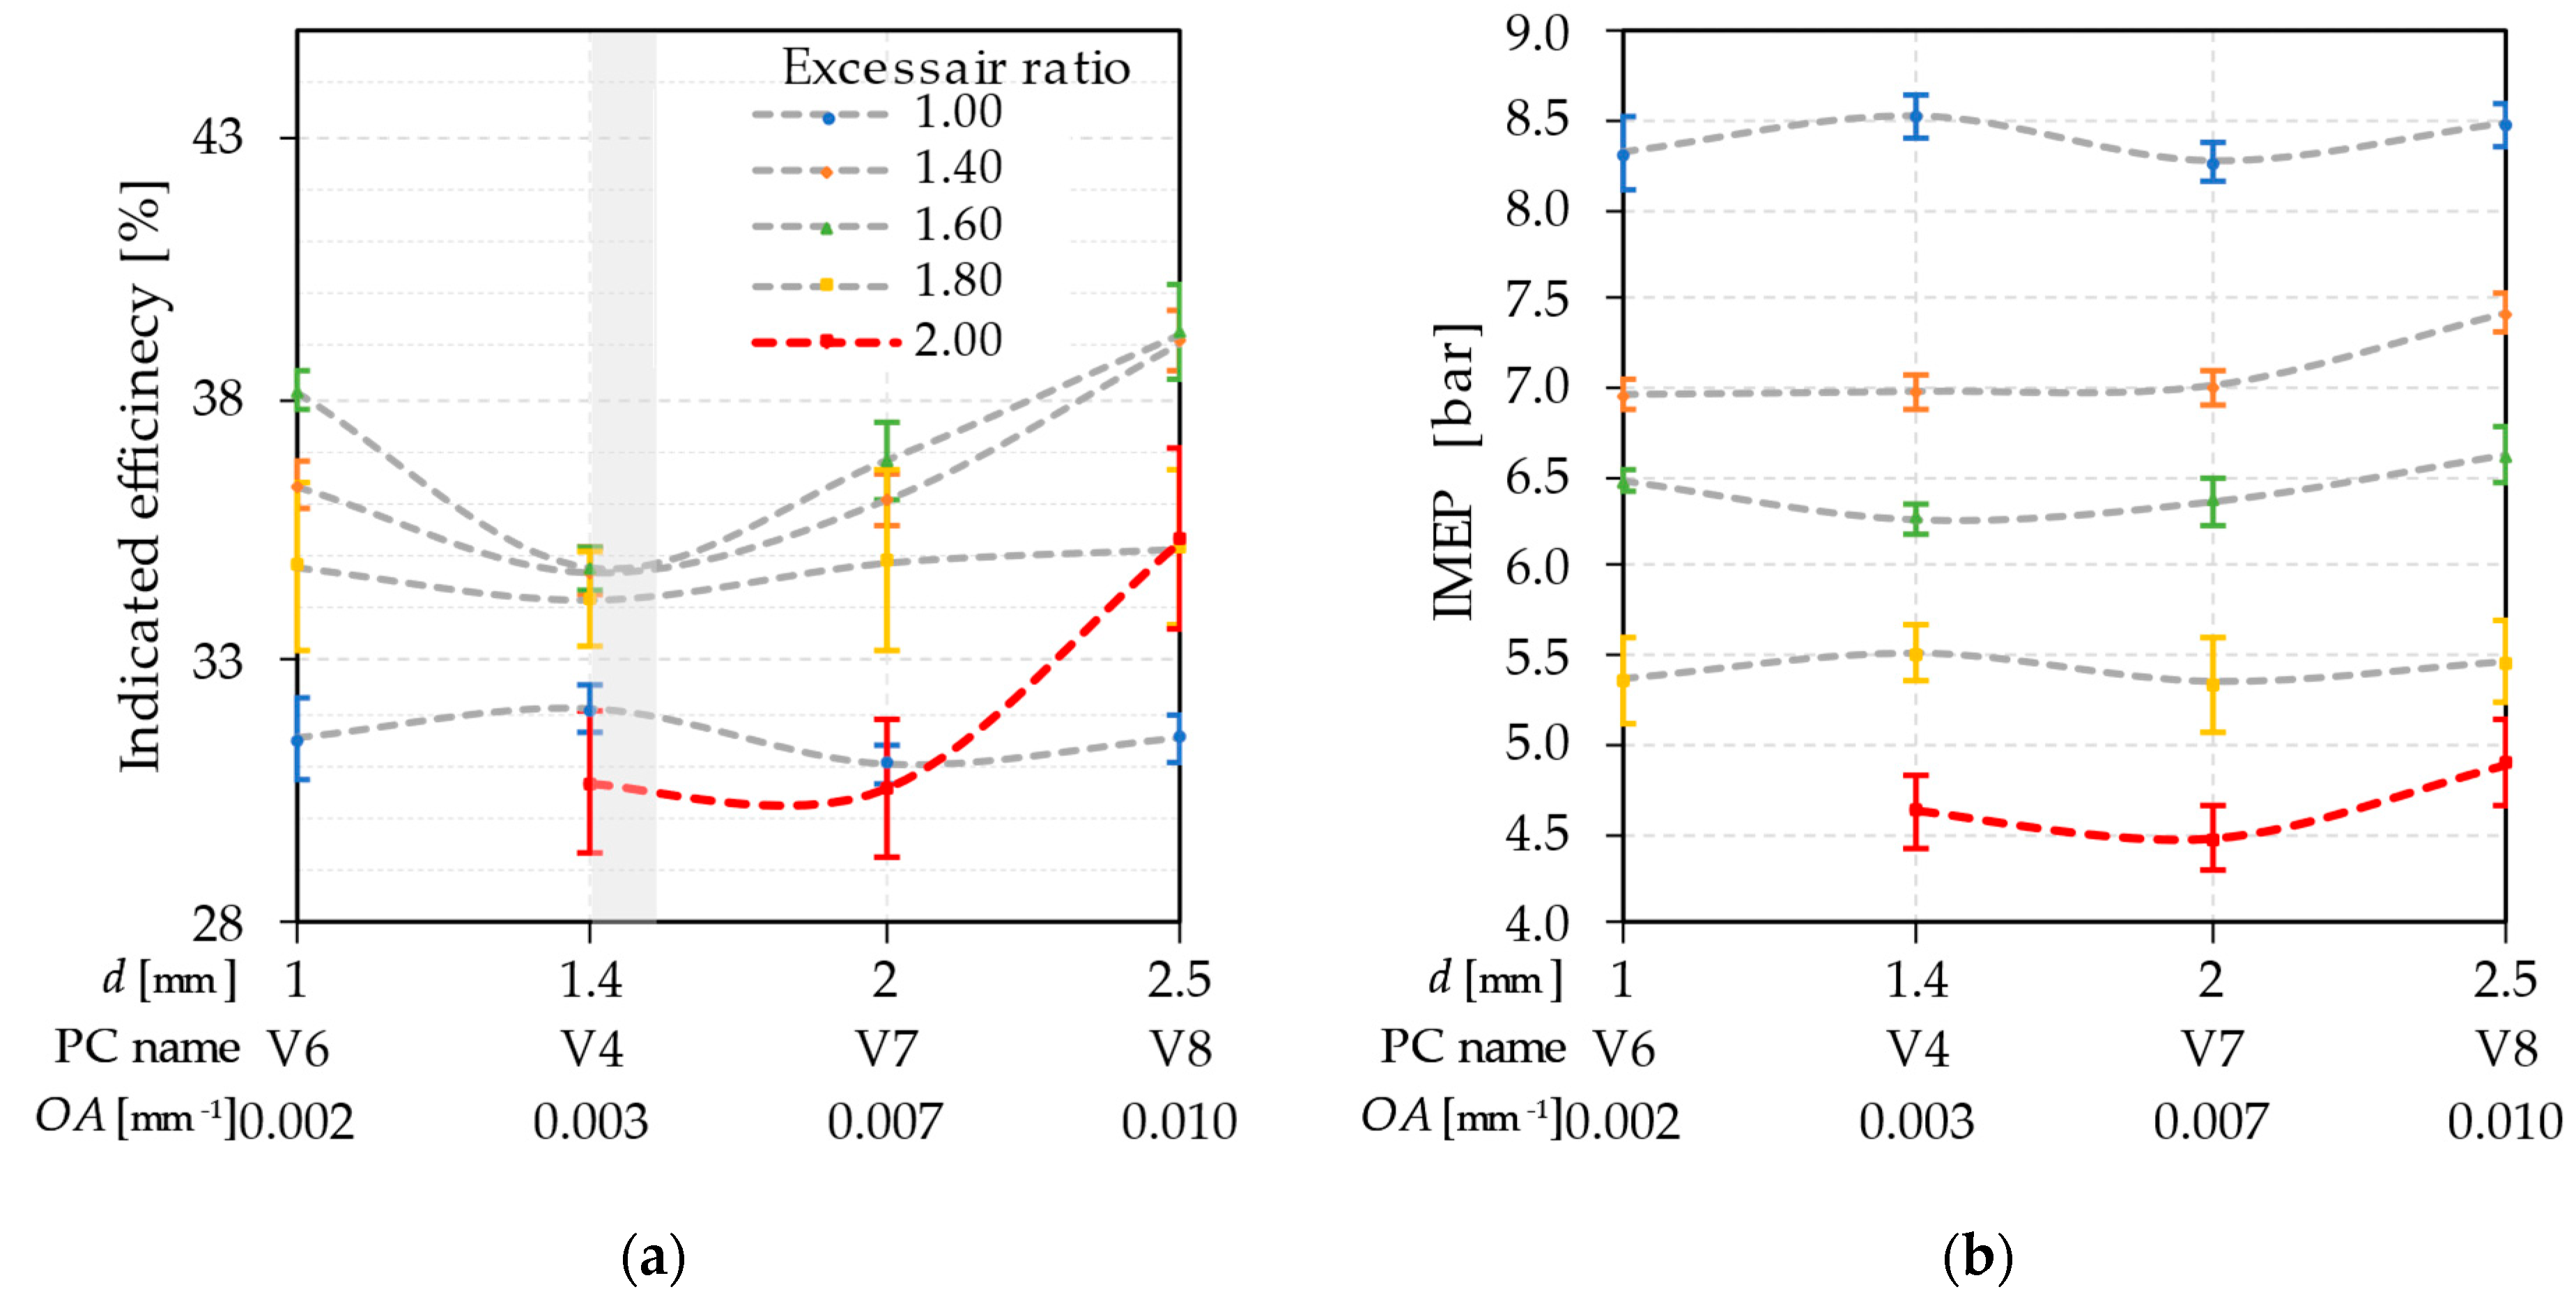
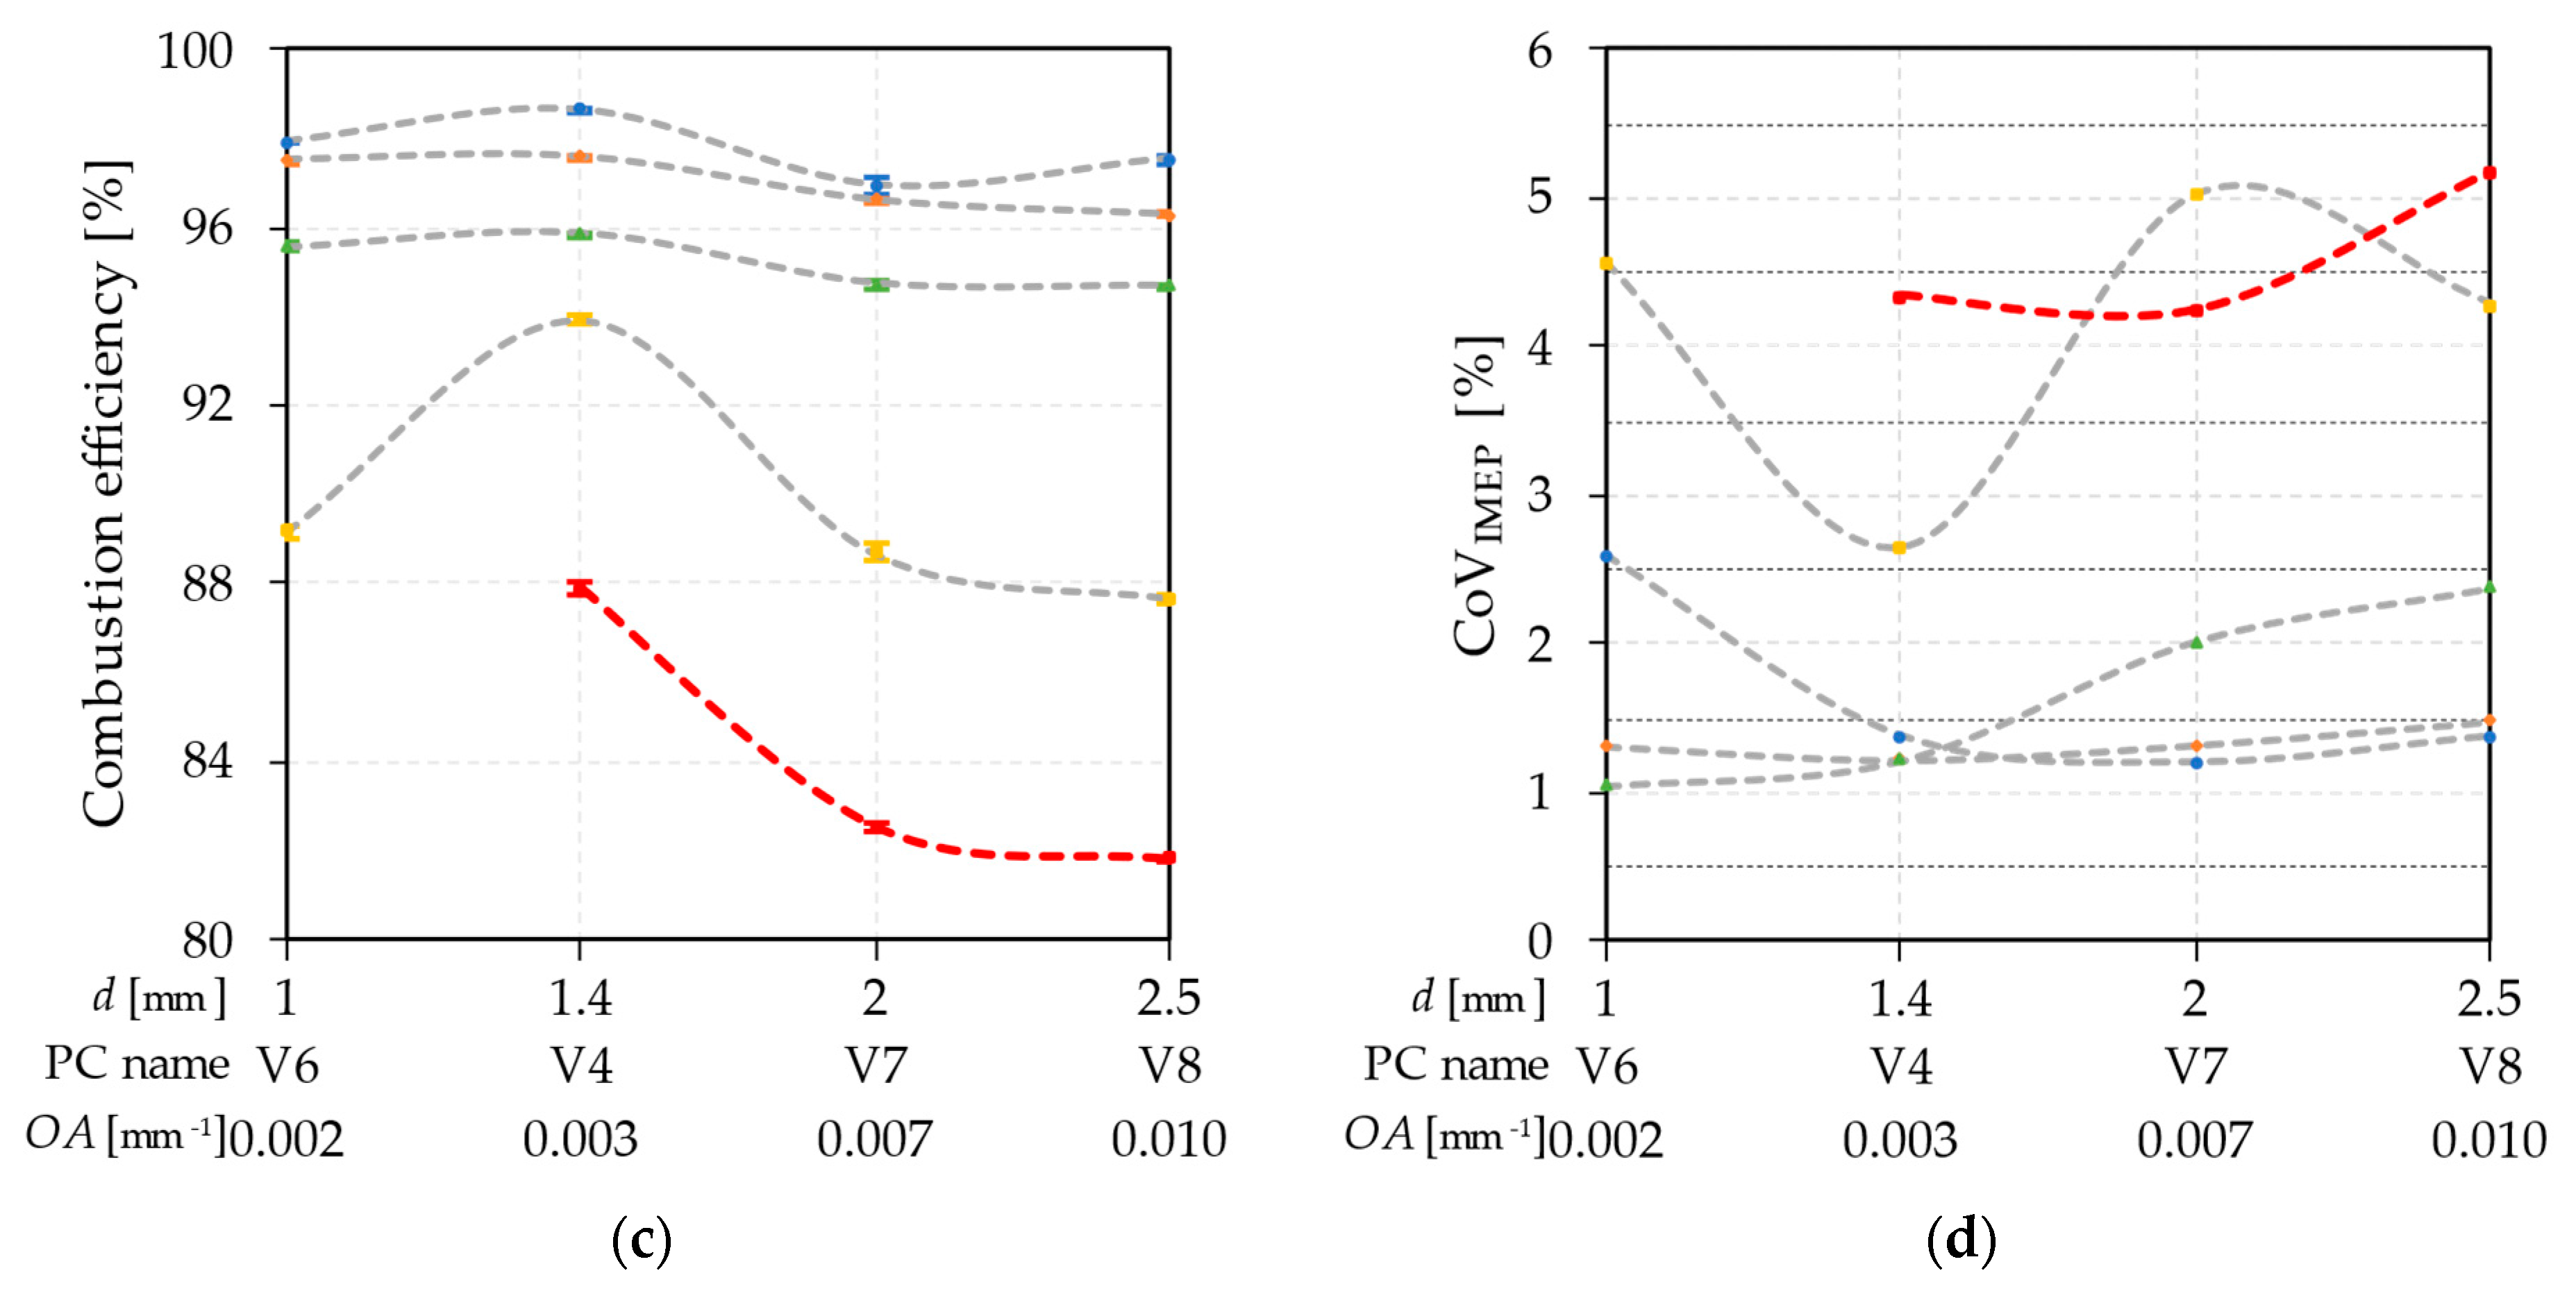
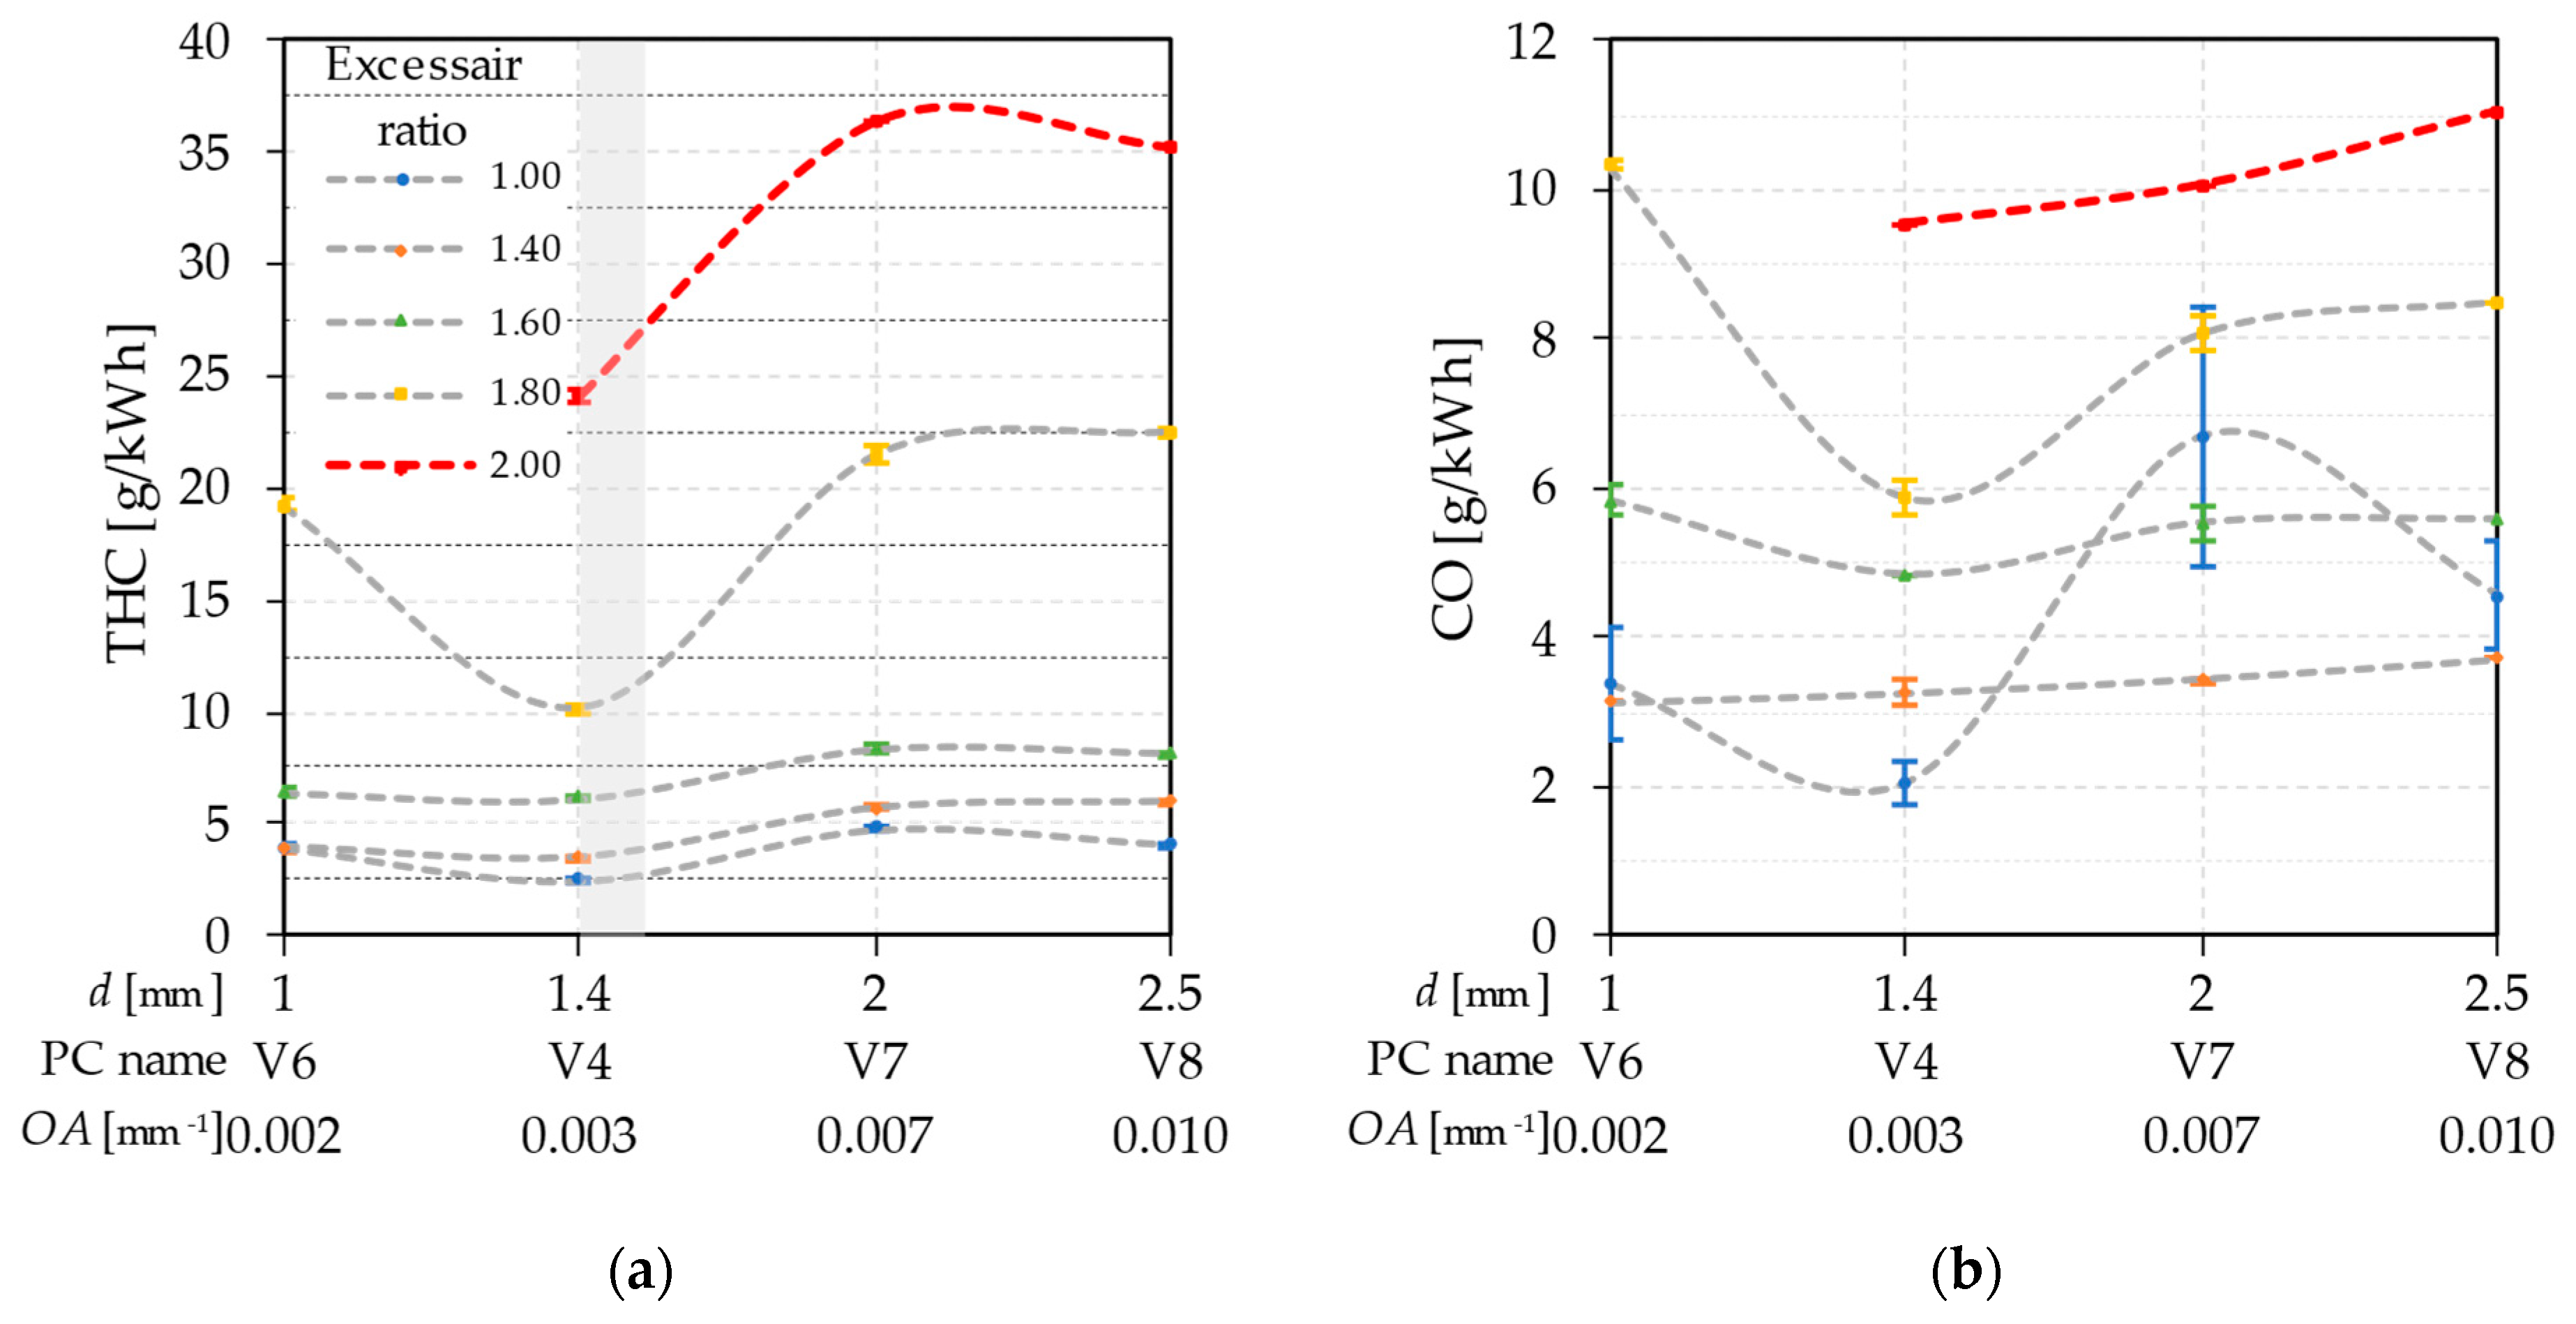
  • The indicated efficiency data showed that a larger orifice area (OA) or larger orifice diameter at constant pre-chamber volume and orifice number is more favorable regarding indicated efficiency. Although the larger number of orifices mostly yielded higher indicated and combustion efficiencies which were more pronounced at higher excess air ratios and larger pre-chamber volumes, the overall best performance was obtained with the smallest pre-chamber with four orifices and the largest orifice area, which was most likely the result of the lowest wall heat losses directly affected by the jet protrusion velocity. The highest obtained indicated efficiency was equal to 39%, at an excess air ratio 1.6;
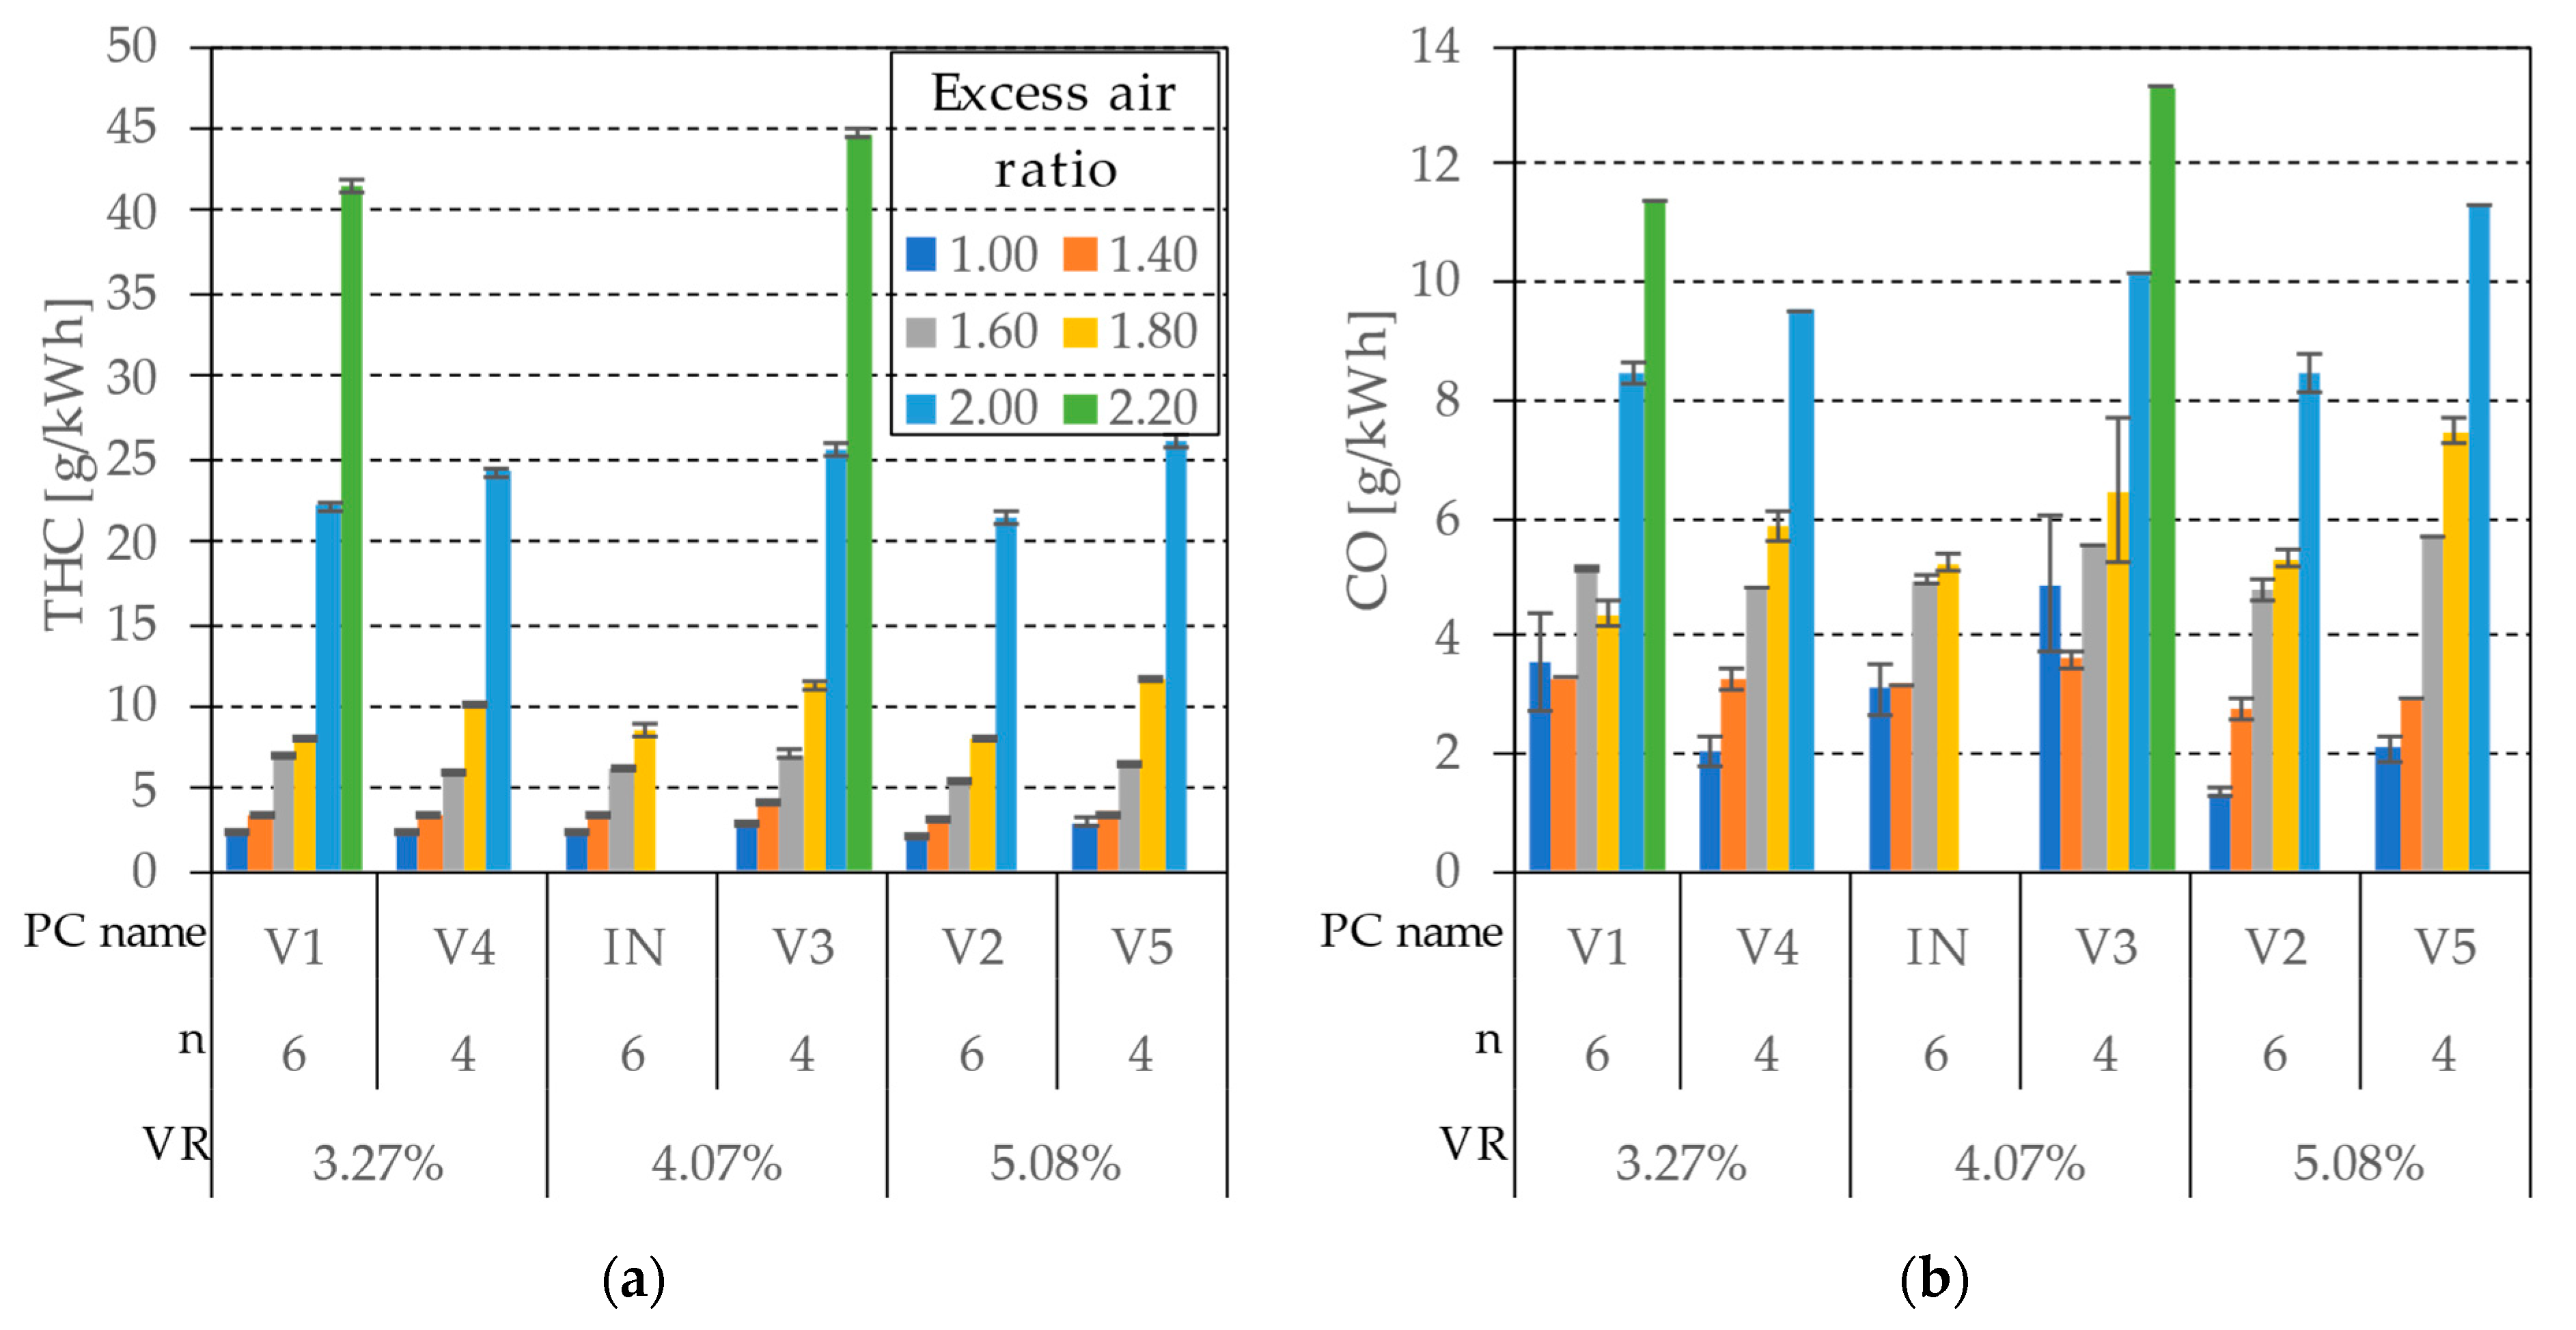
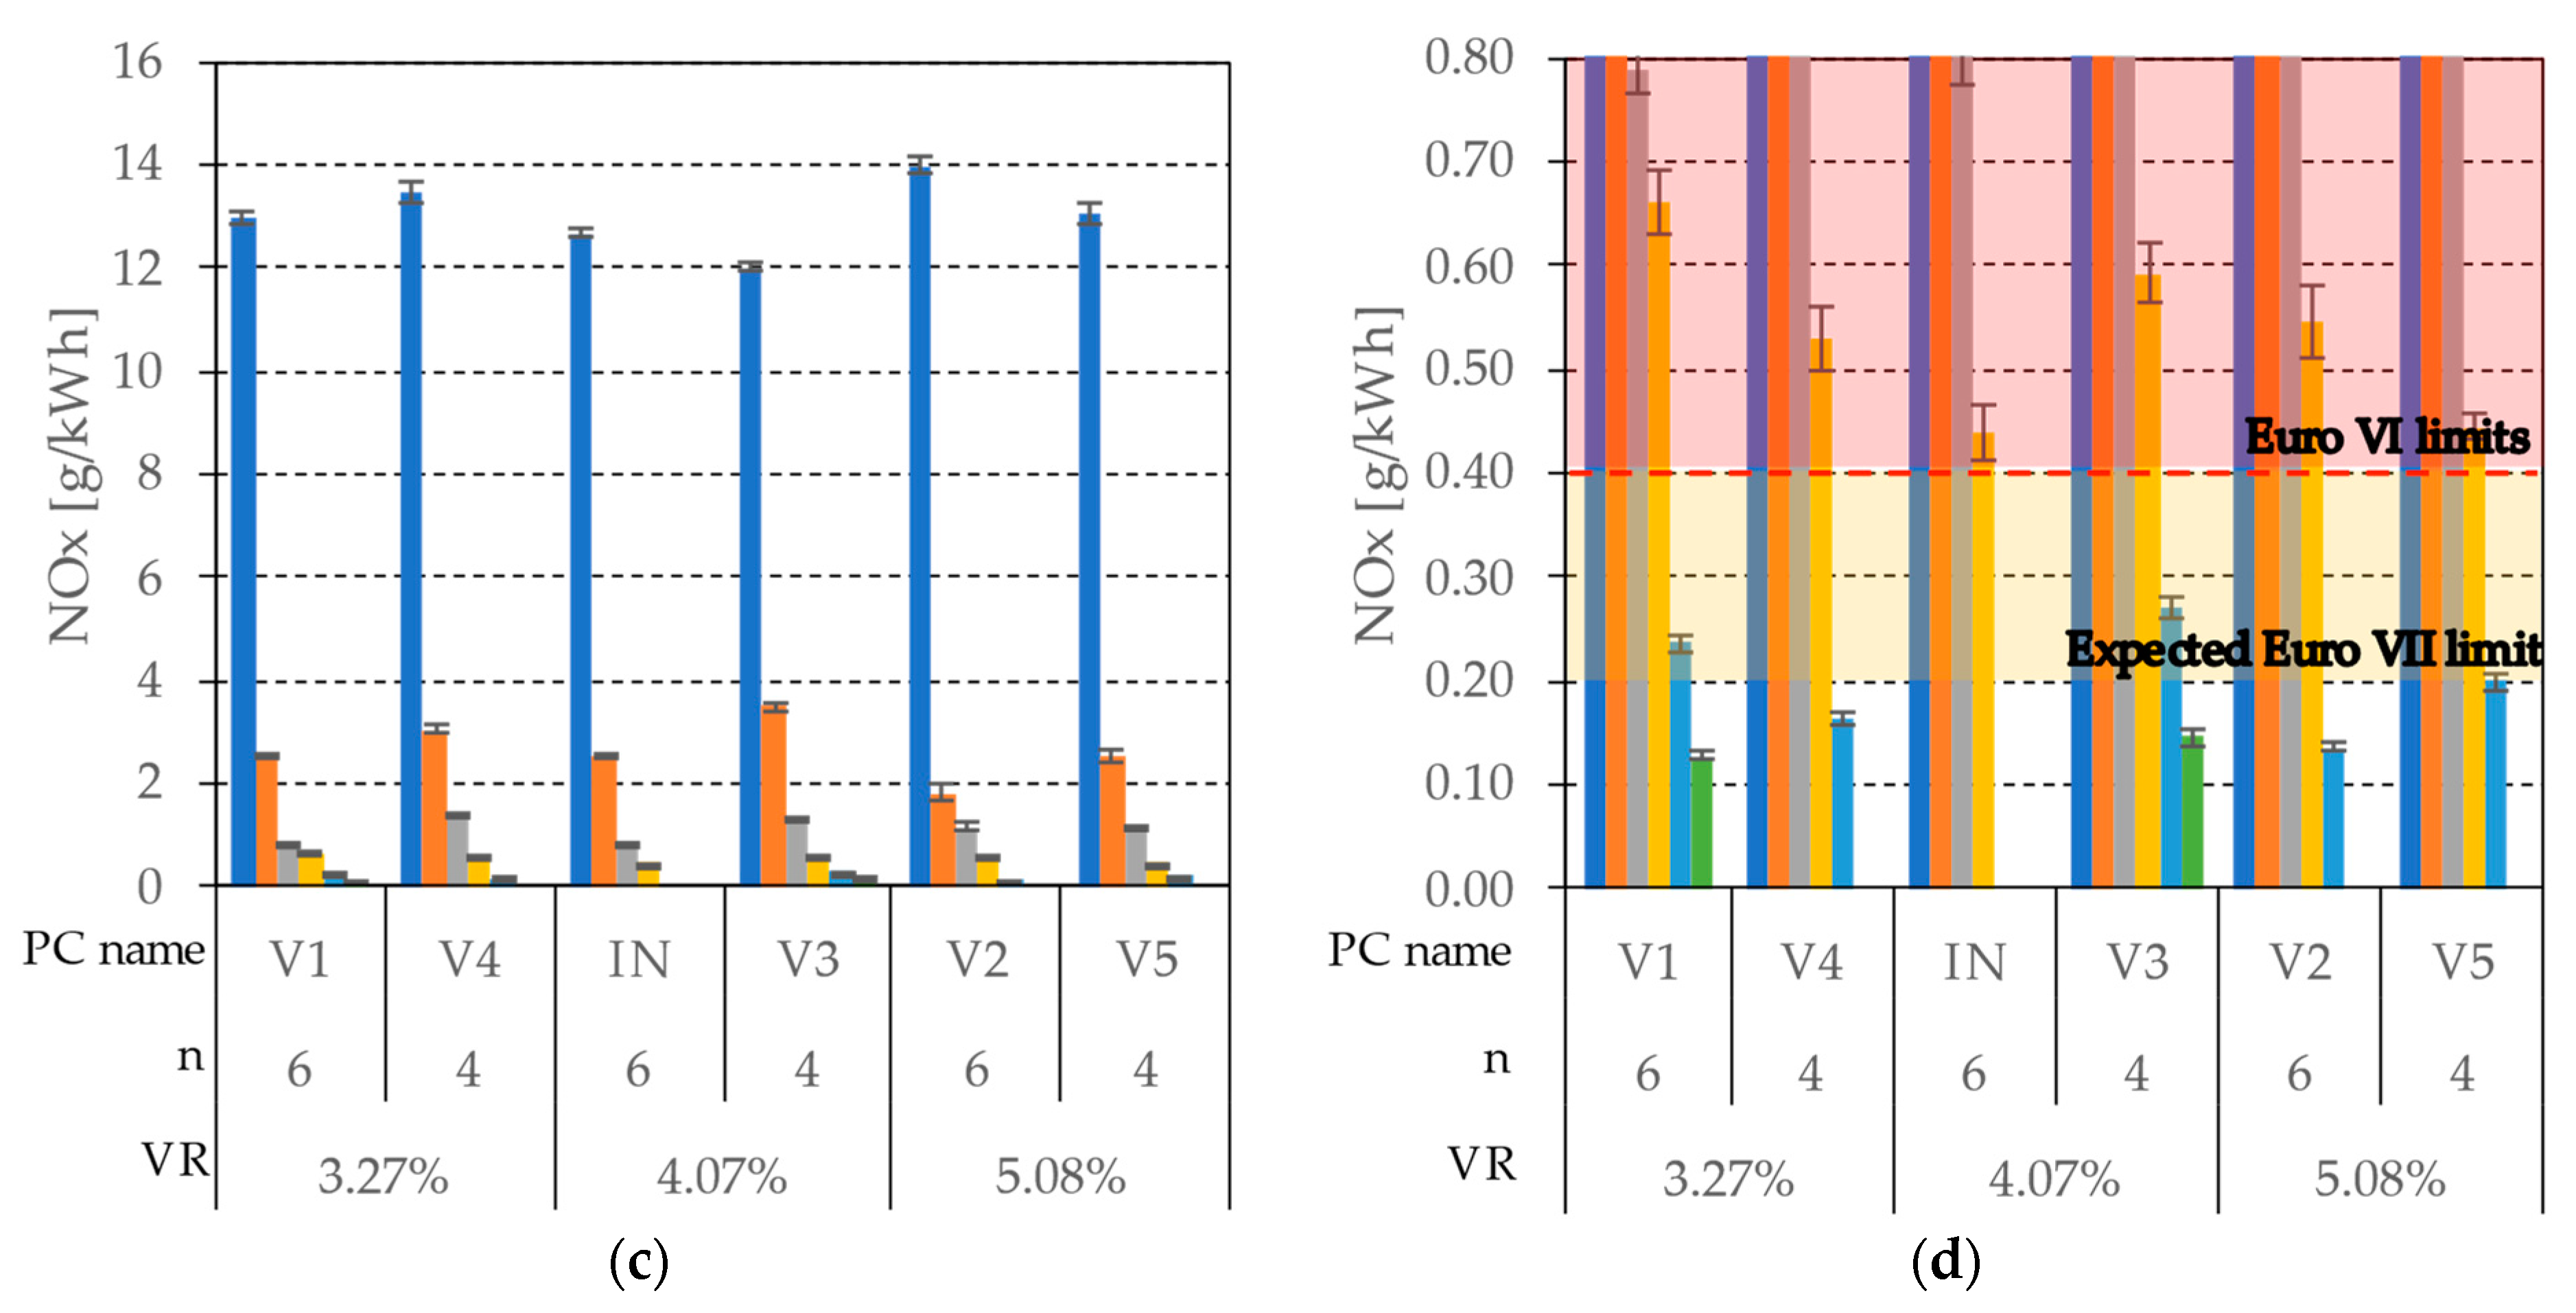
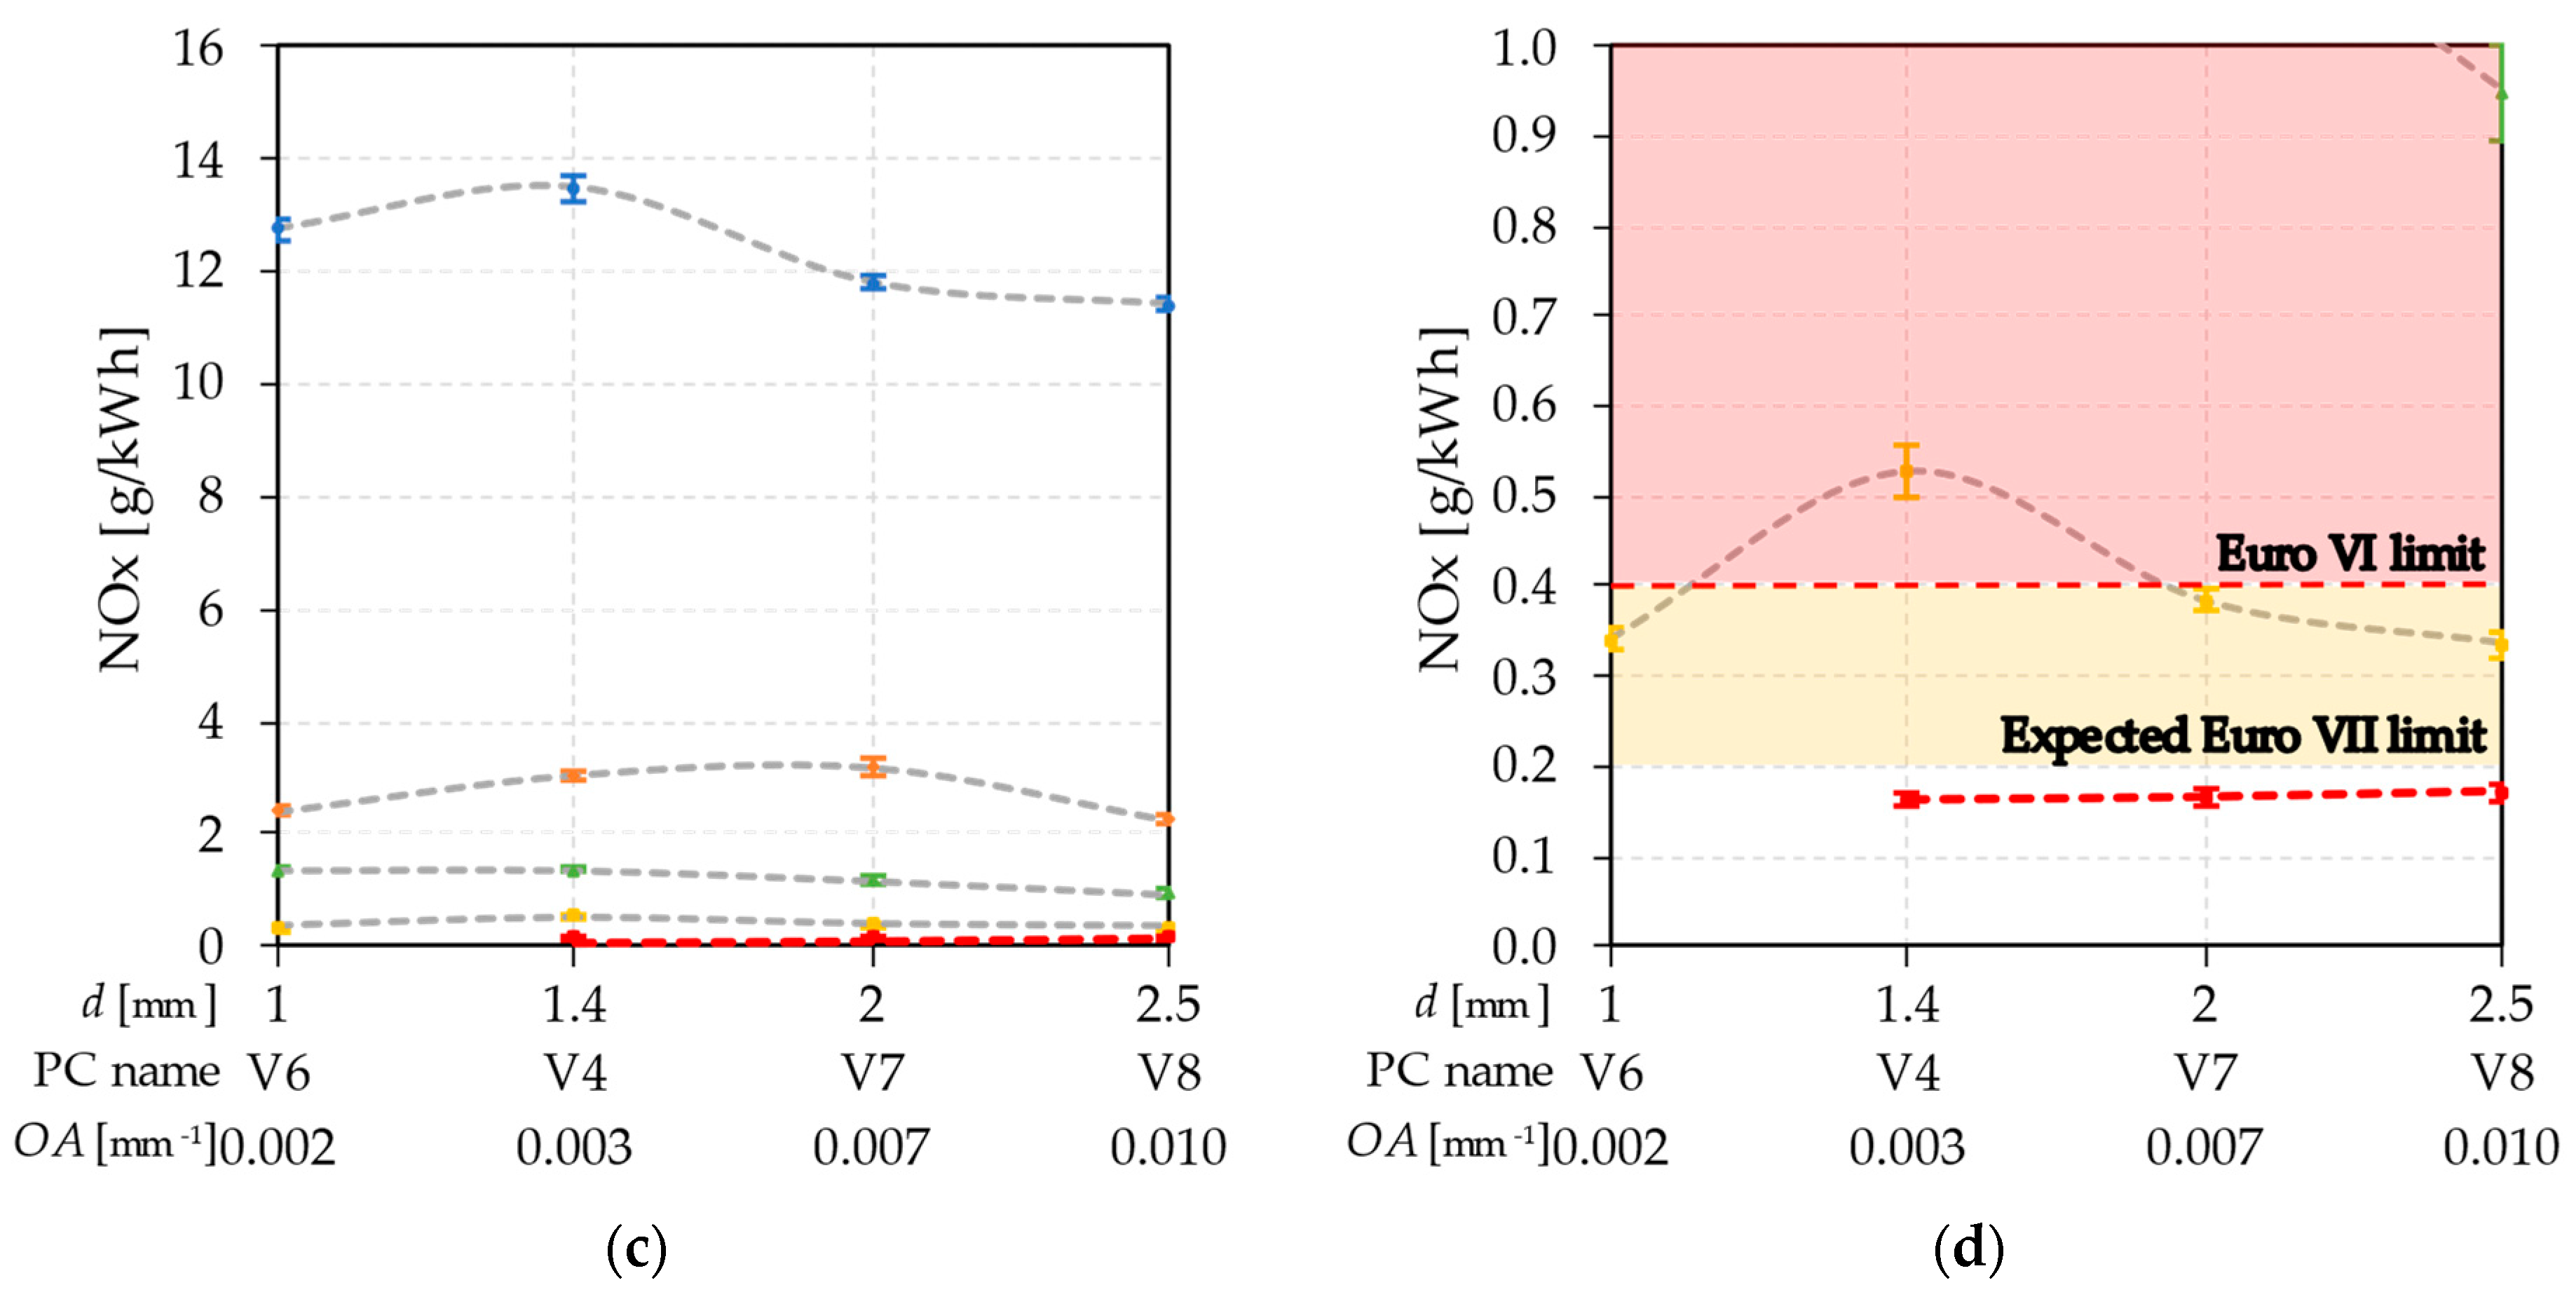
  • The THC emission values showed a trend where PC types with a larger number of orifices emitted lower emissions THC emissions, which corresponds with PC types that yielded higher indicated efficiencies. Similar trends can be observed in case of CO emissions. On the other hand, the NOx emissions do not show a clear trend regarding volume ratio and orifice number influence. The orifice area ratio (OA) suggested by the literature yielded the overall lowest emission values. In the case of NOx emissions, the opposite trend was observed, with emission values decreasing with the increase in OA values;
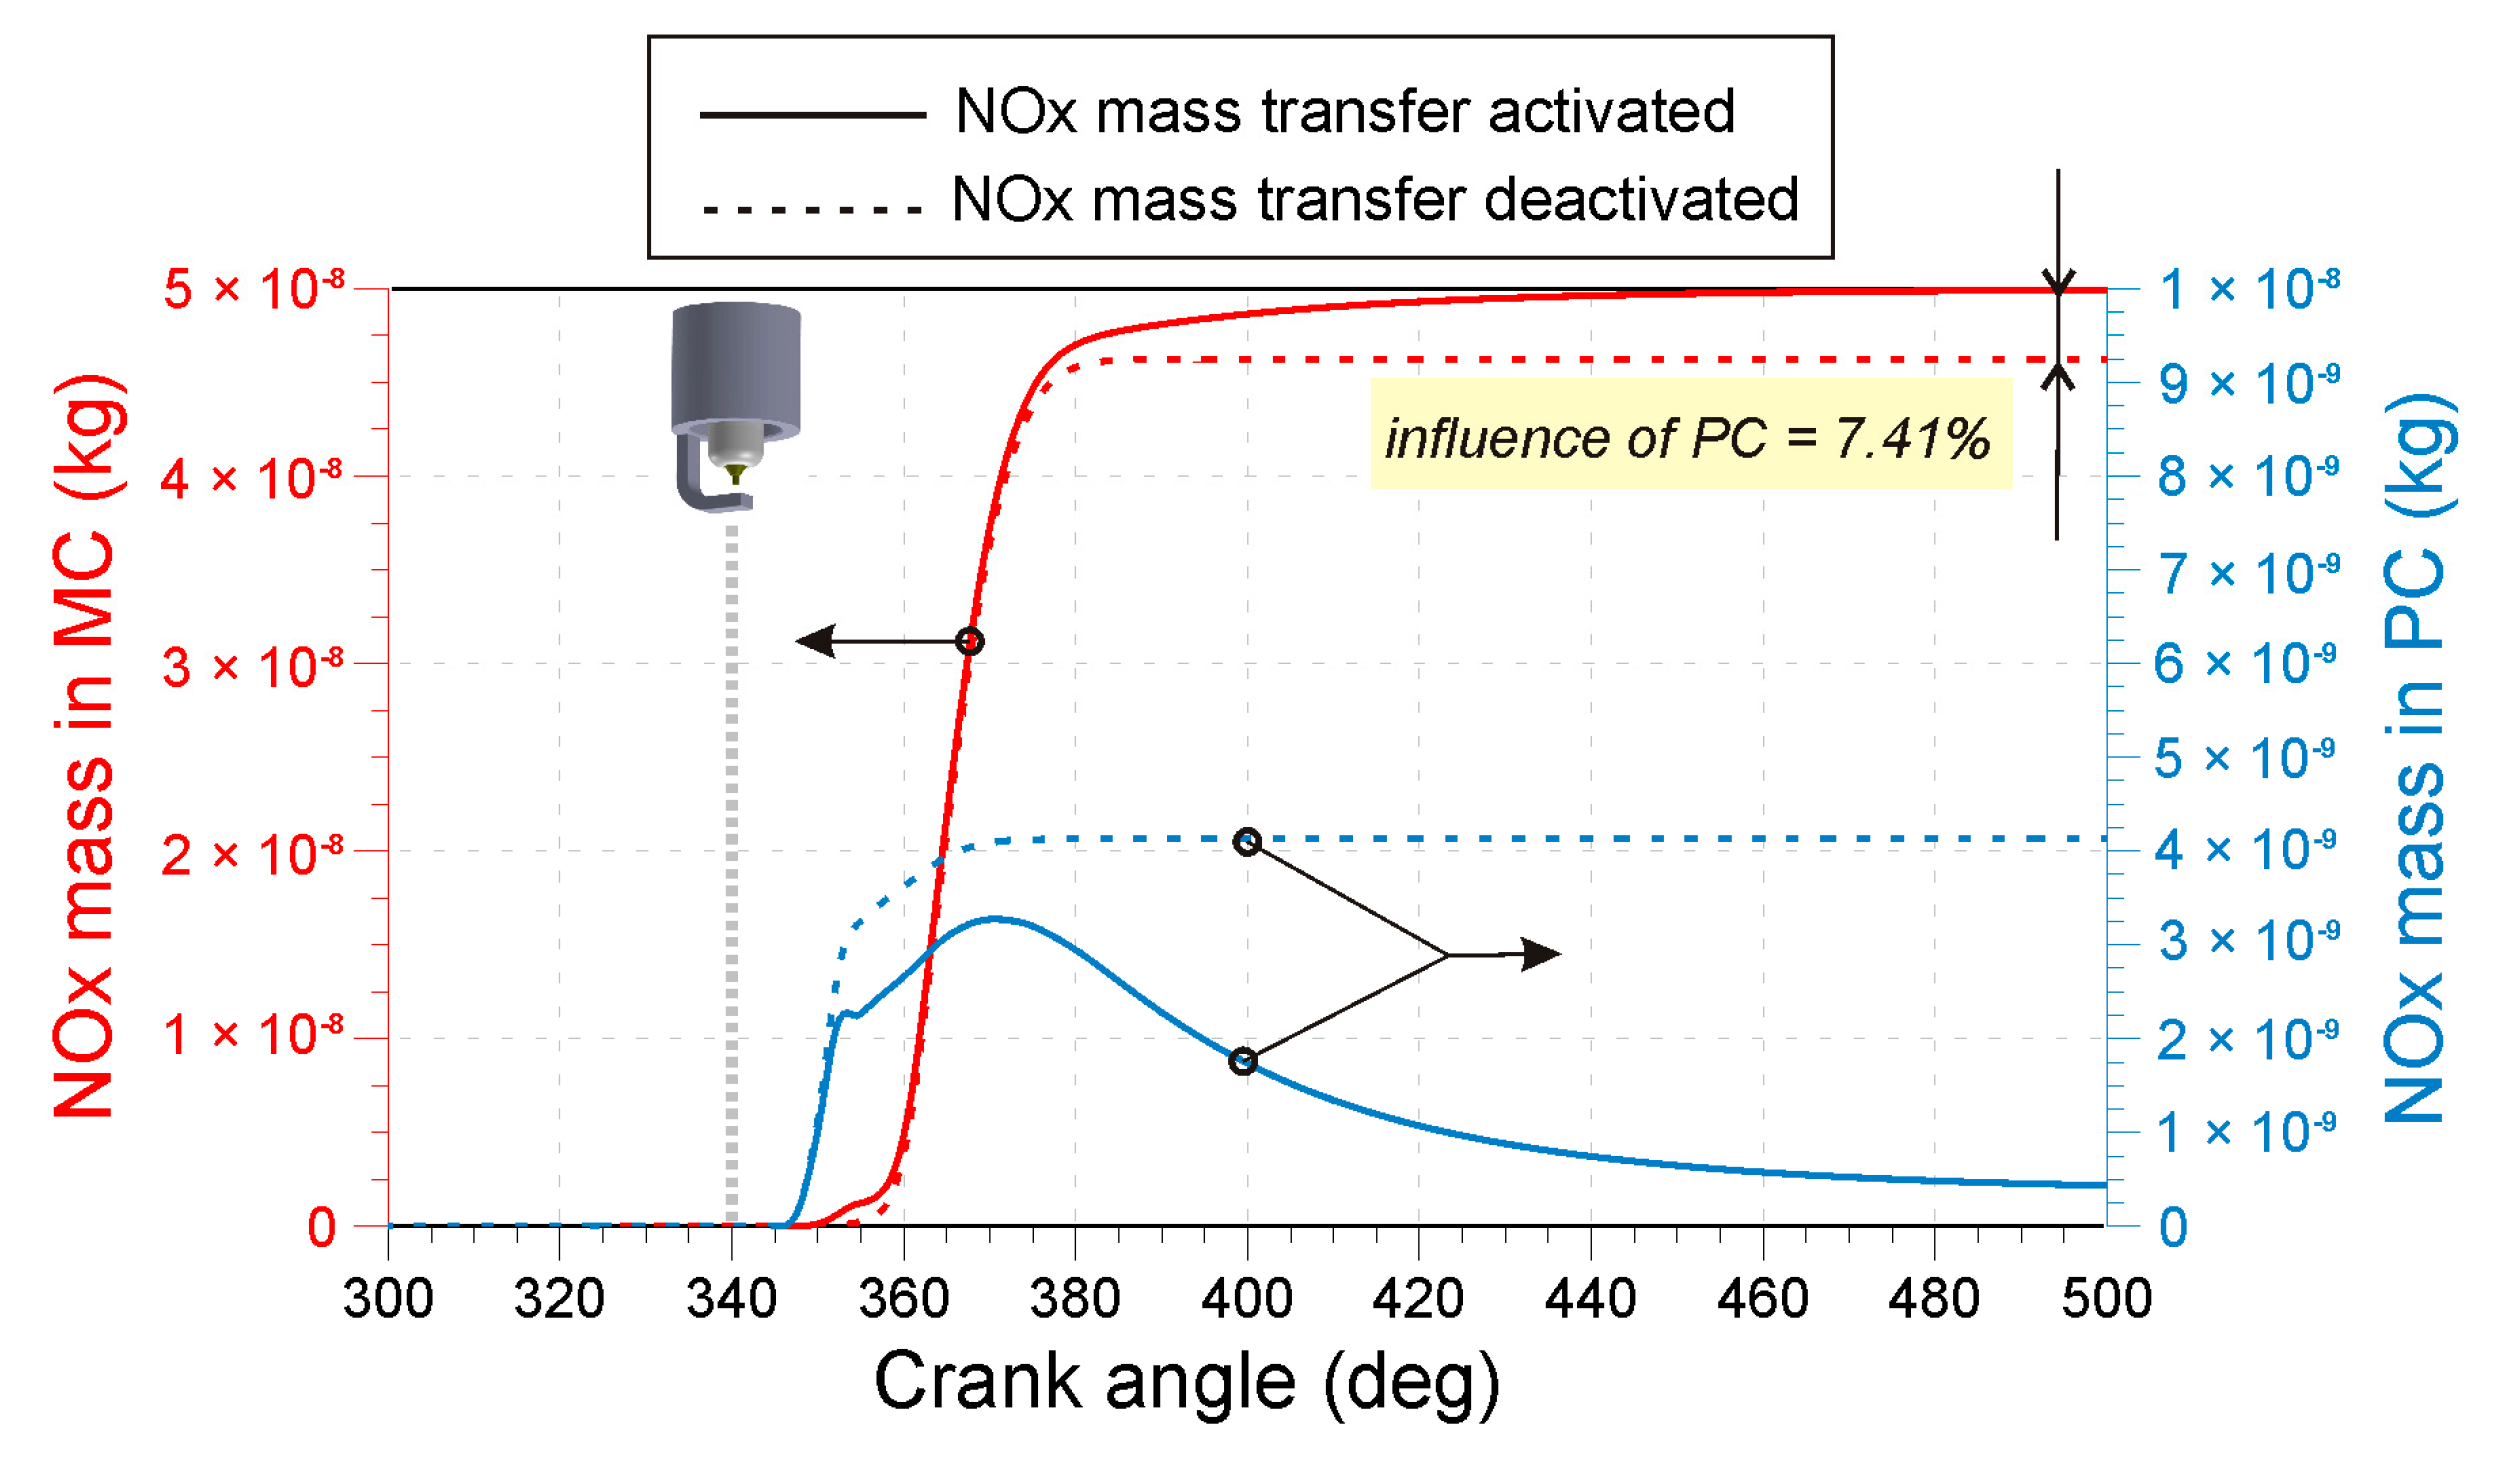
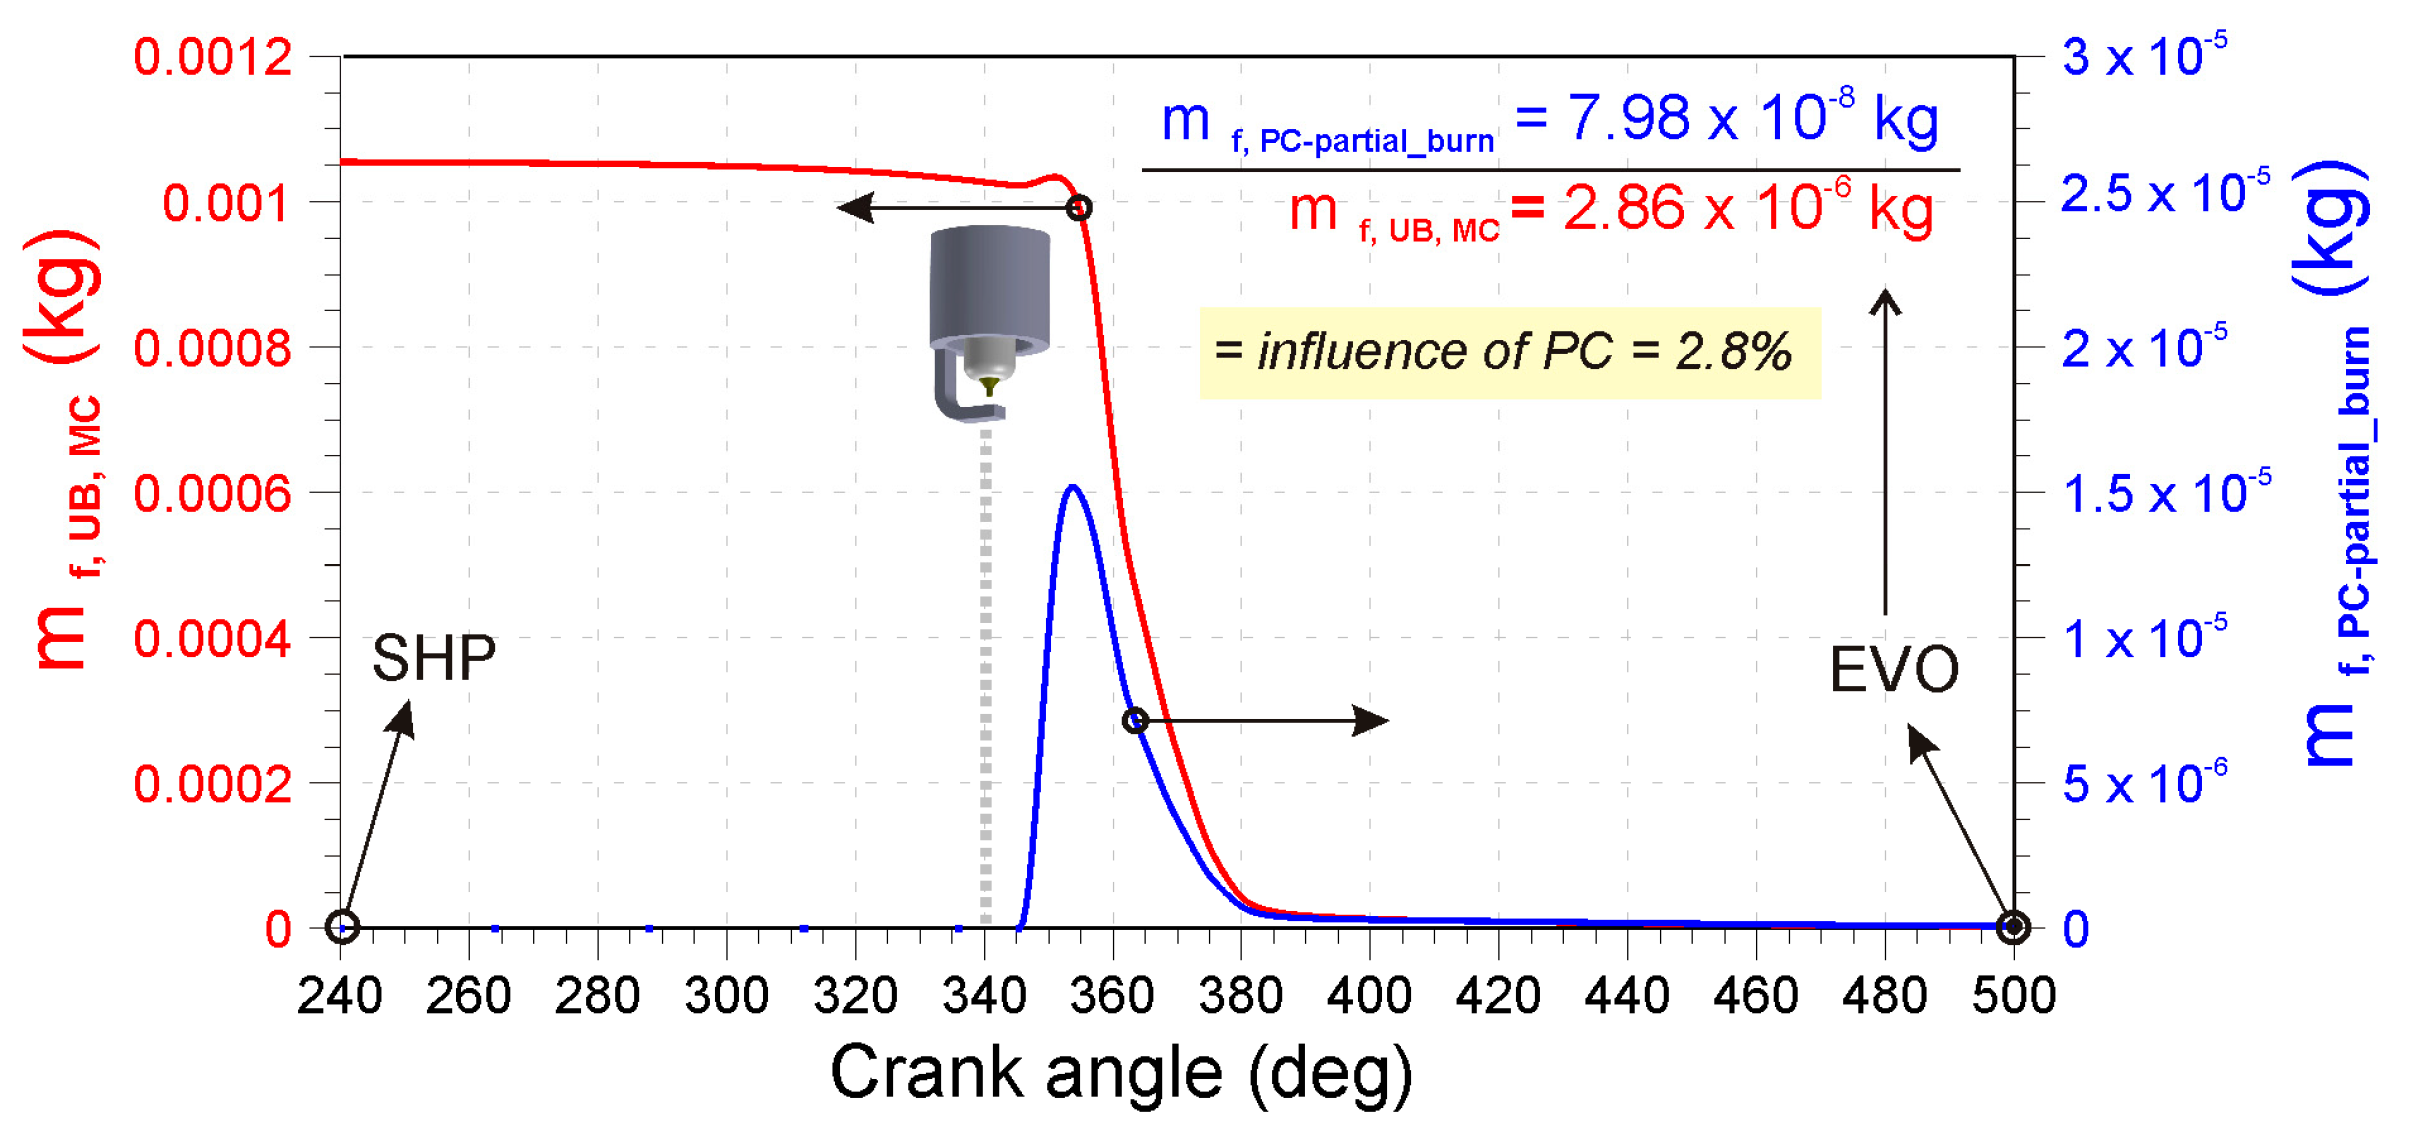
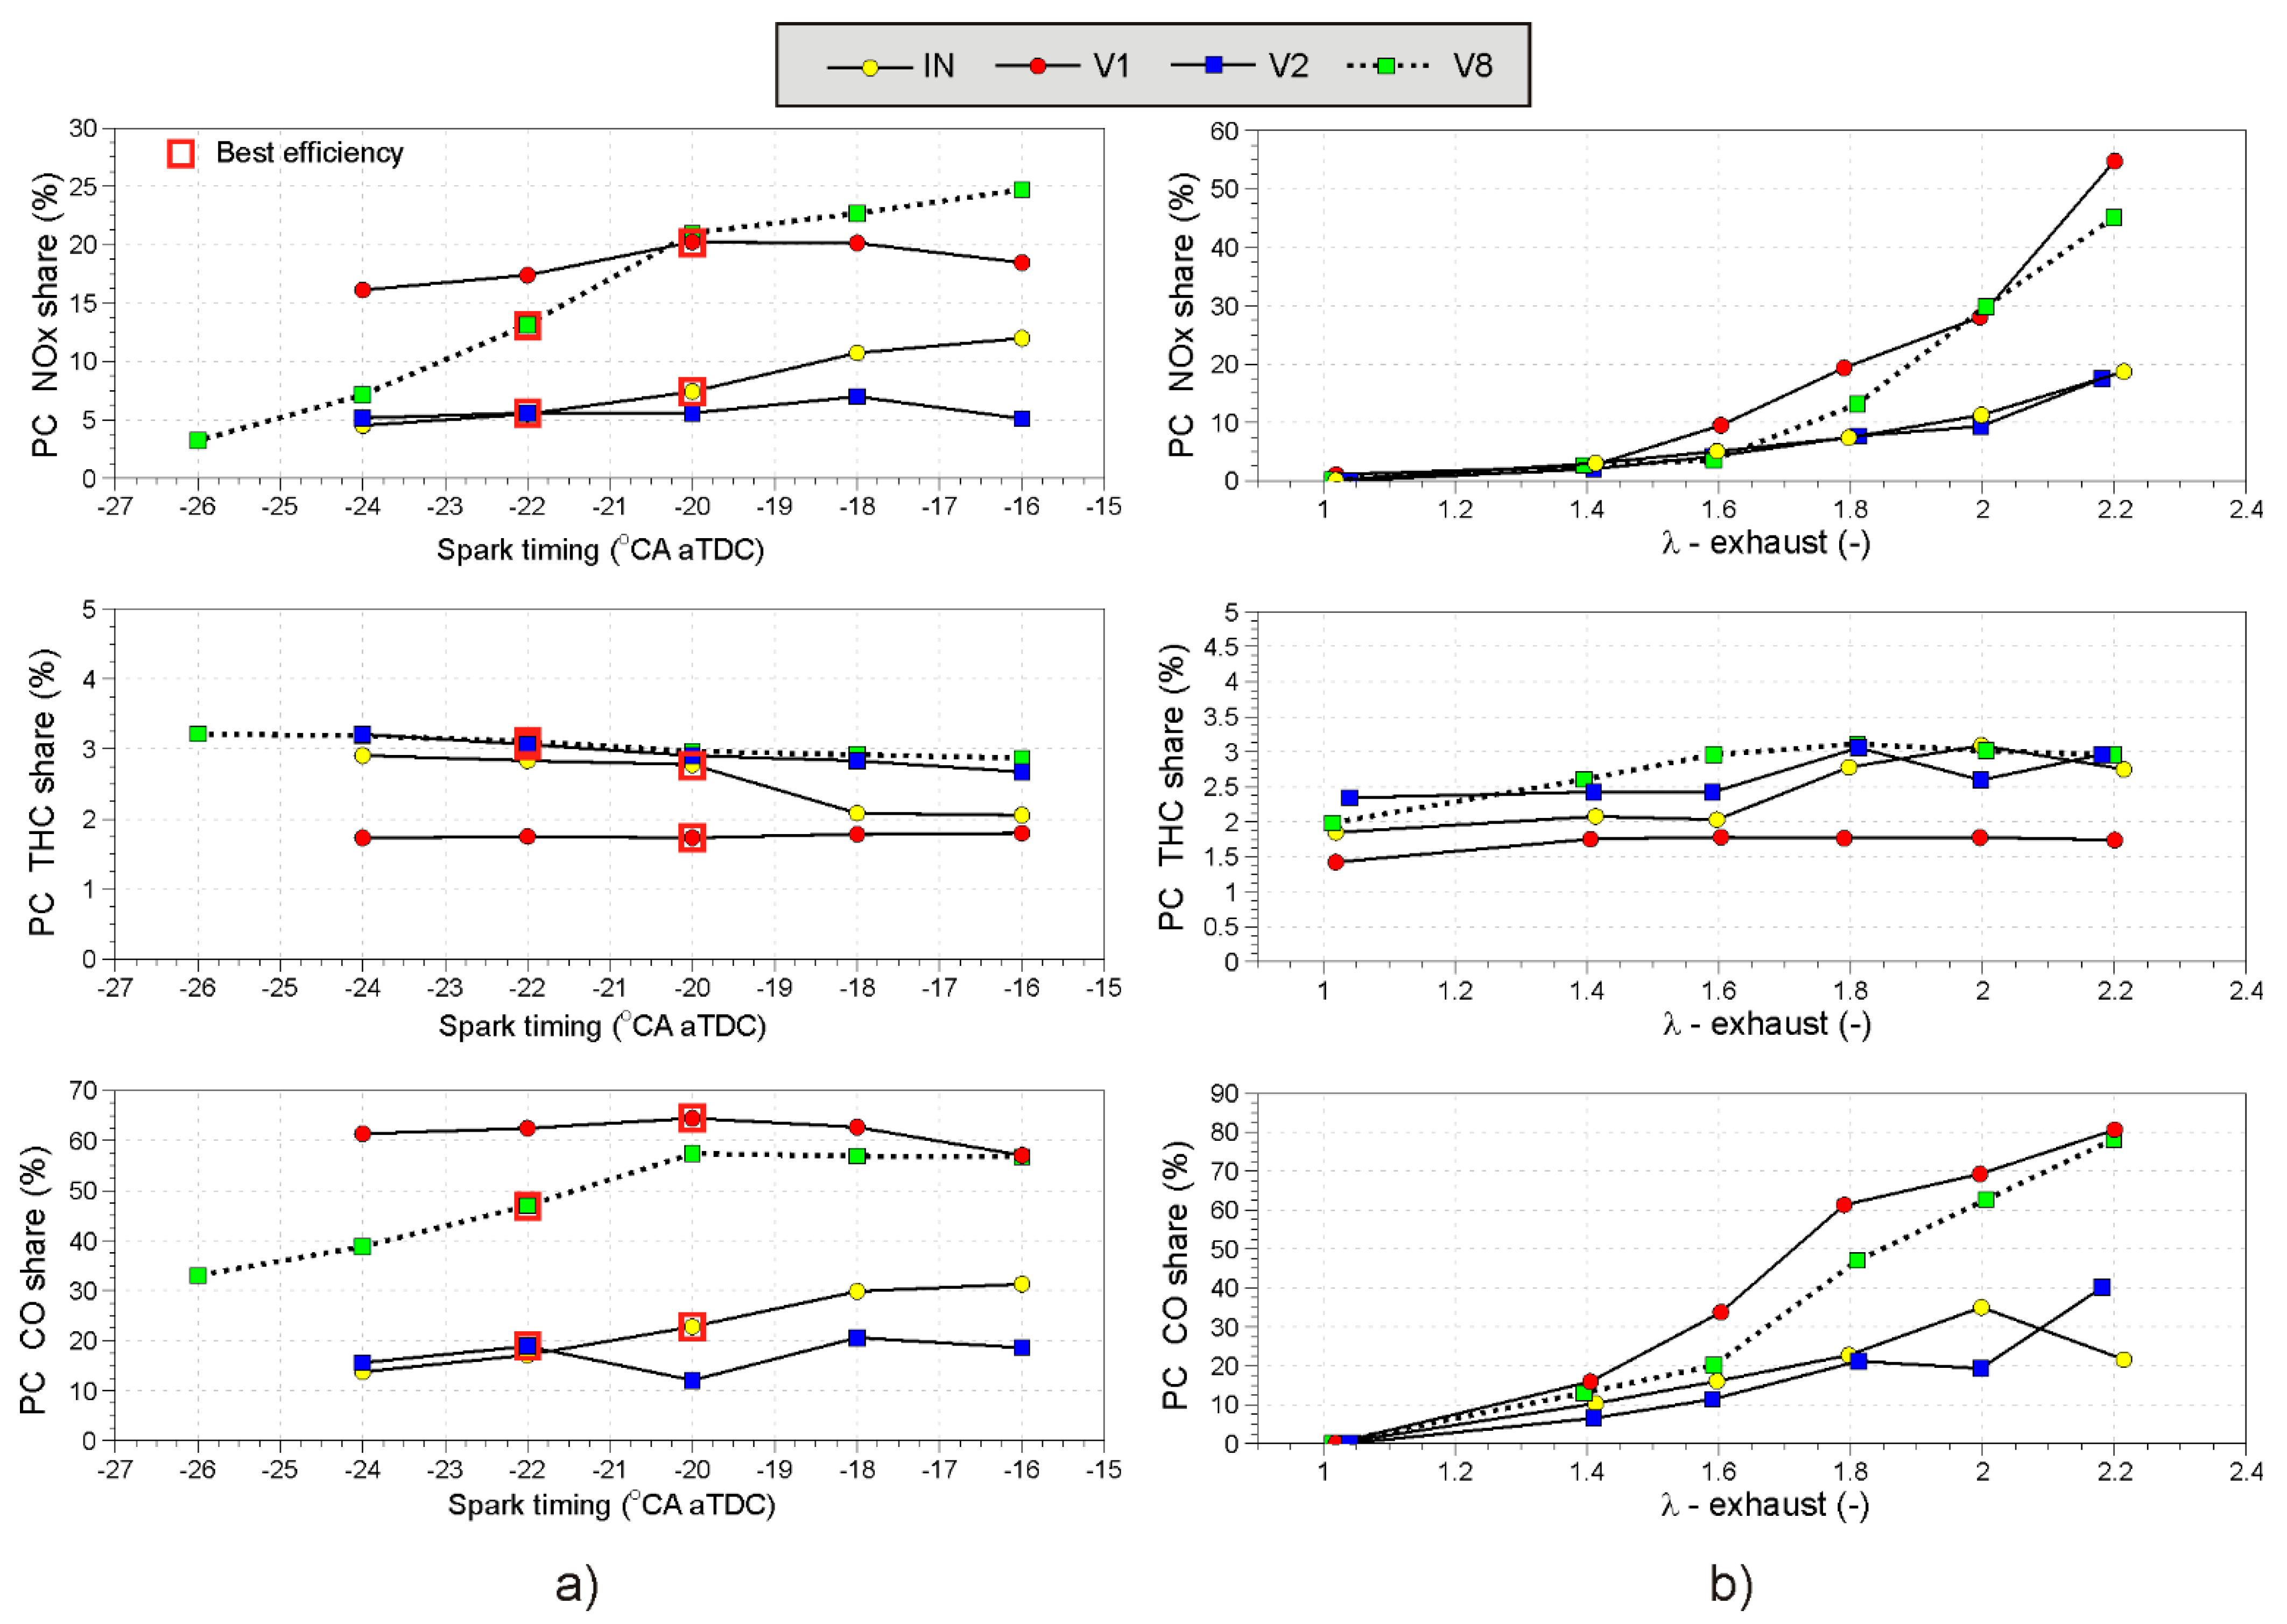
  • The numerical analysis of the pre-chamber emission shares showed that when PC volume was lower, PC emission shares of NOX and CO became larger. The influence of orifice number and size had a minor effect on the pre-chamber emissions shares. The maximum PC emission shares of 54.8% and 80.6% were achieved at a lean limit (λ = 2.2) for NOX and CO, respectively. THC emission share, on the other hand, was not affected in a significant manner either by the pre-chamber geometry or by the operating conditions.
Future research activities will include the employment of the best PC variant (from this study) and research on PC engine operation with the application of alternative fuel (natural gas), the effect of exhaust gas recirculation, and the potential of a three-way catalyst application for the reduction of tail pipe emissions. Additionally, PC scavenging with an additional air supply system and with the adoption of a fuel injector strategy will be studied to increase combustion stability.

Author Contributions

Conceptualization, R.T., M.S. and J.K.; methodology and investigation, R.T. and M.S.; software and validation, M.S., S.U. and J.K.; writing—original draft preparation, R.T. and M.S.; writing—review and editing, R.T. and M.S. All authors have read and agreed to the published version of the manuscript.

Funding

This research was funded by Croatian Science Foundation (HrZZ), grant number IP-2019-04-4900 under the project “Research on More Efficient and Environmentally Friendly Prechamber Spark Ignition Combustion (EF-PRECOM)“.

Data Availability Statement

The data presented in this study are available on request from the corresponding author.

Acknowledgments

The authors are very grateful to BorgWarner company, especially to Gavin Dober and Ludovic Peron, for the support with fuel injectors used in the PC. The authors are additionally grateful to Viktor Dilber for performing the measurements at experimental testbed.

Conflicts of Interest

The authors declare no conflict of interest.

References

  1. Attard, W.P.; Fraser, N.; Parsons, P.; Toulson, E. A Turbulent Jet Ignition pre-chamber combustion system for large fuel economy improvements in a modern vehicle powertrain. SAE Int. J. Engines 2010, 3, 20–37. [Google Scholar] [CrossRef] [Green Version]
  2. Bunce, M.; Blaxill, H. Sub-200 g/kWh BSFC on a Light Duty Gasoline Engine; SAE Technical Papers; SAE International: Warrendale, PA, USA, 2016; Volume 2016. [Google Scholar] [CrossRef]
  3. Stadler, A.; Wessoly, M.; Blochum, S.; Härtl, M.; Wachtmeister, G. Gasoline Fueled Pre-Chamber Ignition System for a Light-Duty Passenger Car Engine with Extended Lean Limit. SAE Int. J. Engines 2019, 12, 323–339. [Google Scholar] [CrossRef]
  4. Müller, C.; Morcinkowski, B.; Schernus, C.; Habermann, K.; Uhlmann, T. Development of a Pre-chamber for Spark Ignition Engines in Vehicle Applications. In Proceedings of the Ignition Systems for Gasoline Engines: 4th International Conference, Berlin, Germany, 6–7 December 2018; pp. 261–274. [Google Scholar]
  5. Schumacher, M.; Russwurm, T.; Wensing, M. Pre-chamber Ignition System for Homogeneous Lean Combustion Processes with Active Fuelling by Volatile Fuel Components. In Proceedings of the Ignition Systems for Gasoline Engines: 4th International Conference, Berlin, Germany, 6–7 December 2018; pp. 292–310. [Google Scholar]
  6. Baumgartner, L.S.; Karmann, S.; Backes, F.; Stadler, A.; Wachtmeister, G. Experimental Investigation of Orifice Design Effects on a Methane Fuelled Prechamber Gas Engine for Automotive Applications; SAE International: Warrendale, PA, USA, 2017. [Google Scholar] [CrossRef]
  7. Shah, A.; Tunestal, P.; Johansson, B. Effect of Pre-Chamber Volume and Nozzle Diameter on Pre-Chamber Ignition in Heavy Duty Natural Gas Engines; SAE Technical Papers; SAE International: Warrendale, PA, USA, 2015; Volume 2015. [Google Scholar] [CrossRef]
  8. Gussak, L.A.; Turkish, M.C.; Siegla, D.C. High Chemical Activity of Incomplete Combustion Products and a Method of Prechamber Torch Ignition for Avalanche Activation of Combustion in Internal Combustion Engines. SAE Trans. 1975, 84, 2421–2445. [Google Scholar] [CrossRef]
  9. Gussak, L.A.; Karpov, V.P.; Tikhonov, Y.V. The Application of Lag-Process in Prechamber Engines. SAE Trans. 1979, 88, 790527–790858. [Google Scholar] [CrossRef]
  10. Gussak, L.A. The Role of Chemical Activity and Turbulence Intensity in Prechamber-Torch Organization of Combustion of a Stationary Flow of a Fuel-Air Mixture; SAE International: Warrendale, PA, USA, 1983. [Google Scholar] [CrossRef]
  11. Yusuf, A.A.; Inambao, F.L.; Farooq, A.A. Impact of n-butanol-gasoline-hydrogen blends on combustion reactivity, performance and tailpipe emissions using TGDI engine parameters variation. Sustain. Energy Technol. Assess. 2020, 40, 100773. [Google Scholar] [CrossRef]
  12. Hlaing, P.; Marquez, M.E.; Burgos, P.; Cenker, E.; Houidi, M.B.; Johansson, B. Analysis of Fuel Properties on Combustion Characteristics in a Narrow-Throat Pre-Chamber Engine. SAE Int. J. Adv. Curr. Prac. Mobil. 2021, 3, 3020–3043. [Google Scholar] [CrossRef]
  13. Aljabri, H.; Silva, M.; Houidi, M.B.; Liu, X.; Allehaibi, M.; Almatrafi, F.; AlRamadan, A.S.; Mohan, B.; Cenker, E.; Im, H.G. Comparative Study of Spark-Ignited and Pre-Chamber Hydrogen-Fueled Engine: A Computational Approach. Energies 2022, 15, 8951. [Google Scholar] [CrossRef]
  14. Sandoval, M.H.B.; Alvarez, C.E.C.; Roso, V.R.; Santos, N.D.S.A.; Valle, R.M. The influence of volume variation in a homogeneous prechamber ignition system in combustion characteristics and exhaust emissions. J. Braz. Soc. Mech. Sci. Eng. 2020, 42, 72. [Google Scholar] [CrossRef]
  15. Onofrio, G.; Napolitano, P.; Tunestål, P.; Beatrice, C. Combustion sensitivity to the nozzle hole size in an active pre-chamber ultra-lean heavy-duty natural gas engine. Energy 2021, 235, 121298. [Google Scholar] [CrossRef]
  16. Pan, J.; He, Y.; Li, T.; Wei, H.; Wang, L.; Shu, G. Effect of temperature conditions on flame evolutions of turbulent jet ignition. Energies 2021, 14, 2226. [Google Scholar] [CrossRef]
  17. Gingrich, J.W.; Olsen, D.B.; Puzinauskas, P.; Willson, B.D. Precombustion chamber NOx emission contribution to an industrial natural gas engine. Int. J. Engine Res. 2006, 7, 41–49. [Google Scholar] [CrossRef]
  18. Accurso, F.; Piano, A.; Millo, F.; Caputo, G.; Cimarello, A.; Cafari, A. Numerical Simulation of a Prechamber-Ignited Lean-Burn Gas Engine by means of Predictive Combustion Models. SAE Int. J. Engines 2022, 16. [Google Scholar] [CrossRef]
  19. Dilber, V.; Sjerić, M.; Tomić, R.; Krajnović, J.; Ugrinić, S.; Kozarac, D. Optimization of Pre-Chamber Geometry and Operating Parameters in a Turbulent Jet Ignition Engine. Energies 2022, 15, 4758. [Google Scholar] [CrossRef]
  20. Ugrinić, S.; Dilber, V.; Sjeric, M.; Kozarac, D.; Krajnovic, J.; Tomic, R. Experimental Study of Pre-Chamber Geometry Influence on Performance and Emissions in a Gasoline Spark Ignited Engine; SAE International: Warrendale, PA, USA, 2022. [Google Scholar] [CrossRef]
  21. Kozarac, D.; Tomic, R.; Taritas, I.; Chen, J.-Y.; Dibble, R.W. A Model for Prediction of Knock in the Cycle Simulation by Detail Characterization of Fuel and Temperature Stratification. SAE Int. J. Engines 2015, 8, 1520–1534. [Google Scholar] [CrossRef]
  22. Fischer, M.; Günther, M.; Röpke, K.; Lindemann, M.; Placzek, R. Klopferkennung im Ottomotor. MTZ—Mot. Z. 2003, 64, 186–195. [Google Scholar] [CrossRef]
  23. Krajnovic, J.; Dilber, V.; Sjeric, M.; Tomic, R.; Vucetic, A.; Kozarac, D. Development of Numerical Framework for Research of the Pre-Chamber SI Combustion; SAE International: Warrendale, PA, USA, 2022. [Google Scholar] [CrossRef]
  24. Sjerić, M.; Krajnović, J.; Vučetić, A.; Kozarac, D. Influence of Swirl Flow on Combustion and Emissions in Spark-Ignition Experimental Engine. J. Energy Eng. 2021, 147, 04021014. [Google Scholar] [CrossRef]
  25. Mulholland, E.; Miller, J.; Bernard, Y.; Lee, K.; Rodríguez, F. The role of NOx emission reductions in Euro 7/VII vehicle emission standards to reduce adverse health impacts in the EU27 through 2050. Transp. Eng. 2022, 9, 100133. [Google Scholar] [CrossRef]
Figure 1. Illustration of applied methodology to define operating points with best indicated efficiency with imposed knock and combustion stability limits.
Energies 16 02884 g001
Figure 2. Experimental setup: (a) layout of the experimental setup: (1) IC Engine, (2) Pre-chamber Assembly, (3) AC Dyno, (4) Catalyst, (5) Exhaust pipe valve, (6) EGR cooler, (7) EGR valve, (8) Port fuel injector, (9) Throttle, (10) Air tank, (11) Intake mass flow meter, (12) Fuel tank, (13) Fuel scale, (14) Air driven high-pressure pump, (15) Intake air heater; and (b) section of the engine combustion system.
Energies 16 02884 g002
Figure 3. Pre-chamber ignition system: (a) pre-chamber system assembly; and (b) the orifice cap and its features (number of orifices (n), orifice diameter (d) and orifice throat diameter (Dt)) that define the pre-chamber geometry.
Energies 16 02884 g003
Figure 4. Reduced 1D/0D simulation model of experimental engine.
Energies 16 02884 g004
Figure 5. Contribution of pre-chamber NOx on the total NOx emissions in main chamber—example for operating point at exhaust air excess ratio of 1.8.
Energies 16 02884 g005
Figure 6. Contribution of fuel mass from PC to MC on total partial burn effect in MC—example for operating point at exhaust air excess ratio of 1.8.
Energies 16 02884 g006
Figure 7. Influence of pre-chamber volume ratio (VR) and orifice number on engine performance: (a) indicated efficiency; (b) indicated mean effective pressure (IMEP); (c) combustion efficiency; and (d) combustion stability trough coefficient of variation of IMEP. For all PC types the orifice area to volume ratio OA = 0.003 mm−1.
Energies 16 02884 g007aEnergies 16 02884 g007b
Figure 8. Exhaust gas emissions: (a) THC; (b) CO; (c) NOx; and (d) NOx enlarged with legislative NOx limit. For all PC types the orifice area to volume ratio OA = 0.003 mm−1.
Energies 16 02884 g008aEnergies 16 02884 g008b
Figure 9. Influence of orifice diameters on performance engine performance: (a) indicated efficiency (shaded area is the OA area recommended by [9]); (b) IMEP; (c) combustion efficiency; and (d) combustion stability trough coefficient of variation of IMEP. All pre-chambers have an VR = 3.27% and 4 orifices.
Energies 16 02884 g009aEnergies 16 02884 g009b
Figure 10. Influence of orifice diameters on engine emissions: (a) THC (shaded area is the OA area recommended by [9]); (b) CO; (c) NOx; and (d) NOx enlarged with legislative NOx limit. All pre-chambers have an VR = 3.27% and 4 orifices.
Energies 16 02884 g010aEnergies 16 02884 g010b
Figure 11. Calibration of combustion model—comparisons of pre-chamber and main chamber pressure traces for pre-chamber design (IN) with: six orifices (a); and four orifices (b) at an exhaust air excess ratio of 1.8.
Energies 16 02884 g011
Figure 12. Pre-chamber emissions share evaluated from 1D/0D simulation model for different pre-chamber variants: (a) influence of spark sweeps at exhaust lambda equal to 1.8; and (b) influence of exhaust lambda sweep.
Energies 16 02884 g012
Table 1. Parameters of pre-chamber variants used in the study.
NameOrifice Number n [-]Volume [mm3]Volume Ratio VR [%]Orifice Diameter d [mm]Throat Diameter Dt [mm]Orifice Area to Volume Ratio OA [mm−1]Area to Volume Ratio [mm−1]
IN624004.071.3070.0030.016
V1619113.271.1550.0030.010
V2630275.081.4090.0030.021
V3424004.071.6070.0030.016
V4419113.271.4050.0030.010
V5430275.081.8090.0030.021
V6419113.271.0050.0020.010
V7419113.272.0050.0070.010
V8419113.272.5050.0100.010
Table 2. Overview of operating conditions.
ParameterSettings
Engine speed1600 rpm
Pre-chamber fuel injection duration0.3 ms
Pre-chamber fuel injection timing120 °CA bTDC
Port fuel injection timing190 °CA aTDC
Excess air ratio λ1.0, 1.4, 1.6, 1.8, 2.0, 2.2
Spark timingSweep limited by combustion stability and knock limit
Intake pressureambient (WOT)
Intake temperature33 °C
Fuel properties (commercial gasoline)lower heating value 42.63 MJ/kg; RON 95.4; density 741.7 kg/m3 at 15 °C
Table 3. Hatz 1D81Z engine technical data.
ParameterValue
Displacement667 cm3
Stroke85 mm
Bore100 mm
Connecting Rod length127 mm
Compression ratio12.8 (without the pre-chamber)
Number of Valves2
Inlet Valve Opens/Closes36 °CA BTDC/60 °CA ABDC
Exhaust Valve Opens/Closes54 °CA BBDC/21 °CA ATDC
Table 4. Specification of exhaust gas analyzers and accuracies.
GasAnalyzerRangeAccuracy
NOXECM NOX 5210tNOX: 0–5000 ppm±5 ppm (0–200 ppm)
±20 ppm (200–1000 ppm)
±2% (>1000 ppm)
λ: 0.4–25±0.008 (at λ = 1)
±0.016 (0.8 < λ < 1.2)
O2: 0–25%±0.4 (0 % < O2 < 2%)
THCEnvironnement Graphite 52M0–10,000 ppm<1% of measured value at range 15–100% of full scale (FS)
COEnvironnement MIR 2M10–50,000 ppmZero drift: <1% FS/24 h
Span drift: <1% FS/24 h
CO2Environnement MIR 2M100–250,000 ppmLinearity: <1% for range 20–100% FS
Disclaimer/Publisher’s Note: The statements, opinions and data contained in all publications are solely those of the individual author(s) and contributor(s) and not of MDPI and/or the editor(s). MDPI and/or the editor(s) disclaim responsibility for any injury to people or property resulting from any ideas, methods, instructions or products referred to in the content.

