Article

Optimal Energy Management for Virtual Power Plant Considering Operation and Degradation Costs of Energy Storage System and Generators

by
Kanjanapon Borisoot
1,
Rittichai Liemthong
2,
Chitchai Srithapon
3 and
Rongrit Chatthaworn
1,4,*
1
Department of Electrical Engineering, Faculty of Engineering, Khon Kaen University, Khon Kaen 40002, Thailand
2
Business Development Engineer, Sermsang Power Corporation Public Company Limited, Bangkok 10300, Thailand
3
Department of Electrical Engineering, KTH Royal Institute of Technology, SE-100 44 Stockholm, Sweden
4
Center for Alternative Energy Research and Development, Khon Kaen University, Khon Kaen 40002, Thailand
*
Author to whom correspondence should be addressed.
Energies 2023, 16(6), 2862; https://doi.org/10.3390/en16062862
Submission received: 24 January 2023 / Revised: 14 March 2023 / Accepted: 16 March 2023 / Published: 20 March 2023

Abstract

:
Even though generating electricity from Renewable Energy (RE) and electrification of transportation with Electric Vehicles (EVs) can reduce climate change impacts, uncertainties of the RE and charged demand of EVs are significant challenges for energy management in power systems. To deal with this problem, this paper proposes an optimal energy management method using the Virtual Power Plant (VPP) concept for the power system considering solar PhotoVoltaics (PVs) and Electric Vehicle Charging Stations (EVCS). The Differential Evolution (DE) algorithm is applied to manage energy in the power system to minimize the operation cost of generators and degradation costs in Energy Storage Systems (ESS) and generators. The effectiveness of the proposed approach is examined and tested on the IEEE 24 bus Reliability Test System (RTS 24) using the MATPOWER tool on the MATLAB program for calculating Optimal Power Flow (OPF). In this study, two situations before and after applying the proposed method are considered. The simulation results demonstrate that a branch constraint violation occurs before using optimal energy management using the VPP concept. In order to solve this issue, the DE algorithm for optimal energy management using the VPP concept is applied by dividing the studied case into two subcases as follows. For the first subcase, two objectives consisting of the minimization of the generator operation cost and the minimization of the battery degradation cost in ESS are considered. In the second case, three objectives comprising the two mentioned objectives with the minimization of generator degradation cost are considered. The results demonstrate that branch constraint violations can be avoided by applying optimal energy management using the VPP concept. This study also suggests considering the generator degradation cost in the objective function, which can minimize the total costs by 7.06% per day compared with the total cost of the first case.

1. Introduction

In the near future, the demand for Electric Vehicles (EVs) in Thailand is expected to increase, as stated in the Energy Efficiency Plan (EEP 2018) of the Thailand government [1]. Promoting Electric Vehicles (EVs) is one of the measures aimed at reducing pollution in urban areas. However, to support the high demand for EVs, it will be necessary to increase the installation of Electric Vehicle Charging Stations (EVCS) in the power systems. Additionally, the Thai government has proposed a policy to promote the use of Renewable Energy (RE), particularly solar PhotoVoltaics (PVs), for electricity generation through the Alternative Energy Development Plan 2018 (AEDP 2018) [2]. Although generating power from Renewable Energy Sources (RESs) can reduce air pollution, there are limitations in terms of time and weather conditions for power generation. Uncertainties such as the uncertain generation of RE, grid instability, and variations in load operating situations in a system may affect the stability of the power system, resulting in frequency and voltage deviations. Aziz et al. (2019) [3] studied Load Frequency Control (LFC) using variable universe fuzzy logic control to mitigate the impact of load disturbances on control performance. This presents a challenge for the system operator in controlling the power system operation. From previous research works, Cheng et al. (2022) [4] studied the issue of finite-time dissipative asynchronous output feedback control for a wind turbine system using a hidden Markov model to provide some estimated modes information for controlling. In addition, Jiang et al. (2022) [5] studied the problem of adaptive optimal output regulation with assured convergence rate requirements under the challenges posed by an unknown system using the value iteration method. They proposed a different algorithm to achieve optimal output control, which is a fundamental problem in control engineering, particularly in the presence of power uncertainties. This presents a challenge for system operators in controlling power system operations. However, having an efficient Energy Management System (EMS) can deal with this uncertainty. Aziz et al. (2019) [6] proposed an algorithm for the distributed optimization of a hybrid Multi-Terminal Direct Current (MTDC) power grid using the Alternating Direction Method of Multipliers (ADMM) together with Optimal Power Flow (OPF) designed to consider constraints for power systems and to achieve a Smooth Operation Point (SOP) and minimal line losses. The main goal of OPF calculation is to minimize the operational cost of the power system while ensuring that it meets various operational constraints, such as power balance, voltage limits, and current limits at the branch. This approach is suitable for use in conjunction with EMS for power systems. One of the recent popular ideas to solve this problem is the Virtual Power Plant (VPP), a technology that can gather dispersed energy sources in the form of DG, controllable loads, and storage systems [7]. The DG can include both fossil fuel generators and Renewable Energy Sources (RES). However, certain types of DGs, such as solar PV sources, may have small capacity and uncertainty [8]. These factors can create challenges for power system operation and market participation [9]. In order to maintain the stability of power systems and address the issue of RE penetration in power systems, the system operator manages the gathered power from diverse RES to ensure the consistency and reliability of the energy supplied by renewable energy power plants. The coordination of power flows from DG, controllable loads, and energy storage is the foundation of a VPP. The communication in a VPP is two-way, allowing the system to transmit signals to dispatch power and receive the status of each generator and controllable load [10].
In the modern era, VPP is a widely recognized idea to solve the uncertainty of RES and has been presented by several works in the literature as follows. Kasaei et al. (2017) proposed a metaheuristic algorithm to determine the optimal power management of a VPP with RESs, battery energy storage, and controlling load [11]. Othman et al. (2017) proposed the big bang big crunch method, an algorithm for solving the optimization problem to find the suitable location and power dispatch of Distributed Energy Resources (DERs) installed in a power grid [10]. Also, Naval et al. (2020) proposed a method to reduce the dependence on electricity from the main grid by optimal management of VPPs consisting of various RESs, such as wind power, hydropower, and solar power. This model was applied to the operation of the irrigation power control center in Aragon (Spain) [12]. In addition, Wu et al. (2020) studied the analysis of the electricity market trading mechanism and the cost risk model of VPPs in the electricity market using the Stackelberg Game model to maximize the VPP profits and reduce the purchasing cost for consumers [13]. Zhou et al. (2016) proposed an optimal generation scheduling model for VPP, considering Energy Storage Systems (ESS) degradation cost to optimize predicted profits for the VPP using two-stage stochastic mixed integer linear programming [14]. The Binary Particle Swarm Optimization (BPSO) algorithm was used by Hannan et al. (2019) to propose a novel optimal schedule controller to manage RES in VPP [15]. Further, Liu et al. (2018) studied and compared various methods for allocating VPP, such as stochastic optimization, interval optimization, and deterministic optimization. Yan et al. (2022) proposed a two-stage adjustable robust optimization model for dispatching a Multi-Energy Virtual Power Plant (MEVPP) considering multiple uncertainties and carbon trading, which reduces operating costs in the current energy market [16]. Shafiekhani et al. (2022) proposed an Information Gap Decision Theory (IGDT) model for dealing with uncertainty in market price, considering two objectives: optimal bidding scheduling of the VPP in the day-ahead market for profit maximization and emission reduction [17]. Sun et al. (2022) developed a day-ahead offering strategy for the Concentrating Solar Power (CSP) market, accounting for renewable energy source and market condition uncertainties and utilizing a bi-level optimization model to optimize CSP plant profits while incorporating compressed air energy storage [18]. The objective of mentioned methods is to maximize profits and speed up and simplify calculations which can solve the uncertainties of renewable power generation [19]. As aforementioned, RESs were commonly considered in the power dispatch of VPP. Furthermore, objective functions consisting of the operation and maintenance costs of the power plant are usually taken into account in the VPP task. However, the degradation costs of ESS and generators are still minor utilized in the VPP task.
The metaheuristic method is usually used in energy management by applying the VPP concept. The method is a high-level methodology made to tackle various optimization problems without simplifying complex equations to get the best or closest optimal solution [20]. Many metaheuristic methods were frequently used in VPP work, such as the Genetic Algorithm (GA) [21,22], which is an evolutionary algorithm that mimics the process of natural selection to evolve a population of candidate solutions. It is widely used for optimization problems with discrete variables, but it may be slow in converging to the optimal solution [23]. The Imperialist Competitive Algorithm (ICA) [11] is a population-based optimization algorithm that models the competition between empires and colonies to optimize a set of decision variables. However, it may require many iterations to converge to the optimal solution, resulting in a long computational time due to using many equations and complex operators [24]. Another frequently used method is the Particle Swarm Optimization (PSO) algorithm [15,21,25], which is a population-based optimization algorithm that simulates the behavior of a swarm of particles moving in a multidimensional space. However, it may suffer from the premature convergence parameter selection problem and easily get trapped in a local optimum [24]. Numerous methods have been presented recently to address various engineering optimization issues. The differential evolution (DE) algorithm proposed by Storm & Price (1997) [26] is an intriguing technique that is quick convergence, has a straightforward structure, has a few control parameters, and has high efficacy and dependability compared to other metaheuristic algorithms [27]. In addition, many studies have employed the DE algorithm to solve problems in the power system, as follows. Shaheen et al. (2019) suggested the DE algorithm for minimizing system power losses, reducing the operation cost of generation and reactive power investment, and improving the voltage profile at load buses [28]. Varadarajan & Swarup (2008) studied reactive power dispatch in power system planning where the DE algorithm was used in conjunction with OPF [29]. Sakr et al. (2017) proposed a method for solving the Optimal Reactive Power Management (ORPM) problem based on a multi-objective function using a modified DE algorithm to improve the voltage profile as well as decrease active power losses [27]. Even though the DE optimization algorithm has been well-performed in many studies on optimal power system operation, the above works reveal that the optimal energy management of the VPP problem has not yet been solved using the DE algorithm [20].
Previous research on optimal energy management for VPP did not consider two significant issues. First, the three main costs, including the operation cost of generators and the degradation costs of ESS and generators, were not simultaneously taken into account. Additionally, the earlier research works for the optimal energy management of the VPP have used various metaheuristic methods to solve the problem. From reference [21], the DE algorithm is a contemporary metaheuristic method that uses a powerful statistical technique to deal with non-linear and non-convex optimization problems. Comparing the DE algorithm to other metaheuristic methods, the DE has quick convergence, excellent efficacy, and reliability, which increases the probability of discovering the global optimum [27,29]. Until now, the DE algorithm has not yet been applied to solve energy management in power systems with solar PV and EVCS penetrations using the VPP concept. Therefore, this study proposes the optimal energy management of the VPP considering solar PVs and EVCSs using the DE algorithm as the optimization tool together with calculating OPF taking into account the power flow constraints. The objective is to reduce the operation cost of all generators, the cost of battery degradation in ESS, and the cost of degradation of all generators. The main contributions of this study can be summarized in the following.
  • This paper introduces applying the VPP concept integration with minimizing the operation cost of generators and the degradation costs of the elements within the power system, especially the ESS and generators. Considering these degradation costs leads to the proper operation of the ESS and generators, which has not been studied combined with the VPP concept in the previous research works.
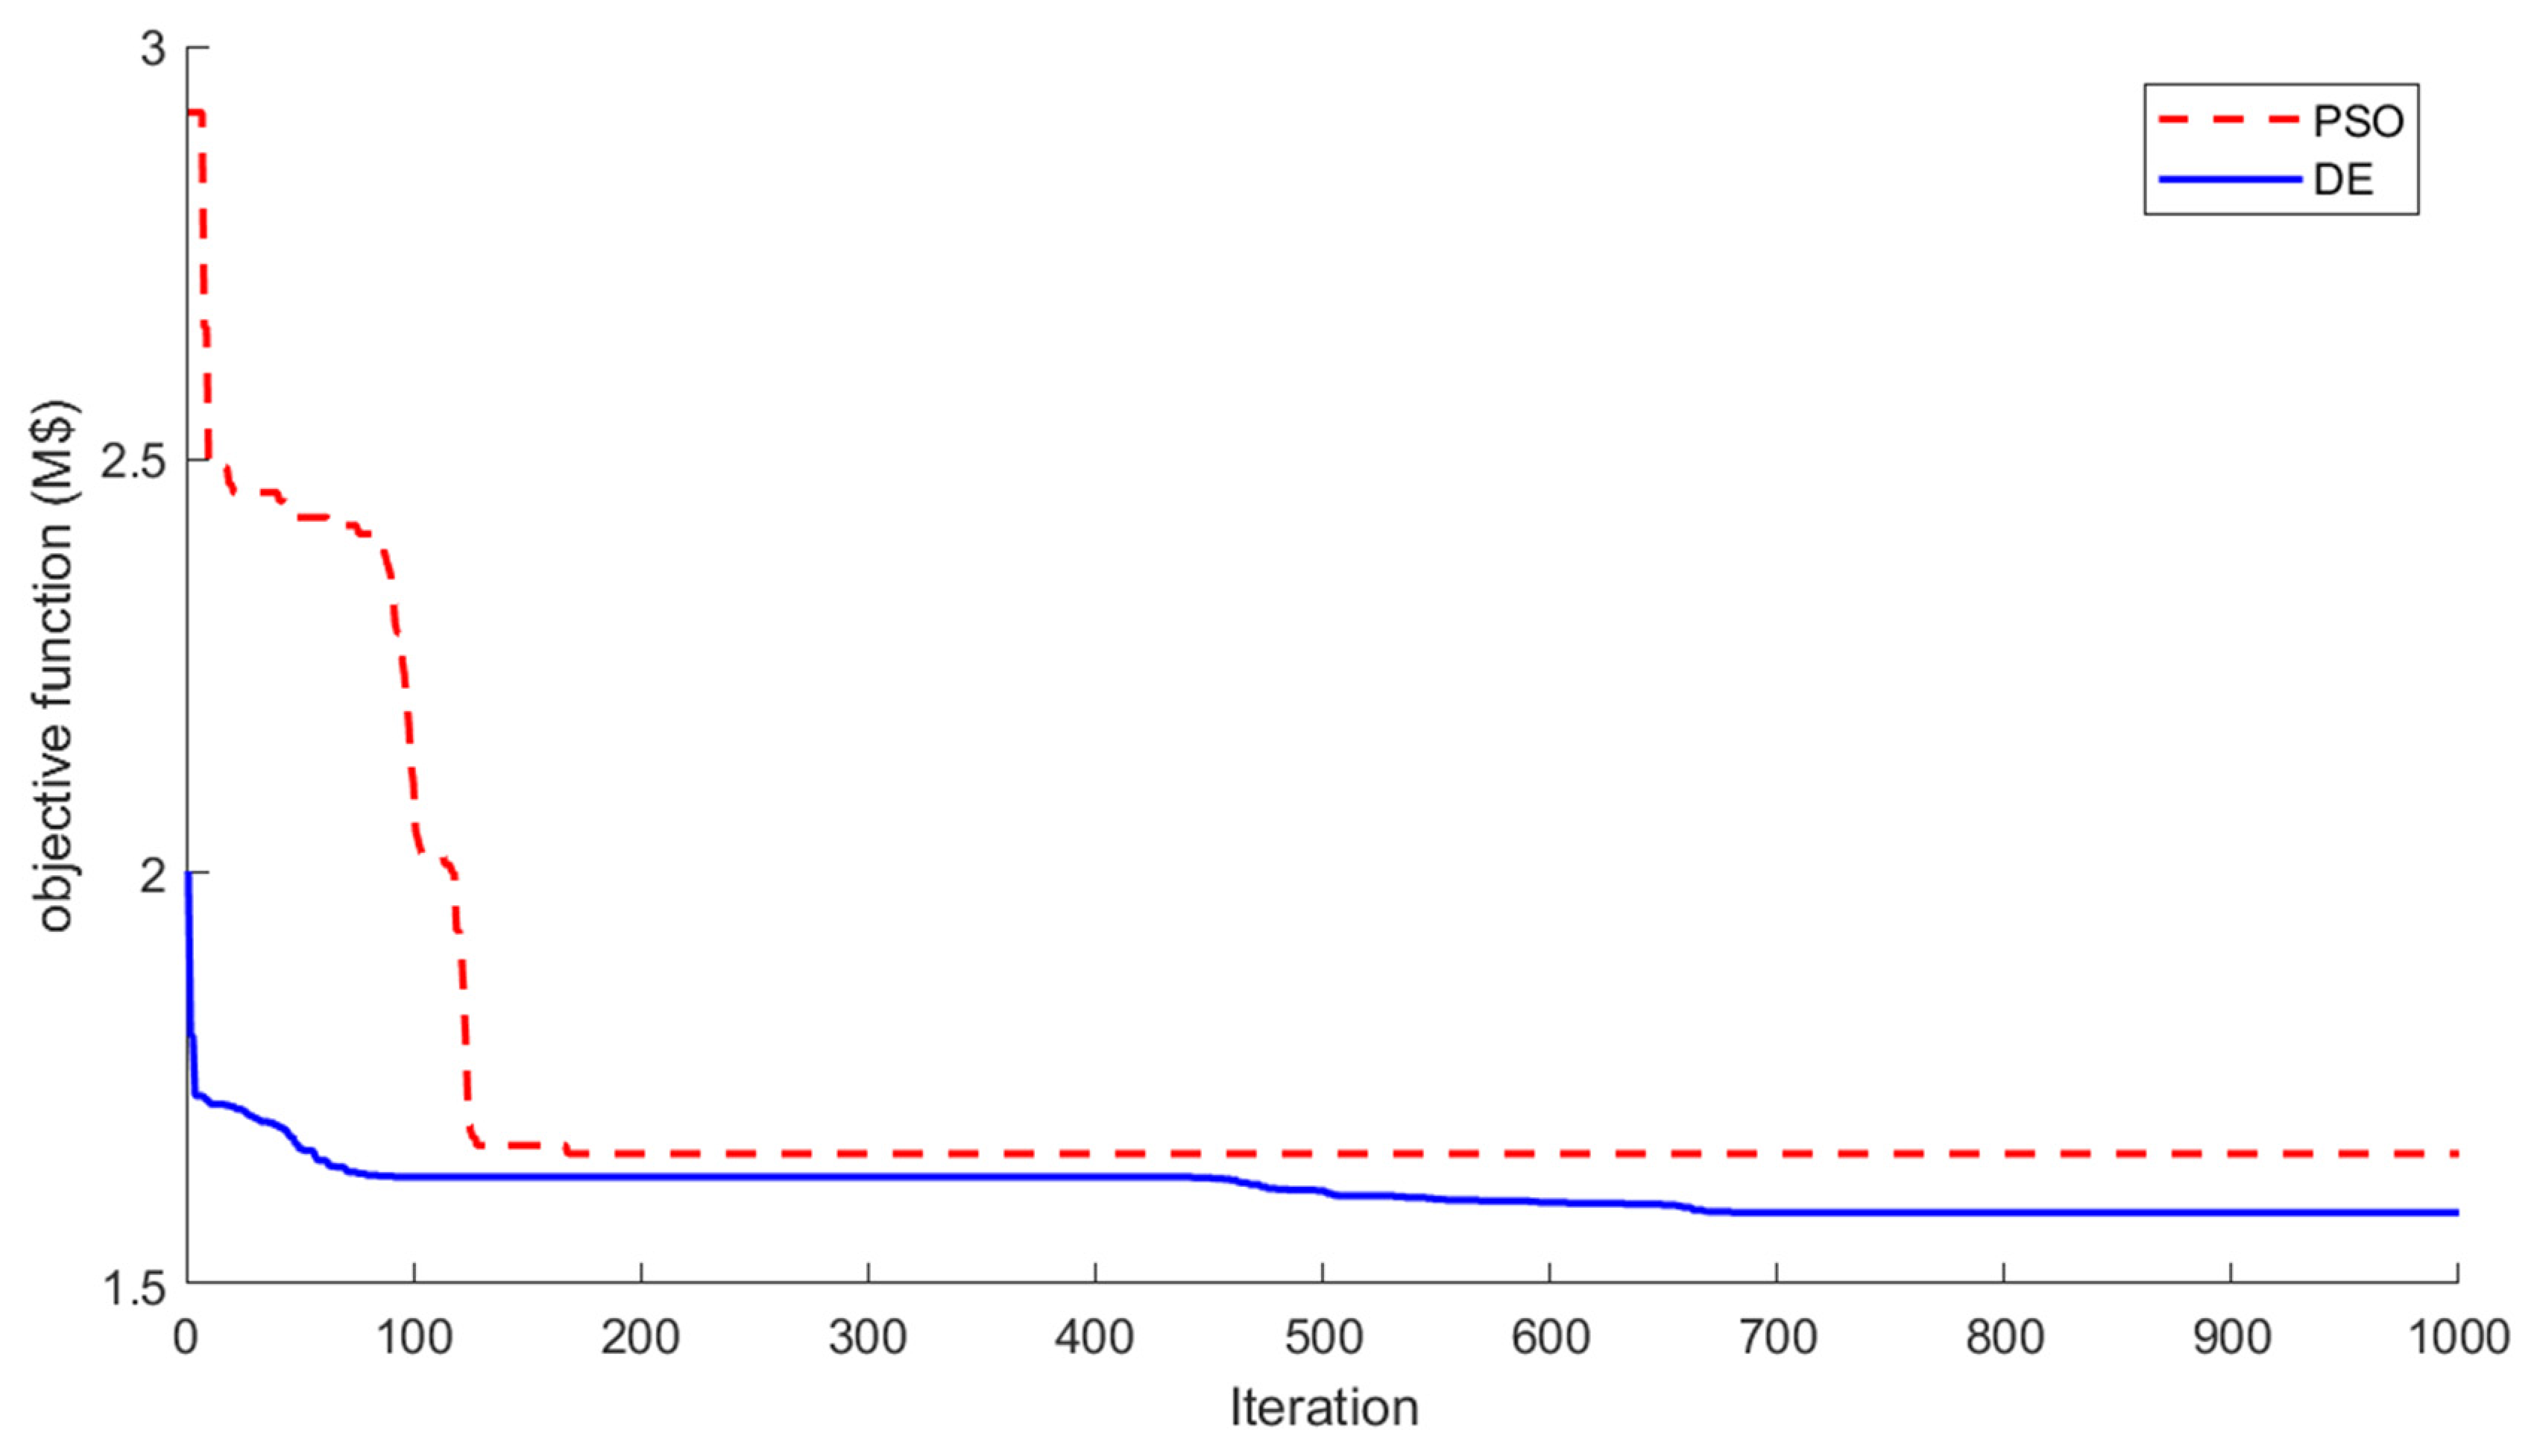
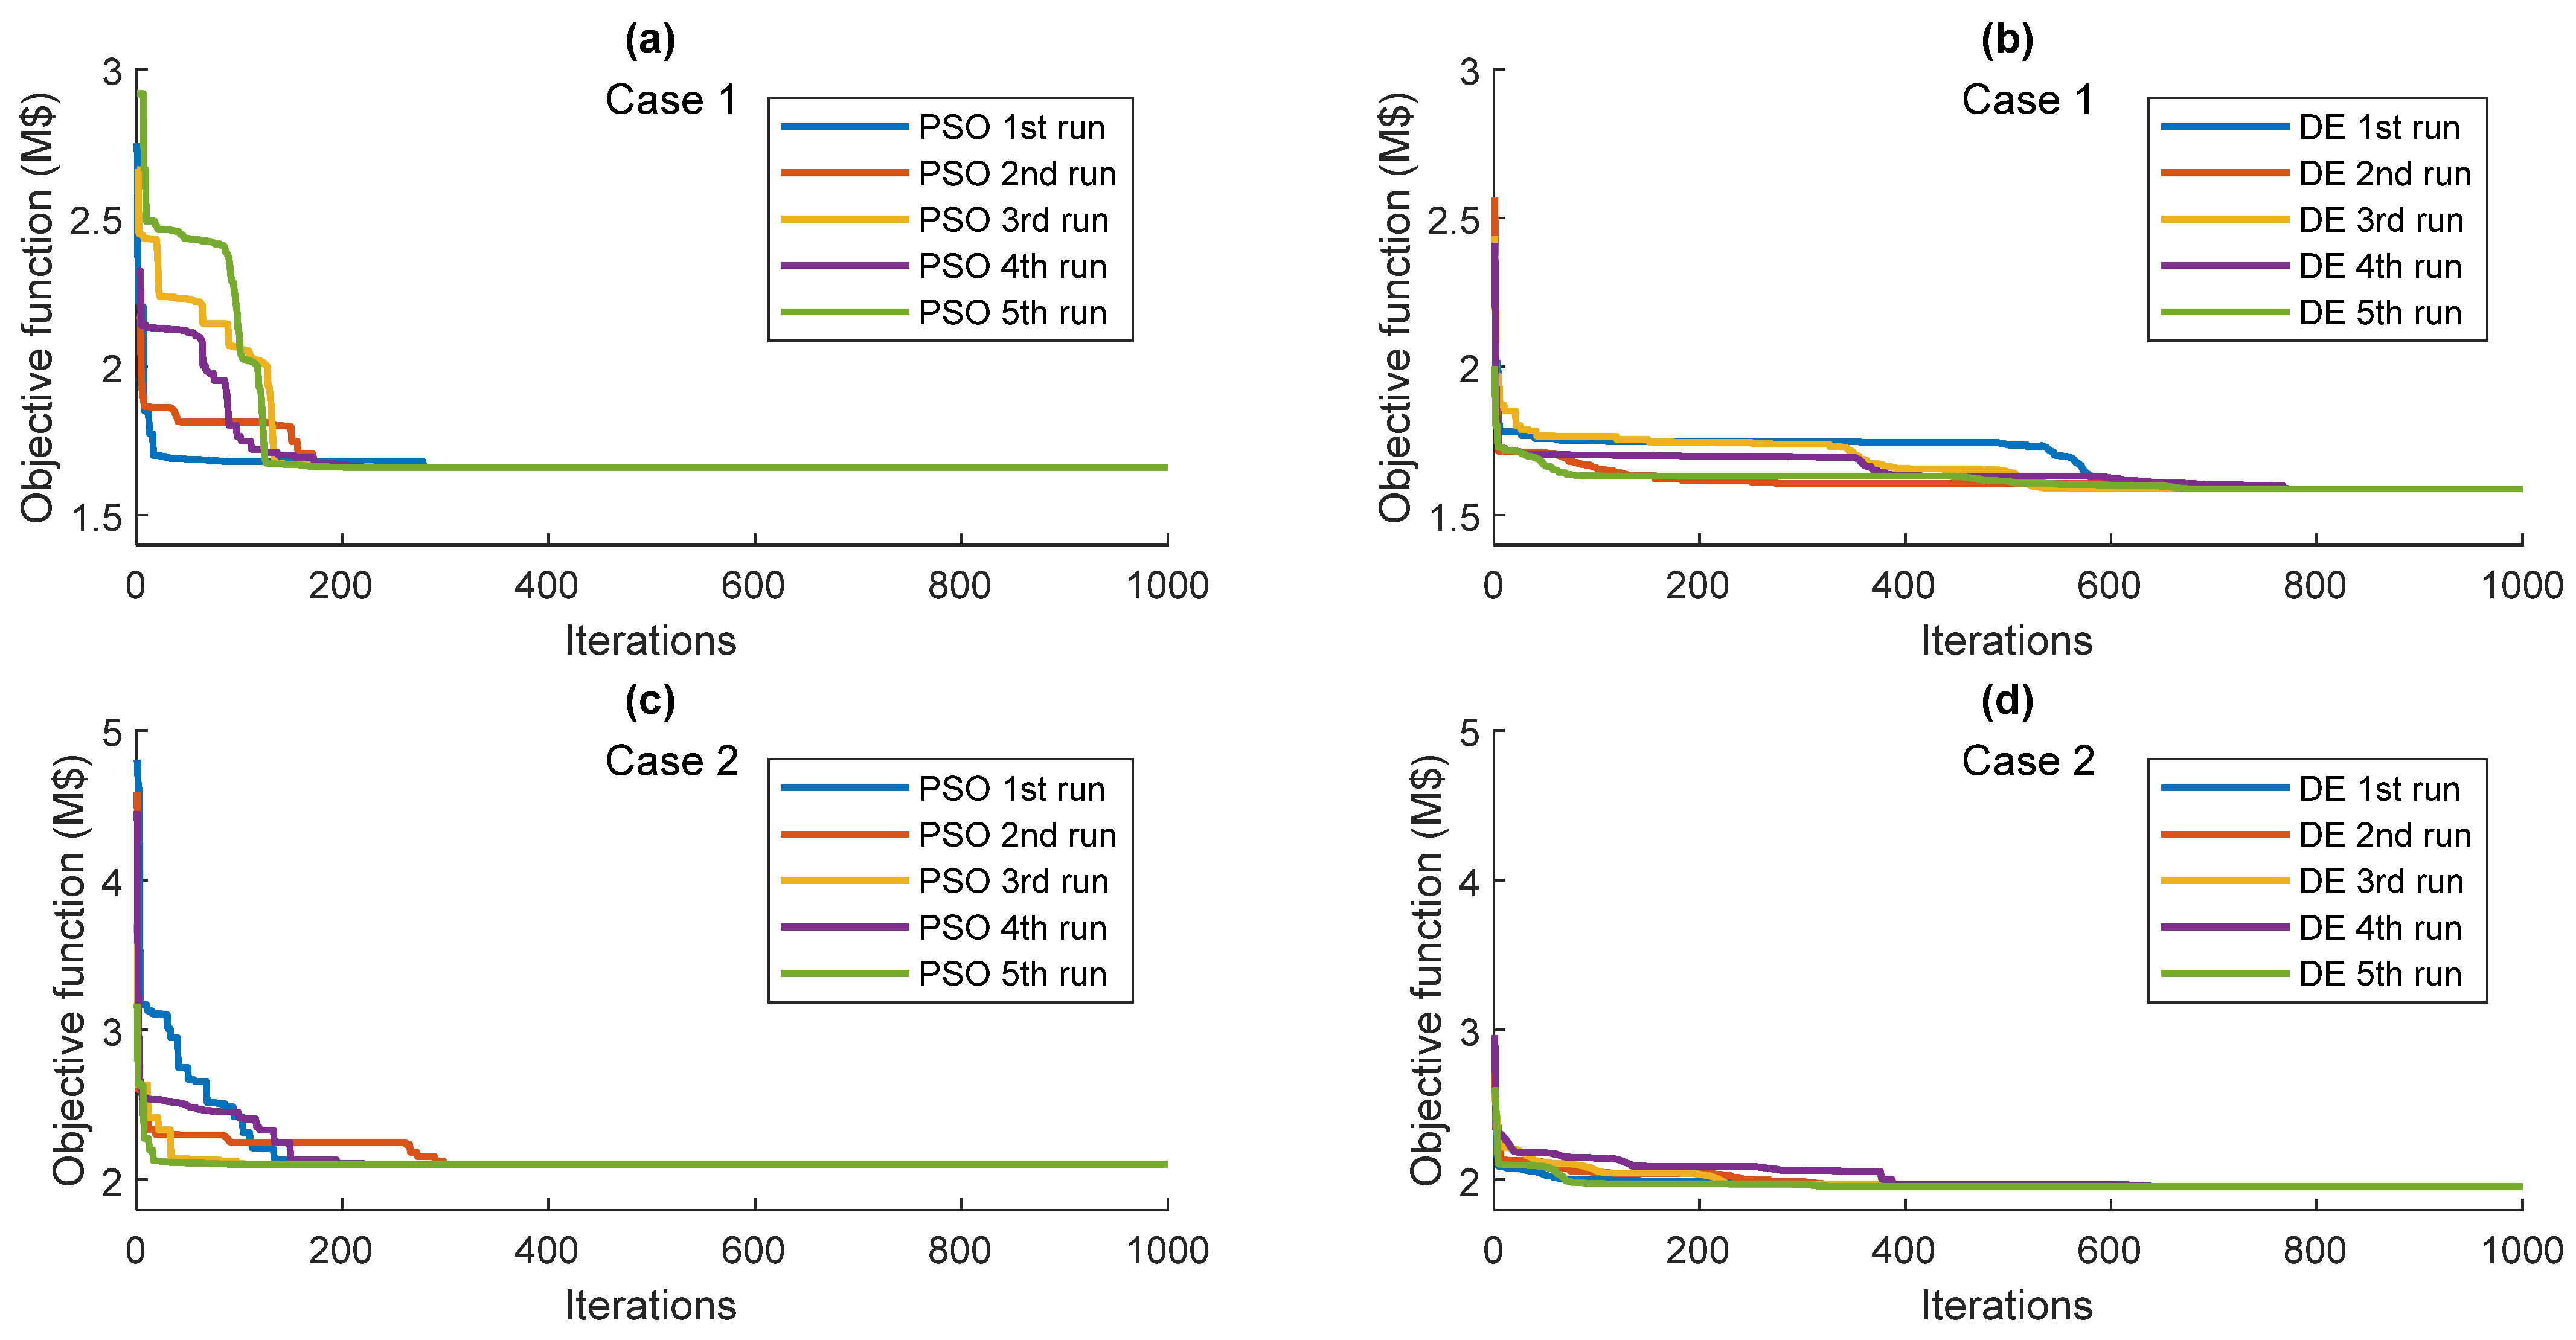
  • Deploying the DE algorithm to achieve the optimal ESS scheduling in the energy management task considering the penetration of solar PV and EVCS is proposed. A simple structure, a few parameters for control, and excellent effectiveness and plausibility of the DE can guarantee that it is one of the most robust algorithms [27]. Additionally, to verify the performance of the proposed algorithm, the PSO algorithm, popularly used in VPP tasks [15,21,25], is utilized in this work to compare the solution with the proposed algorithm.
The rest of this paper is organized as follows. Section 2 introduces system modeling. In Section 3, the problem formulation of this paper is presented. Section 4 proposes the optimal energy management of VPP using the DE Algorithm. After that, the simulation results and discussion are performed in Section 5, and the conclusion is presented in Section 6.

2. System Modeling

In this section, the system models, which consist of the VPP model, the solar PV model, the EVCS model, and the ESS model, are introduced as presented below.

2.1. The VPP Model

The virtual power plant has three major components. The first component is the DER, which integrates DG into a single network. The next component is ESS, an energy storage system that can be utilized as an additional source or load to adapt the profile of power demand to conform to power generation sources in power systems, volatile renewable energy sources. The third component is the EMS of the virtual power plant, which is the bidirectional communication technology for managing the powers of RES and ESS [7,10].
The principle of the VPP is energy management in a power system with DER, such as solar energy sources, to enable the system operator to manage electric power properly and securely under the uncertainty of renewable energy. Therefore, this paper proposes an approach for managing RESs in the power system that tends to increase in the future with the concept of the VPP, as shown in Figure 1. The proposed VPP model consists of a solar PV source, EVCS, ESS, and information and communication systems.

2.2. The Solar PV Model
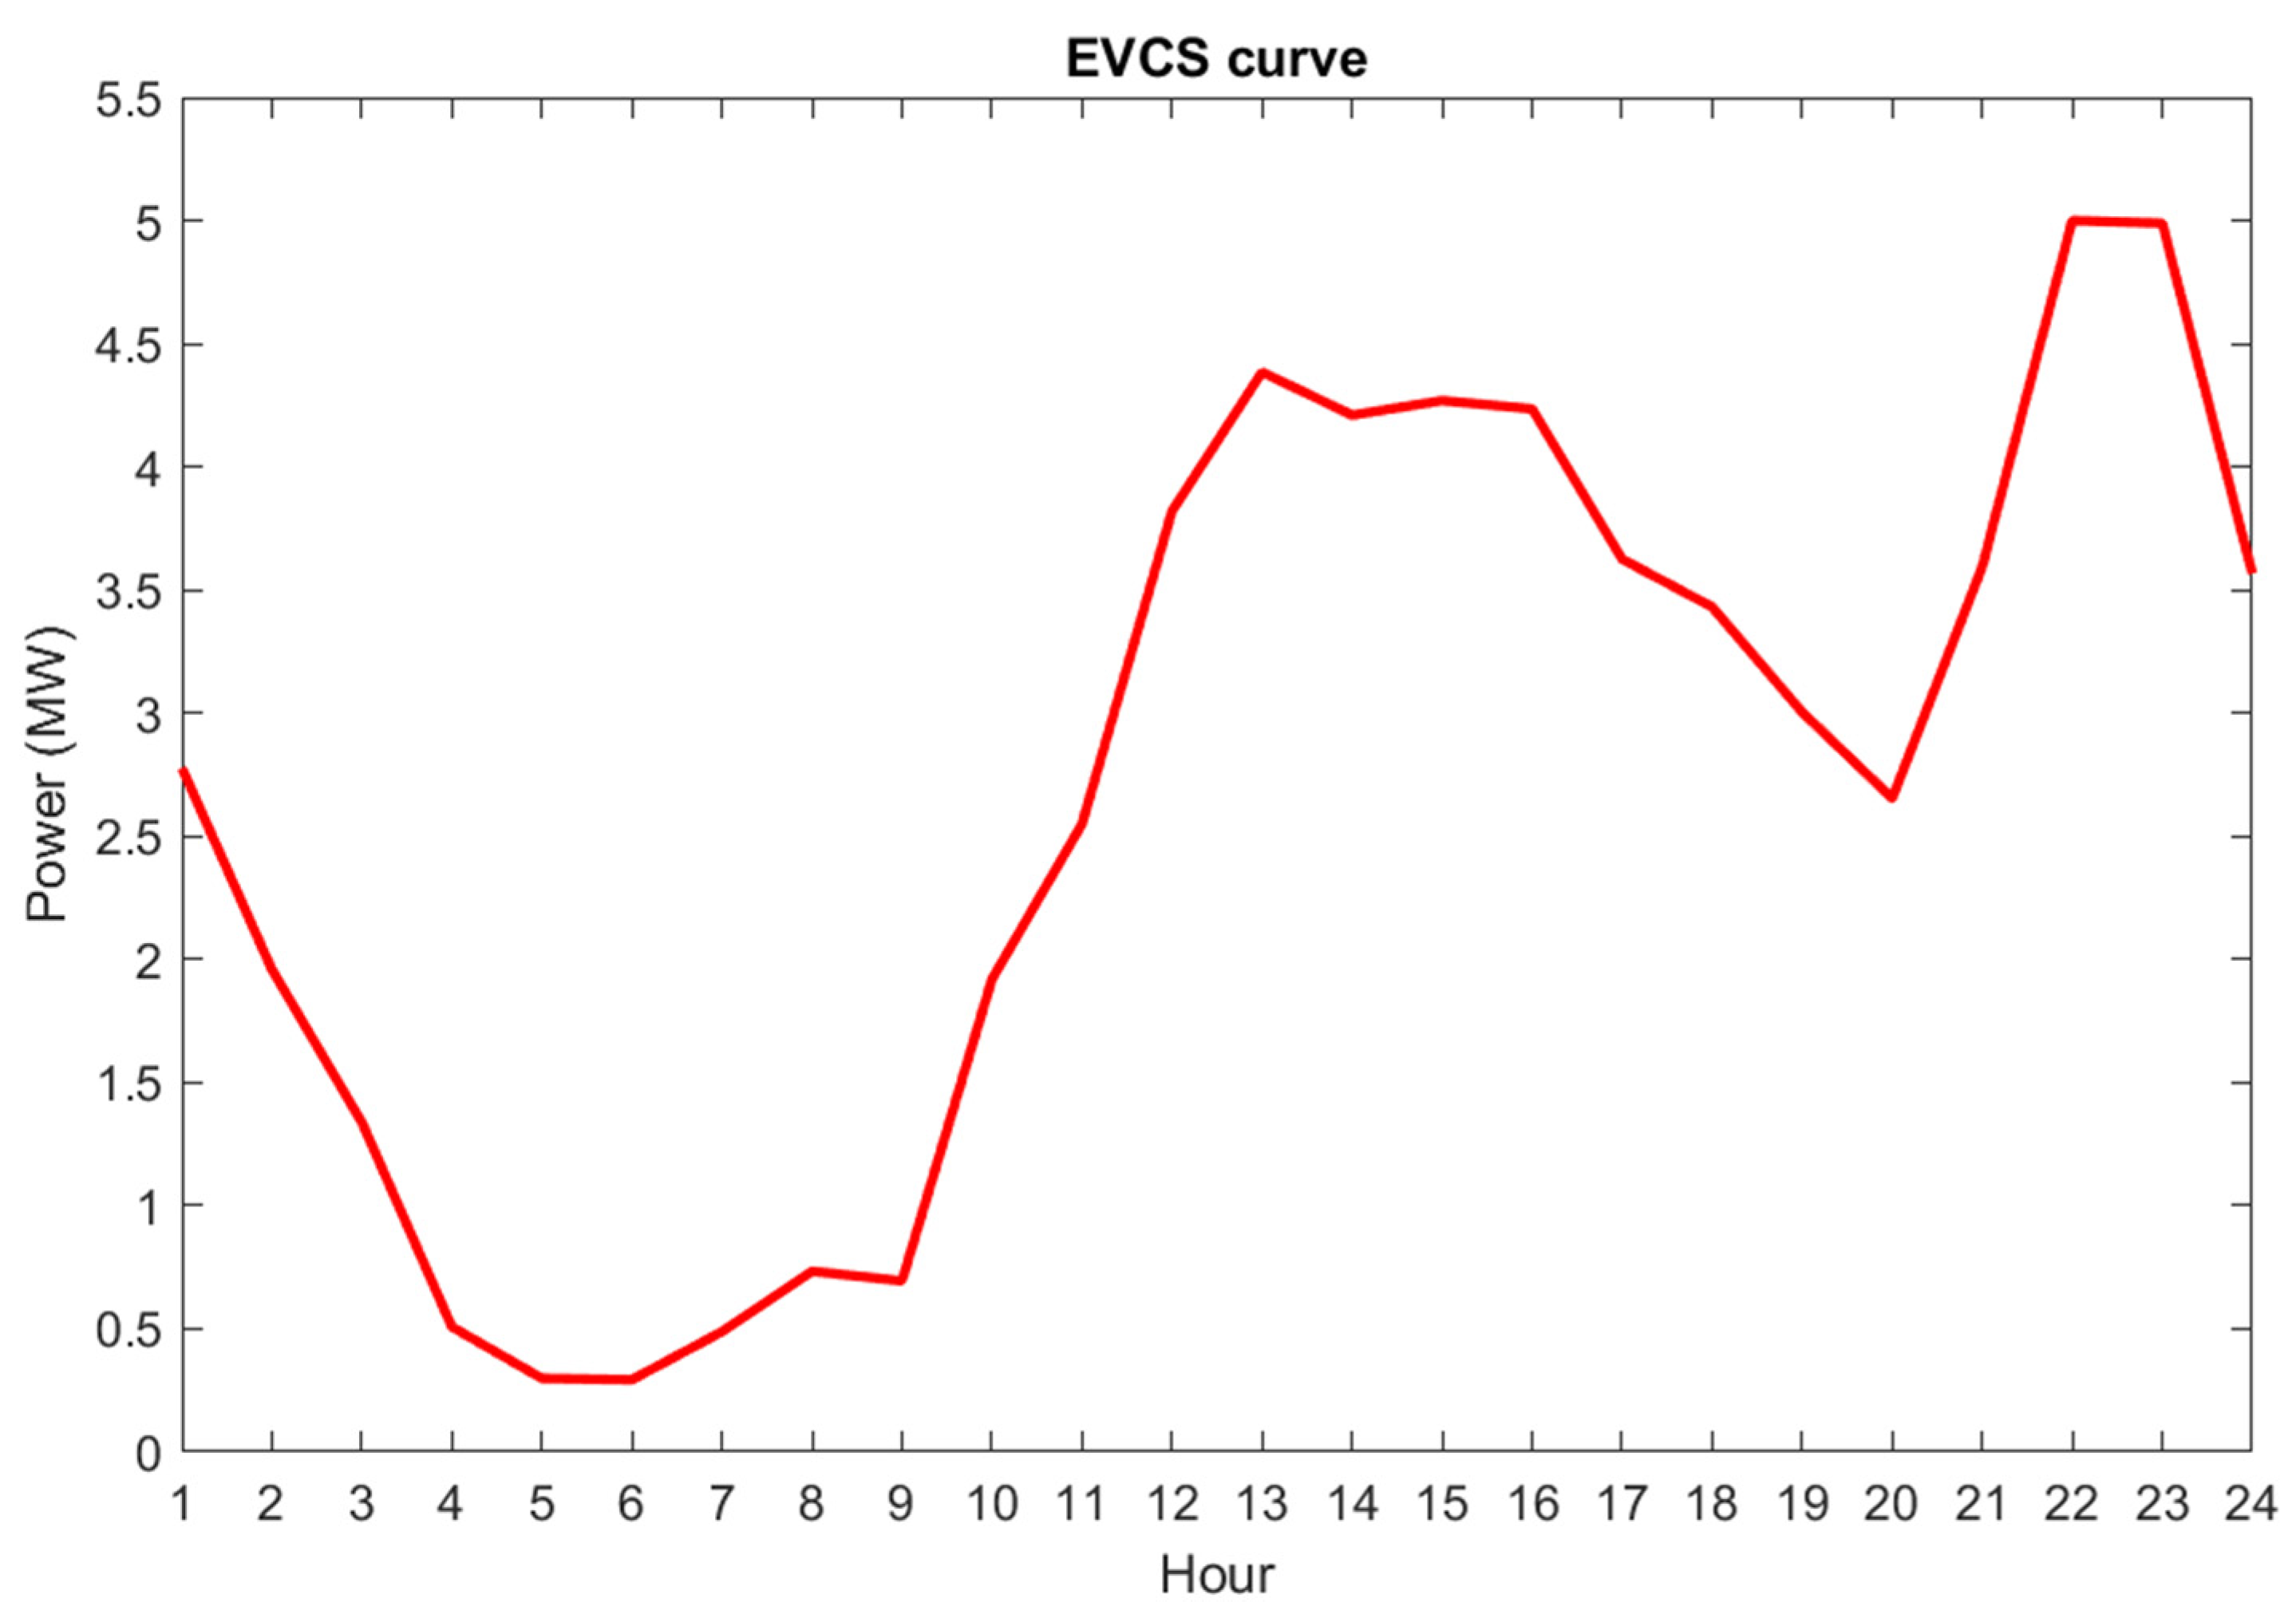
This paper uses the historical hourly solar radiation data collected from Khon Kaen province, Thailand, in 2017. The solar PV model used in this work is presented in Equation (1) [30].
P p v ( t ) = P s n × G b i 2 ( t ) G s t d × R c     ;     0         G b i ( t ) < R c     P s n × G b i ( t ) G s t d             ;     R c         G b i ( t ) < G s t d P s n                           ;     G s t d < G b i ( t ) ,
where P p v is the PV output power (W), G b i is hourly solar radiation (W/m2), G s t d is solar radiation in a standard environment set as 1000 (W/m2), R c is a certain radiation point set as 150 (W/m2), P s n is the equivalent rated capacity of PV (W), and t is the index of time in each hour.

2.3. The EVCS Model

The charging profile of EVCS is modeled based on data from Beijing, China, which is the demand charge for an electric bus charging station in 2010 [31]. The capacity of the electric charging station is obtained from Equation (2).
  P E V C S = P E V C S _ p u × P E V C S _ c a p ,
where P E V C S is the power demand of the charging station (MW), P E V C S _ p u is the hourly EVSC charging profile (p.u.), and P E V C S _ c a p is the equivalent rated capacity of EVCS (MW).

2.4. The ESS Model

The ESS operation and State of Charge (SoC) of ESS can be calculated by Equations (3)–(5) subjected to the constraints from Equations (6)–(11) as presented below [10,32].
Discharge   :     E E S S ( t ) = E E S S ( t 1 ) + P E S S ( t ) Δ t / η d i s   ;   P E S S ( t ) = v e ,
Charge   :   E E S S ( t ) = E E S S ( t 1 ) + P E S S ( t )   Δ t   η c h   ;   P E S S ( t ) = + v e ,
S o C ( t ) = E E S S ( t ) E E S S max ,
Power limits:
P E S S d i s P E S S ( t ) / η d i s 0     ;   P E S S ( t ) = v e ,
0 P E S S ( t ) η c h P E S S c h   ;   P E S S ( t ) = + v e ,
Storage energy limits:
0 E E S S ( t ) E E S S max ,
State of charge limits:
S o C min S o C ( t ) S o C max ,
Starting operation of energy storage:
E int = S o C min E E S S max ,
Starting and ending of the state of charge:
S o C int = S o C e n d ,
where E E S S is the stored energy in the ESS (MWh), P E S S is the power output of the ESS (MW), Δ t is the time duration of each interval which is equal to 1 h. η d i s and η c h are the discharge and charge efficiencies, respectively, S o C is the state of charge of the ESS, E E S S max is the maximum energy storage in the ESS (MWh), P E S S c h and P E S S d i s are the maximum charging power (MW) and discharging power (MW) of ESS, respectively. S o C max and S o C min are the upper and lower limits of state of charge, respectively. v e and v e represent positive and negative values, respectively, E int is the initial stored energy in the ESS (MWh), S o C int is the state of charge of the ESS at the end of yesterday. S o C e n d is the state of charge of the ESS at the beginning of the day.

3. Problem Formulation

This paper presents the optimal energy management by the VPP concept in the power system with solar PVs and EVCS. The objective function is to minimize the operation cost of all generators, the cost of battery degradation, and the cost of all generator degradation. The objective function and the corresponding constraints of optimal energy management are described in this section.

3.1. The Objective Function

The objective function is given by:
min f = t = 1 24   C O p t ( t ) + C D e p _ E S S ( t ) + C D e p _ G E N ( t ) ,
where C O p t is the operation cost of all generators (M$), C D e p _ E S S is the cost of battery degradation (M$), C D e p _ G E N is the cost of all generator degradation (M$), and the 24 value is the total number of hours of a day.
The operation cost of all generators is detailed in Equation (13) [33].
C O p t ( t ) = g = 1 N g   ( a G e n , g + b G e n , g P G e n , g ( t ) + c G e n , g P G e n , g 2 ( t ) ) ,
where P G e n , g is the active power generation of a generator g (MW), a G e n , g , b G e n , g , c G e n , g are the cost coefficients of electricity generation of generator g, g is the index of a generator, and N g is the number of generators.
The cost of battery degradation is detailed in Equations (14) and (15) [32].
C D e p _ E S S ( t ) = C E S S c a p L c y c l e ( t ) ,
L c y c l e ( t ) = β 0 × ( 1 S o C ( t ) ) β 1 × e β 2 × S o C ( t ) ,
where C E S S c a p is the cost of the battery ($/kWh), L c y c l e is the battery life in terms of cycle life, β 2 , β 1 , and β 0 are the curve fitting coefficients that can be calculated using the battery type and the manufacturer supplied experimental data set as 0.016, 1.98, and 4,901 respectively [32].
The degradation cost of all generators is detailed in Equations (16) to (18) [34].
C D e p _ G E N ( t ) = max   ( g = 1 N g C D e p _ G E N , g p h y ( t ) , g = 1 N g C D e p _ G E N , g r u n ( t ) ) ,
C D e p _ G E N , g p h y = Δ t ω g c G E N , g c a p t p h y ,
C D e p , g r u n = p ω g c G E N , g c a p P l i f e ,
where C D e p _ G E N , g p h y is the capital degradation cost based on physical lifetime ($), C D e p _ G E N , g r u n is the capital degradation cost based on the lifetime throughput ($), Δ t is the time duration of each interval which is equal to 1 h, ω g is the size of a generator (kW), c G E N , g c a p is the capital cost of a generator ($/kWh), t p h y is the lifetime of a generator (h), p is the energy delivered by the generator within the time interval Δ t in the operation plan (kWh), P l i f e is the energy lifetime throughput of the generator (kWh).

3.2. Constraints

To minimize the operation cost of all generators, the cost of battery degradation and the cost of all generator degradation without violation of power system constraints, bus voltage, branch current, power generation, and power balance must operate within limits as follows [10,11].
The voltage at each bus must be within the specified range of standards, as shown below.
0.95     p . u . V i ( t ) 1.05     p . u . ,
The current flowing at the branch must be within the limit of the maximum current of the branch shown below.
I k ( t ) I k max ( t ) ,
The active and reactive power generations must be within the limits of the maximum and minimum generations of the generator unit, as presented below.
P G e n , g min P G e n , g P G e n , g max ,
Q G e n , g min Q G e n , g Q G e n , g max ,
The sum of active powers from all sources must equal the sum of active power demands, including power loss, as presented below.
g = 1 N g   P G e n , g ( t ) + p v = 1 N p v P p v ( t ) + P E S S ( t ) = P D ( t ) + E V C S = 1 N e v c s P E V C S ( t ) + P L o s s ( t )   ,
The sum of reactive powers from all sources must equal the sum of reactive power demands, including reactive power loss, as presented below.
g = 1 N g   Q G e n , g ( t ) = Q D ( t ) + Q L o s s ( t )   ,
where V i is the voltage at bus i (p.u.), I k is the current at branch k (A), I k max is the maximum current limit at a branch k (A), P G e n , g and Q G e n , g are active power (MW) and reactive power (Mvar) generations of generator g, respectively. P G e n , g min and P G e n , g max are the minimum and maximum limits of active power generation of generator g (MW), respectively. Q G e n , g min and Q G e n , g max are the minimum and maximum limits of reactive power generation of generator g (Mvar), respectively. P D is the active power demand (MW), Q D is the reactive power demand (Mvar), P L o s s is the active power loss (MW), Q L o s s is the reactive power loss (Mvar), N p v is the number of solar PV, and N e v c s is the number of EVCS.

4. The Proposed Optimal Energy Management of VPP based on the DE Algorithm

Even though the DE occasionally offers solutions that are not globally optimal solutions, it provides acceptable solutions that are suitable for solving non-linear and non-convex optimization problems [35]. The DE has been successfully applied to power systems in previous research works, as presented in references [27,28,29,33,36,37,38]. This paper uses the DE algorithm to control the power of ESS to minimize the objective function under the previously presented constraints. The control variable selected to minimize the total cost is the amount of charge or discharge power of the ESS in each hour ( P E S S ( t ) ). The DE is used to find the best control variable starting from the initial group of randomized control variables. The proposed DE process for solving the optimal energy management of VPP is presented in Figure 2 and described as shown below.
Step 1: Input data consisting of the standard IEEE RTS 24 bus, load profile, solar PV generation, and EVCS profile.
Step 2: Determine network operation constraints composed of the voltage limit at each bus, the current flow limit at each branch, the active and reactive power generation limits, the balance of active power and reactive power, and ESS operation constraints.
Step 3: Determine parameters and conditions of the DE algorithm composed of the number of loops iteration ( t max ), crossover rate ( C R ), scaling factor ( F ), and the number of populations ( n p o p ) [29].
Step 4: Generate a random initial population ( X i ) in the following form:
X i = x i , 1 , x i , 2 , , x i , t ,
x i , t = r a n d ( . ) × ( x i , t , max x i , t , min ) + x i , t , min ,
where i is an index of the population, x i , t is the decision parameter generated from the population i at the hour t, x i , t , max and x i , t , min are the upper and lower bounds of the decision parameter, which is set to −1 and 1, respectively, for the population i. r a n d ( . ) is a random value between 0 and 1 [35].
Step 5: Take the random population into Equation (27) to obtain the power output of the ESS and then run the OPF in the MATPOWER tool [39] to evaluate the objective function and check the constraints of the power system. After that, find the best decision variable from the population that gives the minimum total objective function value.
P E S S = X i × P E S S max ,
where P E S S max is the maximum charging power or discharging power (MW) of ESS.
Step 6: Generate a new population using mutation as described in Equation (28) to create offspring from parents.
u i = x b e s t + F ( X i , 1 + X i , 2 ) ,
where u i is the mutant vector, x b e s t is the best decision variable vector from step 5, X i , 1 , X i , 2 are the decision variable vectors that are members in Step 5, which is randomly obtained with the condition of X i , 1 X i , 2 .
Step 7: Generate a new population using crossover as described in Equation (29) to create offspring from parents.
v i , j = u i , j     ;     r a n d i , j C R x i , j     ;     r a n d i , j > C R ,
where v i is the crossover vector, r a n d i , j is a random value in [0, 1].
Step 8: After the crossover vector is obtained, the selection process is performed as shown in Equation (30) between parent and offspring with the lowest value cost selection criteria of the objective function.
x i = v i     ; f ( v i ) f ( x i ) x i     ; f ( v i ) > f ( x i ) ,
Step 9: Record the minimum value from each iteration and go to step 5 until the difference between the results of the previous and current iterations is zero and has been repeated for 200 iterations. Then, output the best population and objective function value, and stop the process.

5. The Result and Discussion

There are three subsections in this section. The system description is presented in the first subsection. The second subsection presents the effect of solar PVs and EVCS installed in the power system without optimal energy management using the VPP concept, which is defined as the first situation. Then, the final subsection is efficient energy management using a VPP considering solar PVs, EVCS, and ESS, which is represented as the second situation.

5.1. System Description
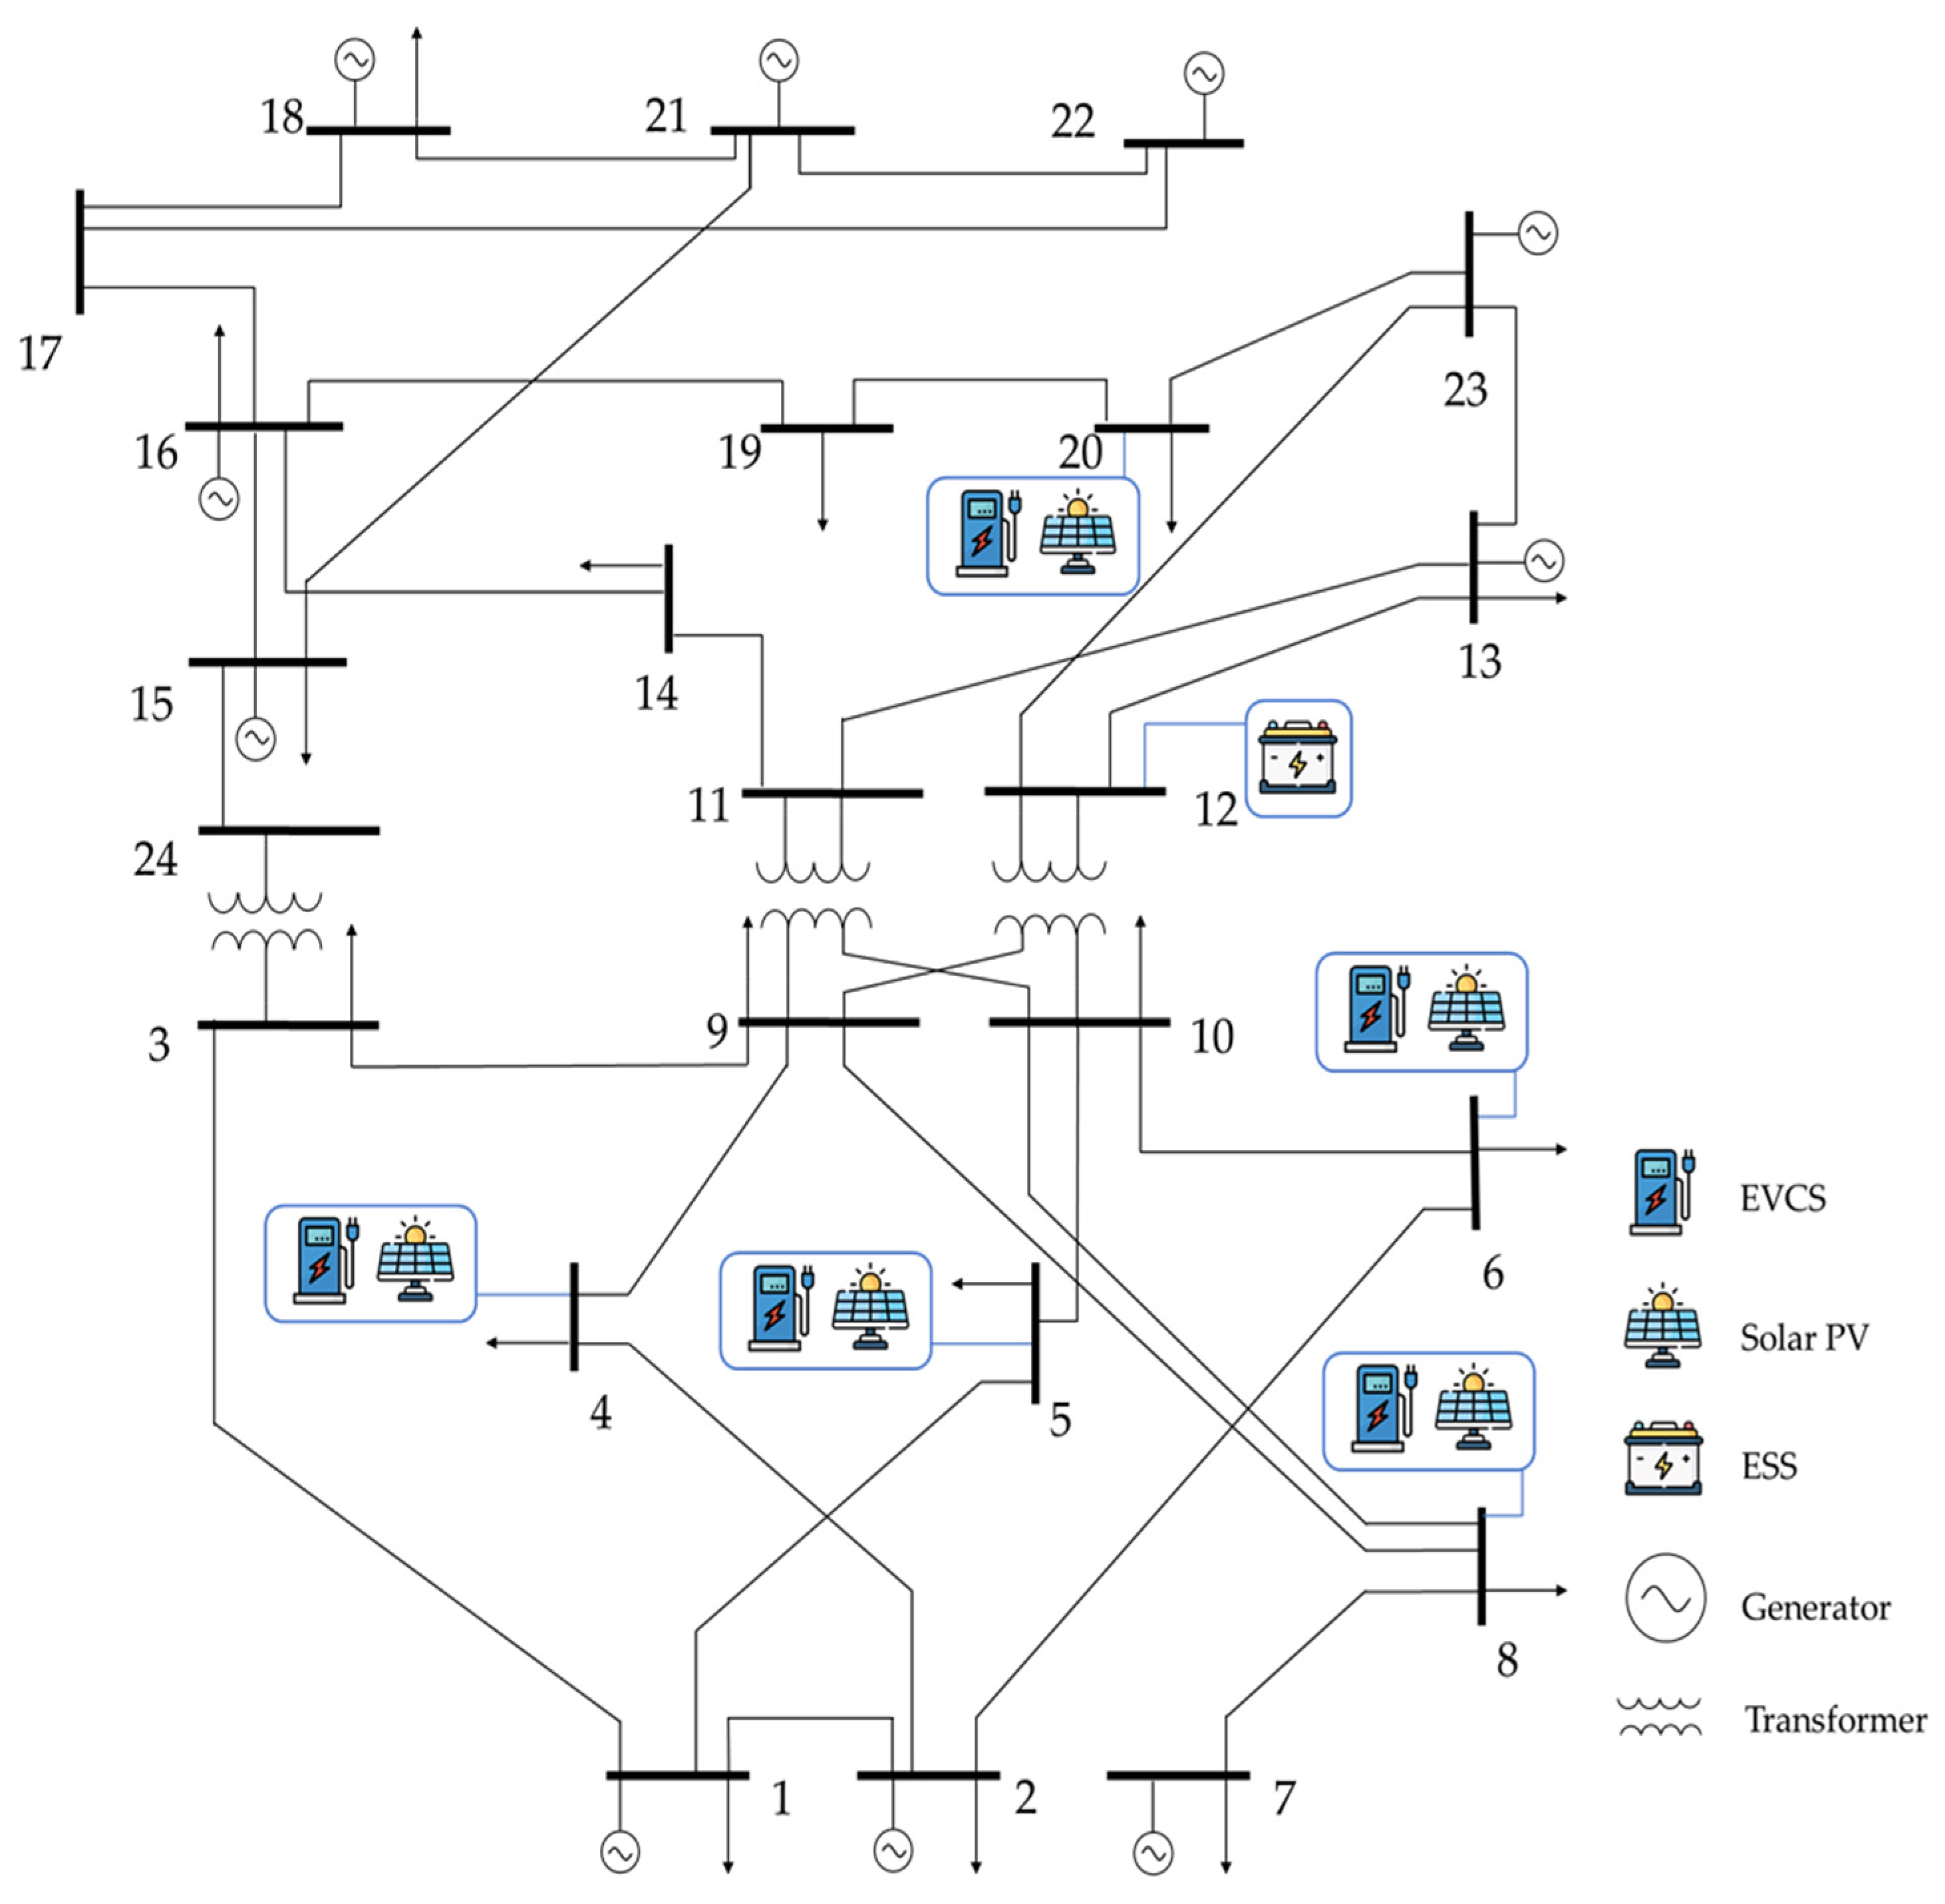
5.1.1. Test System

The IEEE 24 Bus Reliability Test System (RTS 24) [40] is used as the test system to assess the performance of the proposed technique. There are 38 transmission lines, 11 generator buses, and 13 load buses. Bus 13 is designated as the reference bus. The study is split into two situations, as previously described. In the first situation, the system has a solar PV and EVCS installed on buses number 4, 5, 6, 8, and 20. The second situation differs from the first situation in that the ESS is installed on bus 12, as depicted in Figure 3.

5.1.2. Components of VPP

The load profile is determined based on the one-year electricity demand of North-eastern Thailand in 2017. Figure 4 shows the daily average load curve of the test system, with EVCS units sized at 5 MW installed on each bus. Figure 5 displays the typical EVCS charging profile over a 24-h period.
The Solar PV installed on each bus has a capacity of 200 MW. The daily curve of solar PV power generation for each bus is shown in Figure 6. The ESS specifications are shown in Table 1. In addition, the minimum SoC is determined as the initial SoC of ESS.

5.1.3. Simulation Program

The program used in this research work is the MATPOWER tool with MATLAB program, and the computer is an Intel (R) Core (TM) i7-7700 CPU @ 3.60GHz with 8 GB RAM. The parameters of DE and PSO algorithms used for the simulation are summarized in Table 2 and Table 3, respectively.

5.2. The Effect of Solar PVs and EVCS on Power System

The impacts of PVs and EVCS on the power system are discussed in this subsection. With the addition of the EVCS, the total demand for the system will increase. Furthermore, with the addition of PVs, the system is unreliable and unstable due to the uncertainties of solar PV generation. As mentioned above, the system constraints are estimated using the Power Flow (PF) calculation in the MATPOWER tool to check constraints according to Section 3.2. without the VPP concept. This situation leads to a branch constraint violation, which can be shown in Figure 7. The 0 and 1 binaries are labeled, representing the “no violation” and “violation” status of branches, respectively.

5.3. Optimal Energy Management of VPP Based on the DE Algorithm

In order to solve the optimal energy management for the system with PVs and EVCS from Section 5.2, the ESS is determined to be installed at bus 12. There is no branch current violation after using optimal energy management with the VPP. Two cases for optimizing energy management with the VPP concept are proposed in this second situation, as presented below.
In the first case, the two objective functions consisting of the costs of all generator operations and battery degradation are taken into account in the optimization tasks using the DE algorithm. The SoC of ESS after solving the optimal scheduling for case 1 is presented in Figure 8. The convergence characteristics of the proposed DE algorithm are displayed in Figure 9.
Three objective functions in the DE algorithm are considered in the second case. The degradation cost of the generator is the third objective that is also taken into account in the DE algorithm. The technical data used in the computations are listed in Table 4. The optimized SoC is presented in Figure 10. Figure 11 shows the convergence characteristics of the result from the second case.
The problem-solving using metaheuristic methods needs to run many times to verify the solutions. To confirm the optimality of the solutions obtained for each study case, both the PSO and DE algorithms are applied multiple times, and the convergence of the solutions is monitored. Figure 12 illustrates the convergence characteristics for case 1 and case 2 when applying the PSO and DE algorithms. Figure 12a,b are the convergence characteristics of the PSO and DE algorithms for case 1, respectively. Additionally, in Figure 12c,d are the convergence characteristics of the PSO and DE algorithms for case 2, respectively.
This paper has compared the solutions obtained by the proposed algorithm and the popular algorithm that is the PSO algorithm. To ascertain the reliability and consistency of the recommended algorithm, Figure 9 and Figure 11 show the convergences of fitness values of both studied cases when applying the PSO algorithm and the proposed DE algorithm. In this research work, the optimization process is stopped when the difference between the result of the previous and current iteration is zero, and this condition has been met for 200 consecutive iterations. The results show that the PSO algorithm is stuck in a local minimum at the 180th and 90th iterations for case 1 and case 2, respectively. In contrast, the DE algorithm in case 1 and case 2 provides the optimal fitness value at the 680th and 320th iterations, respectively. Thereby, the DE algorithm can increase the opportunity to discover solutions at the global minimum of each case compared with the PSO algorithm.
The outcomes of case 1 and case 2 are presented in Table 5. In addition, this table includes the degradation costs of ESS and generators, as well as the operation cost of generators. The results show that the degradation cost of the generator in case 2, compared to the first case, is reduced by 33.85% and 22.56% for the DE and PSO algorithms, respectively. Because in case 2, the degradation cost of generators is determined as one of the objective functions, which leads to a decreased operation of all generators while it increases the operation of the battery in ESS discharges power to the system. As presented in Table 5, the increased degradation cost of the battery in case 2 is more than the cost obtained by case 1 at 6.90% and 3.68% when using the DE and PSO algorithms, respectively.
In Table 6, the comparison between case 1 and case 2 revealed that when using the DE algorithm for ESS energy management, the total cost in case 2 was 7.06% lower than the total cost in case 1. Similarly, when using the PSO algorithm, the total cost in case 2 was 4.74% lower than the total cost in case 1. Additionally, the table shows that the total cost obtained from the DE algorithm was 4.70% and 7.03% lower than the total cost of the PSO algorithm in case 1 and case 2, respectively.

6. Conclusions

This paper proposes optimal energy management under the VPP concept. Power systems take into account solar PV generation and the demand usage power of EVCS. The DE algorithm is employed to dispatch the ESS operation. All generator operation expenses, as well as ESS and generator degradation costs, are included in the objective function. On an IEEE RTS 24 bus, the VPP concept was tested using the MATPOWER tool for calculating OPF. In the result and discussion section, there are two situations considered. In the first situation, the effect of solar PVs and EVCS on the power system is studied without using optimal energy management of VPP. For the second situation, the proposed optimal energy management with the VPP concept considering solar PVs, EVCS, and ESS installed in power systems is demonstrated and discussed. The detail of these two studied situations is explained below.
For the first situation, solar PV and EV penetrations are considered in the power system, leading to some branch constraint violations. This research work recommends optimal energy management using the VPP concept as presented in situation 2 to manage the power of ESS using the DE algorithm for maintaining the power system operation without any violations. The results show that there is no aforementioned violation and no other violations when applying the proposed energy management with the VPP. In the second situation, two cases are studied. The first case considers two objectives consisting of the minimization of the generator operation cost and the battery degradation cost in ESS. Minimizing the generator degradation cost is taken into account together with the two mentioned objectives in case 2. In the second case, the minimization of generator degradation cost is added to the objective function, which can reduce the operation of all generators and optimize the operation of ESS to achieve the optimal outcome. As a result, the total cost of the generator operation and the degradations of ESS and generators is lower than the total cost of the first case. Additionally, the DE algorithm and the PSO algorithm for solving the optimal energy management using the VPP concept are compared in order to confirm the robustness and consistency of the DE algorithm. The results show that the DE algorithm can provide a total cost lower than the total cost obtained from the PSO algorithm for both case 1 and case 2.
One suggestion is to develop this work because this research work determines the location and size of ESS by locating it at the center of the system to manage power flow efficiently and sizing it by increasing ESS capacity step by step until the system operates without any violations. The obtained ESS capacity is equal to the ESS capacity, as shown in reference [44], which has the total solar PV capacity installed in the test system close to the solar PV capacity in this work. In order to better minimize the total cost, the location and size of ESS and EVCS should be determined by using the optimization method in future works. Another mechanism that can develop this research work, using machine learning for accurate forecasting of electricity demand, solar radiation, and EV charging behaviors in EVCS, could be an excellent way to further improve the proposed approach for VPP energy management. With accurate forecasting, the scheduling of the ESS can be more precise, leading to better energy management and a more sustainable power system.

Author Contributions

Conceptualization, K.B., R.L., C.S. and R.C.; methodology, K.B., C.S. and R.C.; software, K.B.; validation, K.B., R.L., C.S. and R.C.; formal analysis, K.B., R.L., C.S. and R.C.; investigation, K.B., C.S. and R.C.; resources, K.B., C.S. and R.C.; data curation, K.B.; writing—original draft preparation, K.B.; writing—review and editing, R.L., C.S. and R.C.; visualization, K.B., R.L., C.S. and R.C.; supervision, C.S. and R.C.; project administration, R.C.; funding acquisition, R.C. All authors have read and agreed to the published version of the manuscript.

Funding

This research was supported by Research and Graduate Studies, Khon Kaen University, a grant from the faculty of engineering at Khon Kaen University, Thailand (number: Mas. Ee-3/2564), and the research fund for supporting lecturers to admit a high potential student to study and research on his expert program, Khon Kaen University, Thailand (number: 631JT105).

Data Availability Statement

The study did not report any data.

Acknowledgments

This research project is supported by Research and Graduate Studies, Khon Kaen University, the Faculty of Engineering, Khon Kaen University, and the research fund to support lecturers to admit a high potential student to study and research on his expert program, Khon Kaen University.

Conflicts of Interest

The authors declare no conflict of interest.

References

  1. Department of Alternative Energy Development and Efficiency. Energy Efficiency Plan (EEP2018); Department of Alternative Energy Development and Efficiency: Bangkok, Thailand, 2018.
  2. Department of Alternative Energy Development and Efficiency. Alternative Energy Development Plan (AEDP2018); Department of Alternative Energy Development and Efficiency: Bangkok, Thailand, 2018.
  3. Aziz, S.; Wang, H.; Liu, Y.; Peng, J.; Jiang, H. Variable Universe Fuzzy Logic-Based Hybrid LFC Control With Real-Time Implementation. IEEE Access 2019, 7, 25535–25546. [Google Scholar] [CrossRef]
  4. Cheng, P.; Wang, H.; Stojanovic, V.; Liu, F.; He, S.; Shi, K. Dissipativity-based finite-time asynchronous output feedback control for wind turbine system via a hidden Markov model. Int. J. Syst. Sci. 2022, 53, 3177–3189. [Google Scholar] [CrossRef]
  5. Jiang, Y.; Gao, W.; Na, J.; Zhang, D.; Hämäläinen, T.T.; Stojanovic, V.; Lewis, F.L. Value Iteration and Adaptive Optimal Output Regulation with Assured Convergence Rate. Control. Eng. Pract. 2022, 121, 105042. [Google Scholar] [CrossRef]
  6. Aziz, S.; Peng, J.; Wang, H.; Jiang, H. ADMM-Based Distributed Optimization of Hybrid MTDC-AC Grid for Determining Smooth Operation Point. IEEE Access 2019, 7, 74238–74247. [Google Scholar] [CrossRef]
  7. Saboori, H.; Mohammadi, M.; Taghe, R. Virtual Power Plant (VPP), Definition, Concept, Components and Types. In Proceedings of the 2011 Asia-Pacific Power and Energy Engineering Conference, Wuhan, China, 25–28 March 2011; pp. 1–4. [Google Scholar]
  8. Narkhede, M.S.; Chatterji, S.; Ghosh, S. Optimal Dispatch of Renewable Energy Sources in Smart Grid Pertinent to Virtual Power Plant. In Proceedings of the 2013 International Conference on Green Computing, Communication and Conservation of Energy (ICGCE), Chennai, India, 12–14 December 2013; pp. 525–529. [Google Scholar]
  9. Zhang, R.; Li, G.; Bu, S.; Aziz, S.; Qureshi, R. Data-Driven Cooperative Trading Framework for a Risk-Constrained Wind Integrated Power System Considering Market Uncertainties. Int. J. Electr. Power Energy Syst. 2023, 144, 108566. [Google Scholar] [CrossRef]
  10. Othman, M.M.; Hegazy, Y.G.; Abdelaziz, A.Y. Electrical Energy Management in Unbalanced Distribution Networks Using Virtual Power Plant Concept. Electr. Power Syst. Res. 2017, 145, 157–165. [Google Scholar] [CrossRef]
  11. Kasaei, M.J.; Gandomkar, M.; Nikoukar, J. Optimal Management of Renewable Energy Sources by Virtual Power Plant. Renew. Energy 2017, 114, 1180–1188. [Google Scholar] [CrossRef]
  12. Naval, N.; Sánchez, R.; Yusta, J.M. A Virtual Power Plant Optimal Dispatch Model with Large and Small-Scale Distributed Renewable Generation. Renew. Energy 2020, 151, 57–69. [Google Scholar] [CrossRef]
  13. Wu, H.; Liu, X.; Ye, B.; Xu, B. Optimal Dispatch and Bidding Strategy of a Virtual Power Plant Based on a Stackelberg Game. IET Gener. Transm. Distrib. 2020, 14, 552–563. [Google Scholar] [CrossRef]
  14. Zhou, B.; Liu, X.; Cao, Y.; Li, C.; Chung, C.Y.; Chan, K.W. Optimal scheduling of virtual power plant with battery degradation cost. IET Gener. Transm. Distrib. 2016, 10, 712–725. [Google Scholar] [CrossRef]
  15. Hannan, M.A.; Abdolrasol, M.G.M.; Faisal, M.; Ker, P.J.; Begum, R.A.; Hussain, A. Binary Particle Swarm Optimization for Scheduling MG Integrated Virtual Power Plant Toward Energy Saving. IEEE Access 2019, 7, 107937–107951. [Google Scholar] [CrossRef]
  16. Yan, Q.; Zhang, M.; Lin, H.; Li, W. Two-Stage Adjustable Robust Optimal Dispatching Model for Multi-Energy Virtual Power Plant Considering Multiple Uncertainties and Carbon Trading. J. Clean. Prod. 2022, 336, 130400. [Google Scholar] [CrossRef]
  17. Shafiekhani, M.; Ahmadi, A.; Homaee, O.; Shafie-khah, M.; Catalão, J.P.S. Optimal Bidding Strategy of a Renewable-Based Virtual Power Plant Including Wind and Solar Units and Dispatchable Loads. Energy 2022, 239, 122379. [Google Scholar] [CrossRef]
  18. Sun, S.; Kazemi-Razi, S.M.; Kaigutha, L.G.; Marzband, M.; Nafisi, H.; Al-Sumaiti, A.S. Day-Ahead Offering Strategy in the Market for Concentrating Solar Power Considering Thermoelectric Decoupling by a Compressed Air Energy Storage. Appl. Energy 2022, 305, 117804. [Google Scholar] [CrossRef]
  19. Liu, Y.; Li, M.; Lian, H.; Tang, X.; Liu, C.; Jiang, C. Optimal Dispatch of Virtual Power Plant Using Interval and Deterministic Combined Optimization. Int. J. Electr. Power Energy Syst. 2018, 102, 235–244. [Google Scholar] [CrossRef]
  20. Rouzbahani, H.M.; Karimipour, H.; Lei, L. A Review on Virtual Power Plant for Energy Management. Sustain. Energy Technol. Assess. 2021, 47, 101370. [Google Scholar] [CrossRef]
  21. Dey, P.P.; Das, D.C.; Latif, A.; Hussain, S.M.S.; Ustun, T.S. Active Power Management of Virtual Power Plant under Penetration of Central Receiver Solar Thermal-Wind Using Butterfly Optimization Technique. Sustainability 2020, 12, 6979. [Google Scholar] [CrossRef]
  22. Fan, S.; Ai, Q.; Piao, L. Fuzzy day-ahead scheduling of virtual power plant with optimal confidence level. IET Gener. Transm. Distrib. 2016, 10, 205–212. [Google Scholar] [CrossRef]
  23. Deng, W.; Zhao, H.; Zou, L.; Li, G.; Yang, X.; Wu, D. A Novel Collaborative Optimization Algorithm in Solving Complex Optimization Problems. Soft Comput. 2017, 21, 4387–4398. [Google Scholar] [CrossRef]
  24. Beheshti, Z.; Shamsuddin, S.M.H. A Review of Population-Based Meta-Heuristic Algorithm. Int. J. Adv. Soft Comput. Appl. 2013, 5, 1–35. [Google Scholar]
  25. Ju, L.; Li, H.; Zhao, J.; Chen, K.; Tan, Q.; Tan, Z. Multi-Objective Stochastic Scheduling Optimization Model for Connecting a Virtual Power Plant to Wind-Photovoltaic-Electric Vehicles Considering Uncertainties and Demand Response. Energy Convers. Manag. 2016, 128, 160–177. [Google Scholar] [CrossRef] [Green Version]
  26. Storn, R. Differential Evolution—A Simple and Efficient Heuristic for Global Optimization over Continuous Spaces. J. Glob. Optim. 1997, 11, 341–359. [Google Scholar] [CrossRef]
  27. Sakr, W.S.; EL-Sehiemy, R.A.; Azmy, A.M. Adaptive Differential Evolution Algorithm for Efficient Reactive Power Management. Appl. Soft Comput. 2017, 53, 336–351. [Google Scholar] [CrossRef]
  28. Shaheen, A.M.; El-Sehiemy, R.A.; Farrag, S.M. A reactive power planning procedure considering iterative identification of VAR candidate buses. Neural Comput. Appl. 2019, 31, 653–674. [Google Scholar] [CrossRef]
  29. Varadarajan, M.; Swarup, K.S. Network Loss Minimization with Voltage Security Using Differential Evolution. Electr. Power Syst. Res. 2008, 78, 815–823. [Google Scholar] [CrossRef]
  30. Chatthaworn, R.; Chaitusaney, S. Transmission Network Expansion Planning Considering Renewable Energy Target. In Proceedings of the 2014 11th International Conference on Electrical Engineering/Electronics, Computer, Telecommunications and Information Technology (ECTI-CON), Nakhon Ratchasima, Thailand, 14–17 May 2014; pp. 1–6. [Google Scholar]
  31. Yang, S.; Wu, M.; Yao, X.; Jiang, J. Load Modeling and Identification Based on Ant Colony Algorithms for EV Charging Stations. IEEE Trans. Power Syst. 2015, 30, 1997–2003. [Google Scholar] [CrossRef]
  32. Lee, J.-O.; Kim, Y.-S. Novel Battery Degradation Cost Formulation for Optimal Scheduling of Battery Energy Storage Systems. Int. J. Electr. Power Energy Syst. 2022, 137, 107795. [Google Scholar] [CrossRef]
  33. Li, S.; Gong, W.; Hu, C.; Yan, X.; Wang, L.; Gu, Q. Adaptive Constraint Differential Evolution for Optimal Power Flow. Energy 2021, 235, 121362. [Google Scholar] [CrossRef]
  34. Zhang, X.; Tan, S.-C.; Li, G.; Li, J.; Feng, Z. Components Sizing of Hybrid Energy Systems via the Optimization of Power Dispatch Simulations. Energy 2013, 52, 165–172. [Google Scholar] [CrossRef]
  35. Niknam, T.; Mojarrad, H.D.; Meymand, H.Z. A Novel Hybrid Particle Swarm Optimization for Economic Dispatch with Valve-Point Loading Effects. Energy Convers. Manag. 2011, 52, 1800–1809. [Google Scholar] [CrossRef]
  36. Abou El Ela, A.A.; Abido, M.A.; Spea, S.R. Optimal Power Flow Using Differential Evolution Algorithm. Electr. Power Syst. Res. 2010, 80, 878–885. [Google Scholar] [CrossRef]
  37. Wang, Y.; Li, B.; Weise, T. Estimation of Distribution and Differential Evolution Cooperation for Large Scale Economic Load Dispatch Optimization of Power Systems. Inf. Sci. 2010, 180, 2405–2420. [Google Scholar] [CrossRef]
  38. Balaji, G.; Balamurugan, R.; Lakshminarasimman, L. Mathematical Approach Assisted Differential Evolution for Generator Maintenance Scheduling. Int. J. Electr. Power Energy Syst. 2016, 82, 508–518. [Google Scholar] [CrossRef]
  39. Zimmerman, R.D.; Murillo-Sanchez, C.E.; Thomas, R.J. MATPOWER: Steady-State Operations, Planning, and Analysis Tools for Power Systems Research and Education. IEEE Trans. Power Syst. 2011, 26, 12–19. [Google Scholar] [CrossRef] [Green Version]
  40. Probability Methods Subcommittee. IEEE Reliability Test System. IEEE Trans. Power Appar. Syst. 1979, PAS-98, 2047–2054. [Google Scholar] [CrossRef]
  41. Roth, I. Incorporating Externalities into a Full Cost Approach to Electric Power Generation Life-Cycle Costing. Energy 2004, 29, 2125–2144. [Google Scholar] [CrossRef]
  42. Schlissel, D.; Biewald, B. Nuclear Power Plant Construction Costs; Synapse Energy Economics Inc.: Cambridge, MA, USA, 2008. [Google Scholar]
  43. International Renewable Energy Agency. Renewable Energy Techlogies: Cost Analysis Series, Hydropower; International Renewable Energy Agency: Abu Dhabi, United Arab Emirates, 2012. [Google Scholar]
  44. Yin, S.; Wang, J.; Lin, Y.; Fang, X.; Tan, J.; Yuan, H. Practical Operations of Energy Storage Providing Ancillary Services: From Day-Ahead to Real-Time. In Proceedings of the 2020 52nd North American Power Symposium (NAPS), Tempe, AZ, USA, 11 April 2021; pp. 1–6. [Google Scholar]
Figure 1. The structure of the VPP model.
Energies 16 02862 g001
Figure 2. The proposed optimal energy management of VPP based on the DE Algorithm.
Energies 16 02862 g002
Figure 3. The RTS 24 with components of VPP.
Energies 16 02862 g003
Figure 4. The daily load curve of the test system.
Energies 16 02862 g004
Figure 5. The typical curve of the EVCS charging profile for a day.
Energies 16 02862 g005
Figure 6. The daily curve of solar PV power generation.
Energies 16 02862 g006
Figure 7. Violation of branch current limit using the PF calculation before using optimal energy management with the VPP concept.
Energies 16 02862 g007
Figure 8. The SoC of ESS after solving the optimal scheduling of ESS by the DE algorithm for case 1.
Energies 16 02862 g008
Figure 9. Convergence characteristics of the DE and PSO algorithms for case 1.
Energies 16 02862 g009
Figure 10. The SoC of ESS after solving the optimal scheduling of ESS by the DE algorithm for case 2.
Energies 16 02862 g010
Figure 11. Convergence characteristics of the DE and PSO algorithms for case 2.
Energies 16 02862 g011
Figure 12. Comparison for Optimal Solution Convergence; (a) the PSO Algorithms in Case 1. (b) the DE Algorithms in Case 1. (c) the PSO Algorithms in Case 2. (d) the DE Algorithms in Case 2.
Energies 16 02862 g012
Table 1. Necessary parameters of the ESS for the calculation.
ParametersValue
C E S S c a p ($/kWh)300
P E S S max (MW)300
P E S S c h (MW)300
P E S S d i s (MW)−300
E E S S max (MWh)1500
S o C min (%)20
S o C max (%)90
η c h 0.9
η d i s 0.9
Table 2. DE parameters used for the simulation.
ParameterValue
Number of populations ( n p o p )30
Crossover factor ( C R )0.9
Scaling factor (F)0.6
Table 3. PSO parameters used for the simulation.
ParameterValue
Number of populations30
Inertia factor (W)0.9
Learning factors (C1, C2)2
Table 4. Necessary values for calculating the degradation cost of generators [40,41,42,43].
Type and Fuel
of Generator
Size of Generator
(MW)
Capital Cost
($/kW)
Lifetime
(Year)
Fossil Steam (Oil)12130035
20
100
197
Fossil Steam (Coal)761800
155
350
Hydro (Water)501050
Nuclear Steam
(Light water reactor)
4001200
Table 5. The component of objective function after solving the optimal scheduling of ESS by the DE and PSO algorithms for case 1 and case 2.
AlgorithmCaseOperation Cost ($)Battery
Degradation Cost ($)
Generator
Degradation Cost ($)
PSO11,018,746.76642,785.60546,290.78
21,013,803.34666,420.38423,025.62
Cost difference (%)0.493.6822.56
DE11,011,966.58551,913.68540,176.40
21,008,166.89589,975.19357,317.11
Cost difference (%)0.386.9033.85
Table 6. Comparison of the total cost of the objective function for case 1 and case 2 after solving the optimal scheduling of ESS by the DE and PSO algorithms.
CaseThe Total Cost of Objective Function ($)Cost Difference (%)
PSODE
12,207,823.13 2,104,056.654.70
22,103,249.331,955,459.197.03
Cost difference (%)4.747.06-
Disclaimer/Publisher’s Note: The statements, opinions and data contained in all publications are solely those of the individual author(s) and contributor(s) and not of MDPI and/or the editor(s). MDPI and/or the editor(s) disclaim responsibility for any injury to people or property resulting from any ideas, methods, instructions or products referred to in the content.

