

Impact Assessment of Dynamic Loading Induced by the Provision of Frequency Containment Reserve on the Main Bearing Lifetime of a Wind Turbine

 ,
,  ,
,  ,
,  and
and 
Abstract
1. Introduction
2. Models and Data
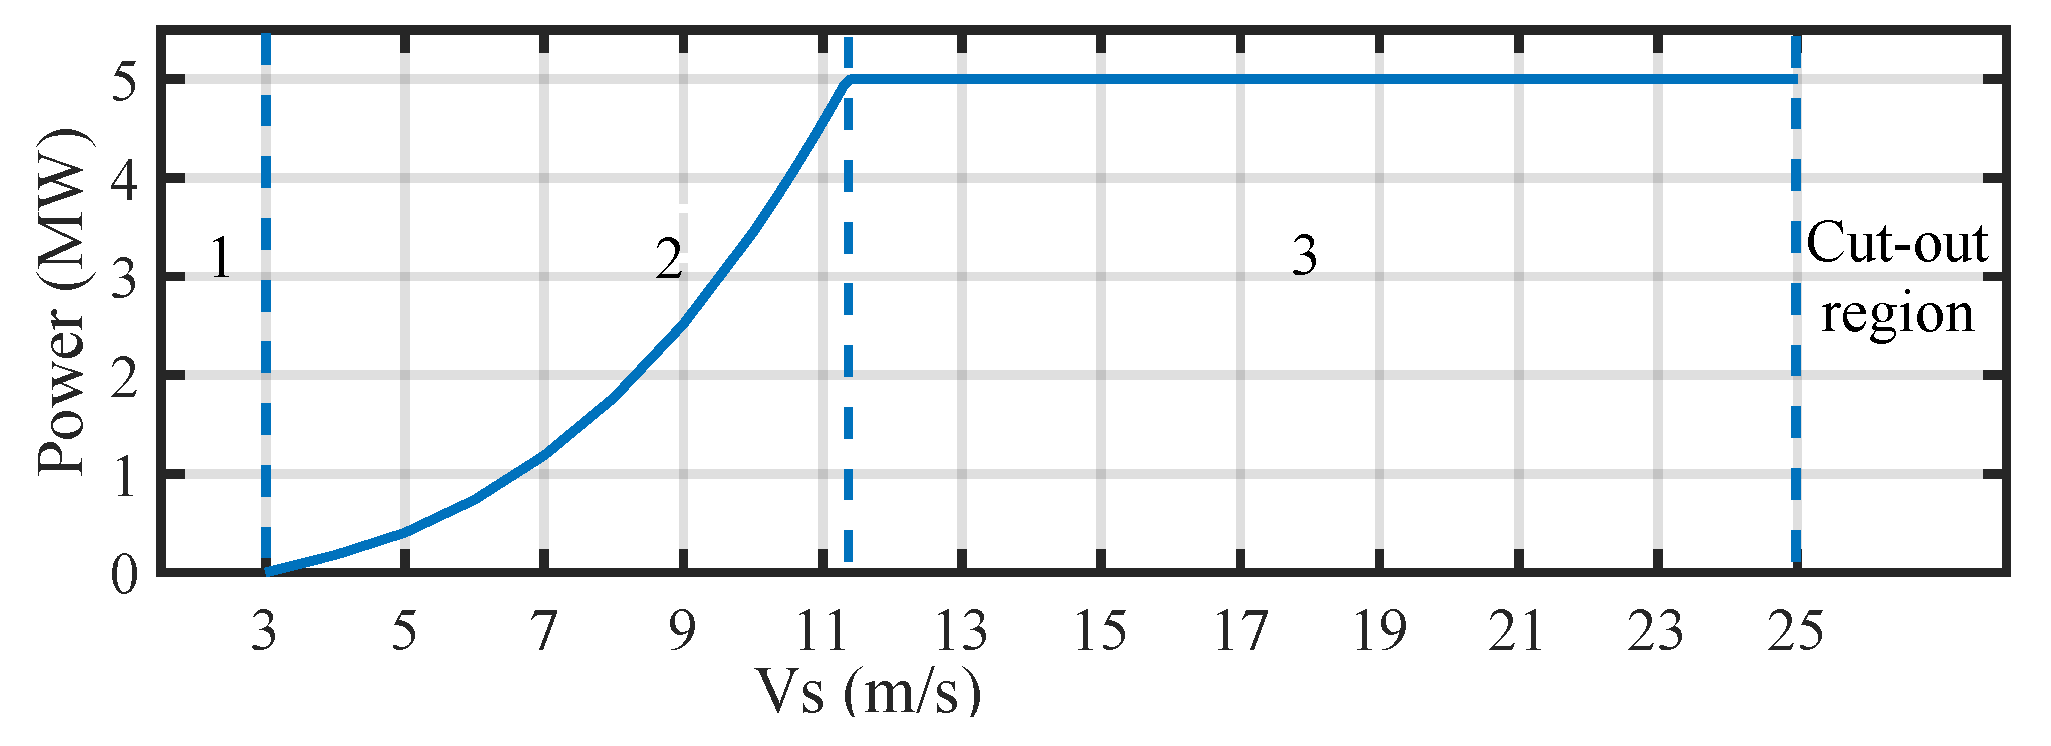
2.1. Wind Turbine
2.2. Main Bearing
2.3. Permanent Magnet Synchronous Generator
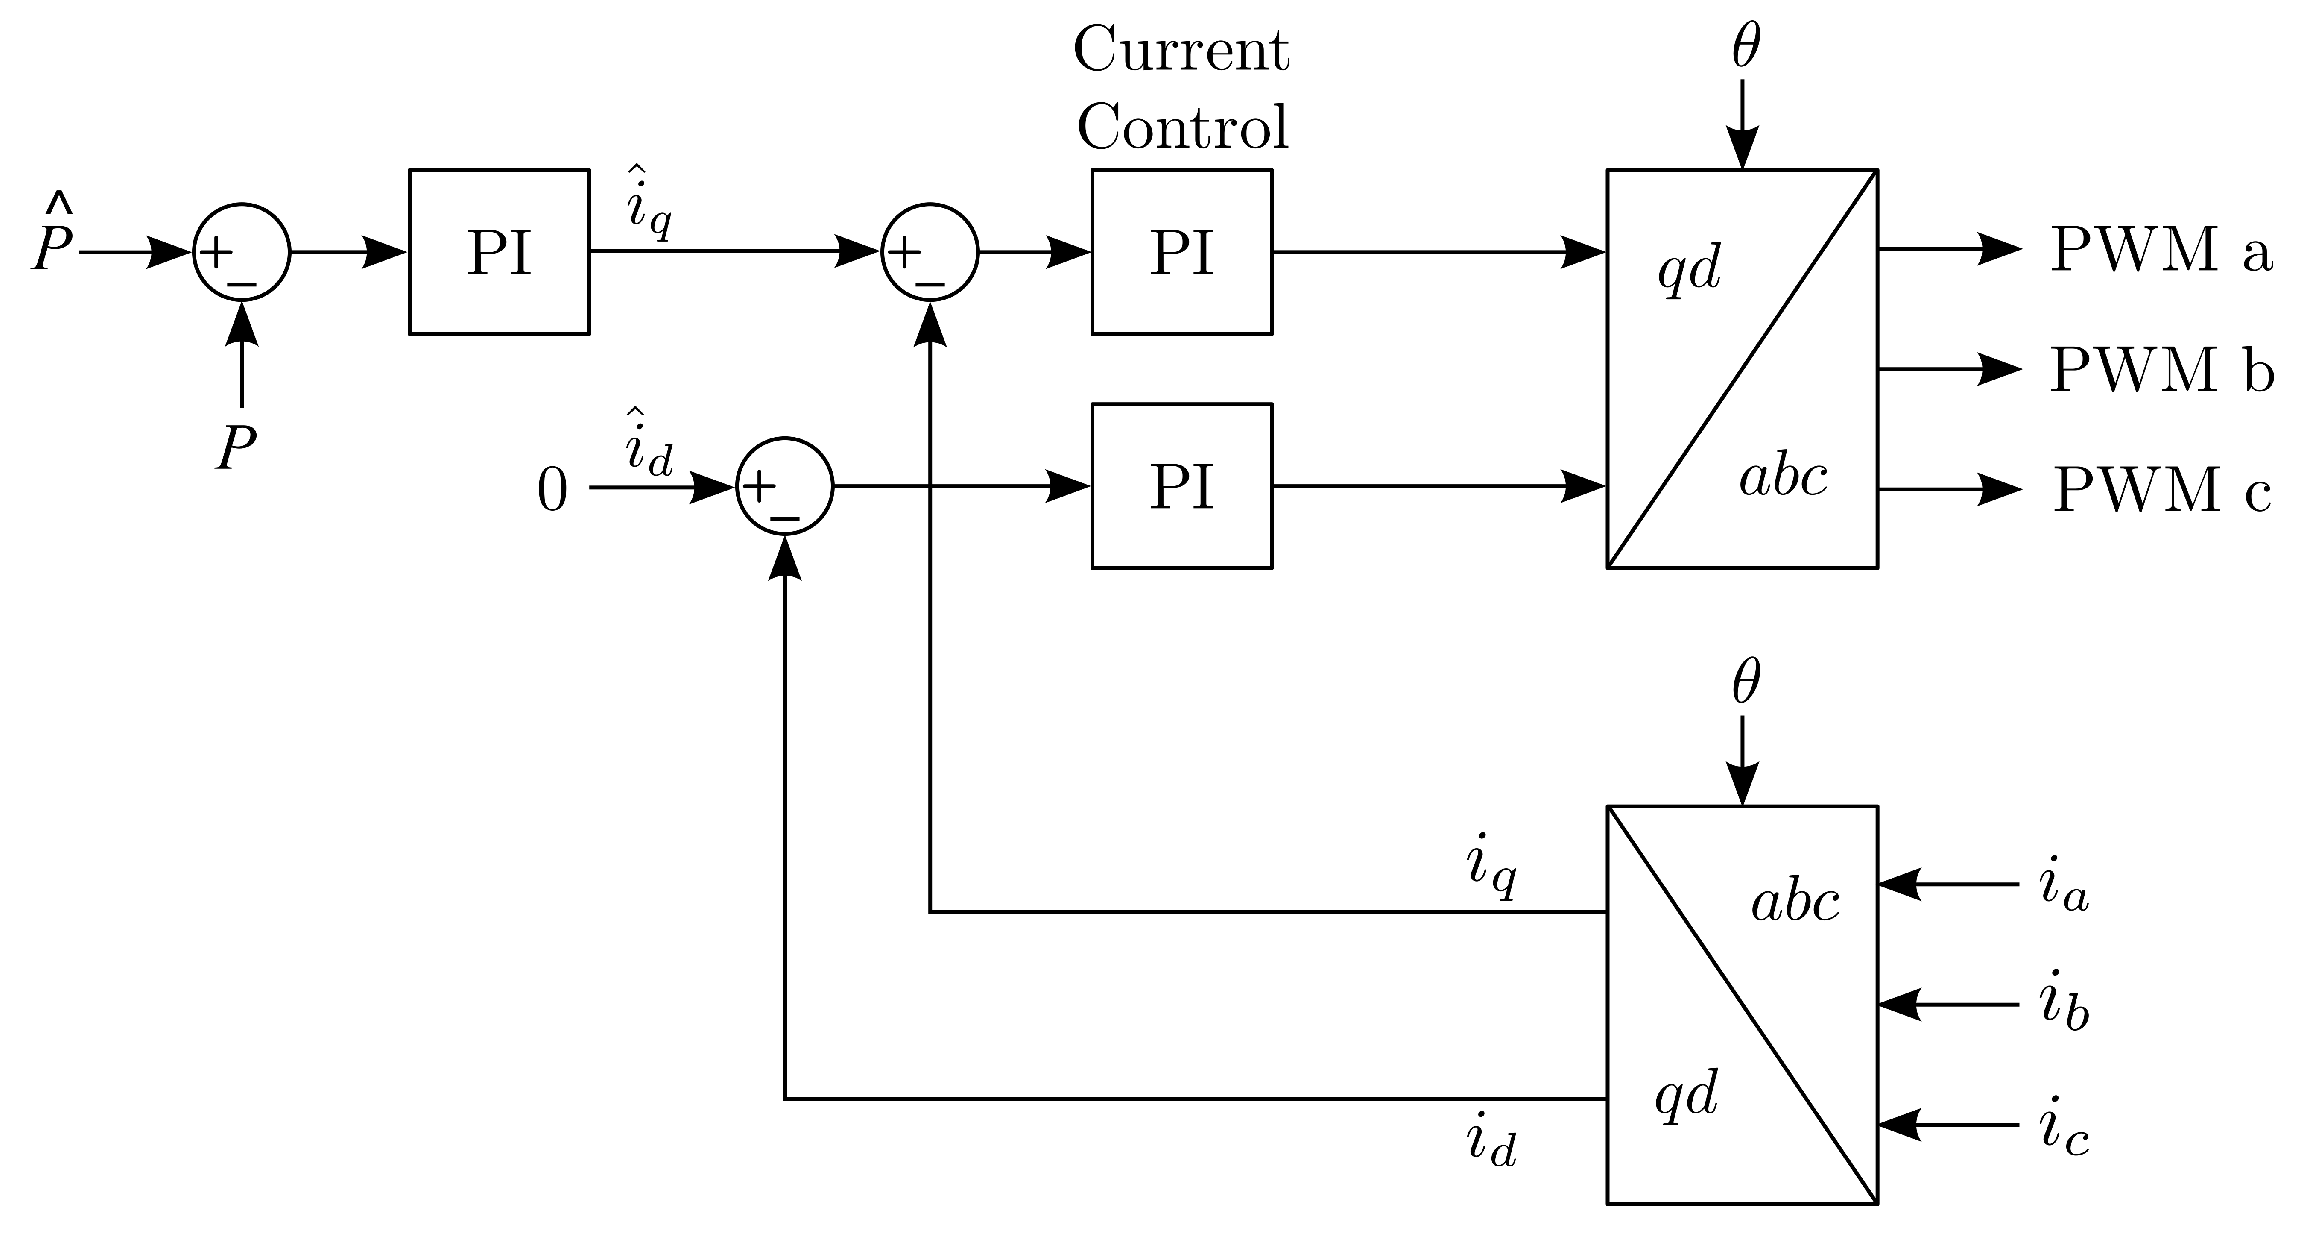
2.4. Control
2.4.1. Torque Control
| Algorithm 1 Reference power decision. | |
| Require: | |
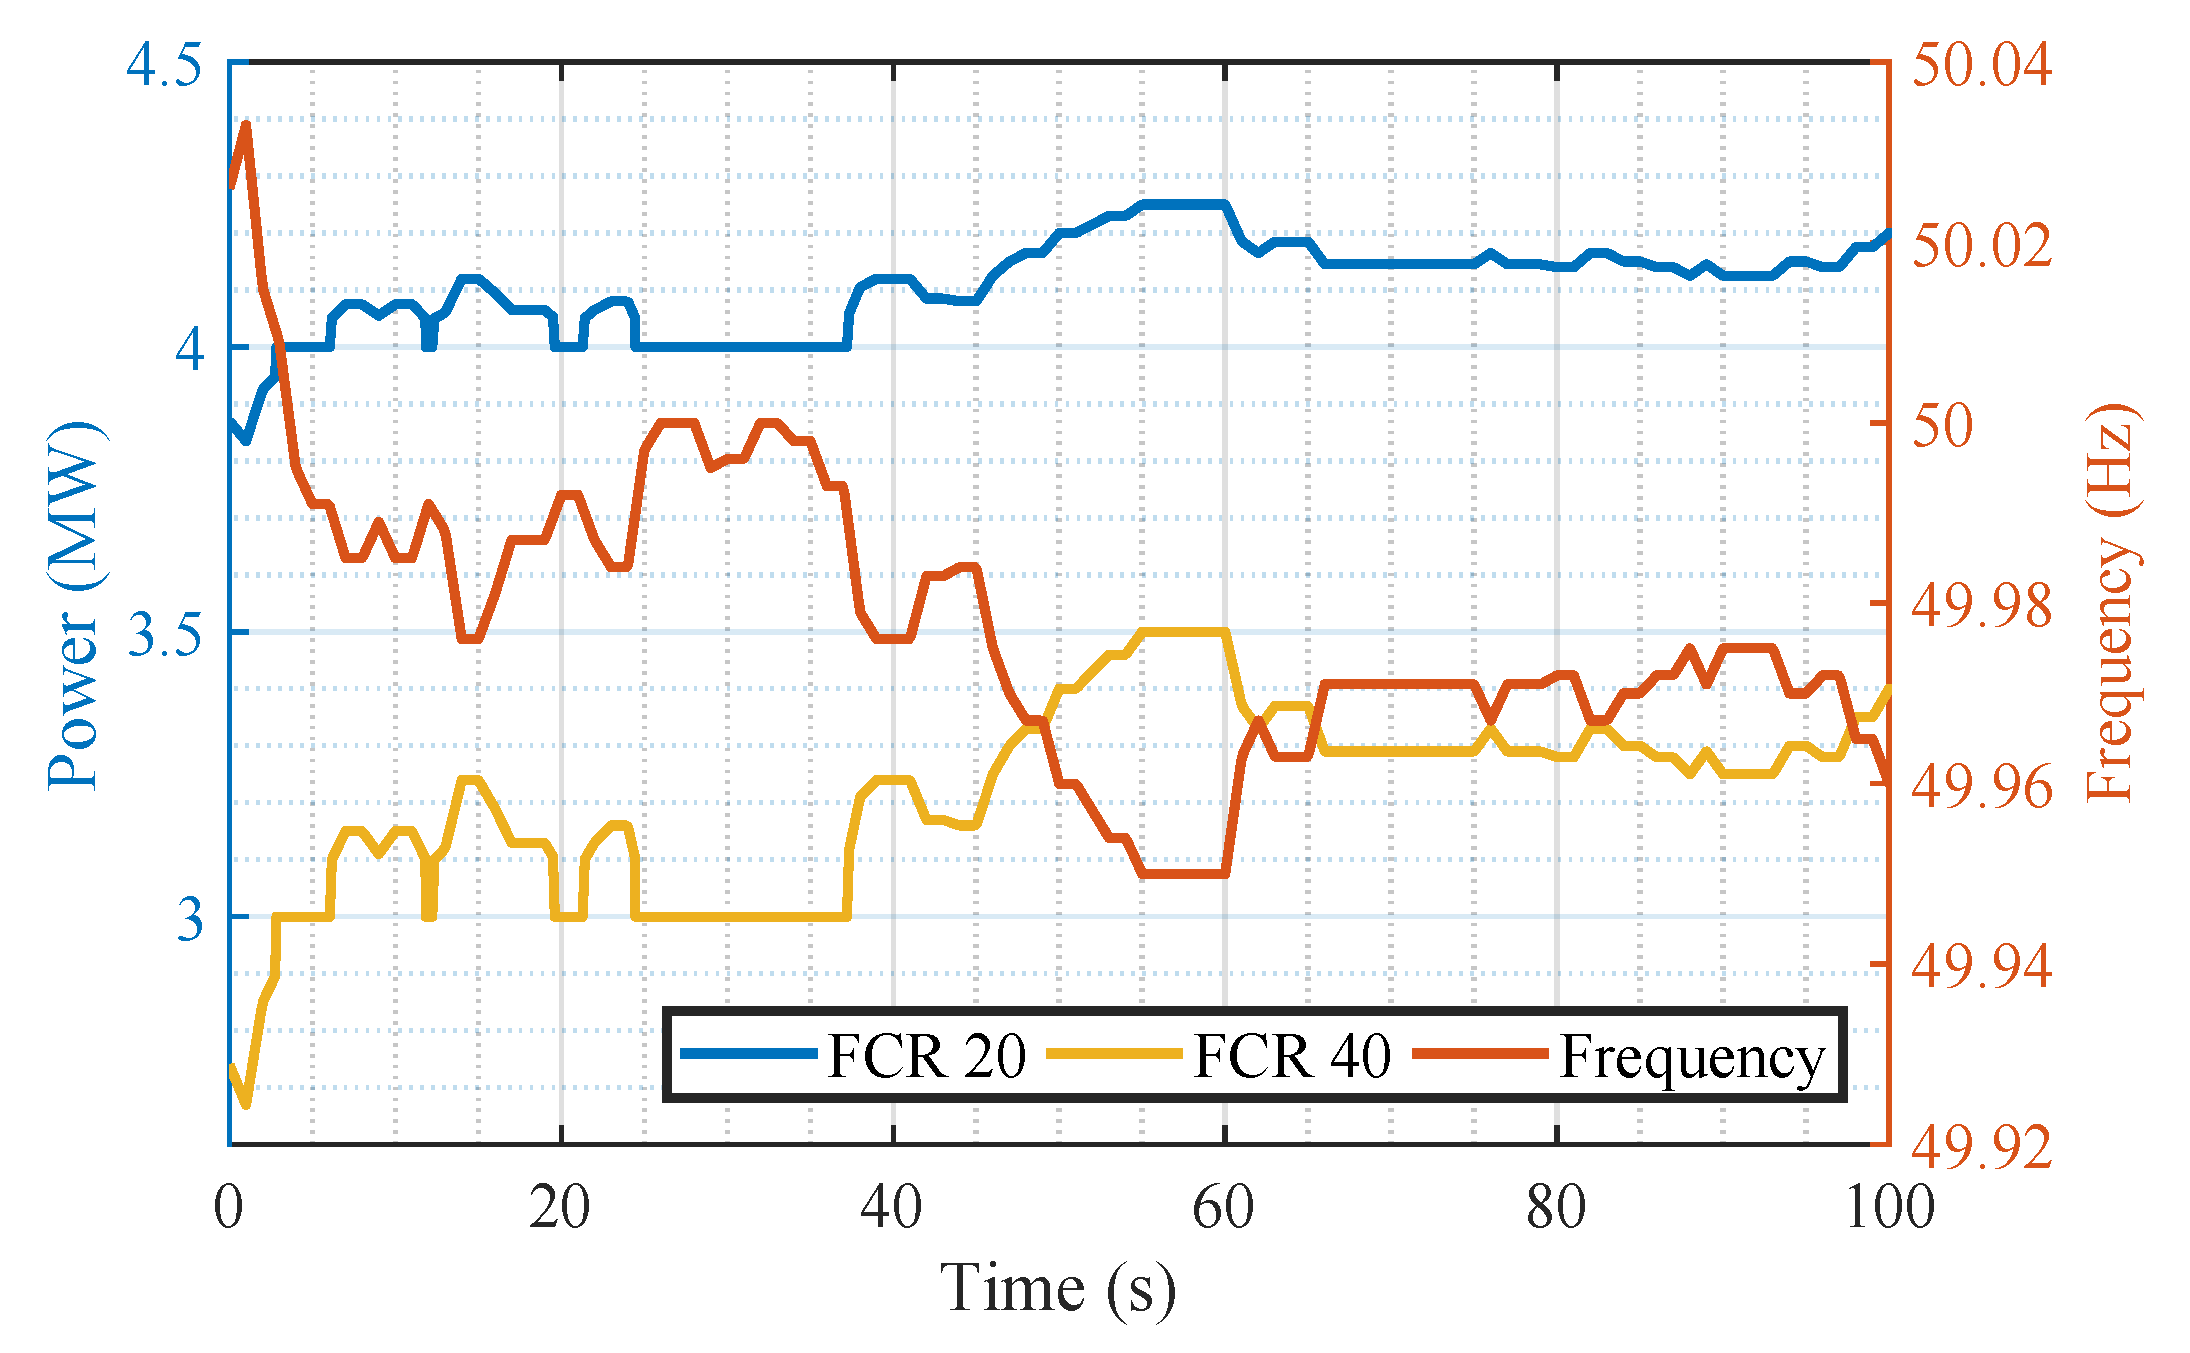
| if Hz then | |
| else if Hz then | |
| ▹=(50-f) | |
| else if Hz then | |
| ▹ 10 mHz deadband | |
| else if Hz then | |
| ▹=(50-f) | |
| else if Hz then | |
| end if | ▹ all powers given in MW |
2.4.2. Pitch Control
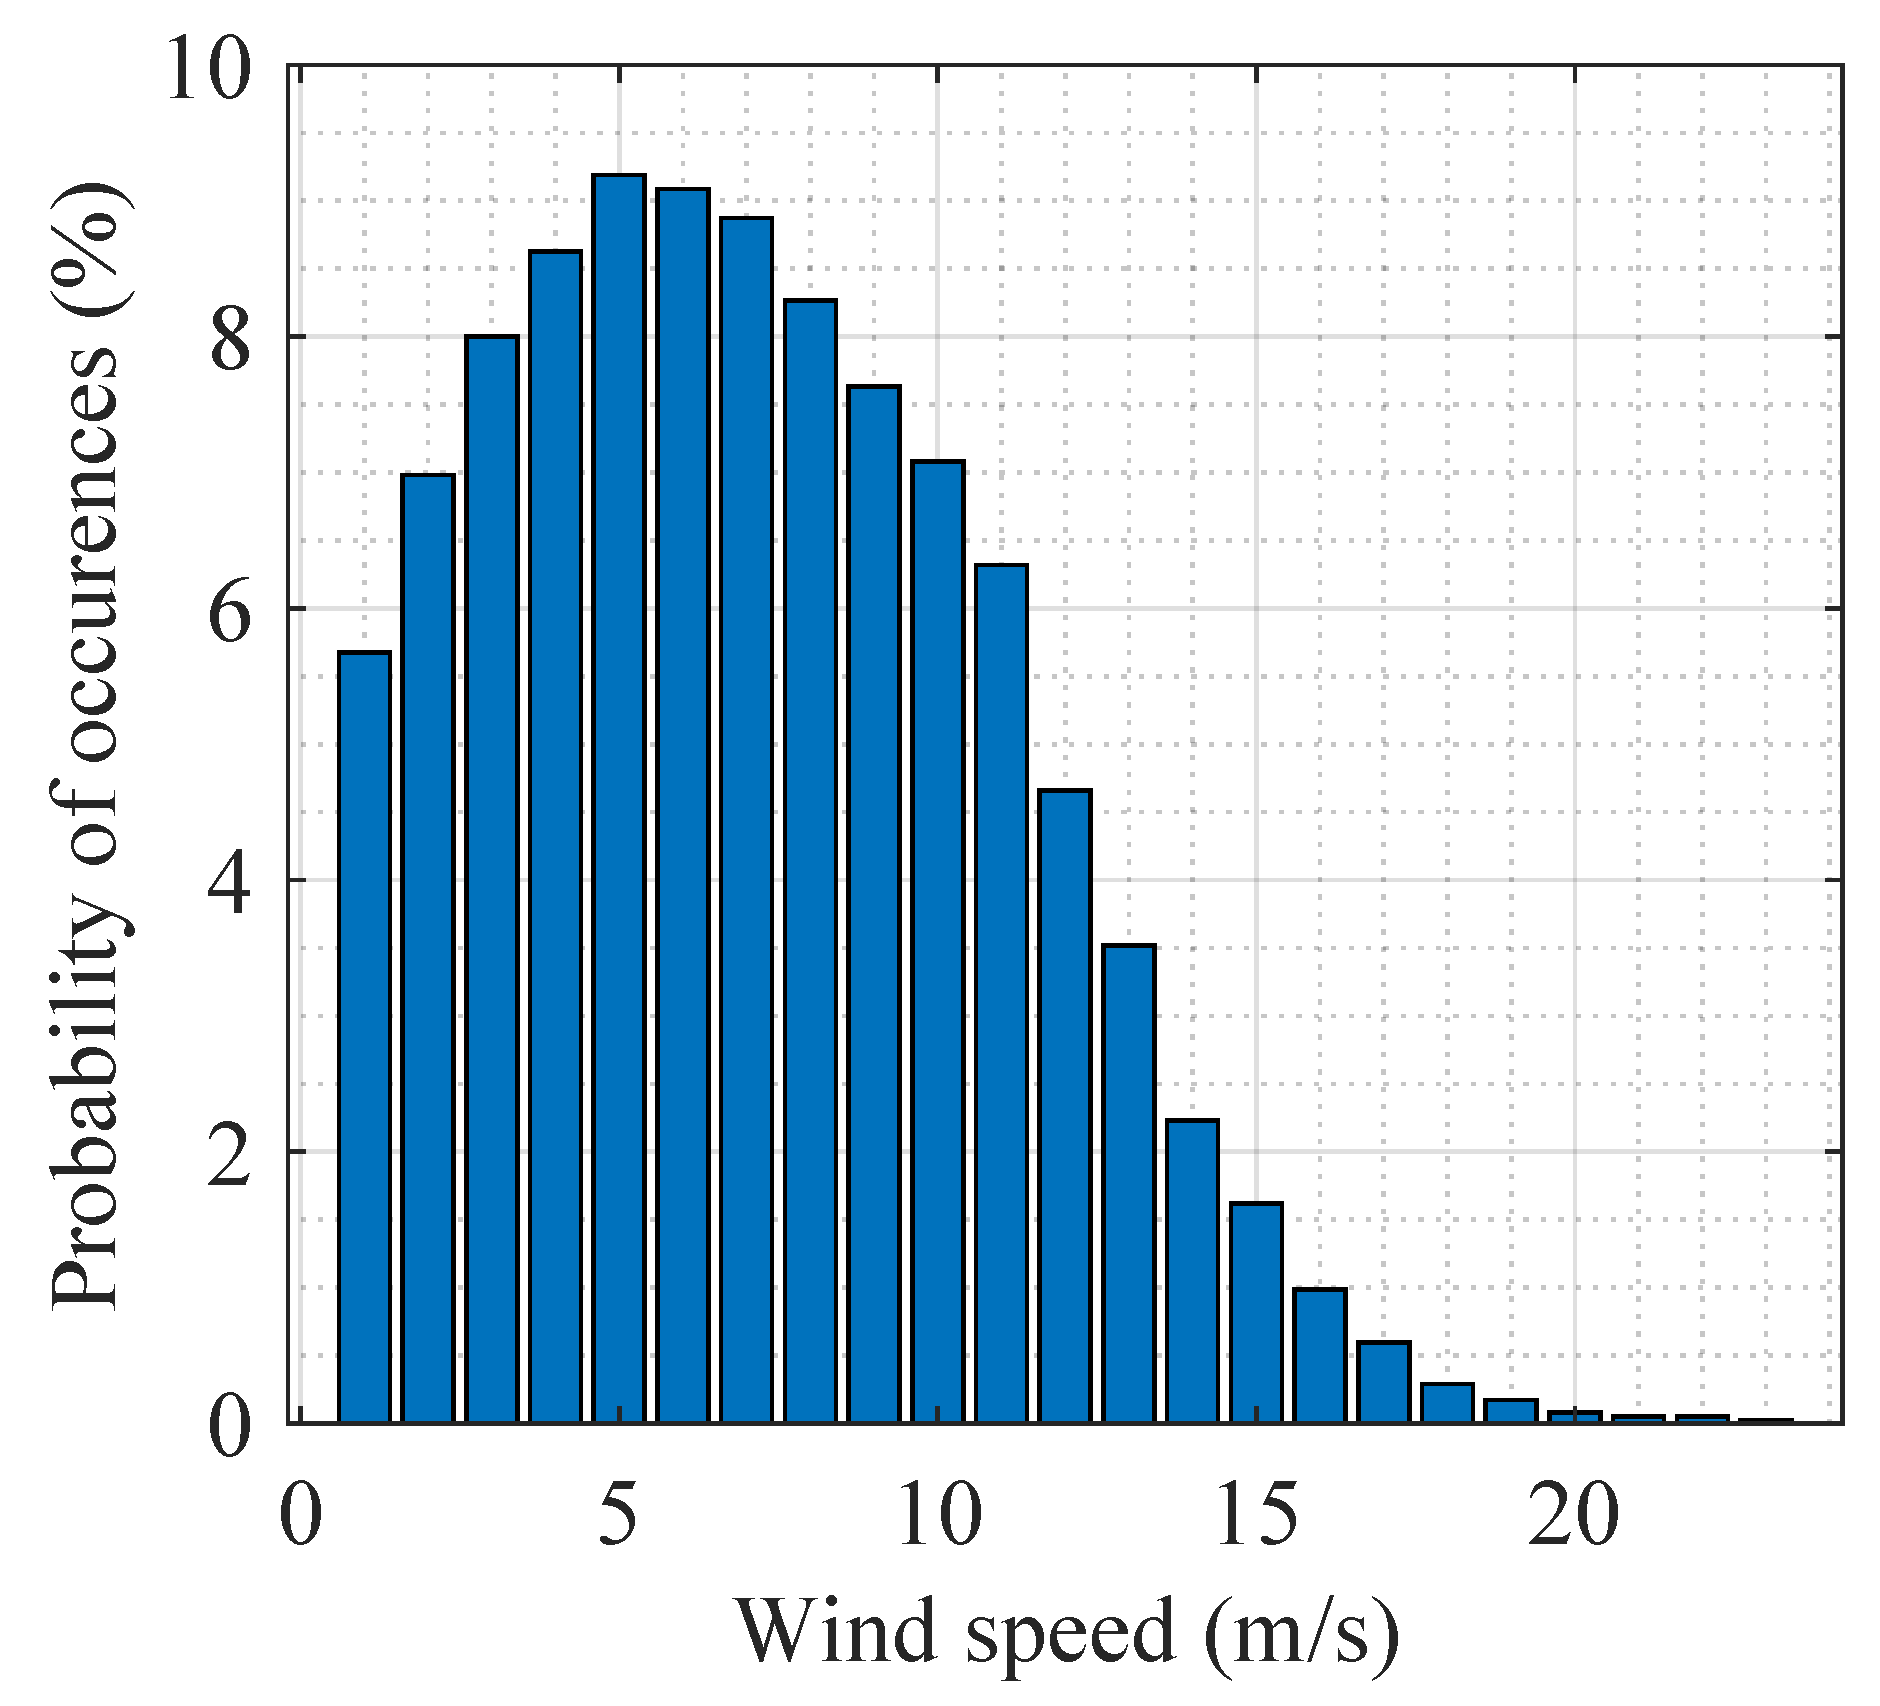
2.5. Wind Field Design and Data Processing
3. Methodology
3.1. Dynamic Equivalent Force
3.2. Lifetime
4. Results and Discussion
5. Conclusions
Author Contributions
Funding
Data Availability Statement
Conflicts of Interest
References
- Global Wind Energy Council. Global Wind Report. 2022. Available online: https://gwec.net/global-wind-report-2022/ (accessed on 1 September 2022).
- IRENA. Renewable Energy Statistics 2022; The International Renewable Energy Agency: Abu Dhabi, United Arab Emirates, 2022; Available online: https://www.irena.org/ (accessed on 1 September 2022).
- Energy Roadmap 2050 Energy. 2012. Available online: https://ec.europa.eu/energy/ (accessed on 1 September 2022).
- Wind Energy in Europe. Available online: https://proceedings.windeurope.org/ (accessed on 1 September 2022).
- Technical Requirements for the Connection of Generating Stations to the Hydro-Québec Transmission System. 2019. Available online: http://www.hydroquebec.com/ (accessed on 1 September 2022).
- European Association for Storage of Energy. Ancillary Services. 2021. Available online: https://ease-storage.eu/wp-content/uploads/2021/08/Ancillary-Services.pdf (accessed on 6 May 2022).
- Hughes, G. The Performance of Wind Farms in the United Kingdom and Denmark; Renewable Energy Foundation: London, UK, 2012; Available online: http://tinyurl.com/cn5qnqg (accessed on 1 September 2022).
- Ribrant, J.; Bertling, L. Survey of Failures in Wind Power Systems With Focus on Swedish Wind Power Plants During 1997–2005. IEEE Trans. Energy Convers. 2007, 22, 167–173. [Google Scholar] [CrossRef]
- Tavner, P.; Xiang, J.; Spinato, F. Reliability analysis for wind turbines. Wind Energy 2007, 10, 1–18. [Google Scholar] [CrossRef]
- Arwade, S.; Lackner, M.; Grigoriu, M. Probabilistic Models for Wind Turbine and Wind Farm Performance. J. Sol. Energy Eng. 2011, 133, 041006. [Google Scholar] [CrossRef]
- Conroy, N.; Deane, J.; Gallachóir, B.Ó. Wind turbine availability: Should it be time or energy based?—A case study in Ireland. Renew. Energy 2011, 36, 2967–2971. [Google Scholar] [CrossRef]
- Staffell, I.; Green, R. How does wind farm performance decline with age? Renew. Energy 2014, 66, 775–786. [Google Scholar] [CrossRef]
- Anonymous. Managing the wind: Reducing kilowatt-hour costs with condition monitoring. Refocus 2005, 6, 48–51. [Google Scholar] [CrossRef]
- Deutsch, J.; He, D. Using Deep Learning-Based Approach to Predict Remaining Useful Life of Rotating Components. IEEE Trans. Syst. Man Cybern. Syst. 2018, 48, 11–20. [Google Scholar] [CrossRef]
- Yang, W.; Tavner, P.J.; Crabtree, C.J.; Wilkinson, M. Cost-Effective Condition Monitoring for Wind Turbines. IEEE Trans. Ind. Electron. 2010, 57, 263–271. [Google Scholar] [CrossRef]
- Pedregal, D.; García, F.; Roberts, C. An algorithmic approach for maintenance management based on advanced state space systems and harmonic regressions. Ann. Oper. Res. 2008, 166, 109–124. [Google Scholar] [CrossRef]
- Raouf, A. Maintenance Excellence: Optimizing Equipment Lifecycle Decision. J. Qual. Maint. Eng. 2004, 10, 75. [Google Scholar] [CrossRef]
- Marquez, F.P.G. An Approach to Remote Condition Monitoring Systems Management. In Proceedings of the 2006 IET International Conference on Railway Condition Monitoring, Birmingham, UK, 29–30 November 2006; pp. 156–160. [Google Scholar]
- García, F.P.; Pedregal, D.J.; Roberts, C. Time series methods applied to failure prediction and detection. Reliab. Eng. Syst. Saf. 2010, 95, 698–703. [Google Scholar] [CrossRef]
- Byon, E.; Ding, Y. Season-Dependent Condition-Based Maintenance for a Wind Turbine Using a Partially Observed Markov Decision Process. IEEE Trans. Power Syst. 2010, 25, 1823–1834. [Google Scholar] [CrossRef]
- Yeghikian, M.; Ahmadi, A.; Dashti, R.; Esmaeilion, F.; Mahmoudan, A.; Hoseinzadeh, S.; Garcia, D.A. Wind Farm Layout Optimization with Different Hub Heights in Manjil Wind Farm Using Particle Swarm Optimization. Appl. Sci. 2021, 11, 9746. [Google Scholar] [CrossRef]
- Bearing Damage and Failure Analysis. Report. Available online: https://www.skf.com (accessed on 20 February 2023).
- Teng, W.; Zhang, X.; Liu, Y.; Kusiak, A.; Ma, Z. Prognosis of the Remaining Useful Life of Bearings in a Wind Turbine Gearbox. Energies 2017, 10, 32. [Google Scholar] [CrossRef]
- Kusiak, A.; Verma, A. Analyzing bearing faults in wind turbines: A data-mining approach. Renew. Energy 2012, 48, 110–116. [Google Scholar] [CrossRef]
- Kusiak, A.; Li, W. The prediction and diagnosis of wind turbine faults. Renew. Energy 2011, 36, 16–23. [Google Scholar] [CrossRef]
- Herp, J.; Pedersen, N.; Nadimi, E. A Novel Probabilistic Long-Term Fault Prediction Framework Beyond SCADA Data—With Applications in Main Bearing Failure. J. Phys. Conf. Ser. 2019, 1222, 012043. [Google Scholar] [CrossRef]
- Wiese, B.; Pedersen, N.; Nadimi, E.; Herp, J. Estimating the Remaining Power Generation of Wind Turbines—An Exploratory Study for Main Bearing Failures. Energies 2020, 13, 3406. [Google Scholar] [CrossRef]
- Jonkman, J.; Butterfield, S.; Musial, W.; Scott, G. Definition of a 5-MW Reference Wind Turbine for Offshore System Development. 2009. Available online: https://www.nrel.gov/docs/fy09osti/38060.pdf (accessed on 1 September 2022).
- Jonkman, J.M.; Hayman, G.J.; Jonkman, B.J.; Damiani, R.R.; Murray, R.E. AeroDyn v15 User’s Guide and Theory Manual, NREL. Available online: https://www.nrel.gov/wind/nwtc/assets/pdfs/aerodyn-manual.pdf (accessed on 1 September 2022).
- Lindenburg, C. Aeroelastic Modelling of the LMH64-5 Blade; DOWEC Dutch Offshore Wind Energy Converter 1997–2003 Public Reports; Energy Research Center of The Netherlands: Petten, The Netherlands, 2002. [Google Scholar]
- Jonkman, J.; Butterfield, S.; Passon, P.; Larsen, T.; Camp, T.; Nichols, J.; Azcona, J.; Martinez, A. Offshore Code Comparison Collaboration within IEA Wind Annex XXIII: Phase II Results Regarding Monopile Foundation Modeling. In Proceedings of the 2007 European Offshore Wind Conference & Exhibition, Berlin, Germany, 4–6 December 2007. [Google Scholar]
- The Great Power. 2005. Available online: https://evolution.skf.com/the-great-power-3/ (accessed on 1 September 2022).
- Samani, A.; De Kooning, J.; Kayedpour, N.; Singh, N.; Vandevelde, L. The Impact of Pitch-To-Stall and Pitch-To-Feather Control on the Structural Loads and the Pitch Mechanism of a Wind Turbine. Energies 2020, 13, 4503. [Google Scholar] [CrossRef]
- Offshore Wind Data. Orsted.com. 2022. Available online: https://orsted.com/en/our-business/offshore-wind/wind-data (accessed on 1 September 2022).
- SKF. Rolling Bearings. 2018. Available online: https://www.skf.com/group/products/rolling-bearings (accessed on 1 September 2022).
- Zaretsky, E.V. Palmgren Revisited: A Basis For Bearing Life Prediction; National Aeronautics and Space Administration: Washington, DC, USA, 1997.


| Property | Specification |
|---|---|
| Power rating | 5 MW |
| Nominal torque | 4 MN-m |
| Rotor orientation & configuration | Upwind, 3 blades |
| Rated rotor speed | 12.1 rpm |
| Rotor and hub diameter | 126 m and 3 m |
| Hub height | 90 m |
| Cut-in, Rated and Cut-out wind speed | 3 m/s, 11.4 m/s and 25 m/s |
| Property | Specification |
|---|---|
| Rated power | 5 MW |
| Rated speed | 12.1 rpm |
| Nominal efficiency | 93% |
| Pole pairs | 117 |
| Nominal voltage | 1950 V |
| Nominal current | 876 A |
| Stator resistance | 98.5 m |
| Quadrature stator inductance | 5.86 mH |
 |
Disclaimer/Publisher’s Note: The statements, opinions and data contained in all publications are solely those of the individual author(s) and contributor(s) and not of MDPI and/or the editor(s). MDPI and/or the editor(s) disclaim responsibility for any injury to people or property resulting from any ideas, methods, instructions or products referred to in the content. |
© 2023 by the authors. Licensee MDPI, Basel, Switzerland. This article is an open access article distributed under the terms and conditions of the Creative Commons Attribution (CC BY) license (https://creativecommons.org/licenses/by/4.0/).
Share and Cite
Singh, N.; Boruah, D.; De Kooning, J.D.M.; De Waele, W.; Vandevelde, L. Impact Assessment of Dynamic Loading Induced by the Provision of Frequency Containment Reserve on the Main Bearing Lifetime of a Wind Turbine. Energies 2023, 16, 2851. https://doi.org/10.3390/en16062851
Singh N, Boruah D, De Kooning JDM, De Waele W, Vandevelde L. Impact Assessment of Dynamic Loading Induced by the Provision of Frequency Containment Reserve on the Main Bearing Lifetime of a Wind Turbine. Energies. 2023; 16(6):2851. https://doi.org/10.3390/en16062851
Chicago/Turabian StyleSingh, Narender, Dibakor Boruah, Jeroen D. M. De Kooning, Wim De Waele, and Lieven Vandevelde. 2023. "Impact Assessment of Dynamic Loading Induced by the Provision of Frequency Containment Reserve on the Main Bearing Lifetime of a Wind Turbine" Energies 16, no. 6: 2851. https://doi.org/10.3390/en16062851
APA StyleSingh, N., Boruah, D., De Kooning, J. D. M., De Waele, W., & Vandevelde, L. (2023). Impact Assessment of Dynamic Loading Induced by the Provision of Frequency Containment Reserve on the Main Bearing Lifetime of a Wind Turbine. Energies, 16(6), 2851. https://doi.org/10.3390/en16062851