1. Introduction
Plant materials intended for energy purposes have become significantly more popular in recent years. In particular, the biomass of forest origin is increasingly used as an energy carrier in Poland. The described substance is a biodegradable raw material produced in the form of waste. Wood-based biomass is produced as a residue in the processes of wood production, processing, or sanitary cutting [
1]. It can be obtained also from forest residues or as a result of care treatments carried out in the so-called general cargo. Huge heating possibilities concentrated in forest areas require supervision, consisting of the regulation of forest resources and ensuring the supply of renewable energy sources [
2]. Adaptation of this fuel requires increasing the use of forest residues and improving the quality of the product by using the optimal technology for the production of briquettes from general logging. The idea of adaptation and dissemination of non-destructive tests of wood products may potentially enable a cheaper, faster, and simpler way to measure the specific density of bulk materials. Defining and determining the value of the density conversion factor is an additional value of work.
Preliminary studies indicate significant differences in the composition of biomass from logging waste. It contains more ingredients such as bark and needles; moreover, it is a biomass usually derived from various plant species, namely from coniferous and deciduous wood. For example, after conducting laboratory tests, Ekielski proved that the effectiveness of the production of briquettes from forest biomass is encouraging in terms of calorific value [
3]. Forest biomass is similar to other plants intended for energy purposes, i.e., Virginia mallow, sugar miscanthus, or Jerusalem artichoke, which have similar processing schemes. Therefore, all technological operations can be analogous to the processing of straw plants [
4]. Co-combustion of forest biomass may be another opportunity to replace fossil fuels, and, thus, there is a possibility of further reduction of harmful gas emissions into the atmosphere.
One of the non-destructive tests of the solid structure is X-ray waves. X-ray radiation is an electromagnetic field that is generated from the emission of electrons. The wave latitude measures 10 pm to 10 nm and is placed between ultraviolet (UV) and gamma radiation. Techniques involving X-ray radiation are mostly popular in medicine to diagnose the internal structure of objects. However, they are also used in defectoscopy or studies of structural and spectral analysis. Wood science uses X-ray technology for various applications, including the study of wood anatomy and the analysis of wood-based materials. An example of X-ray’s usage in wood science could be the studies of the internal structure of wood and the distribution of different cell types. This can be studied by using X-ray computed tomography (CT) scans of wood samples. Other wood-based materials analysis can be treated by X-ray diffraction (XRD), and X-ray fluorescence (XRF) can be used to determine the crystal structure and chemical composition.
X-ray technology can be used to non-destructively test wood samples, which means that no physical damage is caused. The prepared wood briquette samples were identified by X-ray technology. The performed studies aim to measure the effect of biomass briquettes’ structure by visualization of wood chip fractions under the X-ray. According to the studies, X-ray technology is a valuable tool in wood science for analyzing wood-based materials and improving the quality and performance of wood products.
The shredded Scots pine wood (
Pinus sylvestris L.) as bases of investigated materials were used. Scots pine wood [
5,
6] is widely used in a variety of applications, including construction, furniture, flooring, and paper production. The wood is light yellow to reddish brown in color, with a straight grain and a fine, even texture. It is also used as a source of wood pulp for paper production and as a raw material for the production of wood-based panels. Due to its low density and relatively low cost, it is also commonly used as a source of wood chips for the production of energy. Scots pine wood is a versatile and widely used species of tree, known for its light, soft wood that is easy to work with and has a variety of uses.
2. Materials and Methods
2.1. Material for Tests
The research assumptions require a comprehensive analysis of the material by subjecting the raw material to fragmentation and then compaction in specific proportions and parameters. The tests were carried out in a prepared logical sequence, analyzing the properties of the raw material and the product. It was noticed that the forest residues contained a certain amount of fine admixtures in the form of soil, bark, moss, and needles. The material analysis began with the examination of the basic physical characteristics and granulometric composition; then, the physical and chemical parameters were determined.
2.2. Physical Preparation of Raw Material
Shredded forest residues come from the processing of biomass generated during tree felling, cleaning, or sanitary cutting. They contain a certain amount of fine admixtures in the form of soil, bark, moss, and needles. The characterization of the analyzed material began with the examination of the basic physical characteristics and granulometric composition. The study required pre-treatment of collected wood. The material used in the study was shredded by shredder type RTB13, with a fraction on the sieves not exceeding 16 mm. The tests were conducted according to PN-EN 15149-1:2011 [
7] and PN-EN 15149-2:2011 [
8] standards. The test takes 120 s, where the fractions of 0.1–1.0, 1.1–4.0, 4.1–8.0, and 8.1–16 mm, corresponding to the groups of
f1 (0 ÷ 1),
f2 (1 ÷ 4),
f3 (4 ÷ 8), and
f4 (8 ÷ 16), were separated from the test, and the briquettes were prepared as a base for further research.
The other significant parameter that affects the briquetting process in a significant way is the measurement of moisture content; that target moisture was 12%. The material was dried at 103 ± 2 °C, taking into account the constant moisture content of the wood material. The sorted particles before the preparation of the briquettes were dried to a moisture of 12%. The moisture content of the shredded wood material was tested according to PN-ISO 589:2006 [
9]. The material was additionally controlled before compaction. The tests were carried out with the use of the Radwag WS30 type weighing dryer.
2.3. Chemical Properties of the Tested Material
The determination of chemical parameters was aimed to measure the C, H, O, N, S content. In order to determine the ash content, the sample was tested. The analysis of carbon, hydrogen, nitrogen, and sulfur was carried out in the specialist laboratory apparatus Vario macro elementar. After determining the elemental content of carbon, hydrogen, and nitrogen, the sample of the raw material was incinerated, determining the ash and oxygen content. The oxygen share was determined as an indication and resulted from the content of other elements and ash in the analyzed material. Prepared material after thermally treating produces ash.
Due to its composition, ash determines mineral saturation, consisting of silicon, iron, aluminum, calcium, magnesium, sodium, and potassium [
10]. A muffle oven was used to measure the ash content [
11] according to the norm PN-ISO 2144:1996 [
12]. The measured raw material was brought to a dry state before ashing. During the experiment, the mass of the weighed sample was recorded in a crucible. In this study, three weights were prepared (with an accuracy of 0.0001 g) with a mass of approximately 3 g per sample. Samples were heated in a muffle oven that had to be warmed to 805 ± 2 °C before testing. The samples were tested for ash content over a period of two hours. In order to cool the sample, it was placed in a desiccator after being ashed in the crucible. In the following step, the weight of the crucible with the ash inside was determined.
2.4. Helium Pycnometry
In wood science, helium pyrometry is used to determine the density of wood and wood-based materials. It relies on the principle of gas displacement to determine the volume of a sample by determining how much gas (typically helium) is required to fill a known volume. Material porosity can be detected using helium pycnometry. Compared with traditional methods, helium pycnometry captures accurate, specific results that describe absolute volume changes. There is a high degree of correspondence between helium pyrometry and traditional methods [
13].
The displacement medium is usually an inert gas, such as helium. The sample is placed in a sealed cup with a known volume. The cup was placed in the sample chamber. It involves gas injection into a sample chamber, expanding it into a known volume chamber, and then expanding it back into the first one. After filling the sample cell and releasing the pressure in the expansion chamber, the volume was calculated. The true density of the sample can be calculated by dividing the weight of the sample by the volume measured. As a result of helium pycnometry true density, measurements results are often referred to as helium density, implying that open pores are excluded from the calculation of true density.
2.5. Briquetting Process in Special Compaction Head
The briquetting process was conducted on the prepared samples. The measurement stand connected the testing machine to the computer. In order to carry out the planned tests, the compaction head was used. Specimens were prepared for testing on an appropriate measuring stand. The study involved determining the compressive strength of test specimens [
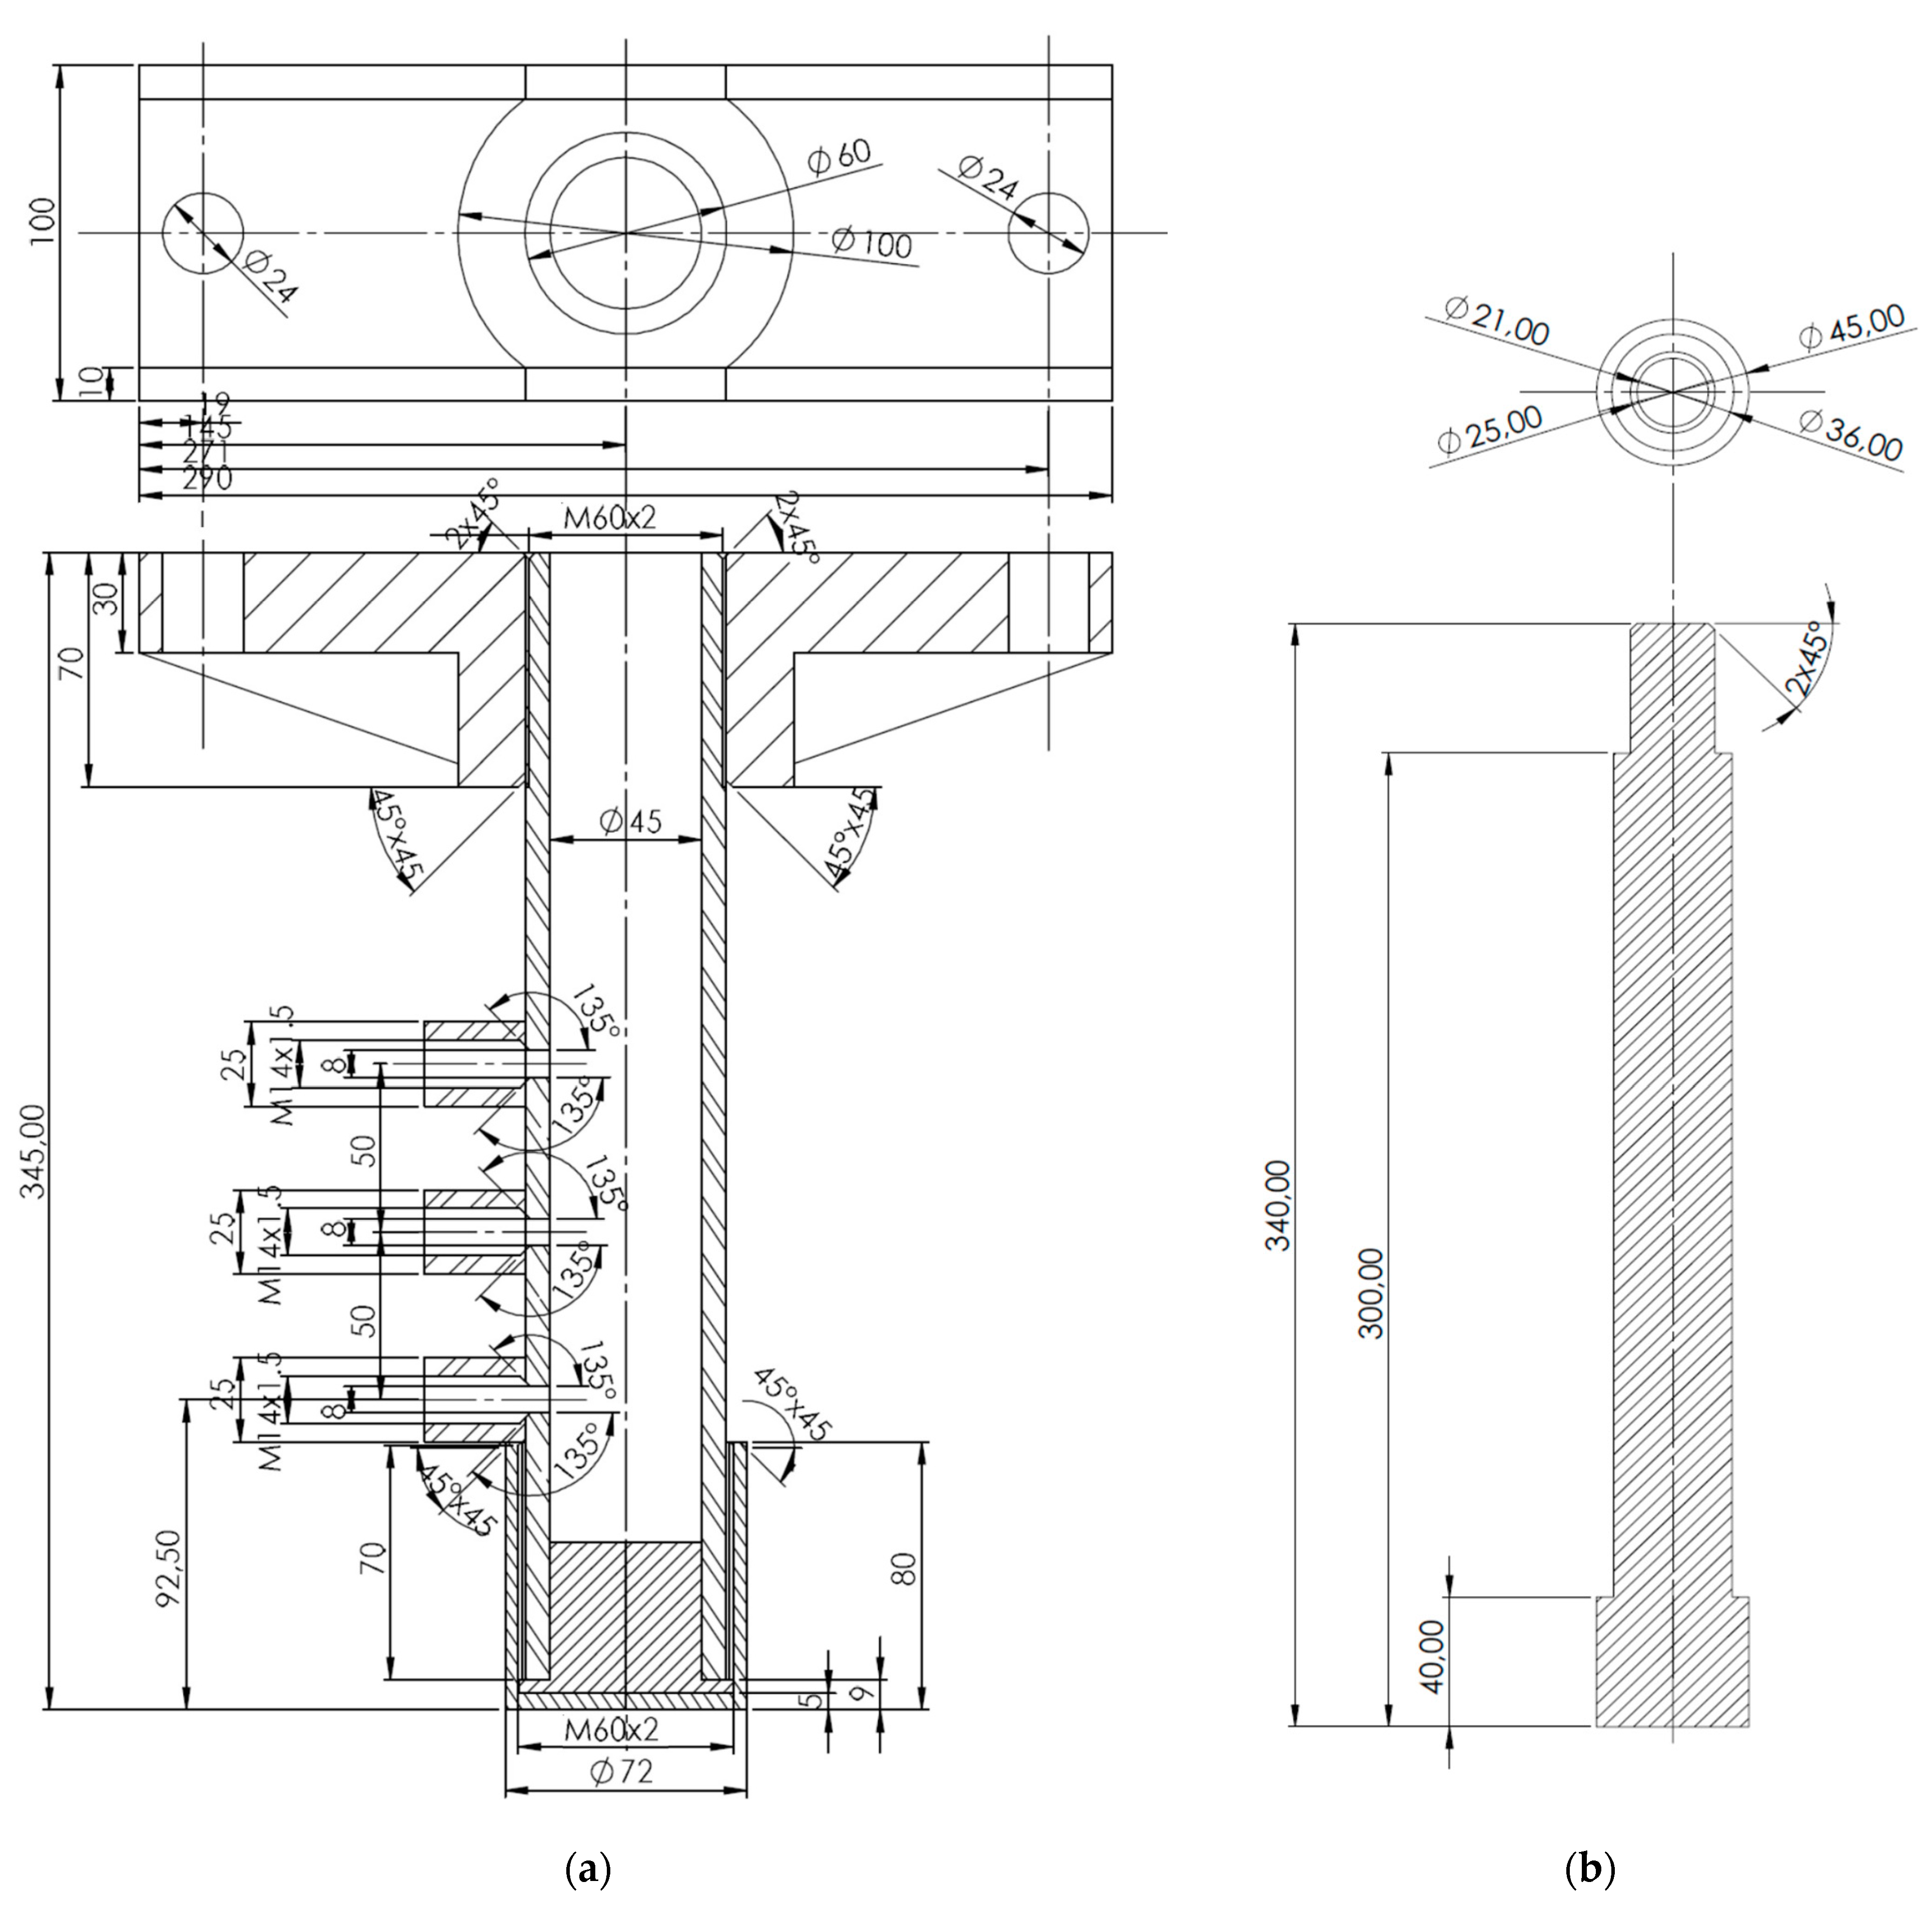
14]. It was determined that the prepared raw material sample would be compacted inside the chamber at a preferred temperature level. During preparation, the controller was set up to maintain a heater’s constant temperature according to the instructions. The temperature requirement, in this case, was 120 °C. The technical drawing of the compaction head and piston is presented in
Figure 1.
The compaction process involves compression of force no greater than 100 kN. The force values will be changed if the quality of the produced sample cannot be satisfied. Compression was performed on samples measuring about 100 cm
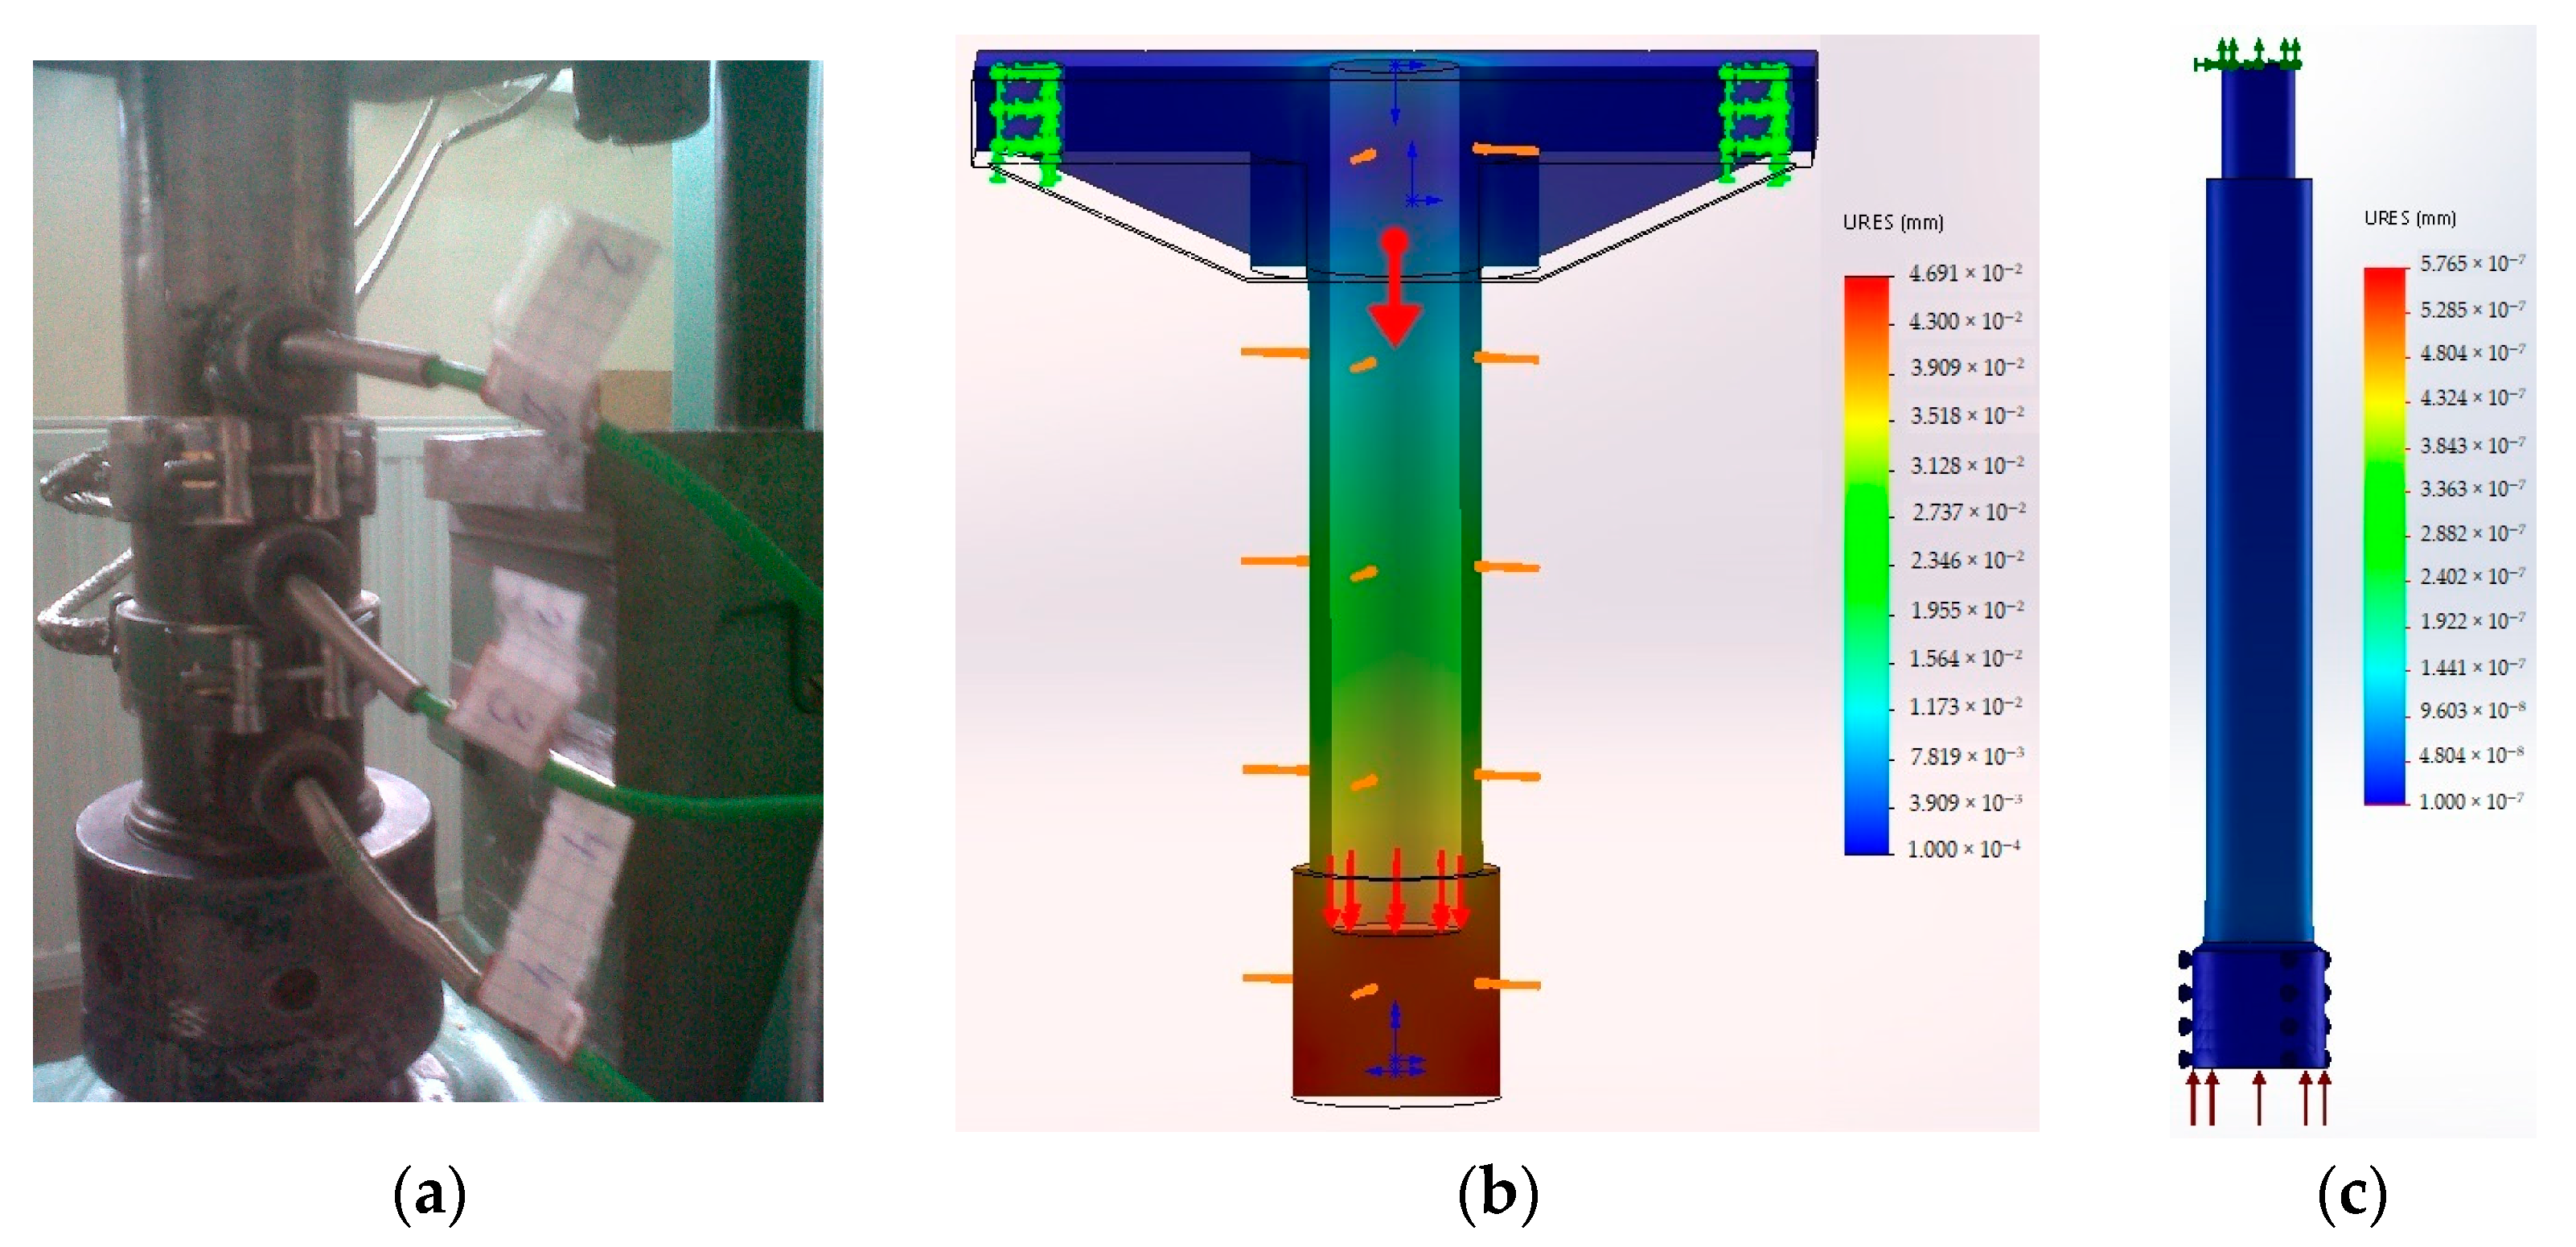
3. Constant parameters were the inner diameter of the compaction chamber (45 mm) and its length (300 mm). The parameters of the compaction head and the maximum compaction pressure reach 63 MPa. The sample strength is determined by the amount of resistance created when compressive stresses are applied in a given direction. Different materials can have different compressive strengths due to their anisotropic nature. The actual image of the compaction head and displacement simulation is presented in
Figure 2.
2.6. X-ray Photography Analysis
The study aims to measure the effect of biomass briquette structure by visualization of wood chip fractions under X-ray. The method of X-ray diagnostic is based on the absorption of wave radiation by various particles of matter. In the softer matter, X-ray waves with higher intensity of radiation are passing through structures more easily, making blackout spots on photographic paper. That process is caused by two electrodes (cathode and anode) sunk in a vacuum or compressed air glass bulb. Cathode reaches the voltage of incandescence Uh causing the electrons’ emission, which is accelerated by anode voltage
Ua. Electrons reaching the anode are detained with the matter [
15]. Tests involve a wood material known as Scots pine (
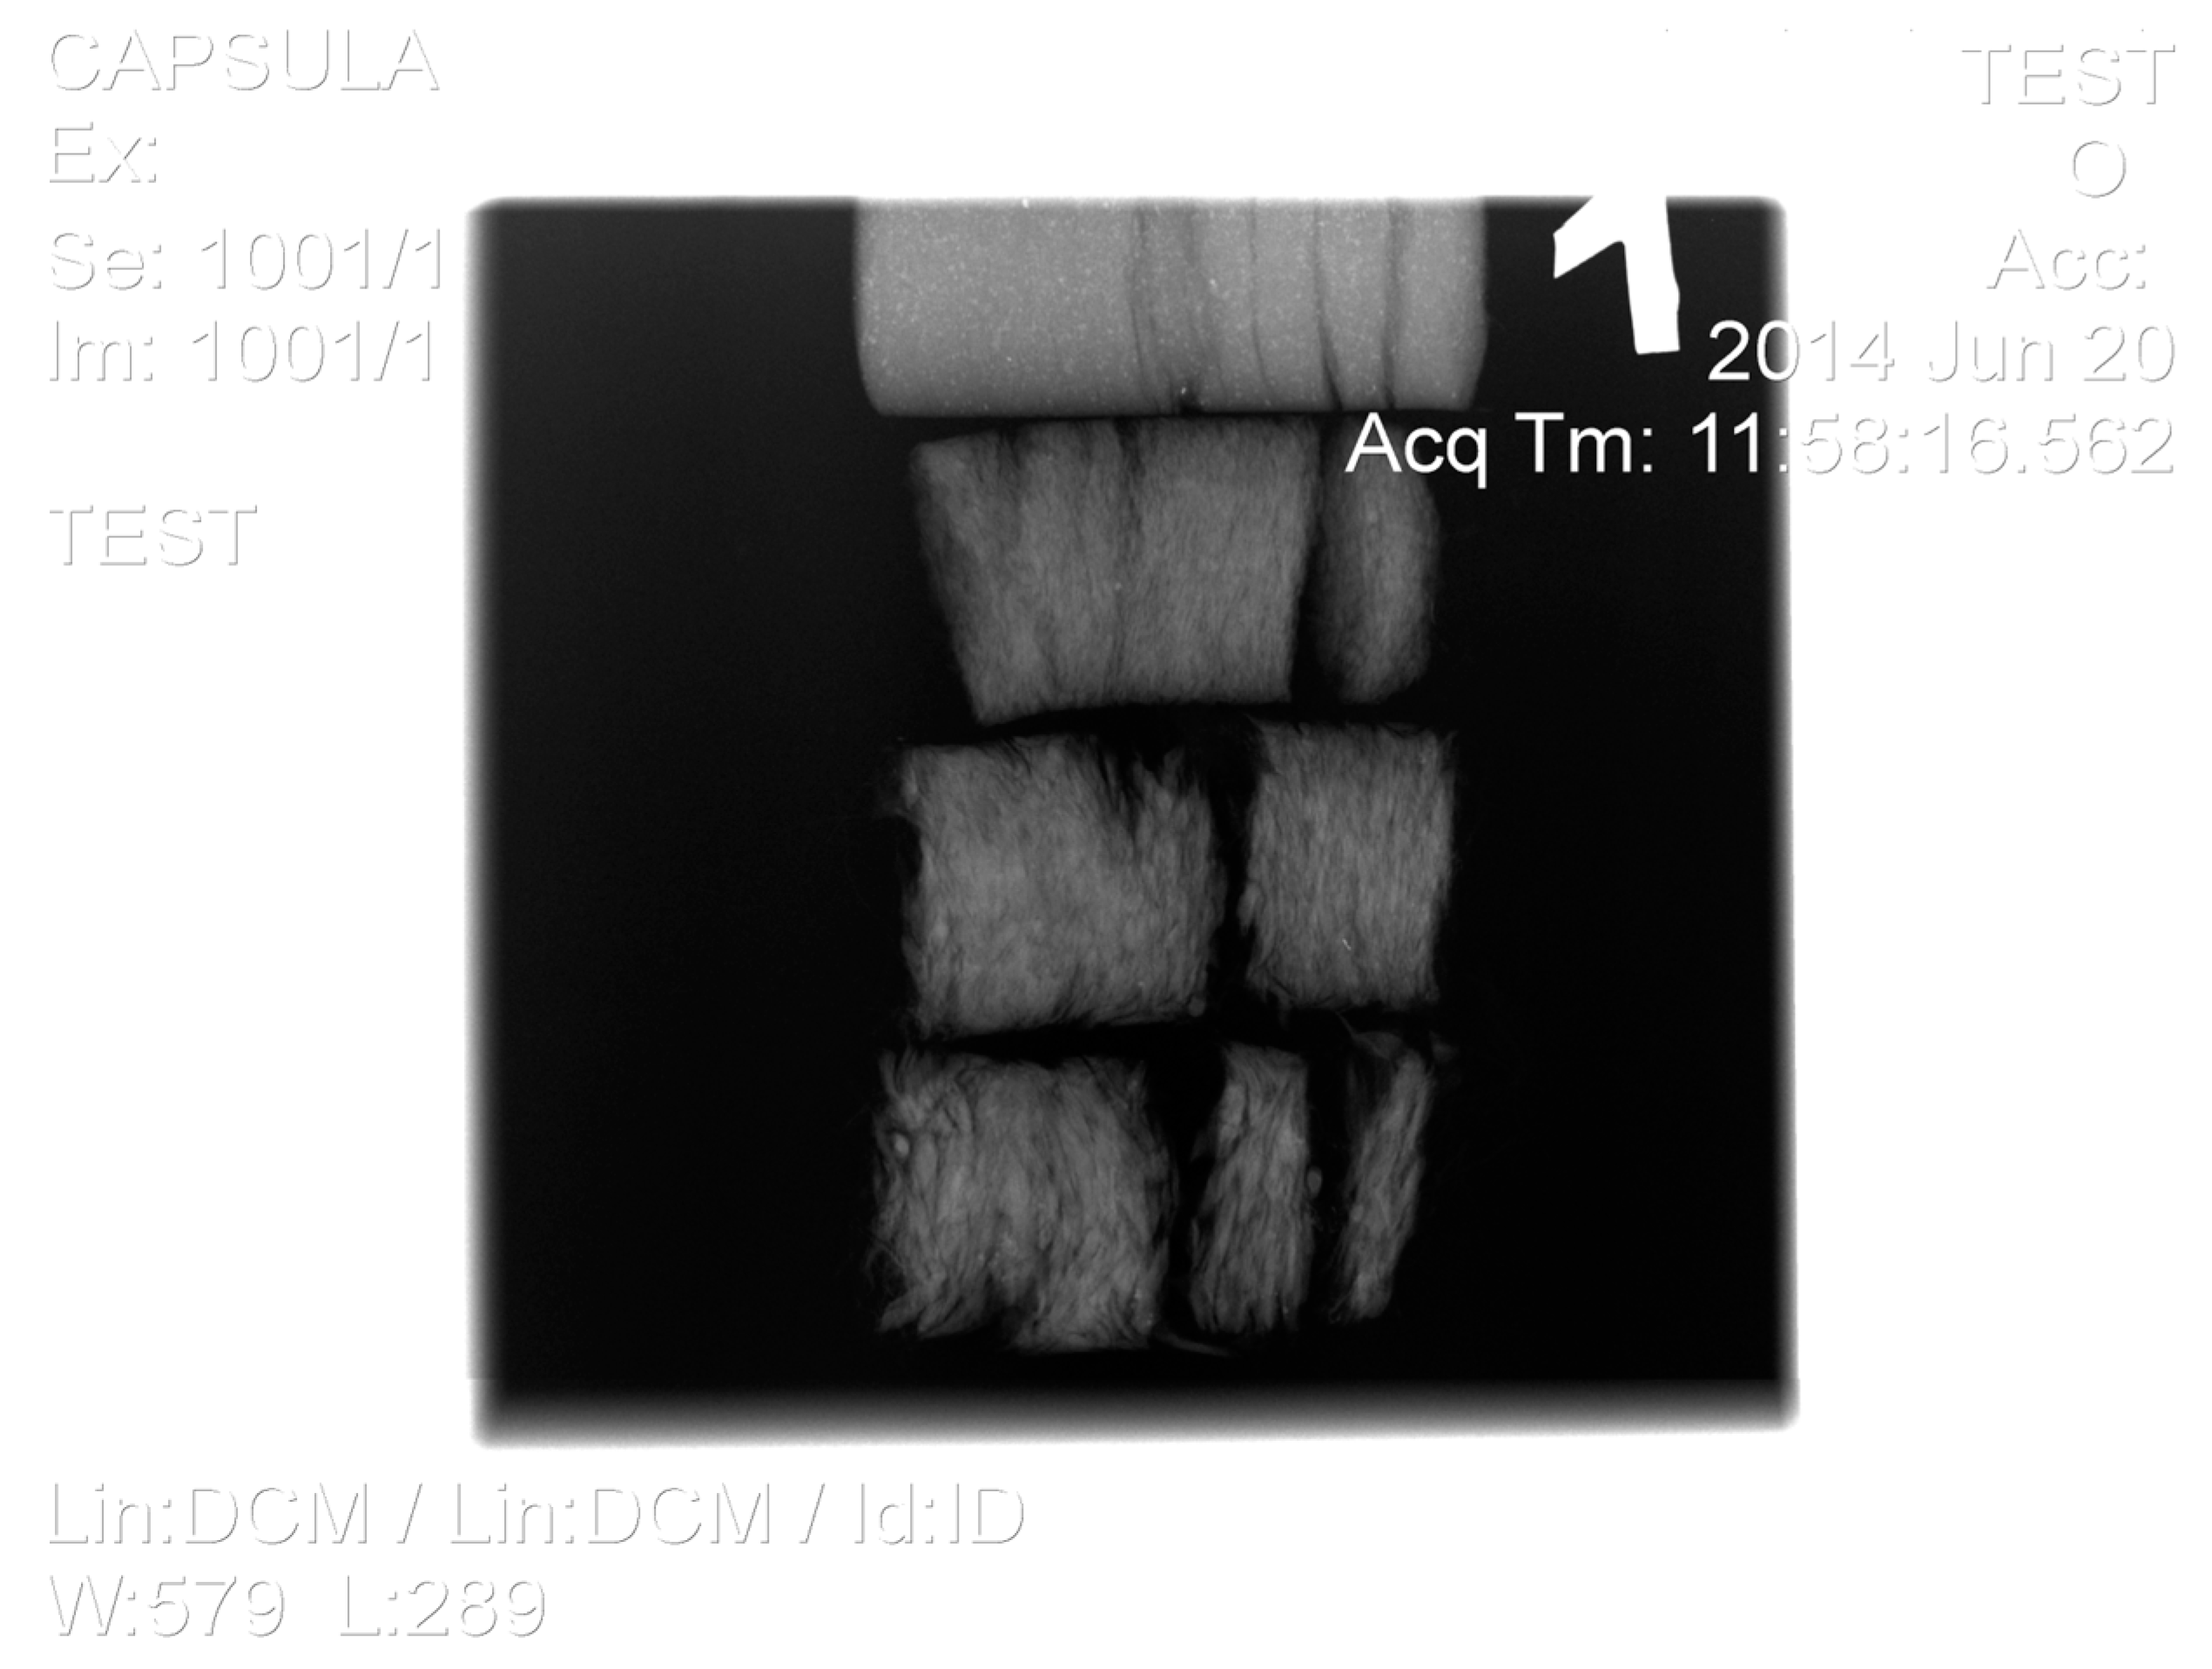
Pinus Sylvestris L.) in the fractions of ranges 0.1–1.0, 1.1–4.0, 4.1–8.0, and 8.1–16 mm. Examination of X-ray photography can describe the density coefficient of the briquette divided into fraction ranges, after the briquetting process. The X-ray photography of analyzed briquettes is presented in
Figure 3.
In the upper right corner of the picture (
Figure 3), the steel test material that presents the inversion of number one can be seen. The spectrum of steel is white, which means that X-ray waves do not pass through that material. The X-ray spectrum shows the differentiated briquette density coefficient depending on the fraction from which they were made. The surface of the compression wood of 0–1 fraction appears distinctly lighter-colored, with means it is a denser wood area on the surface. Wood may change its chemical composition and structure after compaction. This image of the X-ray spectrum was the final form needed for the density coefficient analysis of every briquette type. A specially prepared software program was used to examine the images. The desaturation of the picture is analyzed pixel-by-pixel in the loop by the software. In a specially developed program, pixel colors are analyzed based on grayscale values. The computer program interface was designed and programmed in Delphi. The functioning of the algorithm is presented in
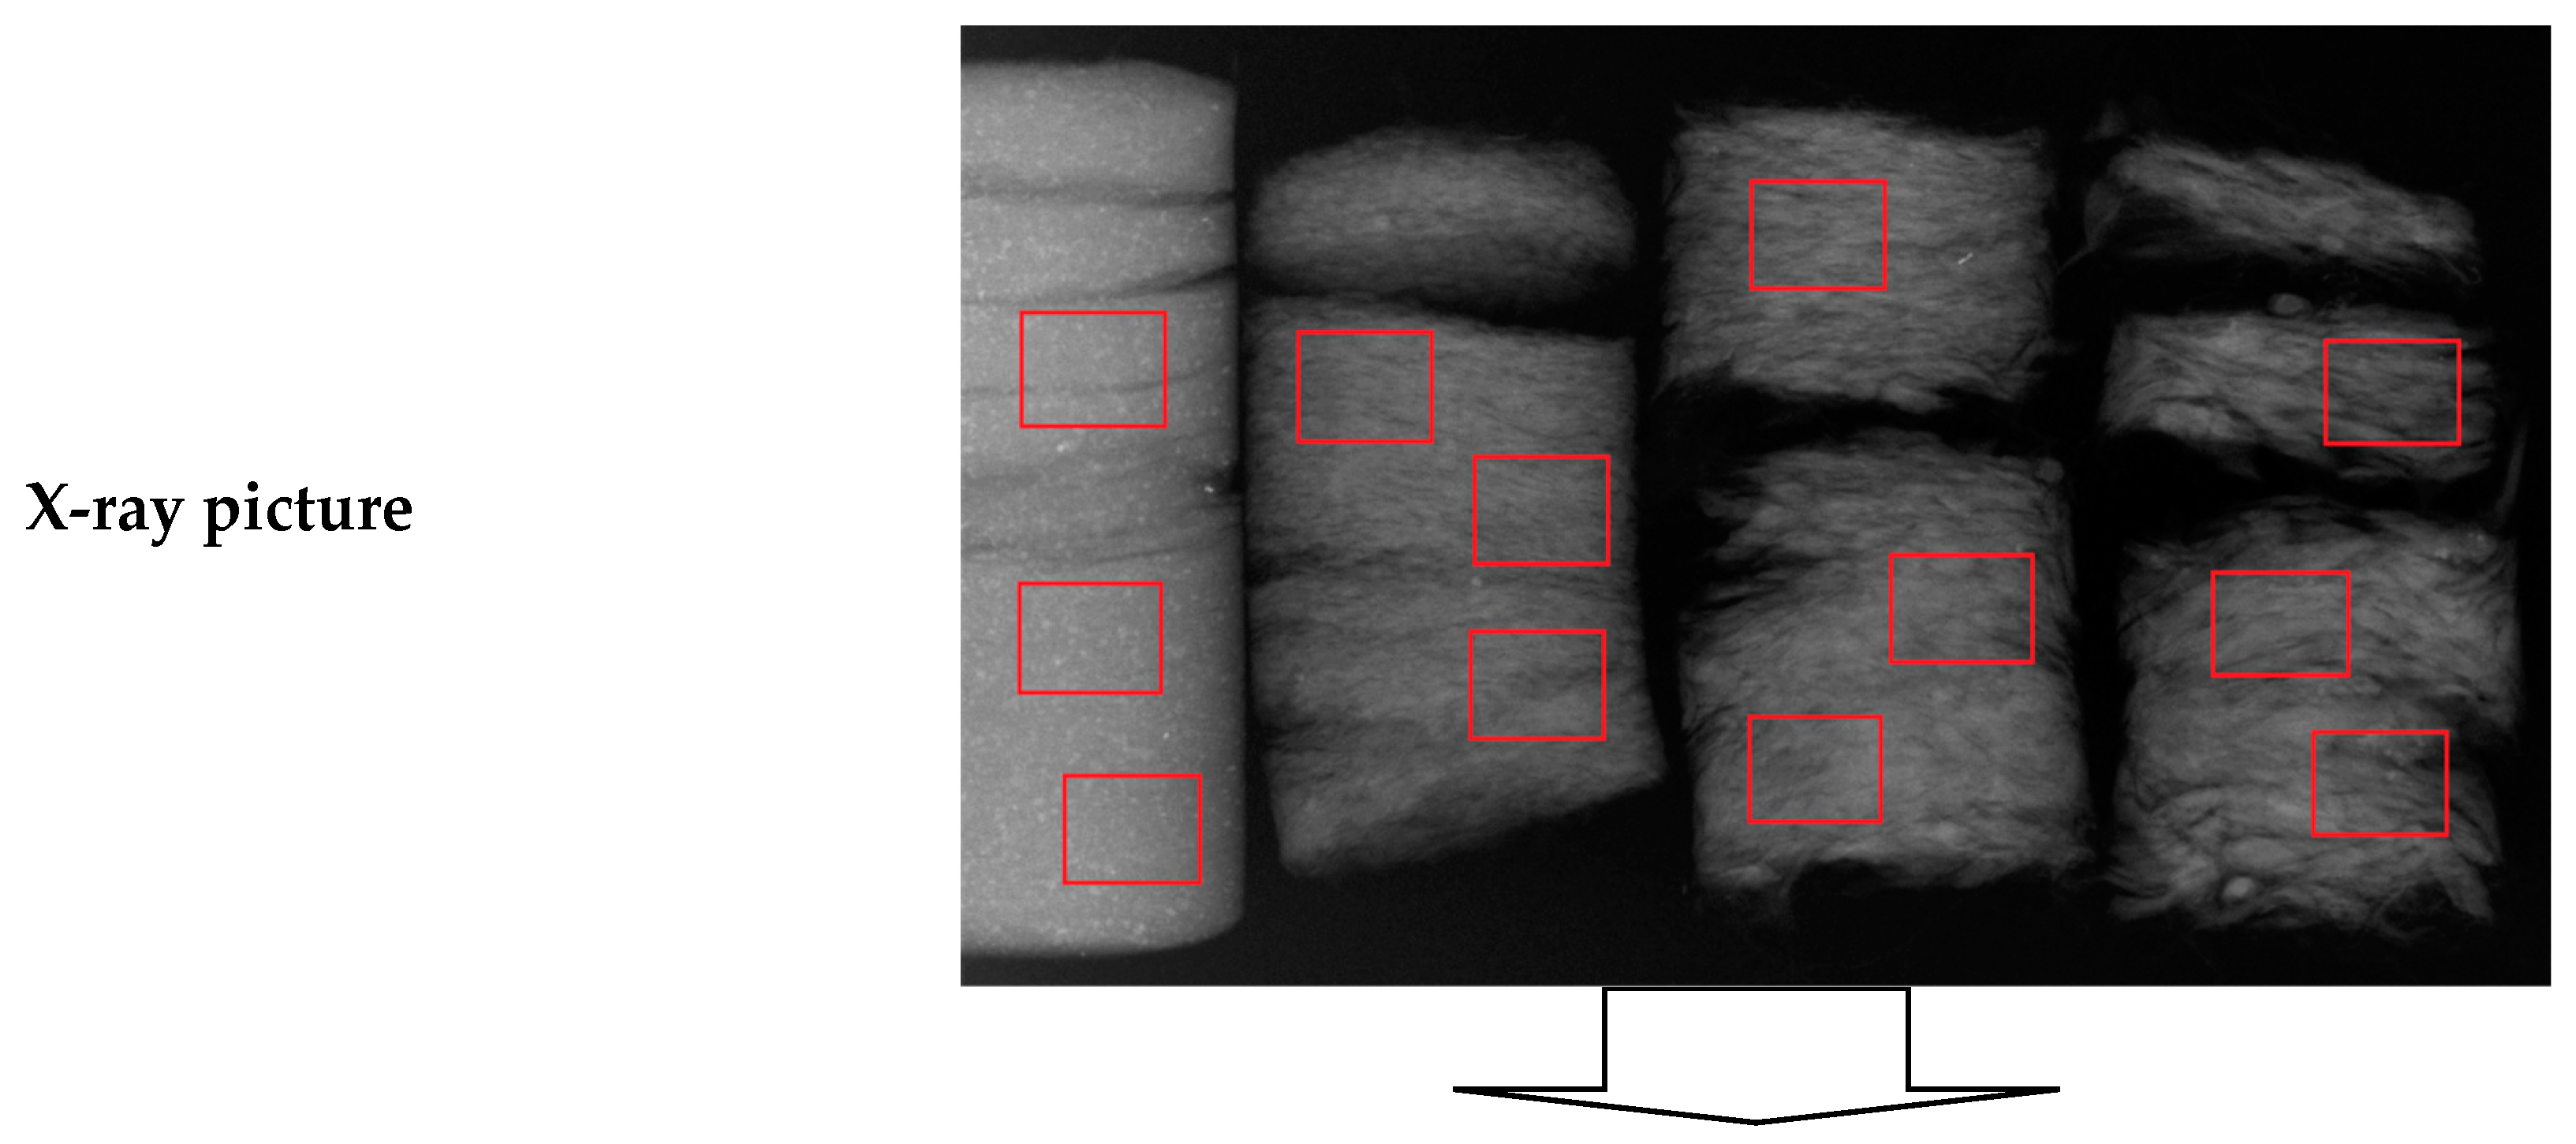
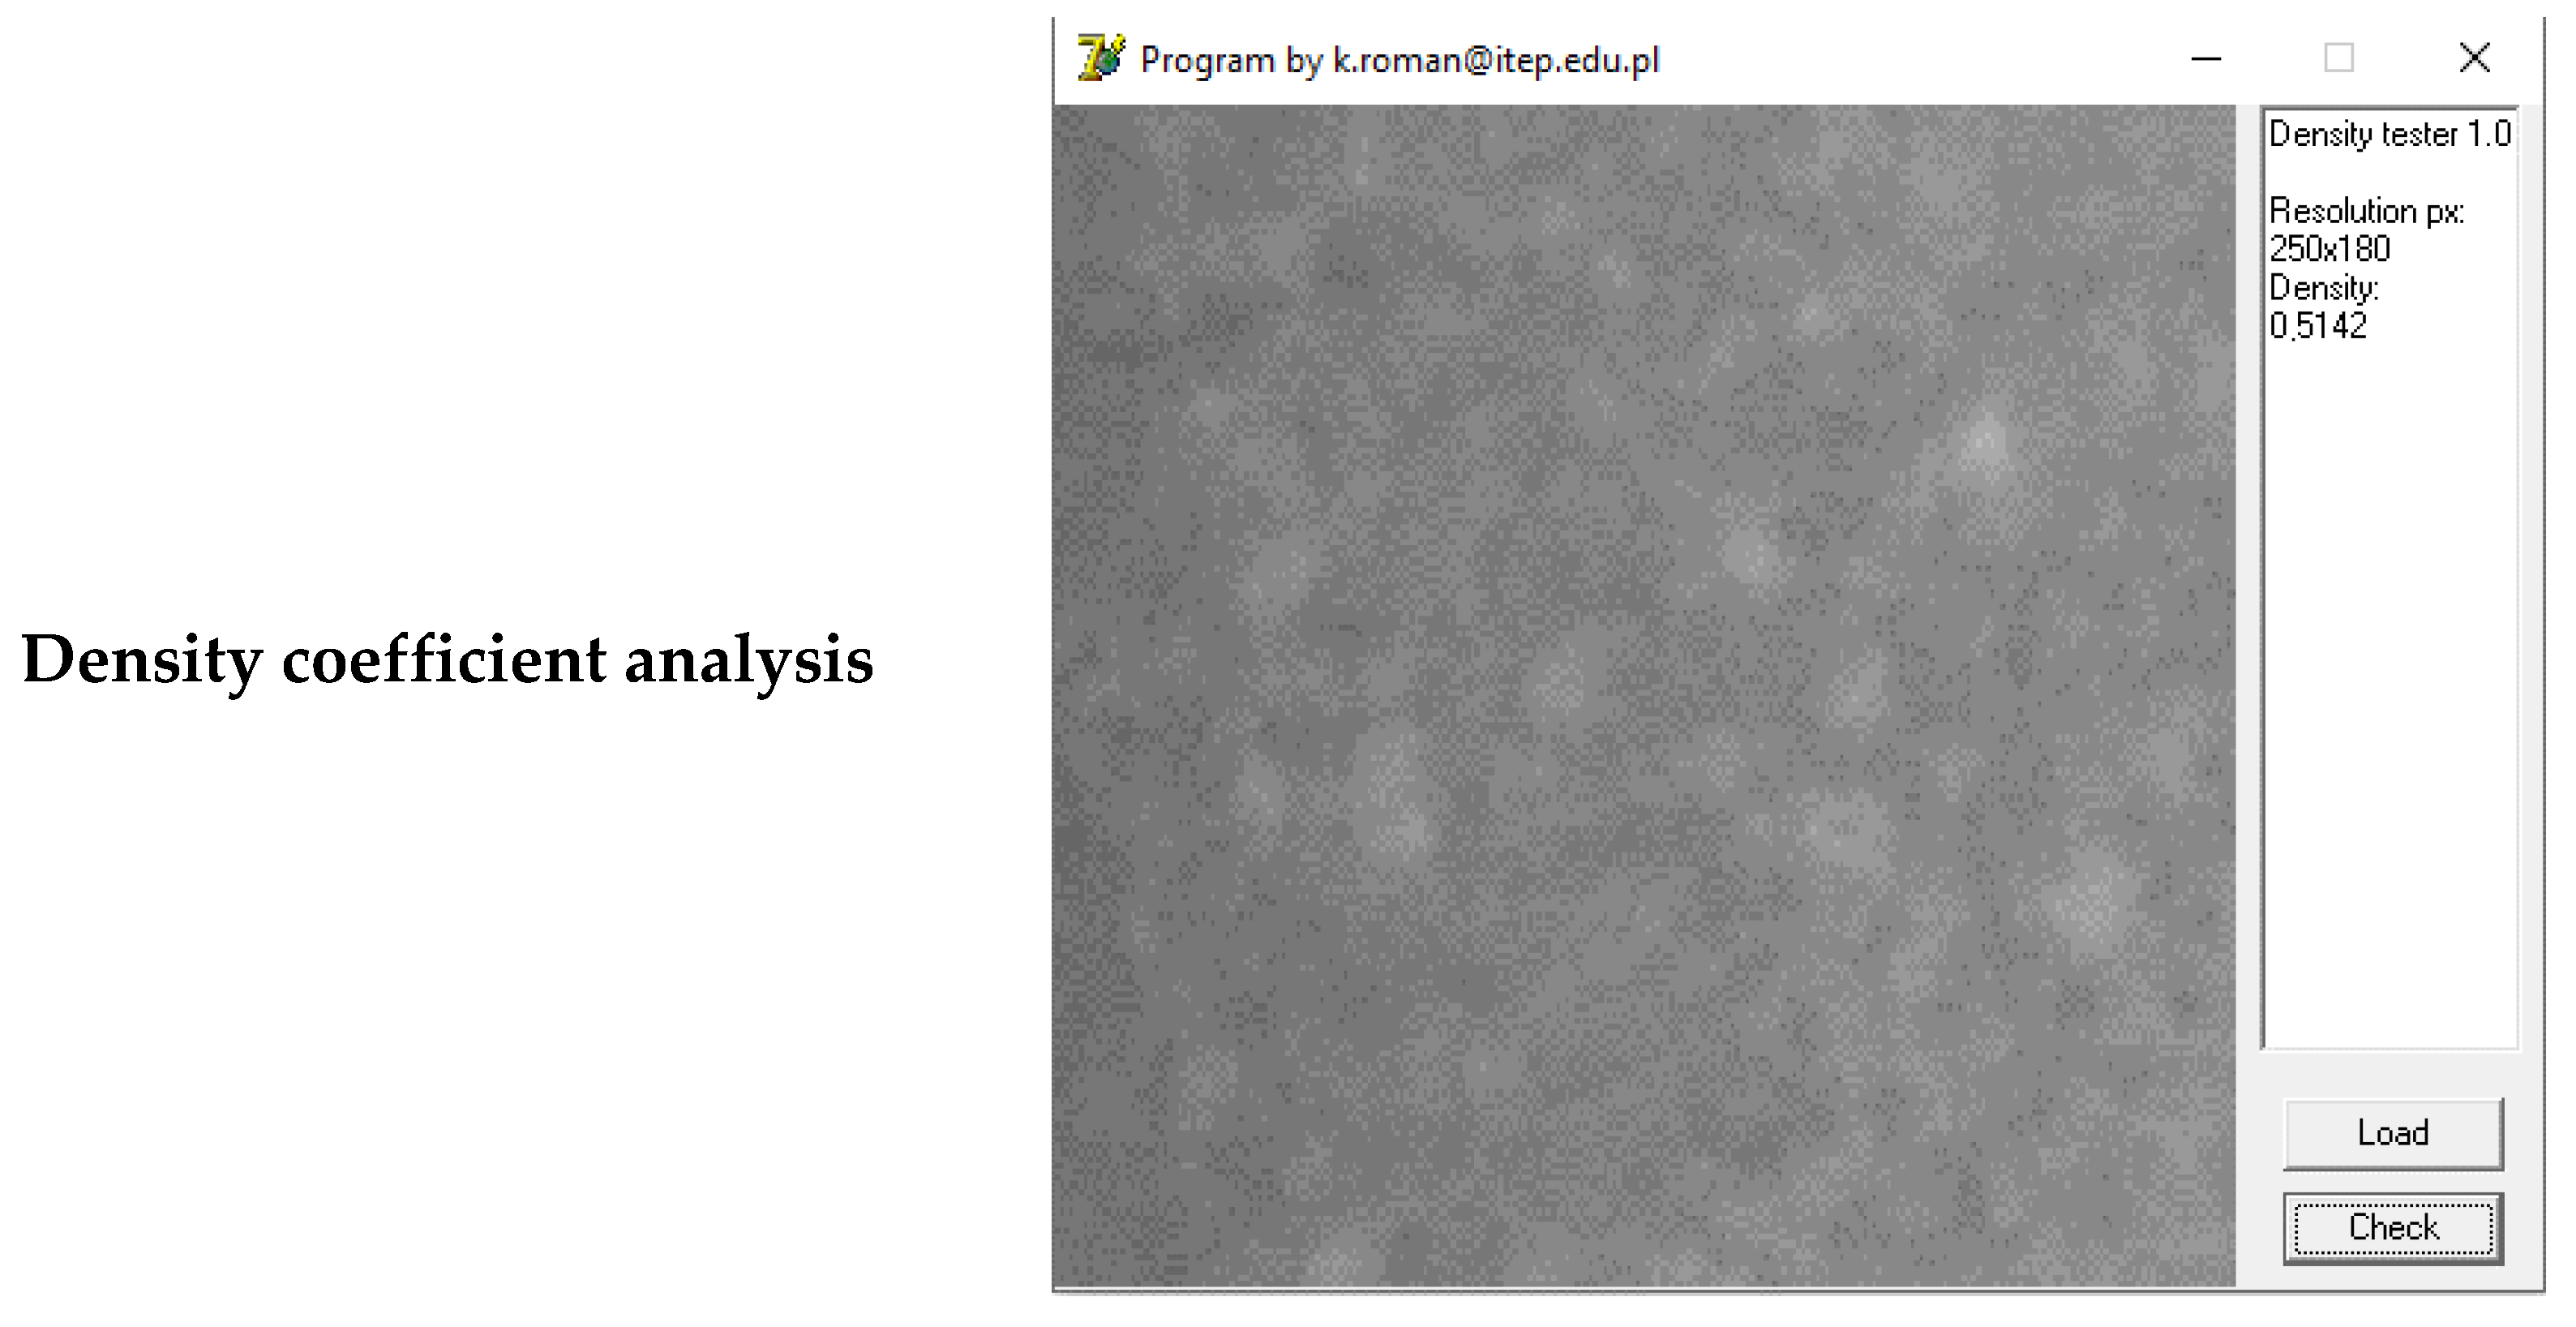
Figure 4.
Figure 4 presents a schematic of screen desaturation, which is required for X-ray image analysis to determine the X-ray spectrum density. According to the schematic, the X-ray spectrum raster picture was loaded into the specially prepared computer program. The computer program analyzed only selected pictures that separately were loaded into the program as individual areas. Those areas were pointed on the schematic (
Figure 4) in the red frame and were corresponding with every fraction of the briquette X-ray image spectrum in three repeats. The kernel of a specially prepared program was an algorithm that analyzed the selected area of the X-ray raster picture, reading the color in the loop pixel-by-pixel. The algorithm recognized the color of the pixel, assigning the fractional number value from 0 to 1 in shades of grey. The value 1 corresponded to the white pixel and the value 0 to the black. This was consistent with the white pixels that do not pass the X-rays waves, which was opposed to the black pixels. The algorithm as a result gave the mean percent of X-ray spectrum density.
Desaturation mode significantly reduces the amount of color saturation information in an image. By reducing the color to grayscale, the hue and saturation of the pixels were removed. In order to save information about a specific image, only luminance data is stored. Using a specially designed program, gray-scale pixels are counted in order to perform analysis. An algorithm is used to count all the pixels and then separate them based on a grayscale. Combining the obtained data enables the estimation of the black-to-white ratio in an image. The study results were analyzed using an analysis of variance (ANOVA) [
16]. It was possible to determine the influence of parameters of shredded wood material (pine) on the coefficient density results of the software.
3. Results
3.1. Chemical Analysis
The measurement of mineral compounds was conducted to support the explanation of X-ray spectrum analysis. Expectedly, the higher ash content represented a brighter X-ray spectrum. This means there could be a wide range of ash content in briquettes depending on the fractured structure. The ash measurement process burns the organic macronutrients carbon (C), hydrogen (H), oxygen (O), nitrogen (N), and sulfur (S). In order to determine the ash content, the material left after burning is examined. The ash content determines the mineral saturation of the tested raw material. The percent content of mineral compounds and moisture content from measured raw material are presented in
Table 1.
The basic elemental composition of selected wood materials was determined, as part of the research. The results were exposed to statistical analysis to determine the effects of respective parameters on the type of briquettes. The ANOVA indicated some differences between the types of briquettes, and the Duncan test was used to assign the materials to the homogeneous groups. In every chemical property test, the individual material formed an individual or shared homogeneous group. The most confirmed considerable differences were recorded for the ash content, where individual materials create only two homogeneous groups. Basically, the analyzed raw material was characterized by slight differences in chemical composition between the fractions. The difference in the elemental composition can be explained by the content of mineral values. The results of the ash statistical analysis were presented in another summary chart below. The aim of this part of the research was to compare the ash share trend to the density measured in the helium pycnometer and X-ray analysis.
3.2. Computer Program Analyzes
Digitalization of the structure results was accomplished by preparing a 250 × 180 px image. Assuming that grayscale shades are measured horizontally and vertically in a loop, a specially composed program was used for image characterization. The program produced a percentage characterization of grayscale share, which was defined as the density coefficient of the image. A program was used to calculate the density coefficient in X-ray images by using white as a value of “1” and black as a value of “0”. The proportion of white to black in the analyzed image can be derived from these values. The parameter breakdown for the respective briquettes is presented in
Table 2.
The results, in accordance with the methodology, were subjected to statistical analysis. The density coefficient statistical analysis was presented in another summary chart below. The results of the analysis allow for observing the relationship between the measurements. It is expected that the relationships between the measured parameters of the density coefficient for the X-ray spectrum and true density will be relative.
3.3. Helium Pycnometry True Density Characteristics
Material density provides a lot of information about the strength and stiffness of wood species and mechanical properties as well. The density of these materials can be determined by hydrogen pycnometry. The measurement of true density is one of the most important elements of the raw material characteristics to specify the density test. The porosity of a material affects its mechanical properties, such as its hardness and elastic modulus. To accurately characterize mechanical properties, the correct porosity must be determined, which depends on the accuracy of the true density measurement. For that purpose, the most common technique for measuring true density is via a helium pycnometer [
15]. The measurement of conducted studies was made using a helium pycnometer. The summary of shredded forest residues true density test results is presented in
Table 3.
The average true density for all measurements obtained using a helium pycnometer was 1253.7 kg·m−3. It was noticed that the differences in the results of specific density measurements of crushed pine logging residues for each of the measured fractions have a similar value. The use of helium pyrometry is an effective technique for determining the true density of wood and wood-based materials. The information can be utilized to gain valuable insight into their properties, species, and applications.
3.4. The Density Comparison of Shredded Forest Residues
The tests were designed to determine factors that have an impact on briquettes’ properties. To determine the significant effects of the factors on the parameters, a Student’s T-test was used. The empirical measurements provided information on the picture density, and true density of respective briquettes. The ash content was measured additionally to compare with density values. The comparison between the measurements can produce interesting results.
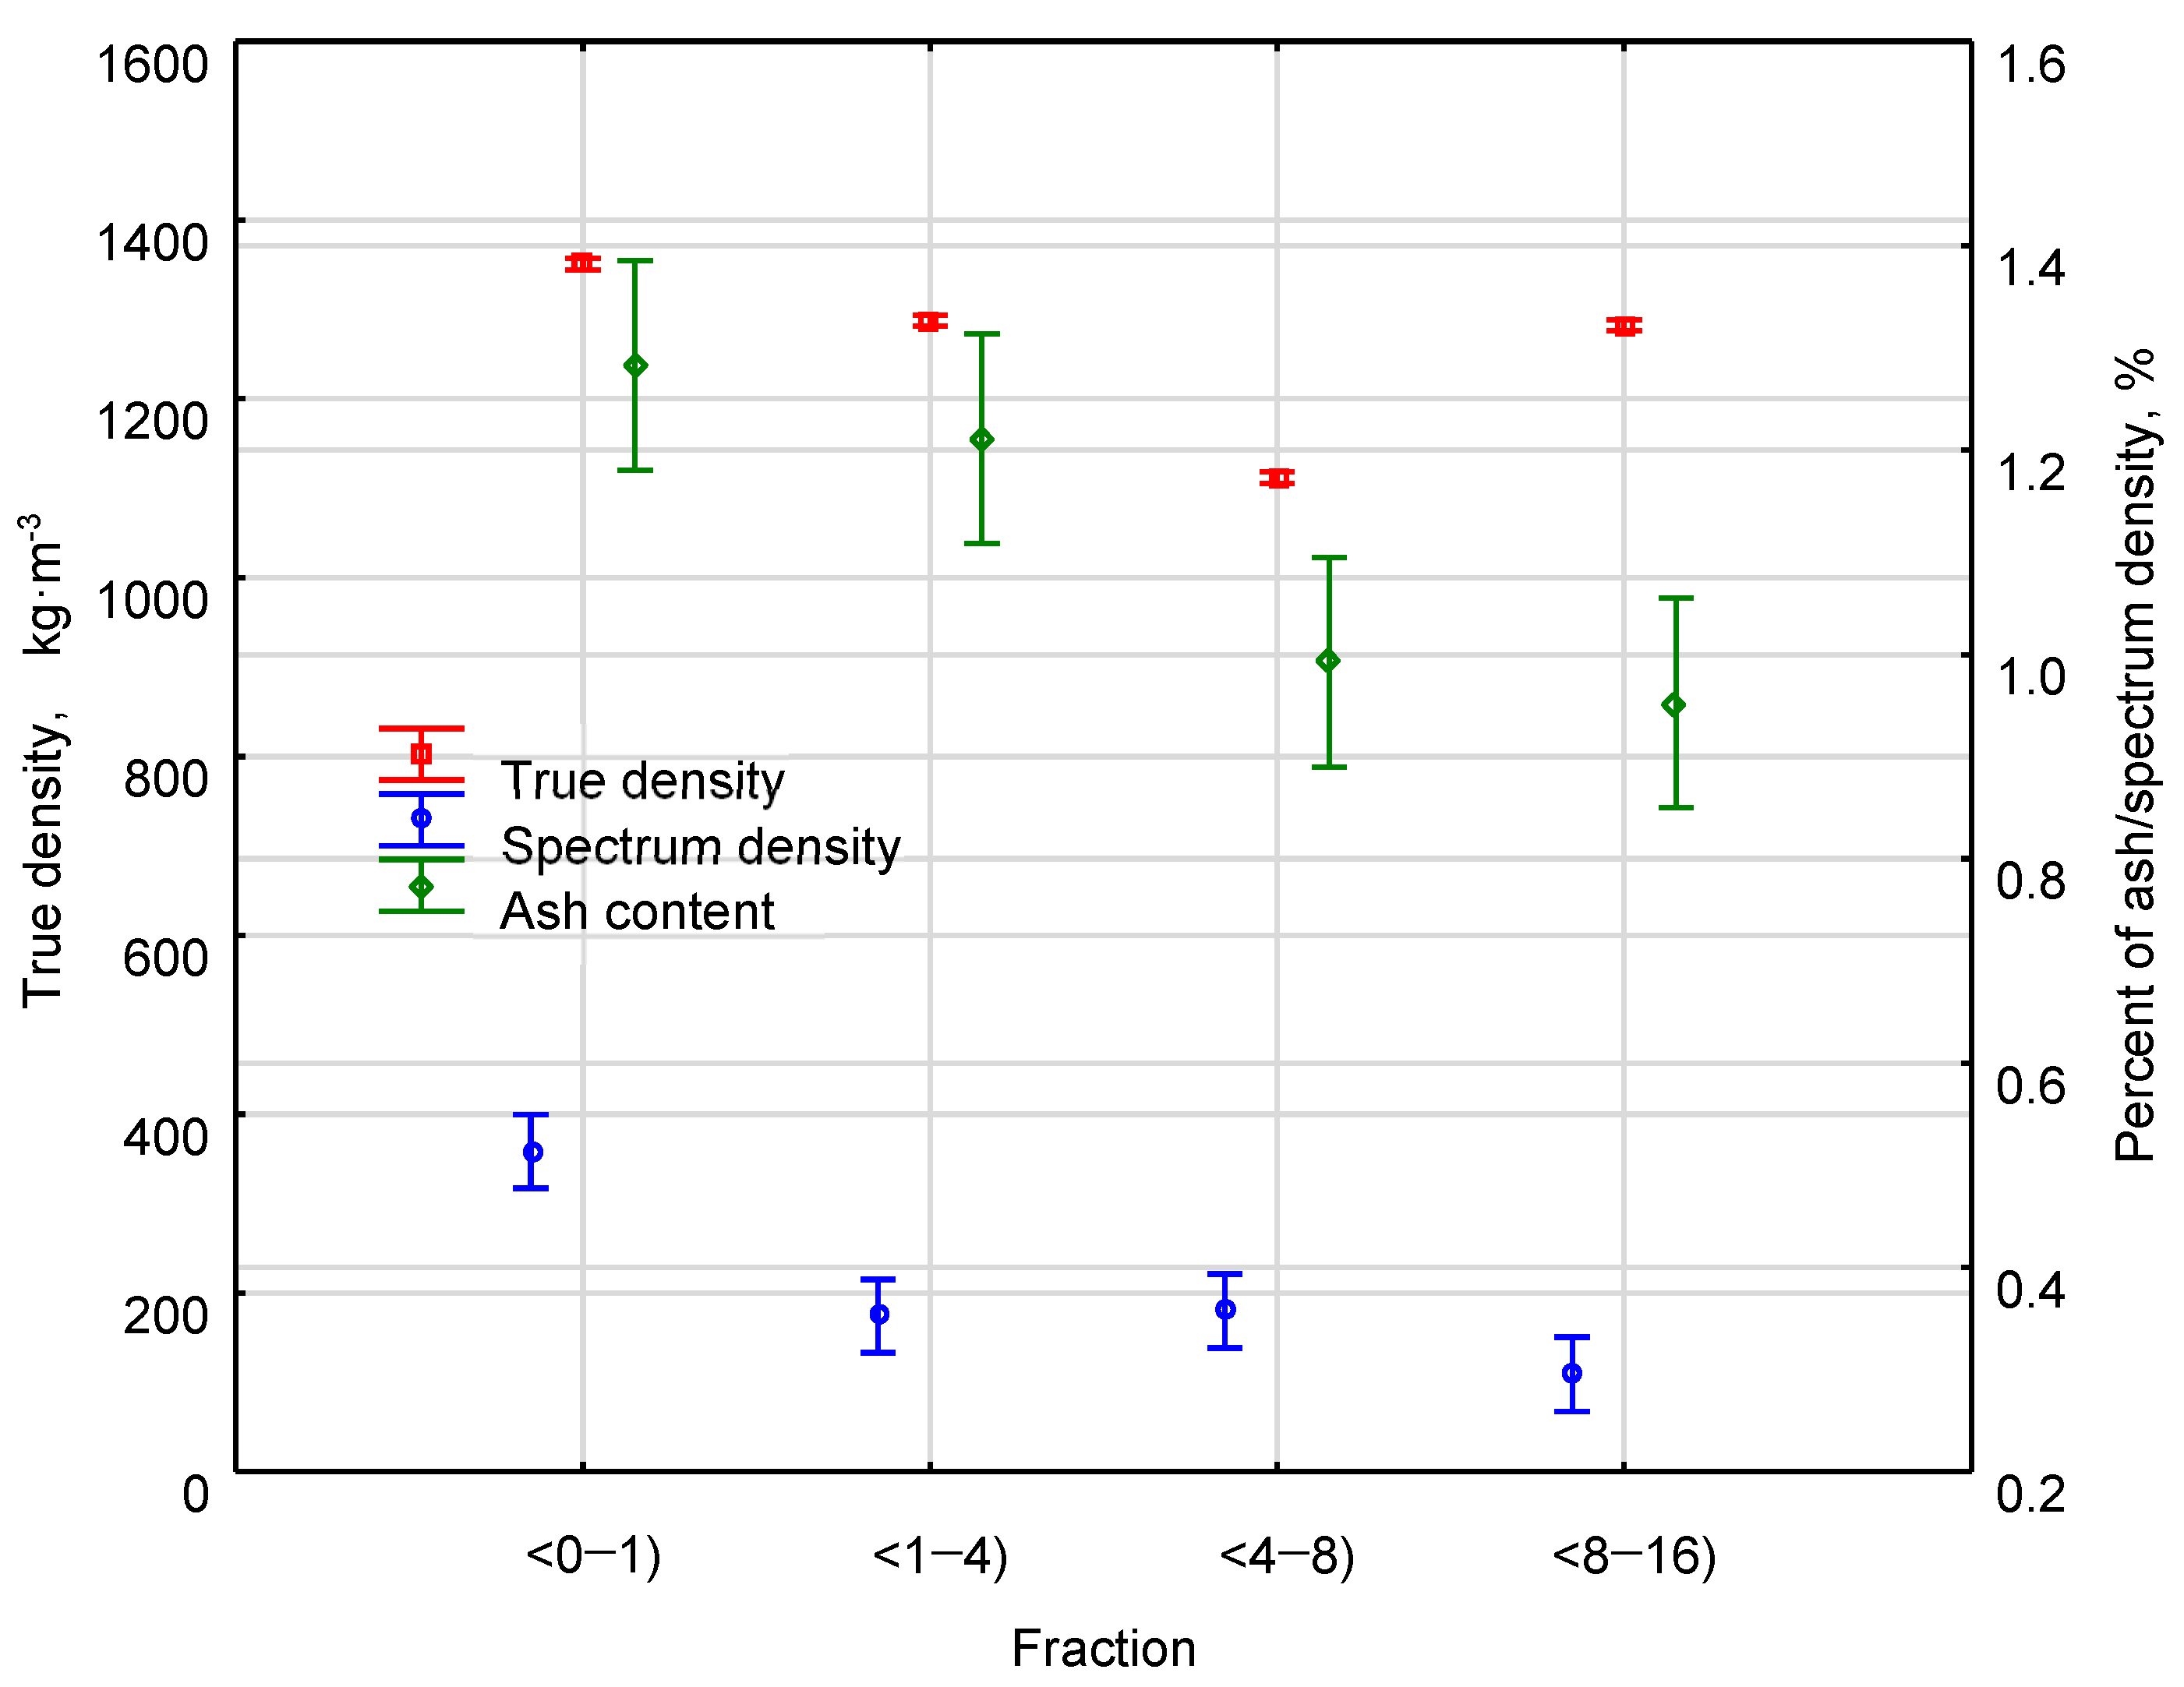
During the statistical analysis, the agreed factors were the results of the empirical measurements, though the briquette type and its kind were determined as a quality predictor. The results of the studies were statistically analyzed to verify the performance of the program in image characterization color percentage. The analysis assumption was to identify the structure percentage, based on the desaturated image in correlation with the percent of ash content and density measured by helium pycnometry. It indicates that there may be significant differences between the measured parameters between cases as shown in the diagram. The sums for the briquettes made from various biofuel materials are presented in
Figure 5.
The figure shows the measurement of true density, spectral density, and ash content results, which were divided by the fraction range. Observing the layout of the measurement results, it was important to conduct statistical analysis in order to compare and determine the existing influences. The Duncan test for X-ray spectrum density (%) showed a partial dependence resulting in three groups that were homogenous. In this study, the separator alpha between the individual homogenous groups was
p = 0.00006. The statistical test applied to the true density measurement by helium pycnometry (kg·m
−3) gives similar results as a test of the X-ray spectrum. Three homogeneous groups were also created based on the faction ranges. In this case, the separator alpha was also less than 0.05. Additional measurement applied to the ash content gives a wide picture of the relationship between elemental composition and material density. Similar results of statistical tests were found for the ash content (%), with creates two homogeneous groups. In the individual homogenous groups, the separator alpha was
p = 0.00181. The characteristics of the homogeneous samples and the mean characteristic of the effects of the parameters measured are presented in
Table 4.
The statistical analysis allows the characterization of the results of measurements in the context of true density and X-ray spectrum density. The statistical tests of ash content measurements were not mandatory. Based on statistical analysis, all measured parameters showed similarities. The conversion factor between densities can be calculated using the statistical test between measured parameters. The conversion factor varies from 0.55 for the f4 fraction (8 ÷ 16 mm) to 0.67 for the f1 fraction (0 ÷ 1 mm). Considering the X-ray spectrum and true density results, the conversion factor may be valuable for preliminary or indicative measurements. The conversion factor can be used to identify imaging errors. Based on the results, the mean value of the conversion factor was 0.62. The proposed conversion factor can make the process of measuring materials’ densities simpler, cheaper, and faster. An additional benefit of the work was the definition of the conversion factor and comparison of ash content with density measurement in order to obtain two different research methods.
4. Discussion
4.1. Chemical Analysis
The samples were properly prepared for laboratory analysis to determine the chemical properties, such as total hydrogen, total carbon, total nitrogen, total sulfur, and oxygen (the calculation method). The carbon content of the tested material (about 50%) classified it into a group of materials with energy purpose potential. The literature does not provide any information about the chemical composition of forest residues. A similar level of carbon content was found in spruce wood and energy chips [
17,
18]. The hydrogen content of the raw materials analyzed was close to 6%, a much lower percentage than that found in the analyzed chemicals. The obtained results did not correspond to those in the literature. The literature reports that nitrogen and sulfur are not affected by metamorphism processes [
19]. The number of environmental parameters could have influenced how these elements were distributed in the analyzed material. For example, cultivation technology, soil conditions, and soil valuation classes could all have had a significant impact. The analyzed energy chips contained comparable amounts of nitrogen to sawmill chips [
17]. The sulfur percentage of energy chips matched the values of post-consumer woods [
20]. The low levels of sulfur and nitrogen in the raw material confirm the pro-ecological issue of analyzed fuel characteristics. Statistics were used to analyze the results of the experiment.
The muffle furnace was used to determine the ash share of the analyzed raw materials. In order to incinerate the raw material sample, the material was heated to 805 °C. Ash contains mineral substances, based on information from the literature. The literature on the subject reveals that the ash content of forest residues in Scots pine ranges from 0.6 to 1.6%. The results of this research have confirmed this. According to the measurements, the average ash content was 1.07%. There is probably a large share of non-woody green parts in this biomass type, which explains its low ash content. It is possible that this is due to high levels of contamination during the accumulation process in forest areas, during transport and grinding.
A similar share of ash content can be found in the examined logging residues as in the branches of Scots pine (
Pinus sylvestris L.) and Norway spruce (
Picea abies) [
21]. There was no correlation between the results of the research and any literature values, despite the fact that sawmill chips and energy chips are derivatives of logging residues. It is important to note that the raw material in the study came from different locations and from different stands, so the differences cannot be explained easily. Based on the microelements and ash content percentage in the tested material, the mean value of oxygen content was calculated. Based on the types of raw materials used in the analysis, the oxygen content of each type corresponded to literature values for spruce wood with a high correlation [
17,
18].
4.2. The X-ray Spectrum Analysis
The most influential factor affecting the X-ray spectrum is the elemental composition of the material. Depending on the data gathered from the chemical composition study, a comparison is made between the results of the study and other measurements taken. The computer program enabled the analysis of the X-ray spectrum and the differences between the structure of the briquette fraction in samples obtained as a result of analyzing the X-ray spectrum. Using the program, it is possible to analyze the structures, their differences depending on fraction content, and how the density changes as mineral compounds are correlated. In briquettes with low fracture dimensions, the structure was more structured, and organic compounds were less concentrated.
Desaturation data can be analyzed to estimate black-to-white shares and identify mineral compounds. The X-ray spectra were analyzed to estimate gray tone density factors according to the fractional ranges. The results of the measurements show significant differences between the highest and lowest fractional ranges. For the lowest fraction range f1 (0 ÷ 1), the density factor was 0.513 and was higher than all measured samples. There is a dependency between fraction content and the density coefficient value from the X-ray spectrum that increases with fraction content.
4.3. The Helium Pycnometry Analysis
Helium pycnometry is a method for determining the true density of wood materials. This method involves immersing a sample in helium gas and measuring the change in the volume of the gas. The mass of the wood sample is then divided by its volume to calculate its density. In the case of helium pycnometric analysis of a wood-based sample, the results usually include the density of the wood-based sample as well as variations in density within the sample, if any are present. The true density measurements were conducted for different materials fractions of f1, f2, f3, and f4. The density of each material group was measured multiple times for each material group.
The true density in this study ranged from 1105 kg/m3 to 1355 kg·m−3, with an average value of 1258 kg·m−3 being the highest. The highest value of true density was 1355 kg·m−3 and represents the state of being the densest. The lowest value of true density is 1105 kg·m−3. Each of these values falls within a range of 68 kg·m−3 that is relatively close to one another. The data on the true density of the material and the mean density are generally consistent with the true density, with a small margin of error. This indicates that the samples have similar densities or that the density of the samples, in general, is consistent throughout the sample set. Based on the experimental results, it is possible to characterize the deep material structure and deduce the conversion factor as well. A description of the observations is provided in the article.
5. Conclusions
To conduct a qualitative analysis of the briquettes, it is necessary to determine the basic elemental composition of the material. It was found that the material included contamination, which was assigned as a percentage of mineral compounds contained in ash. Different types of briquettes contained different compounds that were found to be present at different levels. According to the results, the ash content of briquettes decreases as the fractions in briquettes are increased. Prepared materials have a decreasing ash value as wood fractions increase.
Based on the micro elementary results, the material analyzed contained carbon contents around 51%, hydrogen contents around 6%, nitrogen contents around 0.6%, sulfur contents ranging between 0.2 to 0.4%, oxygen contents around 42%, and ash contents around 1%. In this case, the raw materials appeared to have been diverse, which is likely due to the location of the cutting. Biomass samples were collected from branches, preventing mineral contamination in some ways.
X-ray spectrum analysis shows that the low fraction dimension
f1(0 ÷ 1) helps the composite structure adhere. In the X-ray spectrum, it is difficult to see how compact the material is. Wood fractions with low dimensions are used for briquette manufacturing and have a positive effect on their strength. Based on the above sentence, a conversion factor determining the strength of briquette can be proposed. The results were compared with a doctoral thesis [
22]. It was noticed that briquettes with higher durability were characterized by a lighter shade: respectively,
f1 was in the range of 31–68%;
f2 was 6–27%;
f3 was 6–15%; and
f4 was about 8–37%. In the doctoral study, the strength tests were carried out for prepared mixtures; therefore, a direct comparison for strength research was not corresponding and was of an illustrative nature. The combination of high-milled fractions and briquettes can be considered suitable. Research in this field will be developed in the future. In addition, it is also possible to inspect wood-based materials for defects using X-ray technology, such as knots, cracks, and rot, which can affect their strength and durability. The conducted research seems to have a lot of potential and should be further developed.
Author Contributions
Conceptualization, K.R. and M.H.; methodology, K.R.; software, K.R.; validation, K.R., W.R. and M.H.; formal analysis, K.R.; investigation, K.R., W.R. and M.H.; resources, K.R. and W.R.; data curation, K.R., W.R. and M.H; writing—original draft preparation, K.R., W.R. and M.H.; writing—review and editing, K.R.; visualization, K.R.; supervision, K.R.; project administration, K.R.; funding acquisition, K.R. All authors have read and agreed to the published version of the manuscript.
Funding
This research received no external funding.
Data Availability Statement
Not applicable.
Conflicts of Interest
The authors declare no conflict of interest.
References
- Niedziółka, I.; Zuchniarz, A. Analiza energetyczna wybranych rodzajów biomasy pochodzenia roślinnego. Motrol 2006, 8A, 232–237. [Google Scholar]
- Wasiak, A. Raport o Stanie Lasów w Polsce; Lasy Państwowe: Warsaw, Poland, 2013; pp. 1–103. [Google Scholar]
- Ekielski, S. Wytyczne Konstrukcyjne Zespołu Roboczego do Granulatora Trocin Drzewnych; IBMER: Warsaw, Poland, 1986. [Google Scholar]
- Gradziuk, P. Analiza Możliwości Wykorzystania Słomy na Cele Energetyczne, Expert Opinion Commissioned by the Ekofundusz Foundation; Agricultural University in Lublin, Institute of Agricultural Sciences in Zamość: Lublin, Poland, 2002; 62p. [Google Scholar]
- Krzysik, F. Nauka o Drewnie; Wydawnictwo Naukowe: Warsaw, Poland, 1975; 645p. [Google Scholar]
- Tomczak, A.; Jelonek, T. Parametry techniczne młodocianego i dojrzałego drewna sosny zwyczajnej (Pinus sylvestris L.). Sylwan 2012, 156, 695–702. [Google Scholar]
- PN-EN 15149-1; Wersja Angielska—Biopaliwa Stałe—Oznaczanie Rozkładu Wielkości Ziaren—Cześć 1: Metoda Przesiewania Oscylacyjnego Przy Użyciu Sit o Szczelinie 1 mm Lub Większej. Polish Committee for Standardization: Warsaw, Poland, 2011; pp. 1–13.
- PN-EN 15149-2; Wersja Angielska—Biopaliwa Stałe—Oznaczanie Rozkładu Wielkości Ziaren—Cześć 2: Metoda Przesiewania Wibracyjnego Przy Użyciu Sit o Szczelinie 3,15 mm Lub Mniejszej. Polish Committee for Standardization: Warsaw, Poland, 2011; pp. 1–13.
- PN-ISO 589; Wersja Polska—Węgiel Kamienny—Oznaczanie Wilgoci Całkowitej. Polish Committee for Standardization: Warsaw, Poland, 2006; pp. 1–12.
- Babiarz, M.; Bednarczuk, Ł. Popiół ze Spalania Biomasy i Jego Wykorzystanie; WPIA AGH: Cracow, Poland, 2013; p. 3. [Google Scholar]
- Suchorab, B.; Roman, K. The PLA content influence selected properties of wood-based composites. Ann. Wars. Univ. Life Sci. SGGW For. Wood Technol. 2022, 120, 57–67. [Google Scholar] [CrossRef]
- PN-ISO 2144:1996; Paper and Cardboard—Determination of Ash Content. Polish Committee for Standardization: Warsaw, Poland, 1996.
- Yang, X.; Sun, Z.; Shui, L.; Ji, Y. Characterization of the absolute volume change of cement pastes in early-age hydration process based on helium pycnometry. Constr. Build. Mater. 2017, 142, 490–498. [Google Scholar] [CrossRef]
- Roman, K.; Barwicki, J.; Rzodkiewicz, W.; Dawidowski, M. Evaluation of Mechanical and Energetic Properties of the Forest Residues Shredded Chips during Briquetting Process. Energies 2021, 14, 3270. [Google Scholar] [CrossRef]
- Czyzewski, A.; Krawiec, F.; Brzezinski, D.; Porebski, P.; Minor, W. Detecting anomalies in X-ray diffraction images using convolutional neural networks. Expert Syst. Appl. 2021, 174, 114740. [Google Scholar] [CrossRef] [PubMed]
- Chang, S.-Y.; Wang, C.; Sun, C.C. Relationship between hydrate stability and accuracy of true density measured by helium pycnometry. Int. J. Pharm. 2019, 567, 118444. [Google Scholar] [CrossRef] [PubMed]
- Bach, Q.; Chen, W.; Chu, Y.; Skreiberg, Ø. Predictions of biochar yield and elemental composition during torrefaction of forest residues. Bioresour. Technol. 2016, 215, 239–246. [Google Scholar] [CrossRef] [PubMed]
- Kajda-Szcześniak, M. Evaluation of the basic properties of the wood waste and woodbasedwastes. Arch. Waste Manag. Environ. Prot. 2013, 15, 1–10. [Google Scholar]
- Kraszkiewicz, A. Analiza wybranych właściwości chemicznych drewna i kory robinii akacjowej (Robinia pseudoacacia L.). Inż. Rol. 2009, 8, 69–75. [Google Scholar]
- Wandrasz, J.W.; Wandrasz, A.J. Paliwa formowane: Biopaliwa i Paliwa z Odpadów w Procesach Termicznych; Wydawnictwo Seidel-Przywecki Sp. z o.o.: Warsaw, Poland, 2006; pp. 1–56. [Google Scholar]
- Moriana, R.; Vilaplana, F.; Ek, M. Cellulose Nanocrystals from Forest Residues as Reinforcing Agents for Composites: A Study from Macro- to Nano-Dimensions. Carbohydr. Polym. 2016, 139, 139–149. [Google Scholar] [CrossRef] [PubMed]
- Roman, K. Dobór Parametrów Technicznych Procesu Brykietowania Biomasy Leśnej. Ph.D. Thesis, Warsaw University of Life Sciences, Warsaw, Poland, 2017. [Google Scholar]
| Disclaimer/Publisher’s Note: The statements, opinions and data contained in all publications are solely those of the individual author(s) and contributor(s) and not of MDPI and/or the editor(s). MDPI and/or the editor(s) disclaim responsibility for any injury to people or property resulting from any ideas, methods, instructions or products referred to in the content. |
© 2023 by the authors. Licensee MDPI, Basel, Switzerland. This article is an open access article distributed under the terms and conditions of the Creative Commons Attribution (CC BY) license (https://creativecommons.org/licenses/by/4.0/).


