Article

Strata Movement and Mining-Induced Stress Identification for an Isolated Working Face Surrounded by Two Goafs

1
School of Mines, China University of Mining & Technology, Xuzhou 221116, China
2
School of Geology and Mining Engineering, Xinjiang University, Urumqi 830046, China
3
Jiangsu Engineering Laboratory of Mine Earthquake Monitoring and Prevention, China University of Mining & Technology, Xuzhou 221116, China
4
Xinglongzhuang Coal Mine, Yanzhou Coal Industry Co., Ltd., Jining 272102, China
*
Author to whom correspondence should be addressed.
Energies 2023, 16(6), 2839; https://doi.org/10.3390/en16062839
Submission received: 20 February 2023 / Revised: 15 March 2023 / Accepted: 15 March 2023 / Published: 18 March 2023
(This article belongs to the Special Issue New Challenges in the Utilization of Underground Energy and Space)

Abstract

:
Solutions for the maintenance of safety in an isolated working face has not been well achieved; this is attributed to its unique overburden structure and the strong mining-induced stress during the advancement. This paper is devoted to filling this research gap and is based on the case study of LW 10304 in the Xinglongzhuang Coal Mine, in China. The overburden structure and stress distribution characteristics of this isolated working face were theoretically investigated, followed by the development of a comprehensive identification method. The research results showed the following: (1) The overburden strata of LW 10304 is in the form of a short “T” shape and the stress increment is featured with the overall “saddle” shape before the extraction of the isolated working face. During this period, the lower key strata and main key strata affect the stress level at the two ends and the central part of the working face, respectively; (2) Both the frequency and energy of micro-earthquakes in the working face account for more than 95%, which is positively correlated with roof damage and rib spalling, associated with some overlaps between the damaged zones; (3) The fracture movement of inferior key strata near the coal seam plays a dominant role in affecting microseism activity and mining-induced stress. The microseism energy attributed to roof breakage accounts for 43.34% of the overall energy; (4) A comprehensive indexing system, covering microseism frequency, microseism energy, and support resistance, was established to identify the mining-induced stress intensity of the isolated working face. The early warning efficiency of the “strong” degree of mining-induced stress is 0.94, which is believed to provide an option for other isolated working faces with similar geological and mining conditions.

1. Introduction

Affected by specific geological conditions, mining techniques, as well as insufficient mine design, some isolated working faces, which are surrounded by goafs, are left in underground mines [1,2]. Different from a normal working face, both the overburden structures and the stress distribution of an isolated working face are complex. In particular, strong mining-induced stress accidents, which may result in rock bursts, have drawn much attention when the sudden breakage and instability of the hard roof are accounted for [3,4,5]. For example, strong periodic weighting was suffered during the extraction of the isolated working face in Tongxin Coal Mine, Shanxi Province. Except for the high mining-induced stress applied on the hydraulic support, the cross section of the roadway ahead of the working face decreased from 18.5 m2 to 4.62 m2 [6]. Moreover, the rock burst accident that occurred in the 3112 isolated working face was associated with multiple roof collapses and injuries to three miners [7]. In 2015, a rock burst occurred in the 1305 isolated working face in Zhaolou Coal Mine, Shandong Province, which also resulted in injuries to three miners [8].
To date, a large amount of research has been carried out to investigate the development of the overburden structure, distribution of stress, as well as the failure characteristics of coal/rock mass in isolated working faces. Jia et al. [9] studied the spatial overburden structure morphology of isolated working faces via numerical simulation and similarity simulation methods. Chen et al. [10] explored the progressive failure of overlying strata, the change law of induced displacement, as well as the stress distribution based on a self-designed experimental apparatus and a stress monitoring system. Ma [11] analyzed the spatial evolution characteristics of the stress field of rock mass, plastic strain field, and fracture field during the extraction of an isolated working face. Tu et al. [12] constructed a continuous overburden beam model to theoretically describe the distribution characteristics of stress and the failure depth of coal/rock mass in an isolated working face. Liu et al. [13] systematically investigated the deformation characteristics of surrounding rock of the gob-side entry affected by an isolated working face. Xue et al. [14] proposed an effective technique, including roof cutting and other coal-mining-induced stress relief methods, on the basis of the in-depth understanding of irregular isolated coal pillars. Sun et al. [15] comprehensively studied the overall instability mechanism of an isolated working face with multi-coal seams and put forward a threshold advance distance for isolated working faces. Reed Guy et al. [16] studied the influence of factors such as pillar w/h ratio and overburden W/H ratio with regard to the stability of the coal pillar and roof system. Ranjan Kumar et al. [17] proposed a method for analyzing the stability of a coal pillar based on the instability of coal pillars in the coal fields of India. As indicated by the above discussion, the overburden structure, stress state, and damage degree of coal/rock mass are significantly affected by the geological and mining technical conditions of the isolated working face.
Moreover, some other research on strong mining-induced stress and rock bursts of isolated working faces was also conducted based on the microseism technique, mainly attributed to its abundant rock fracture information and its early warning rate. Among them, Chen et al. analyzed the fracture propagation rule of overlying strata of the 8102 isolated working face in Tongxin Coal Mine based on a spatiotemporal data analysis method [6]. Wang et al. [18] observed the attenuation characteristics of a mine earthquake caused by roof breakage, proposed a vibration effect index based on real-time microseism monitoring data, and then successfully applied it to the 7197 isolated working face of Xuzhuang Coal Mine. Cao et al. [19] explored the dynamic evolution characteristics of the danger area on an isolated working face based on the vibration wave CT detection technique and microseism monitoring. Zhang et al. [20] quantified the microseism data and analyzed the response characteristics of different monitoring parameters before and after the occurrence of two rock burst accidents.
Although current research has made solid contributions to the safe mining of isolated working faces, only limited research has been conducted to identify the mechanism of large-area roof damage and rib spalling of isolated working faces. Correspondingly, the effective and targeted identification of mining-induced stress is not well established. Against this background, the present research aims to develop innovative identification factors to effectively predict strong mining-induced stress on an isolated working face based on the understanding of the spatial overburden structure and movement characteristics of the given mine site.

2. G2 Site Characteristics

2.1. Layout of the Working Face

LW 10304 is the typical isolated working face, which is in the middle of No. 10 mining area of Xinlongzhuang Coal Mine. The strike length of LW 10304 is 2490 m and the dip length gradually changes from 235 m to 185 m along the advanced direction. As depicted in Figure 1, there are five goafs with the inclination width of 654 m~708 m around the east side of LW 10304, which were formed from April of 2005 to June of 2014. On the west side of LW 10304, there are two other goafs with an inclination width of 494 m to 500 m, formed from September of 2014 to August of 2018. The north side of LW 10304 is the protection coal pillar of the mining boundary, while the south side is the unexploited area. It should be note that no coal pillar, the initial designed width of which is 4 m, was left in the goaf.
The dip angle of the coal seam in LW 10304 is 2~17°, with an average value of 8°. The average thickness and the buried depth of the coal seam is 9.21 m and 370~500 m, respectively. As can be seen from Figure 2, the immediate roof and the main roof of the coal seam are siltstone and medium-coarse sandstone, respectively. In general, the overburden strata can be classified into two groups, the sandstone ranging from 0~187.66 m, and the sandy clay, clay, and interbedded strata from 187.66 to 73.24 m. As per the key strata theory [21], both the inferior strata and main key strata were determined; more detail information is referred to Figure 2.

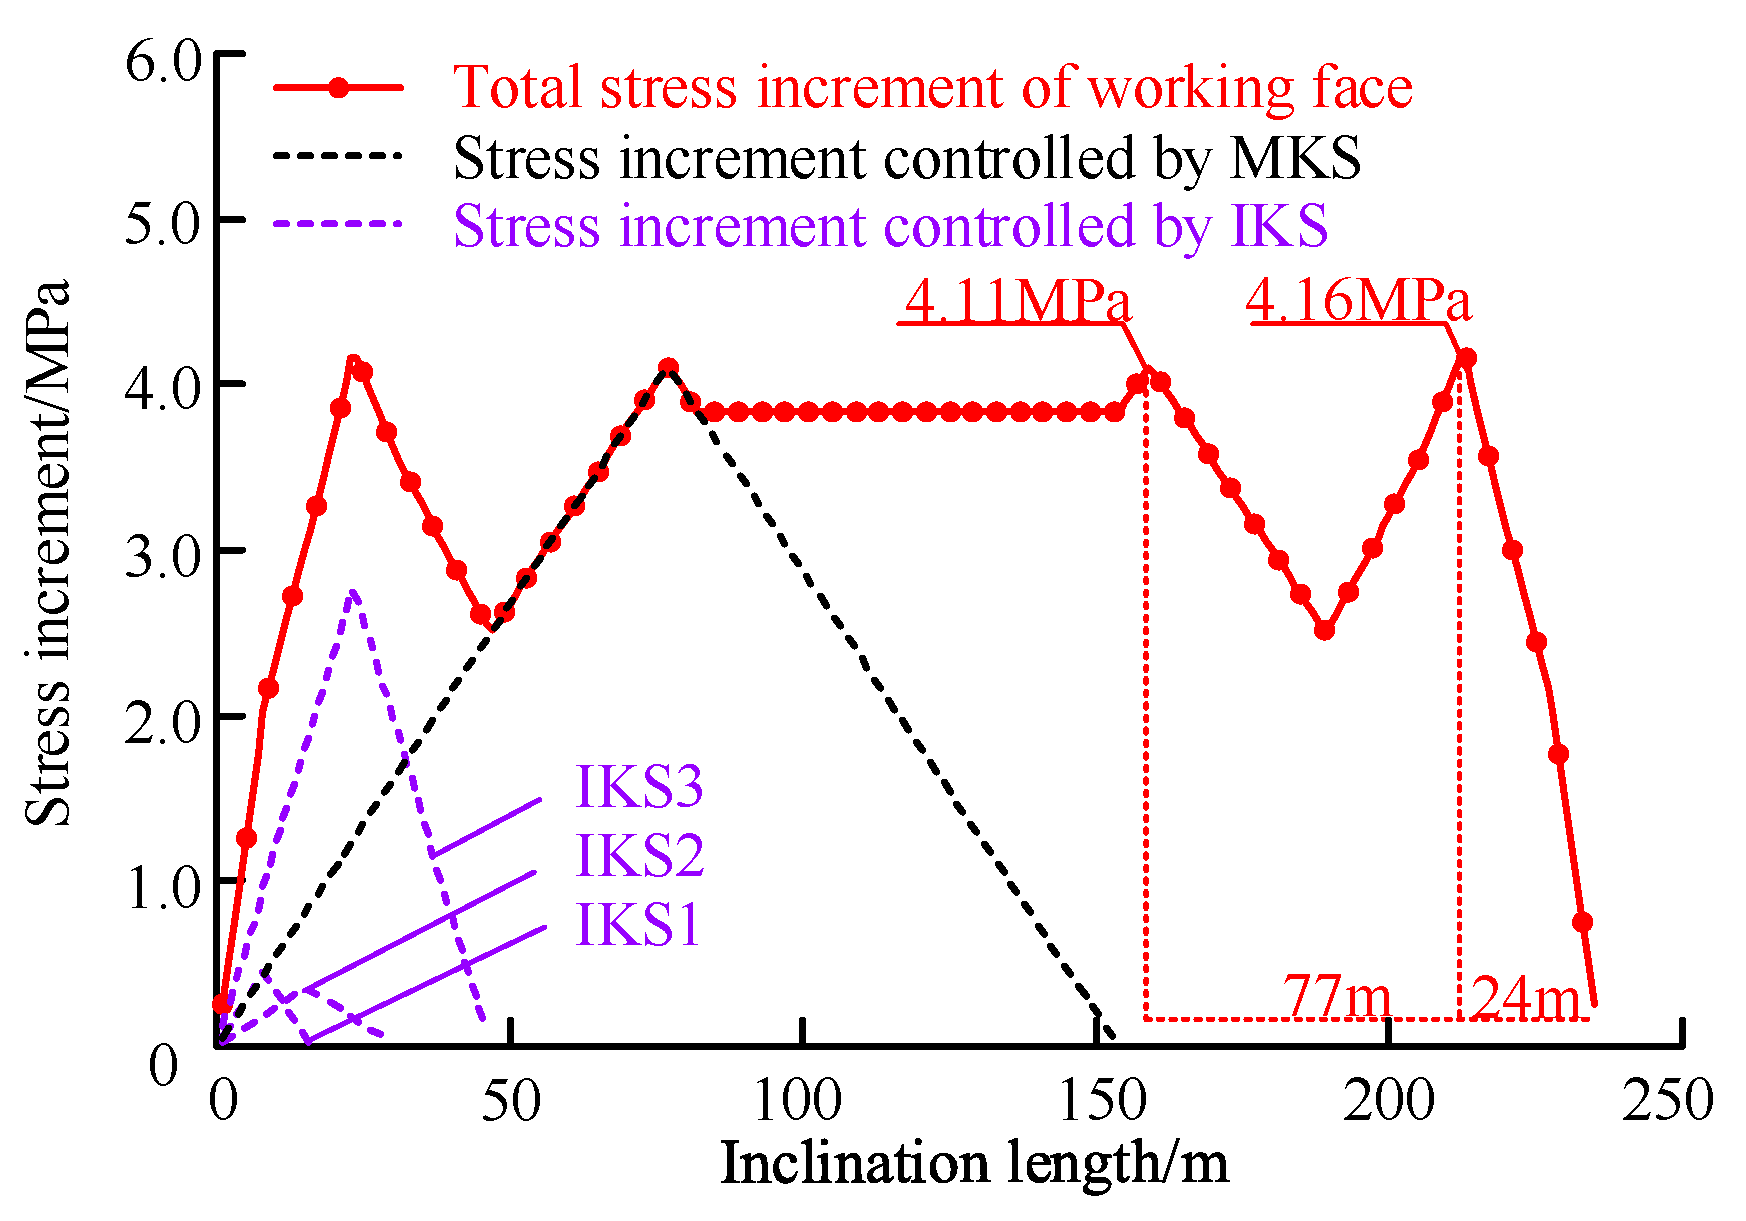
2.2. Mining-Induced Stress of the Isolated Working Face

The roof damage and the coal rib spalling area occurred during the advancement of the working face mining from 3 October 2019 to 24 June 2020; the field staff recorded statistics on the damage length during each mining cycle and plotted them on the mining plan. For ease of accounting, the damaged roof areas smaller than 1 m are merged together. As can be seen from Figure 3, there are a total of 8 damage areas of the roof and 10 concentration areas of coal rib spalling. Note that most of the coal rib spalling and roof damage areas overlapped inside the working face. Particularly, these observations are more obvious ranging from 458.0~843.0 m. The real-time monitoring data recorded by the SOS microseism monitoring system covering the periodic extraction of LW 10304 are discussed and critical information about five representative cycles are listed in Table 1 for reference. The hydraulic support in the working face is ZZ13000/28/60.

3. Characteristics and Microseism Activities of Isolated Working Face

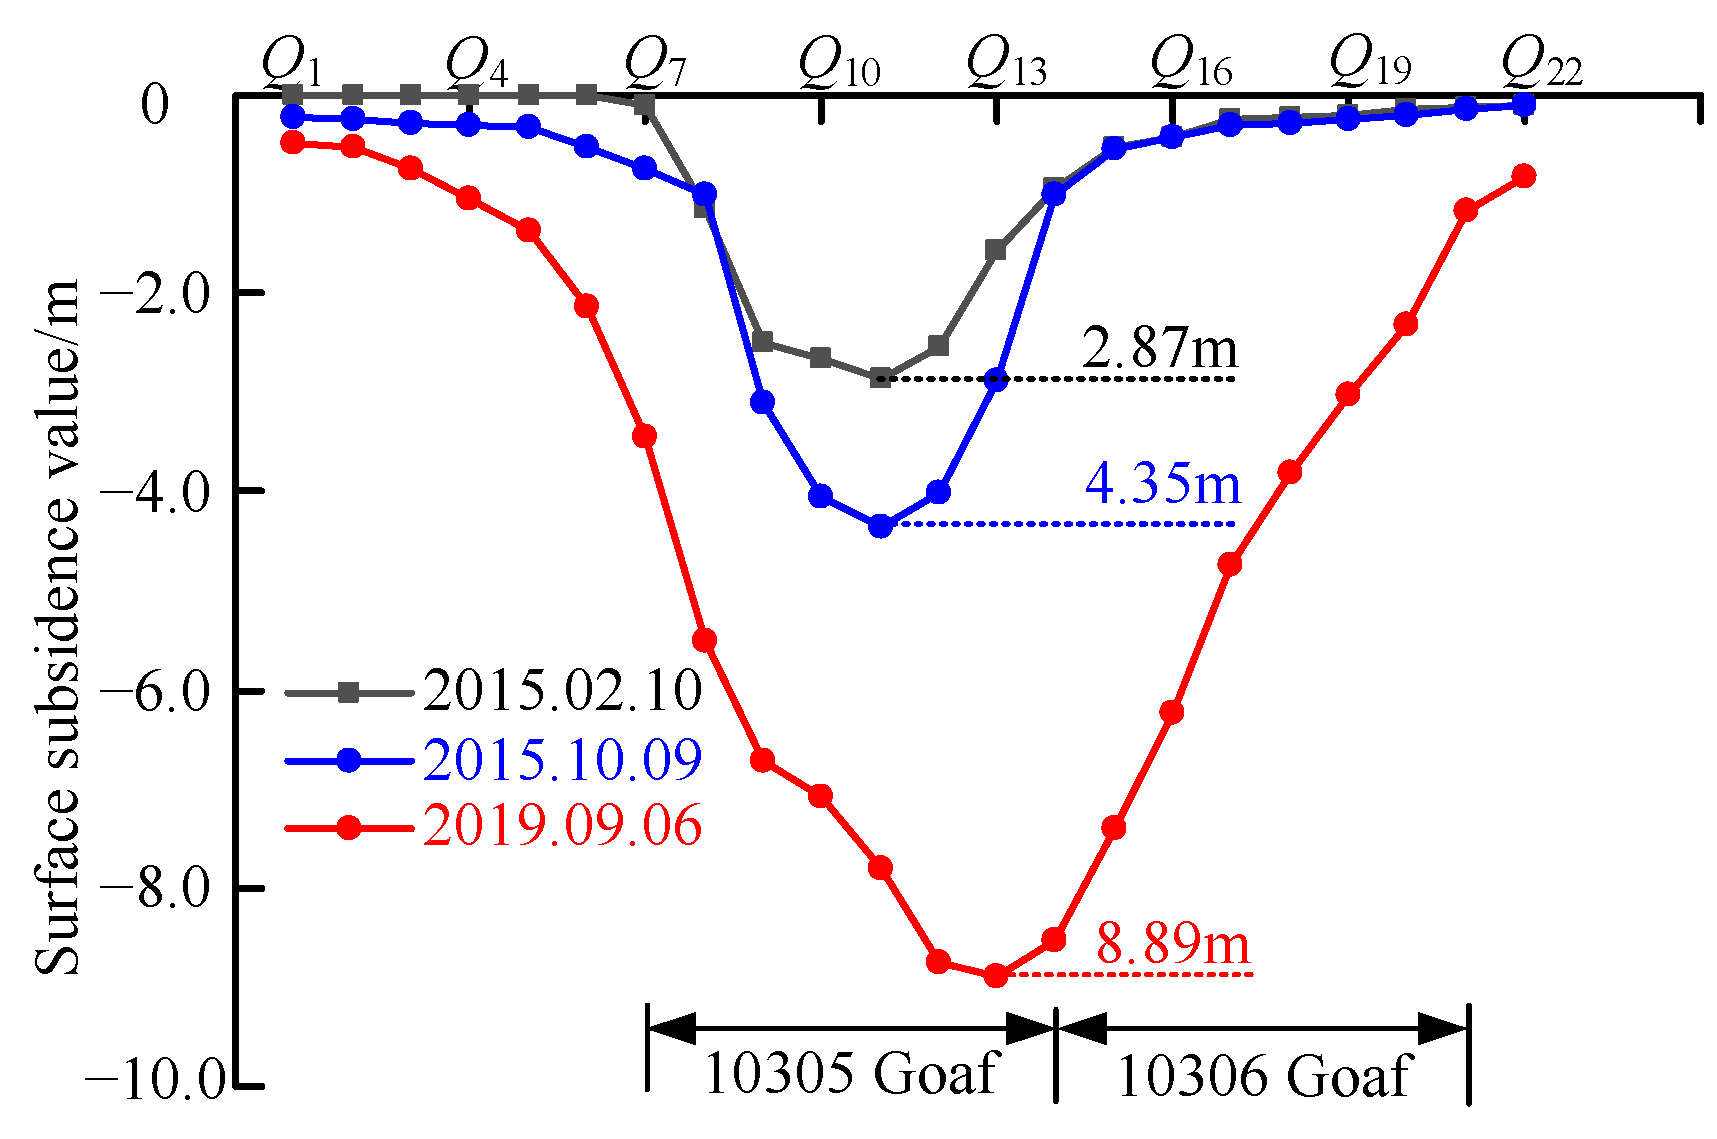
3.1. Characteristics of the Overburden Structure for Isolated Working Face

The working face can be divided into full subsidence and insufficiency mining, mainly according to the maximum subsidence of the ground surface under the geological and mining conditions. In general, the maximum surface subsidence coefficient is closely related to the mining depth (H) and mining size (D). Herein, the mining size can be described by the strike length (DL) and inclination length (DW). It has been well noted that the larger the value of D/H is, the greater the influence of mining activity is. Because the strike length is much larger than that of the inclination length of the goaf, as illustrated in Table 2, the mining degree of the goaf is mainly controlled by the inclination length. Previous research revealed that the aforementioned full mining will be achieved if the value of DW/H is larger than 1.2–1.4, for which no more subsidence will occur [22]. As a result, the goaf on the east side of LW 10304 is fully mined, while the goaf on the west side will be further evaluated in the following section.
Before the initial extraction of coal resources in No. 10 mining area, multiple surface subsidence observation lines have been allocated. Among them, the observation zone of the line numbered Q1~Q22 covered LW 10305 and LW 10306. Figure 4 is the subsidence curve of these working faces measured on 6 September 2019, which can be theoretically judged by Equation (1) via the probability integral method [23].
S max = k m cos β
where k is the surface submersion coefficient, k = 0.4~0.95; m is the coal seam thickness, m = 9.21 m; and β is the dip angle of the coal seam, β = 8°.
As per Equation (1), the empirical maximum subsidence value (Smax) of the goaf area along the west side of LW 10304 ranges from 3.65 m to 8.66 m, which is smaller than that of the measured maximum subsidence value. It is thus inferred that the main key strata in the western goaf were damaged already.
Based on further observation of Figure 4, the overburden strata of LW 10304 is in the form of a symmetrical “T” shape along the vertical direction [14], as depicted in Figure 5. It is apparent that the overburden strata near the goaf were fully broken. As a result, both the breakage and collapsing of strata generally concentrated in the working face.
Figure 6 depicts the spatial distribution of microseism energy and frequency during extraction in LW 10304 from 15 September 2019 to 15 June 2020, with a constant inclination statistical interval of 10 m. In accordance with the response of mining pressure, the curves shown in Figure 6 are divided into three portions: (1) the initial mining stage (0~149.8 m); the obvious mining pressure stage (149.8~468.4 m); and the strong mining-induced stress stage (468.4~856.8 m). It is clear that the variation of energy and frequency of LW 10304 is similar. It is apparent that the correlation coefficients of microseism energy and frequency is 0.99, except in the first stage, which is affected by the solid coal boundary. This observation indicated that the microseism events were mainly in the form of small energy events (99.33% events with energy less than 5 × 10³ J). As can be seen from Figure 6, the microseism energy and frequency account for 16.11%, 3.59%, and 1.73%, and 18.80%, 3.54%, 2.14%, respectively, within the eastern goaf of LW 10304 (0~80 m along the inclination). The same parameters of LW 10304 (81~330 m along the inclination) are 82.82%, 95.48%, and 97.25%, and 79.84%, 95.70%, and 96.41%, respectively. The energy and frequency monitored in the western goaf (331~400 m along inclination) are 1.06%, 0.92%, and 1.03%, and 1.36%, 0.76%, and 1.45%, respectively. That is, microseism events are concentrated in LW 10304 rather than the goaf. Because there are no geological structures in LW 10304 and the adjacent goaf, both the spatial frequency and energy of microseism events are caused by the breakage and collapse of the roof [24].

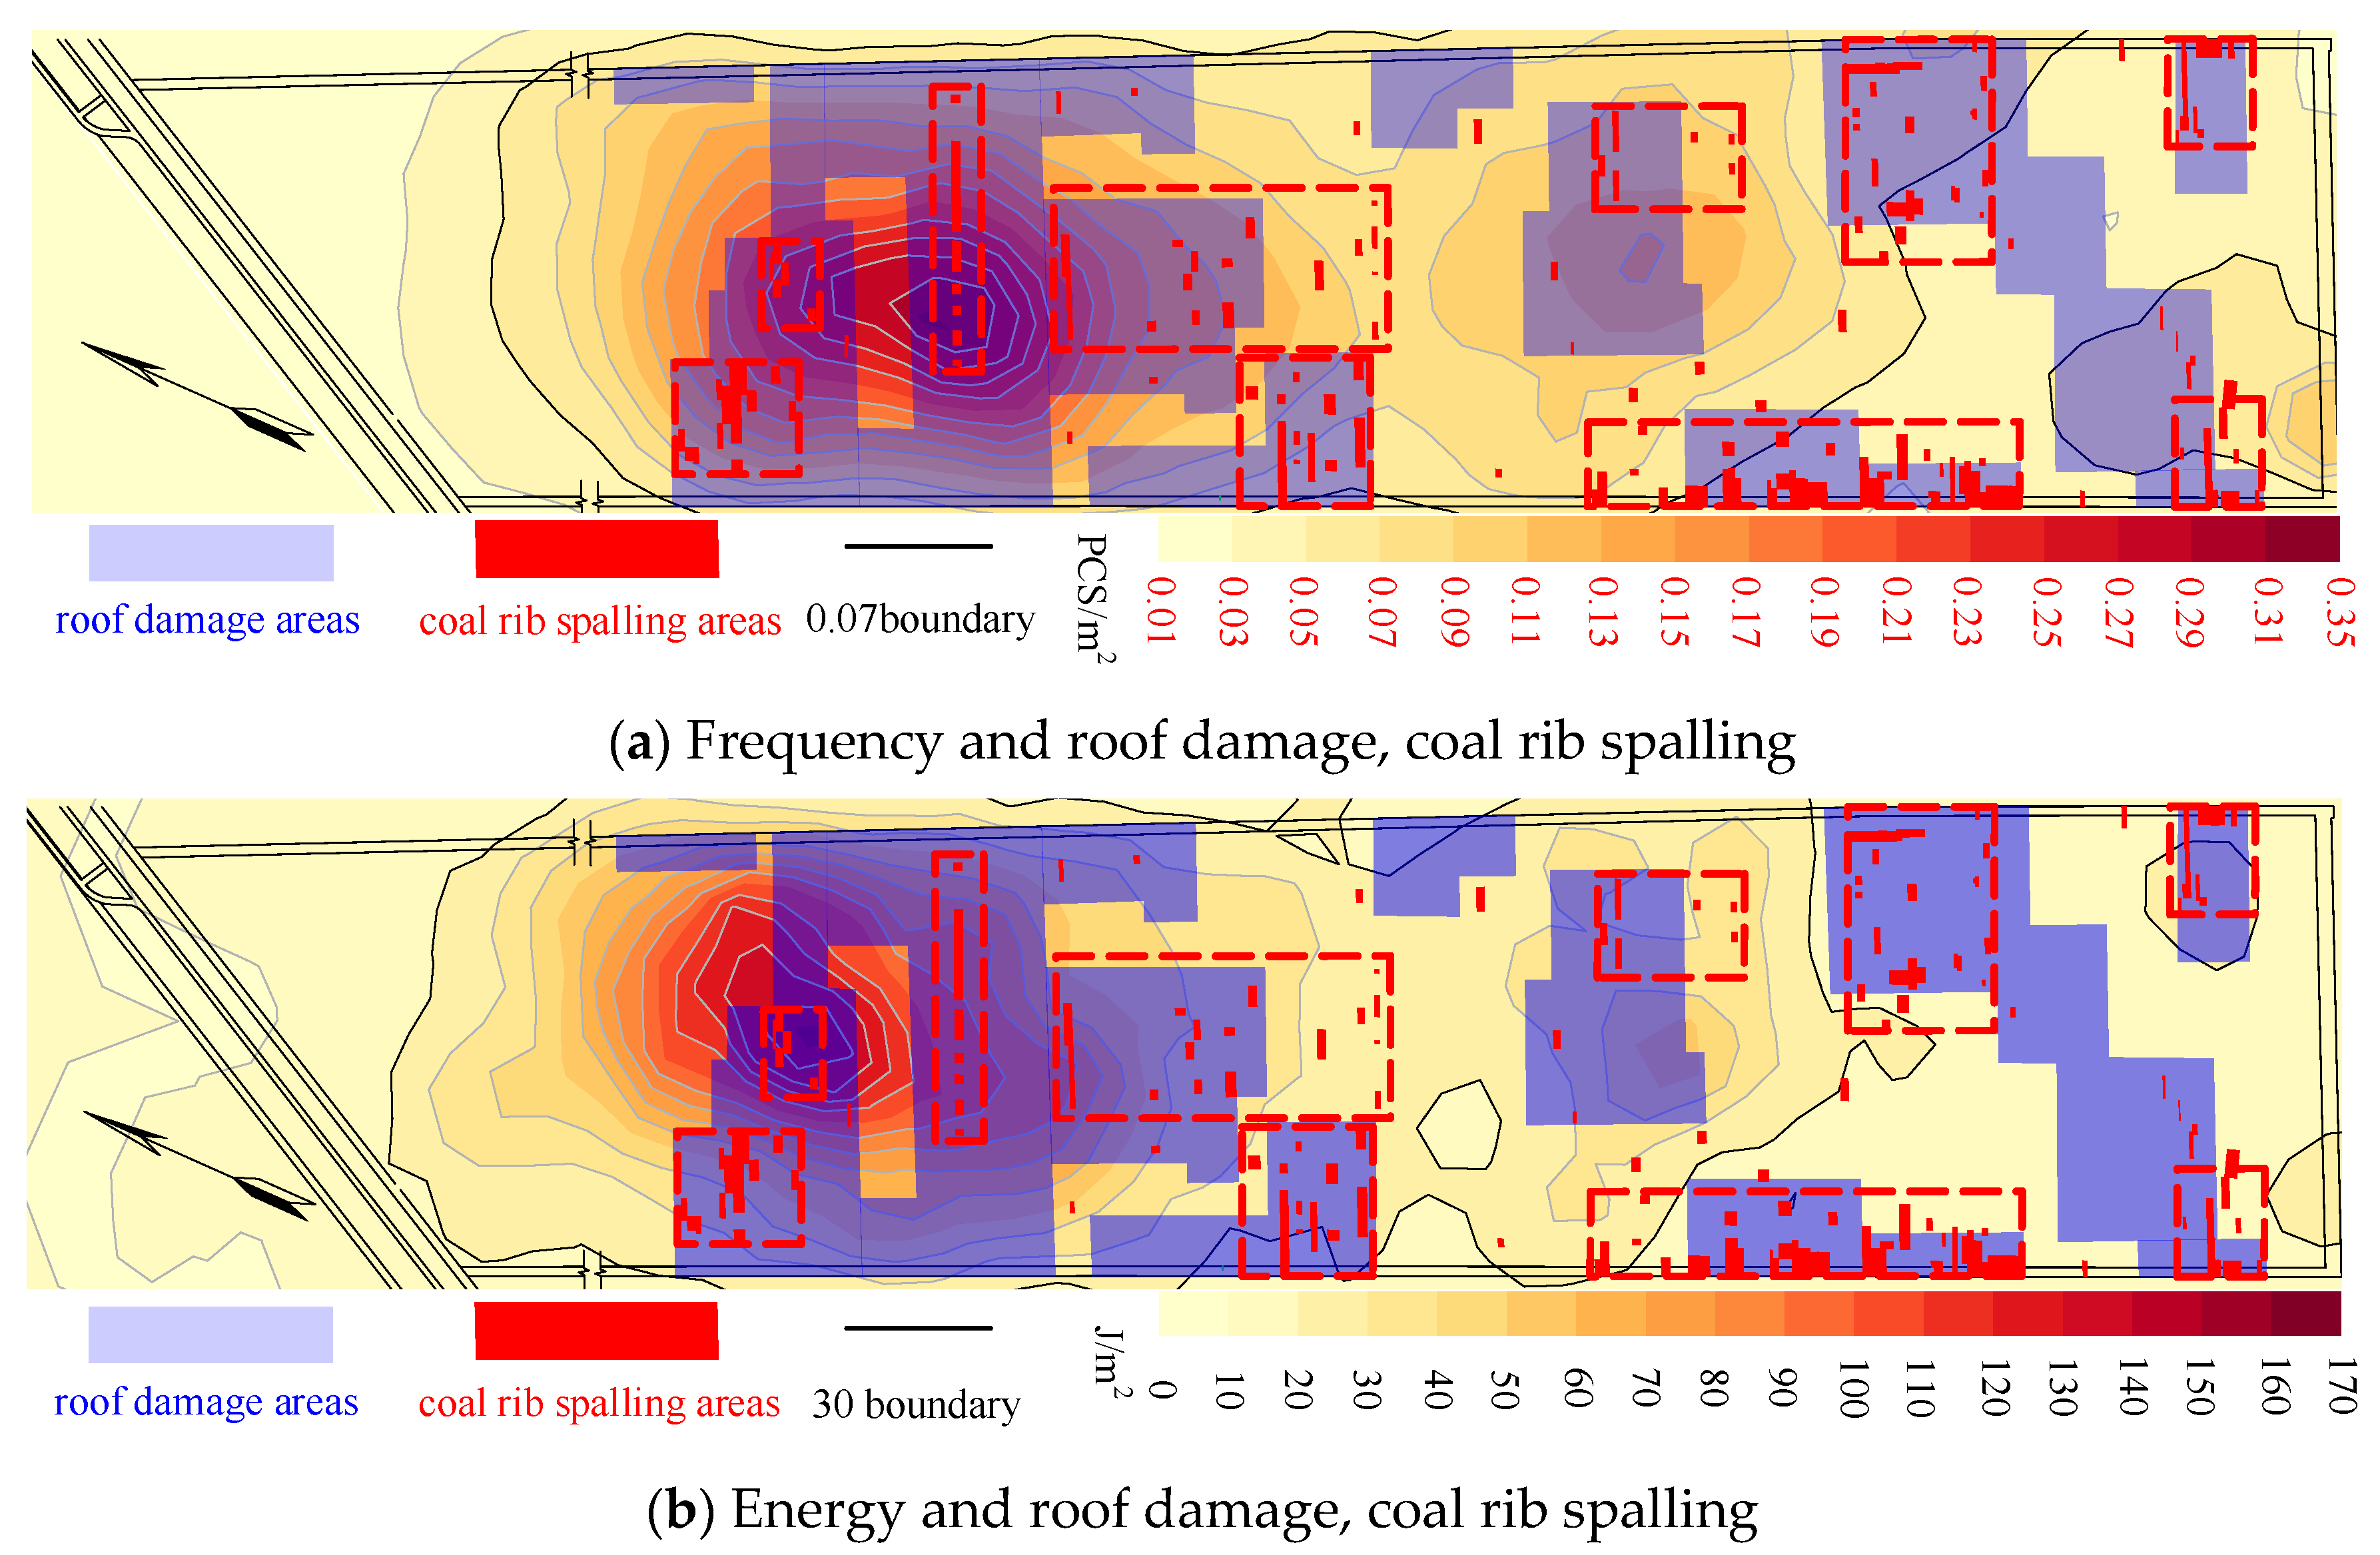
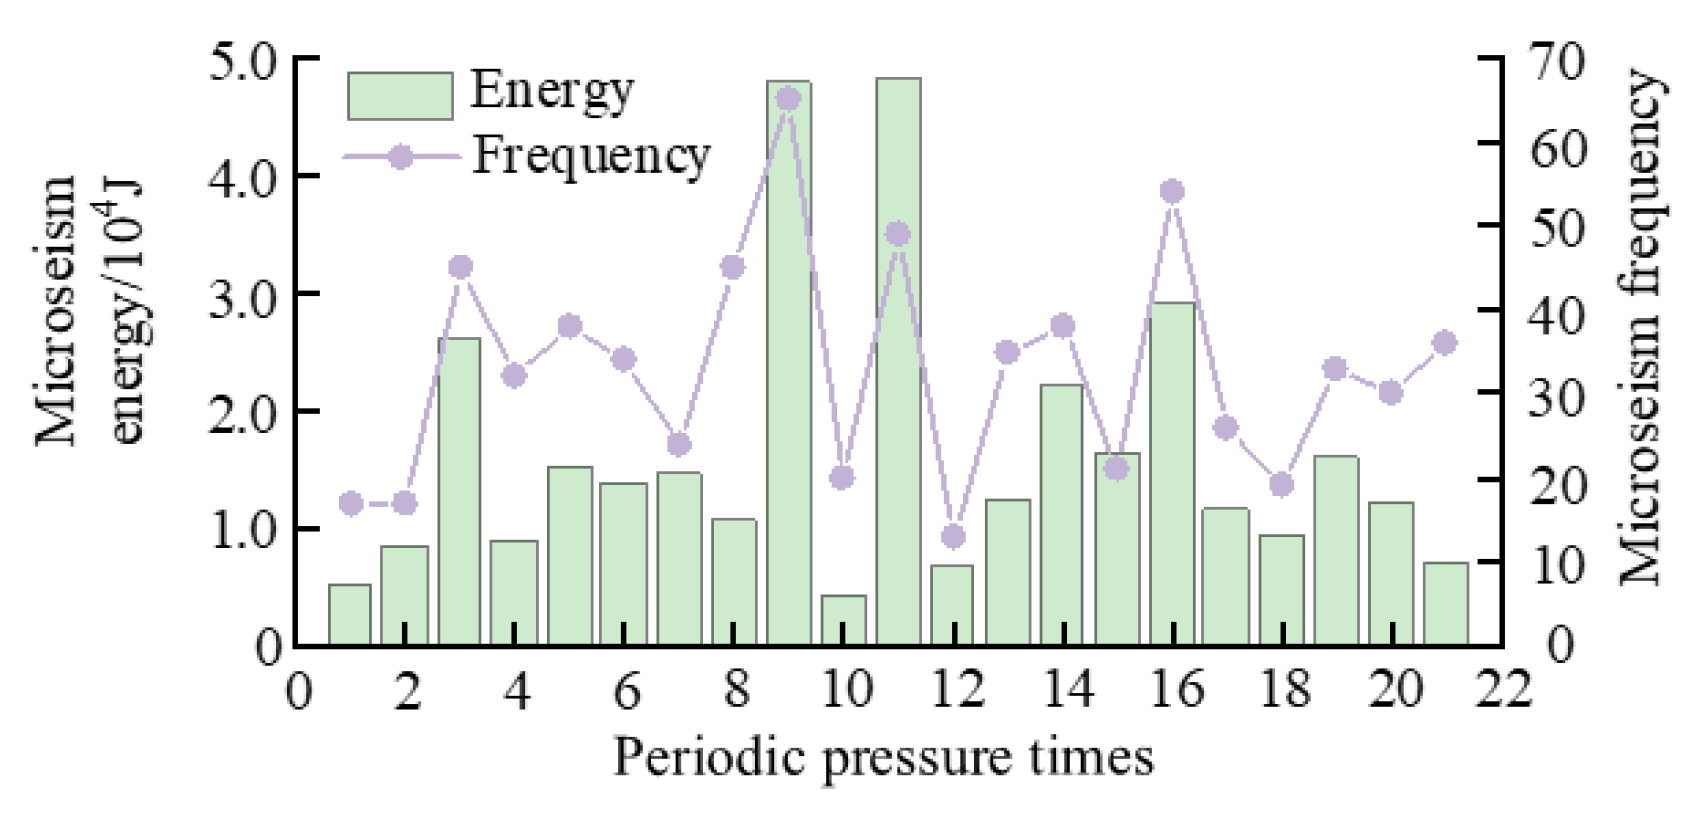
3.2. Analysis of the Relationship of Microseism Events with Roof Damage and Coal Rib Spalling

On-site monitoring showed that the microseism events with energy less than 103 J were dominant (90.15%) during the advanced LW 10304, while only two microseism events with greater energy (>104 J) were captured. This indicates that the movement of LW 10304 probably occurred in the lower strata upon the coal seam [25,26].
As indicated by the definition of the key strata, the breakage of the key strata associated with rotation and sinking will result in spalling and roof collapse [7,27]. As discussed earlier, both the microseism energy and frequency are mainly affected by low roof activity. The statistical date captured from 3 October 2019 to 24 June 2020 are illustrated in Figure 7 for reference. Note that the roof damage within the working face is more obvious than that of the coal rib spalling. This also indicates that the microseism energy has a linear positive correlation to the frequency, regardless of statistical errors attributed to the microseism network [28], even though the fitting correlation coefficient is slightly lower, the value of which ranges from 0.62 to 0.77. Conversely, the correlation between energy and damage scope is closer (108.04% and 122.22% of the frequency), suggesting that high-energy microseism events are mainly caused by the roof damage. Moreover, the coal rib spalling is more sensitive to the microseism energy and its frequency is stronger, at 114.93% and 101.62%, respectively, of the roof damage.
To further explore the relationship between the microseism spatial distribution and damage scope, a grid calculation was introduced to describe the accumulation degree of microseism energy and frequency. As shown in Figure 8, microseism frequency, energy distribution area, and damage scope within the working face are highly overlapped. With the frequency of 0.05/m2~0.35/m2 and energy of 30 J/m2~170 J/m2 as the boundary area, the roof damaged zone accounts for 86.41% and 80.43%, respectively. Apart from six coal rib spalling areas within this zone, the other three coal rib spalling areas are partially overlapped. The highest microseism frequency and energy accumulation zone is within the range of 500~800 m, as shown in Figure 7. In these areas, the accumulation degrees are 0.35/m2 and 170 J/m2, respectively.

3.3. Analysis of Mining-Induced Stress Characteristics of Isolated Working Face Mining

3.3.1. Overburden Structure and Stress State of Isolated Working Face

The stress distribution of an isolated working face is affected by the overburden structure of the goaf. As indicated by Figure 5, both sides of LW 10304 were fully extracted, with a large roof fracture angle (around 65.9°). In this case, the integrity of the overburden strata of LW 10304 was damaged. In detail, the unilateral inclination damaged length of the main key stratum is 76.8 m, with another 82 m remaining. The main roof of LW 10304 was then supported by the coal gangue with progressive vertical compaction. The suspended roof part takes the gangue and uses the solid coal as the fulcrum, respectively. Then, 50% of the overall weight of the hanged roof was transmitted to the coal seam of the isolated working face [29].
The stress (σs) of the coal/rock mass in the isolated working face is the sum of the self-weight stress (σγ) and the stress increments (Δσ1 and Δσ2) transmitted by the overlying strata on both sides of the goaf [30],
σ s = σ γ + Δ σ 1 + Δ σ 2
The stress increments (Δσ1 and Δσ2) transmitted from the overlying strata upon the goaf can be expressed by the following equation:
Δ σ 1 , 2 = { Δ σ max i x tan α H i ( 0 , H i tan α ) Δ σ max i ( 2 x tan α H i ) ( H i tan α , 2 H i tan α ) 0 ( 2 H i tan α , + )
where α is the fracture angle; Hi is the distance from the center of the key strata of the ith layer to the coal seam; and Δσmaxi is the maximum stress increment generated by the key strata of the ith layer, Δσmaxi = Qitanα/Hi.
The load Qi can be obtained by the following equation:
Q i = q i 2 = γ L i ( M i + m i ) 2
where qi is the weight of the key block of the ith layer and the overlying block controlled by it; Li is the length of the key block in layer i; and Mi and mi are the thickness of the key block of the ith layer and the overlying block controlled by it, respectively.
Based on the geological data of the LW 10304 isolated working face, the mechanical parameters required for calculating the stress distribution of the working face are as follows: H1 = 17.03 m, L1 = 17.30 m, M1 = 10.85 m, m1 = 5.59 m; H2 = 33.62 m, L2 = 30.74 m, M2 = 11.15 m, m2 = 2.83 m; H3 = 53.31 m, L3 = 45.07 m, M3 = 18.57 m, m3 = 95.03 m; H4 = 171.14 m, L4 = 114.37 m, M4 = 31.04 m, m4 = 185.58 m; α = 65.9°, γ = 25.5 kN/m3, and the roof breaking angle is 70° [31]. From this, the stress increment distribution curve of the isolated working face is shown in Figure 9.
LW 10304 is affected by the symmetrical “T”-type spatial overburden structure, and its stress increment shape is in the form of the “saddle” shape. The total stress increment curve can be divided into four parts. Combined with the stress increment curves of four key strata on one side of the working face, peak area 1 is close to the goaf boundary, mainly affected by the inferior key strata 1, 2, and 3. The peak stress of this part is 4.16 MPa, which is 24 m away from the goaf boundary. Peak area 2 is in the middle of the isolated working face, which is affected by the main key strata. The peak point in this area is 77 m away from the goaf associated with the peak stress value of 4.11 MPa. The central area is the superposition part of the stress increment, affected by the main key strata on both sides. The coal seam is under high stress, which is 93.18% of the maximum stress increment. As a result, the large stress increment of the isolated working face before extraction will lead to coal rib spalling and roof damage during the extraction of the working face.

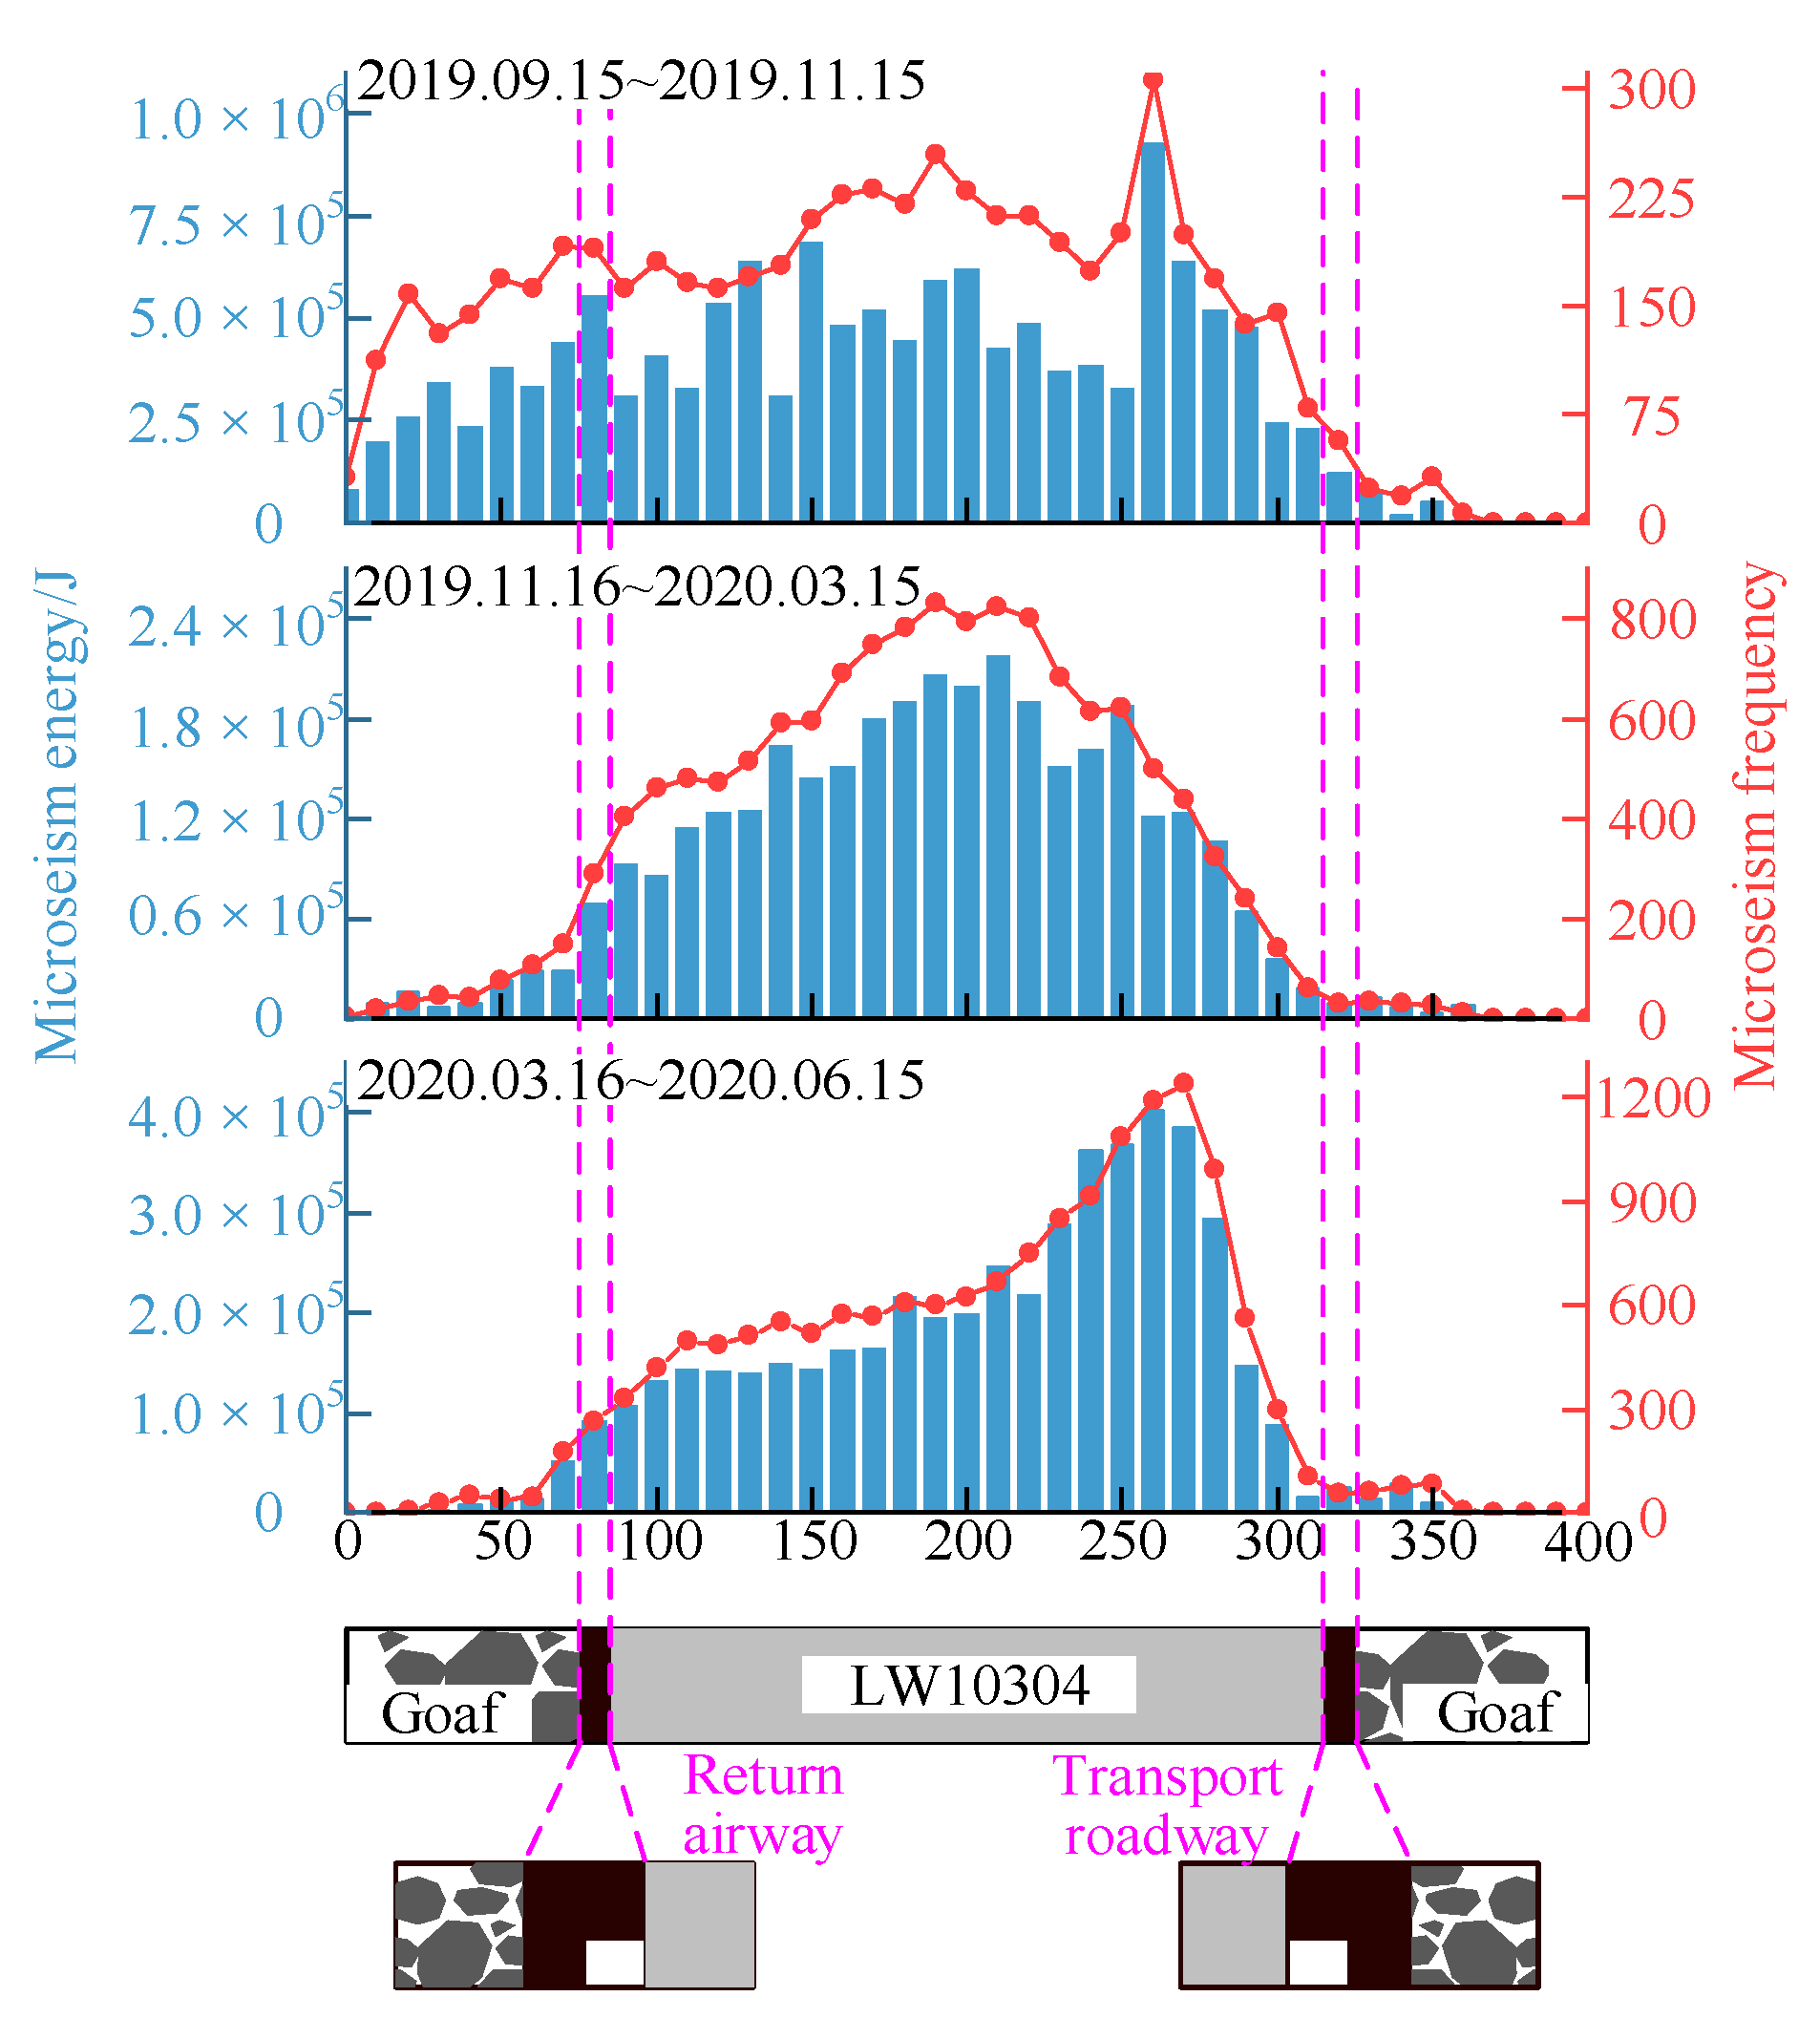
3.3.2. Relationship between Strata Movement and Microseism Activities

There are one or more key strata for the isolated working face. The structure and motion characteristics of the key strata near the coal seam always affect the distribution of mining-induced stress. Based on theoretical calculation, there are three key strata upon the coal seam. After the totally extraction of the working face, the new support structural form will be generated by the combination of the bended overburden strata and coal gangues from the direct roof. The field-measured caving–mining ratio of the isolated working face is 3.1~4.4, and correspondingly the height of the caving zone should be 28.55~40.52. With the consideration of strata movement [32], IKS 1 and IKS 2 broke into the caving zone and formed a cantilever beam when LW 10304 was mined. The theoretical calculated step distance of the key strata (IKS3, 43.02 m away from the coal seam) is 16.30~17.79 m. In this situation, there will be a “masonry beam” where the breaking step is 30.24 m. As shown in Figure 10, the on-site measured periodic weighting interval is about 17.30 m, which is basically consistent with the weighting intervals of IKS1 and IKS2. That is, the mining-induced stress behavior of LW 10304 is also affected by the IKS1 and IKS2.
The microseism information was systematically collected with the constant statistical step of 5 m. As illustrated in Figure 11, the microseism events were mainly distributed within the range of 0~80 m, and they decreased with distance apart from the working face. According to the decreasing trend of the energy and frequency, the curves are divided into three states: (1) The high-level stage of microseism energy and frequency around 0~20 m, in which the energy and frequency accounts for 43.34% and 40.12%, respectively, occupied a dominant role. Herein, the first and second breaking steps of inferior key strata are all within this part; (2) The decreased stage of microseism energy and frequency around 20~50 m, the value of which accounts for 32.13% and 27.12%, respectively, indicating that the third inferior key stratum is within this range; (3) The lower stage of microseism energy and frequency ranging from 50 m to 80 m, which accounts for 24.50% and 32.16%, respectively. In the first two stages, the proportion of frequency decreased compared with the energy, indicating that the first two stages are mainly dominated by high-energy microseism events. Note that the microseism energy increases significantly when the main key strata breaking distance reached 67.96 m. In summary, the activity of IKS1 and IKS2 is much higher than that of IKS3 and MKS. That is, the microseism data within the 0~20 m zone can reflect the motion state of IKS1 and IKS2.

4. Identification of Weighting Strength of the Isolated Working Face

4.1. Selection of Critical Parameters for Identification

Previous experience obtained from daily production indicated that the normal mining activity will be disturbed if the cumulated coal rib spalling and roof damage zone (number of cycles × width of the working face) exceeds about 25% of the total area of the working face. It will threaten the safety of miners if it exceeds 50%. Therefore, it is necessary to identify the weighting strength based on field-monitoring data. As discussed above, the microseism frequency and energy are closely related to the mining-induced stress behavior within the range of 0~20 m behind the working face. The larger the advanced speed, the longer the hanged roof is. Correspondingly, the side effect of overburden strata will be much more obvious. Moreover, the mining-induced stress resisted by the hydraulic support can reflect the mine’s mining-induced stress. Thus, four indexes including the microseism frequency, microseism energy, mining speed, and support resistance were selected to identify the mining-induced stress strength of the isolated working face.
The results of 21 periodic weighting periods (458.0–842.9 m) covering the coal rib spalling and roof damage are presented in Figure 12 and Figure 13. The statistical results showed that the microseism frequency is positively correlated with the mining speed and energy distribution. However, the support resistance is negatively correlated with other parameters, especially when the 9th and 11th cycle were analyzed.

4.2. Identification of Weighting Strength of Isolated Working Face

During these 21 periodic weighting periods, the average advancing rate and the cutting depth of LW 10304 is 4 m and 0.8 m, respectively. In the present research, the cumulated coal rib spalling and roof damage exceeding 25% (294 m) and 50% (588 m) of the statistical range (the number of cycles × the width of working face) are determined as the threshold to differentiate the medium and the strong mining-induced stress separately. To eliminate the dimensional influence between variable parameters, each parameter is synthesized as per the following equation:
X i = x i x i min x i max x i min
where Xi is the normalized parameter; xi is the initial parameter before the normalization; ximax and ximin are the maximum and minimum values of each parameter, respectively; and 1 − Xi was used for normalization when the negative relationship between the support resistance and the damage range is accounted for.

4.2.1. Analysis of Single Index Identification Efficiency

The earthquake prediction value R proposed by Xu [33], as expressed in Equation (6), was used to evaluate the effectiveness of these warning indexes.
R = R 1 R 0 = n 1 1 N 1 n 0 1 N 0
where R1 is the accuracy rate and R0 is the false rate. R = 1 means all approval; R = 0 indicates that the forecast does not work; N1 represents the total number of earthquakes predicted; N0 represents the total number of seismic-free forecasts; n 1 1 is the number of earthquakes predicted correctly; and n 0 1 is the number of earthquakes predicted incorrectly.
Note that the value of R is closely related to the threshold value. Taking the “strong pressure” as an example, when the threshold is 0, the index of each “strong pressure” is strong and the value of R1 is equal to 1. Meanwhile, if the non-strong mining-induced stress is predicted to be strong, the R1 is also 1. On the contrary, when the threshold is 1, the values of R1 and R0 will be zero. Because R1 and R0 all decrease with the increased value of the threshold, the values of R1-R0 can be adopted to reflect the early warning rate, which can also be seen in Figure 14.
Taking the “strong pressure” as an example, Figure 15 illustrated four indexes (i.e., microseism frequency, microseism energy, daily advancement, and support resistance) together for further discussion. The threshold values of these four indicators are 0.49~0.61, 0.57~0.69, 0.65~0.68, and 0.85~0.97, respectively. Correspondingly, the optimal effectiveness of warnings are 0.89, 0.67, 0.50, and 0.67, respectively. Similar to other observations, the microseism frequency, microseism energy, and advancement rate are all positively correlated with the damage range, whereas the support resistance is negatively correlated with the damage range. The effectiveness of the microseism frequency indicated that the microseism events can reflects the activity of the lower key strata. The frequency exceeded the threshold value when the 8th, 9th, and 11th strong pressures occurred. However, the values of these indexes approximately reach the threshold value at the 9th and 11th. Considering the overestimated advancement rate, integrating the above indicators to comprehensively identify the mining-induced stress strength is requested.

4.2.2. Indicators Affecting Weight Distribution

Considering the early warning effectiveness of different indicators, the weight discriminant model was established. As can be seen from Equation (7), the model consists of a target C and n evaluation indexes a1, a2, ..., an and the evaluators. The scale method is applied to compare the effectiveness of indexes to each other and then used to construct the weight discriminant matrix.
A = [ a 1 a 1 a 1 a 2 a 1 a n a 2 a 1 a 2 a 2 a 2 a n a m a 1 a m a 2 a m a n ] = [ A 11 A 12 A 1 n A 21 A 21 A 2 n A m 1 A m 2 A m n ]
The maximum eigenvalue of judgment matrix (A) is calculated as per A W = λ max W .
The consistency test can be performed in accordance with the following equation:
C R = C I R I = λ max n ( n 1 ) R I
where n is the order of the average judgment matrix; and RI represents the average random consistency index, the values of which can be seen from Table 3.
If the calculated CR value is less than 0.1, the consistency of judgment matrix (A) is acceptable, the eigenvector ( W = [ w 1 , w 2 ,   w n ] ) corresponding to the maximum eigenvalue is the weight matrix of each factor, and w 1 + w 2 + + w n = 1 , w n represents the weight of the early warning effectiveness of the nth index in the lower layer.
Followed by the evaluation on the influence of each index in terms of the mining-induced stress intensity and the comparison scale criterion, the influence judgment matrix of each index is given. Taking “strong pressure” as an example, the effectiveness of the four indicators (i.e., microseism frequency, microseism energy, daily footage, and support resistance) are 0.89, 0.67, 0.50, and 0.67, respectively. Considering the lower effectiveness of the daily advancement, only the microseism frequency, microseism energy, and support resistance were selected to construct a judgment matrix, as shown in Table 4. Based on the theoretical analysis, it can be seen that λ m a x = 3 and CR = 0 < 0.1, satisfying the consistency test. Furthermore, the weight matrix W = [ 0.714 , 0.143 , 0.143 ] .

4.2.3. Comprehensive Index to Mining-Induced Stress

The comprehensive index of weight parameters is adopted in this research to identify the mining-induced stress of LW 10304. The fusion formula is listed below for reference:
I s t r o n g = 0.714 I 1 + 0.143 I 2 + 0.143 I 4
where I1 represents the microseism frequency; I2 is defined as the microseism energy; and I4 is the support resistance.
According to the relationship between the critical value of the index and the early warning efficiency, the optimal index critical interval of the “strong” comprehensive index is determined, and the best early warning efficiency is obtained. As can be seen from Figure 16, the accuracy of two indexes is three times, but the number of false alarms of microseism frequency is four times. In this case, the comprehensive early warning efficiency is 0.94, which is 5.62% higher than when the single index (microseism frequency) was adopted.
According to the analysis of Section 4.2.1 and Section 4.2.2, the early warning efficiency and critical interval of each single index when the degree of mining-induced stress behavior in the 10304 isolated working face is “medium” is shown in Table 5. Considering the low early warning efficiency of support resistance, the early warning efficiency of microseism frequency, microseism energy, and daily footage indexes were selected to construct the judgment matrix and determine the weight matrix.
Similar to the comprehensive index fusion formula, the “medium mining-induced stress” identification of the 10304 isolated working face is as follows:
I m e d i u m = 0.637 I 1 + 0.258 I 2 + 0.105 I 3
where I1 represents microseism frequency; I2 represents microseism energy; and I3 indicates daily footage.
According to the relationship between the critical value of the index and the early warning efficiency, the optimal critical interval of the “medium” comprehensive index is determined, and the optimal early warning efficiency is obtained, as shown in Figure 17. When the mining-induced stress intensity is “medium”, the early warning efficiency of the comprehensive index “medium” is only 0.64, which is lower than that of “strong”. According to the comprehensive index of “strong” and “medium”, the weight of microseism frequency is the largest, indicating that the roof activity in the goaf of the 10304 isolated working face is severe, which is more likely to induce microseism events, and the mining-induced stress is strong. At this time, the early warning efficiency of “medium” is higher.

5. Conclusions

(1) Through the analysis of mining size and subsidence, the overlying strata structure of the isolated working face surrounded by two goafs presents a “T” shape before extraction, and the inferior key strata near the coal seam dominantly controlled the microseism activity and mining-induced stress response;
(2) The distribution of the stress increment is in the form of a symmetrical “saddle” shape before the extraction of the isolated working face, mainly influenced by the inferior strata near the coal seam. Influenced by the main key layer, the overall stress increment in the middle area is higher than that of its counterparts;
(3) Microseism events are mainly distributed within the isolated working face during the mining process. There is a strong correlation between microseism events and the damage range of stope. The frequency and energy of microseism events are positively correlated with roof damage and coal rib spalling. Moreover, the frequency and energy of microseism events are highly overlapping with the damage range;
(4) Based on the relationship between microseism events and overburden movement, a comprehensive index of weighting pressures including microseism frequency, microseism energy, and support resistance was set up, which has a good effect on the identification of “strong pressure”.

Author Contributions

Conceptualization, Y.W. and A.C.; methodology, Y.W.; software, W.G.; validation, W.G. and G.L.; formal analysis, Y.W.; investigation, C.X. and A.C.; resources, X.Y.; data curation, G.L.; writing—original draft preparation, Y.W.; writing—review and editing, A.C.; supervision, A.C.; project administration, X.Y.; funding acquisition, A.C. All authors have read and agreed to the published version of the manuscript.

Funding

This research was funded by National Natural Science Foundation of China (No. U21A20110 and 52274098), Shandong Provincial Department of Science and Technology (2019SDZY02), and the Natural Science Foundation of Xinjiang Uygur Autonomous Region of China (2020D01C039).

Data Availability Statement

The data used to support the findings of this study are available from the corresponding author upon request.

Acknowledgments

The authors are grateful to Xinglongzhuang Coal Mine for providing field testing. The authors would also like to thank the peer reviewers and Editors for their valuable comments and suggestions, which have greatly improved the manuscript presentation.

Conflicts of Interest

The authors declare no conflict of interest.

References

  1. Han, C.L.; Yang, H.Q.; Zhang, N.; Deng, R.J.; Guo, Y.X. Zoning Control Technology of Gob-Side Roadway Driving with Small Coal Pillar Facing Mining in a Special Isolated Island Working Face: A Case Study. Appl. Sci. 2021, 11, 10744. [Google Scholar] [CrossRef]
  2. Liu, H.; Wang, P.; Zhang, W.; Liu, Q.; Su, L. Comprehensive Measurement of the Deformation and Failure of Floor Rocks: A Case Study of the Xinglongzhuang Coal Mine. Geofluids 2020, 2020, 8830217. [Google Scholar] [CrossRef]
  3. Hao, J.; Chen, J.; Shi, Y. Study on the Method of Prevention and Control of Dynamic Disasters in Isolated Island Face. In Proceedings of the 9th China-Russia Symposium Coal in the 21st Century: Mining, Intelligent Equipment and Environment Protection, Qingdao, China, 18–21 October 2018; Volume 176, pp. 131–134. [Google Scholar]
  4. Liang, X.C.; Zhu, M.M.; Lu, D.C.; Liu, X. Strata Pressure Behavior Study on Isolated Island Face in Huainan Mine Area. Adv. Mater. Res. 2013, 803, 367–369. [Google Scholar] [CrossRef]
  5. Ge, H.J.; Feng, Z.Z.; Li, C.Y. Strong ground pressure characteristics and prevention technology when shallow buried island working face goes down through overlying residual coal pillar. Coal Sci. Technol. 2022, 50, 36–41. (In Chinese) [Google Scholar]
  6. Chen, Y.; Liu, C.; Liu, J.; Yang, P.; Lu, S. Case Study on Dynamic Identification of Overburden Fracture and Strong Mine Pressure Mechanism of Isolated Working Face Based on Microseismic Clustering. Sustainability 2022, 15, 436. [Google Scholar] [CrossRef]
  7. Zhu, G.A.; Dou, L.M.; Liu, Y.; Su, Z.G.; Li, J. Rock burst mechanism analysis on deep irregular island face. J. Min. Saf. Eng. 2016, 33, 630–635. (In Chinese) [Google Scholar]
  8. Zhu, S.; Feng, Y.; Jiang, F.; Liu, J. Mechanism and risk assessment of overall-instability-induced rockbursts in deep island longwall panels. Int. J. Rock Mech. Min. Sci. 2018, 106, 342–349. [Google Scholar] [CrossRef]
  9. Jia, C.Y.; Wang, H.L.; Sun, X.Z.; Yu, X.B.; Luan, H.J. Study on rockburst prevention technology of isolated working face with thick-hard roof. Geomech. Eng. 2020, 20, 447–459. [Google Scholar]
  10. Chen, Y.; Li, D.; Jiang, F.X.; Zhang, L.L.; Wang, C.W.; Zhu, S.T. Use of the Equivalent Mining Height Method for Understanding Overlying Strata Movement and Stress Distribution in an Isolated Coal Pillar. Shock Vib. 2020, 2020, 8820886. [Google Scholar] [CrossRef]
  11. Ma, S. Research on the Rock Pressure Behavior at Close-Distance Island Working Faces under Deep Goaf. Adv. Civ. Eng. 2021, 2021, 4714012. [Google Scholar] [CrossRef]
  12. Tu, M.; Bu, Q.W.; Fu, B.J.; Wang, Y. Mechanical Analysis of Mining Stress Transfer on Isolated Island Face in Extra-Thick Fully Mechanized Top-Coal Caving Mining. Geofluids 2020, 2020, 8834321. [Google Scholar] [CrossRef]
  13. Liu, F.; Han, Y. Deformation Mechanism and Control of the Surrounding Rock during Gob-Side Entry Driving along Deeply Fully Mechanized Caving Island Working Face. Geofluids 2021, 2021, 5515052. [Google Scholar] [CrossRef]
  14. Xue, C.; Cao, A.; Guo, W.; Wang, S.; Liu, Y.; Shen, Z. Mechanism of Coal Burst and Prevention Practice in Deep Asymmetric Isolated Coal Pillar: A Case Study from YaoQiao Coal Mine. Shock Vib. 2021, 2021, 3751146. [Google Scholar] [CrossRef]
  15. Sun, B.; Zhu, S.; Jiang, F.; Wang, G. Mechanism and Safety Mining Technology of Overall Instability-Induced Rock-bursts of Multi-Coal Seam Spatially Isolated Working Face. Math. Probl. Eng. 2022, 2022, 1038139. [Google Scholar] [CrossRef]
  16. Guy, R.; Kent, M.; Russell, F. An assessment of coal pillar system stability criteria based on a mechanistic evaluation of the interaction between coal pillars and the overburden. Int. J. Min. Sci. Technol. 2017, 27, 9–15. [Google Scholar]
  17. Kumar, R.; Das, A.J.; Mandal, P.K.; Bhattacharjee, R.; Tewari, S. Probabilistic stability analysis of failed and stable cases of coal pillars. Int. J. Rock Mech. Min. Sci. 2021, 144, 104810. [Google Scholar] [CrossRef]
  18. Wang, C.; Cao, A.; Zhang, C.; Canbulat, I. A New Method to Assess Coal Burst Risks Using Dynamic and Static Loading Analysis. Rock Mech. Rock Eng. 2019, 53, 1113–1128. [Google Scholar] [CrossRef]
  19. Cao, A.; Dou, L.; Cai, W.; Gong, S.; Liu, S.; Jing, G. Case study of seismic hazard assessment in underground coal mining using passive tomography. Int. J. Rock Mech. Min. Sci. 2015, 78, 1–9. [Google Scholar] [CrossRef]
  20. Zhang, C.; Jin, G.; Liu, C.; Li, S.; Xue, J.; Cheng, R.; Wang, X.; Zeng, X. Prediction of rockbursts in a typical island working face of a coal mine through microseismic monitoring technology. Tunn. Undergr. Space Technol. 2021, 113, 103972. [Google Scholar] [CrossRef]
  21. Qian, M.G.; Miao, X.X.; Xu, J.L. Theoretical study of key stratum in ground control. J. China Coal Soc. 1996, 3, 2–7. (In Chinese) [Google Scholar]
  22. Ma, C.; Cheng, X.G.; Yang, Y.L.; Zhang, X.K.; Guo, Z.Z.; Zou, Y.F. Investigation on Mining Subsidence Based on Multi-Temporal InSAR and Time-Series Analysis of the Small Baseline Subset-Case Study of Working Faces 22201-1/2 in Bu’ertai Mine, Shendong Coalfield, China. Remote Sens. 2016, 8, 951. [Google Scholar] [CrossRef] [Green Version]
  23. Yang, Z.F.; Li, Z.W.; Zhu, J.J.; Hu, J.; Wang, Y.J.; Chen, G.L. InSAR-Based Model Parameter Estimation of Probability Integral Method and Its Application for Predicting Mining-Induced Horizontal and Vertical Displacements. IEEE Trans. Geosci. Remote Sens. 2016, 54, 4818–4832. [Google Scholar] [CrossRef]
  24. Liu, C.; Li, S.; Cheng, C.; Cheng, X. Identification methods for anomalous stress region in coal roadways based on microseismic information and numerical simulation. Int. J. Min. Sci. Technol. 2017, 27, 525–530. [Google Scholar] [CrossRef]
  25. Mondal, D.; Roy, P.; Kumar, M. Monitoring the strata behavior in the Destressed Zone of a shallow Indian longwall panel with hard sandstone cover using Mine-Microseismicity and Borehole Televiewer data. Eng. Geol. 2020, 271, 105593. [Google Scholar] [CrossRef]
  26. Wang, F.; Li, G.; Liu, C. Investigation on Rock Strata Fracture Regulation and Rock Burst Prevention in Junde Coal Mine. Math. Probl. Eng. 2021, 2021, 2583707. [Google Scholar] [CrossRef]
  27. Yang, J.; Liu, C.; Yu, B. Application of Confined Blasting in Water-Filled Deep Holes to Control Strong Rock Pressure in Hard Rock Mines. Energies 2017, 10, 1874. [Google Scholar] [CrossRef] [Green Version]
  28. Gong, S.-Y.; Dou, L.-M.; Ma, X.-P.; He, J.; Liu, Y.-G. Study on the improvement of the microseismic network configuration for San He-jian coal mine. Procedia Eng. 2011, 26, 1398–1405. [Google Scholar]
  29. Feng, Y.; Jiang, F.X.; Li, J.D. Evaluation method of rock burst hazard induced by overall instability of island coal face. J. China Coal Soc. 2015, 40, 1001–1007. (In Chinese) [Google Scholar]
  30. Zhu, S.; Feng, Y.; Jiang, F. Determination of Abutment Pressure in Coal Mines with Extremely Thick Alluvium Stratum: A Typical Kind of Rockburst Mines in China. Rock Mech. Rock Eng. 2015, 49, 1943–1952. [Google Scholar] [CrossRef]
  31. Xu, B.; Jiang, J.Q.; Dai, J.; Zheng, P.Q. Mechanical derivation and experimental simulation of breaking angle of key strata in overlying strata, J. China Coal Soc. 2018, 43, 599–606. (In Chinese) [Google Scholar]
  32. Guo, J.; Feng, G.R.; Wang, P.F.; Qi, T.Y.; Zhang, X.R.; Yan, Y.G. Roof Strata Behavior and Support Resistance Determination for Ultra-Thick Longwall Top Coal Caving Panel: A Case Study of the Tashan Coal Mine. Energies 2018, 11, 1041. [Google Scholar] [CrossRef] [Green Version]
  33. Xu, S.X. Earthquake activity prediction method. Acta Seismol. Sin. 1993, 15, 239–252. (In Chinese) [Google Scholar]
Figure 1. Working face location diagram.
Energies 16 02839 g001
Figure 2. X2 borehole histogram.
Energies 16 02839 g002
Figure 3. Roof damage and coal rib spalling distribution map (the blue number 1–8 is the serial number of the roof damage area, and the red number 1–10 is the serial number of the concentration areas of coal rib spalling).
Energies 16 02839 g003
Figure 4. Surface subsidence curves of the western goaf.
Energies 16 02839 g004
Figure 5. The schematic diagram of overburden structure characteristics of the isolated working face.
Energies 16 02839 g005
Figure 6. The spatial distribution of microseism energy and frequency in the inclination direction.
Energies 16 02839 g006
Figure 7. Correlation between microseism events and roof damage, coal rib spalling.
Energies 16 02839 g007aEnergies 16 02839 g007b
Figure 8. Spatial distribution characteristics of microseism accumulation and roof damage, coal rib spalling.
Energies 16 02839 g008
Figure 9. Stress increment distribution map of isolated working face.
Energies 16 02839 g009
Figure 10. Diagram of overlying strata during working face mining fracture.
Energies 16 02839 g010
Figure 11. Microseism events distribution curve in goaf.
Energies 16 02839 g011
Figure 12. The total frequency and energy distribution of microseism during periodic pressure.
Energies 16 02839 g012
Figure 13. The average support resistance and daily footage during periodic pressure.
Energies 16 02839 g013
Figure 14. The relationship between critical value of index and early warning effectiveness.
Energies 16 02839 g014
Figure 15. Critical interval and effectiveness of early warning index of mining-induced stress intensity (taking “strong” as an example).
Energies 16 02839 g015aEnergies 16 02839 g015b
Figure 16. Comprehensive index early warning critical interval and effectiveness (“strong”).
Energies 16 02839 g016
Figure 17. Comprehensive index early warning critical interval and efficiency (“medium”).
Energies 16 02839 g017
Table 1. Critical information of five representative cycles.
No.Period Pressure DatePeriod Pressure Step/mSupport Resistance/kNMicroseism Energy/JMicroseism FrequencyCoal Rib Spalling/mRoof Damage Range/m
65 November 201920.07114.21.84 × 10413012.25218.75
1012 December 20199.16842.51.67 × 1048142.21204.75
203 February 202024.88692.61.15 × 10551047.25385.12
3127 March 202023.76713.33.02 × 105861131.25439.25
363 May 202024.37287.33.95 × 105851239.45651.56
Table 2. Judgment table for goaf mining adoption level.
LocationStrike Length
DL/m
Inclination Length DW/mMining Depth H/mDW/H
Eastern goaf2450~
3620
650~
710
4251.53~1.67
Western goaf1450~
1980
490~
500
4401.11~1.14
Table 3. Evaluation of random consistency index assignment criteria.
Order12345678
RI000.520.891.121.261.361.14
Table 4. Judgment matrix of each index.
IndexMicroseism FrequencyMicroseism EnergySupport Resistance
Microseism frequency155
Microseism energy1/511
Support resistance1/511
Table 5. Early warning effectiveness and weight analysis of each index.
IndexAccuracy Rate R1False R0Optimal Effectiveness RIndex Threshold
Microseism frequency1.000.360.640.33–0.36
Microseism energy0.570.070.500.28–0.40
Daily footage0.860.430.430.37
Support resistance0.430.070.350.75–0.81
Disclaimer/Publisher’s Note: The statements, opinions and data contained in all publications are solely those of the individual author(s) and contributor(s) and not of MDPI and/or the editor(s). MDPI and/or the editor(s) disclaim responsibility for any injury to people or property resulting from any ideas, methods, instructions or products referred to in the content.

