
Optimal Integration of Hybrid Energy Systems: A Security-Constrained Network Topology Reconfiguration


Abstract
1. Introduction
1.1. Literature Review

| Objective | Target | Reference Number |
|---|---|---|
| Technical | Active power losses minimization | [6,7,8,9,10,11,12,13,14,15,16,17,18,23,24] |
| Voltage profile improvement | [6,8,19,23,24] | |
| Reliability improvement | [12,13,14,17,18] | |
| Load balancing | [13,15] | |
| Economic | Switching costs | [9] |
| Operation costs | [6,14,18] | |
| Investment costs | [19,20,21] |
1.2. Contribution
- Consideration of voltage stability as a security constraint for HDNR;
- Development of an HDNR model with a focus on minimizing the cost for the GenCo;
- Analysis of the impact of WFs and ESSs on the results of the proposed model;
- Joint allocation of WFs and ESSs with HDNR;
- Analysis of the sensitivity of HDNR to voltage stability constraints and vice versa;
- Analysis of the security of the reconfiguration model when line contingency occurs in the system.
2. Concept of the Network Security Index
3. Problem Formulation
3.1. Objective Function
3.1.1. Power Flow Constraints at IOP
3.1.2. Power Flow Constraints at MLP
3.1.3. WF’s Capacity Limit
3.1.4. ESS Capacity
3.1.5. Topology Reconfiguration
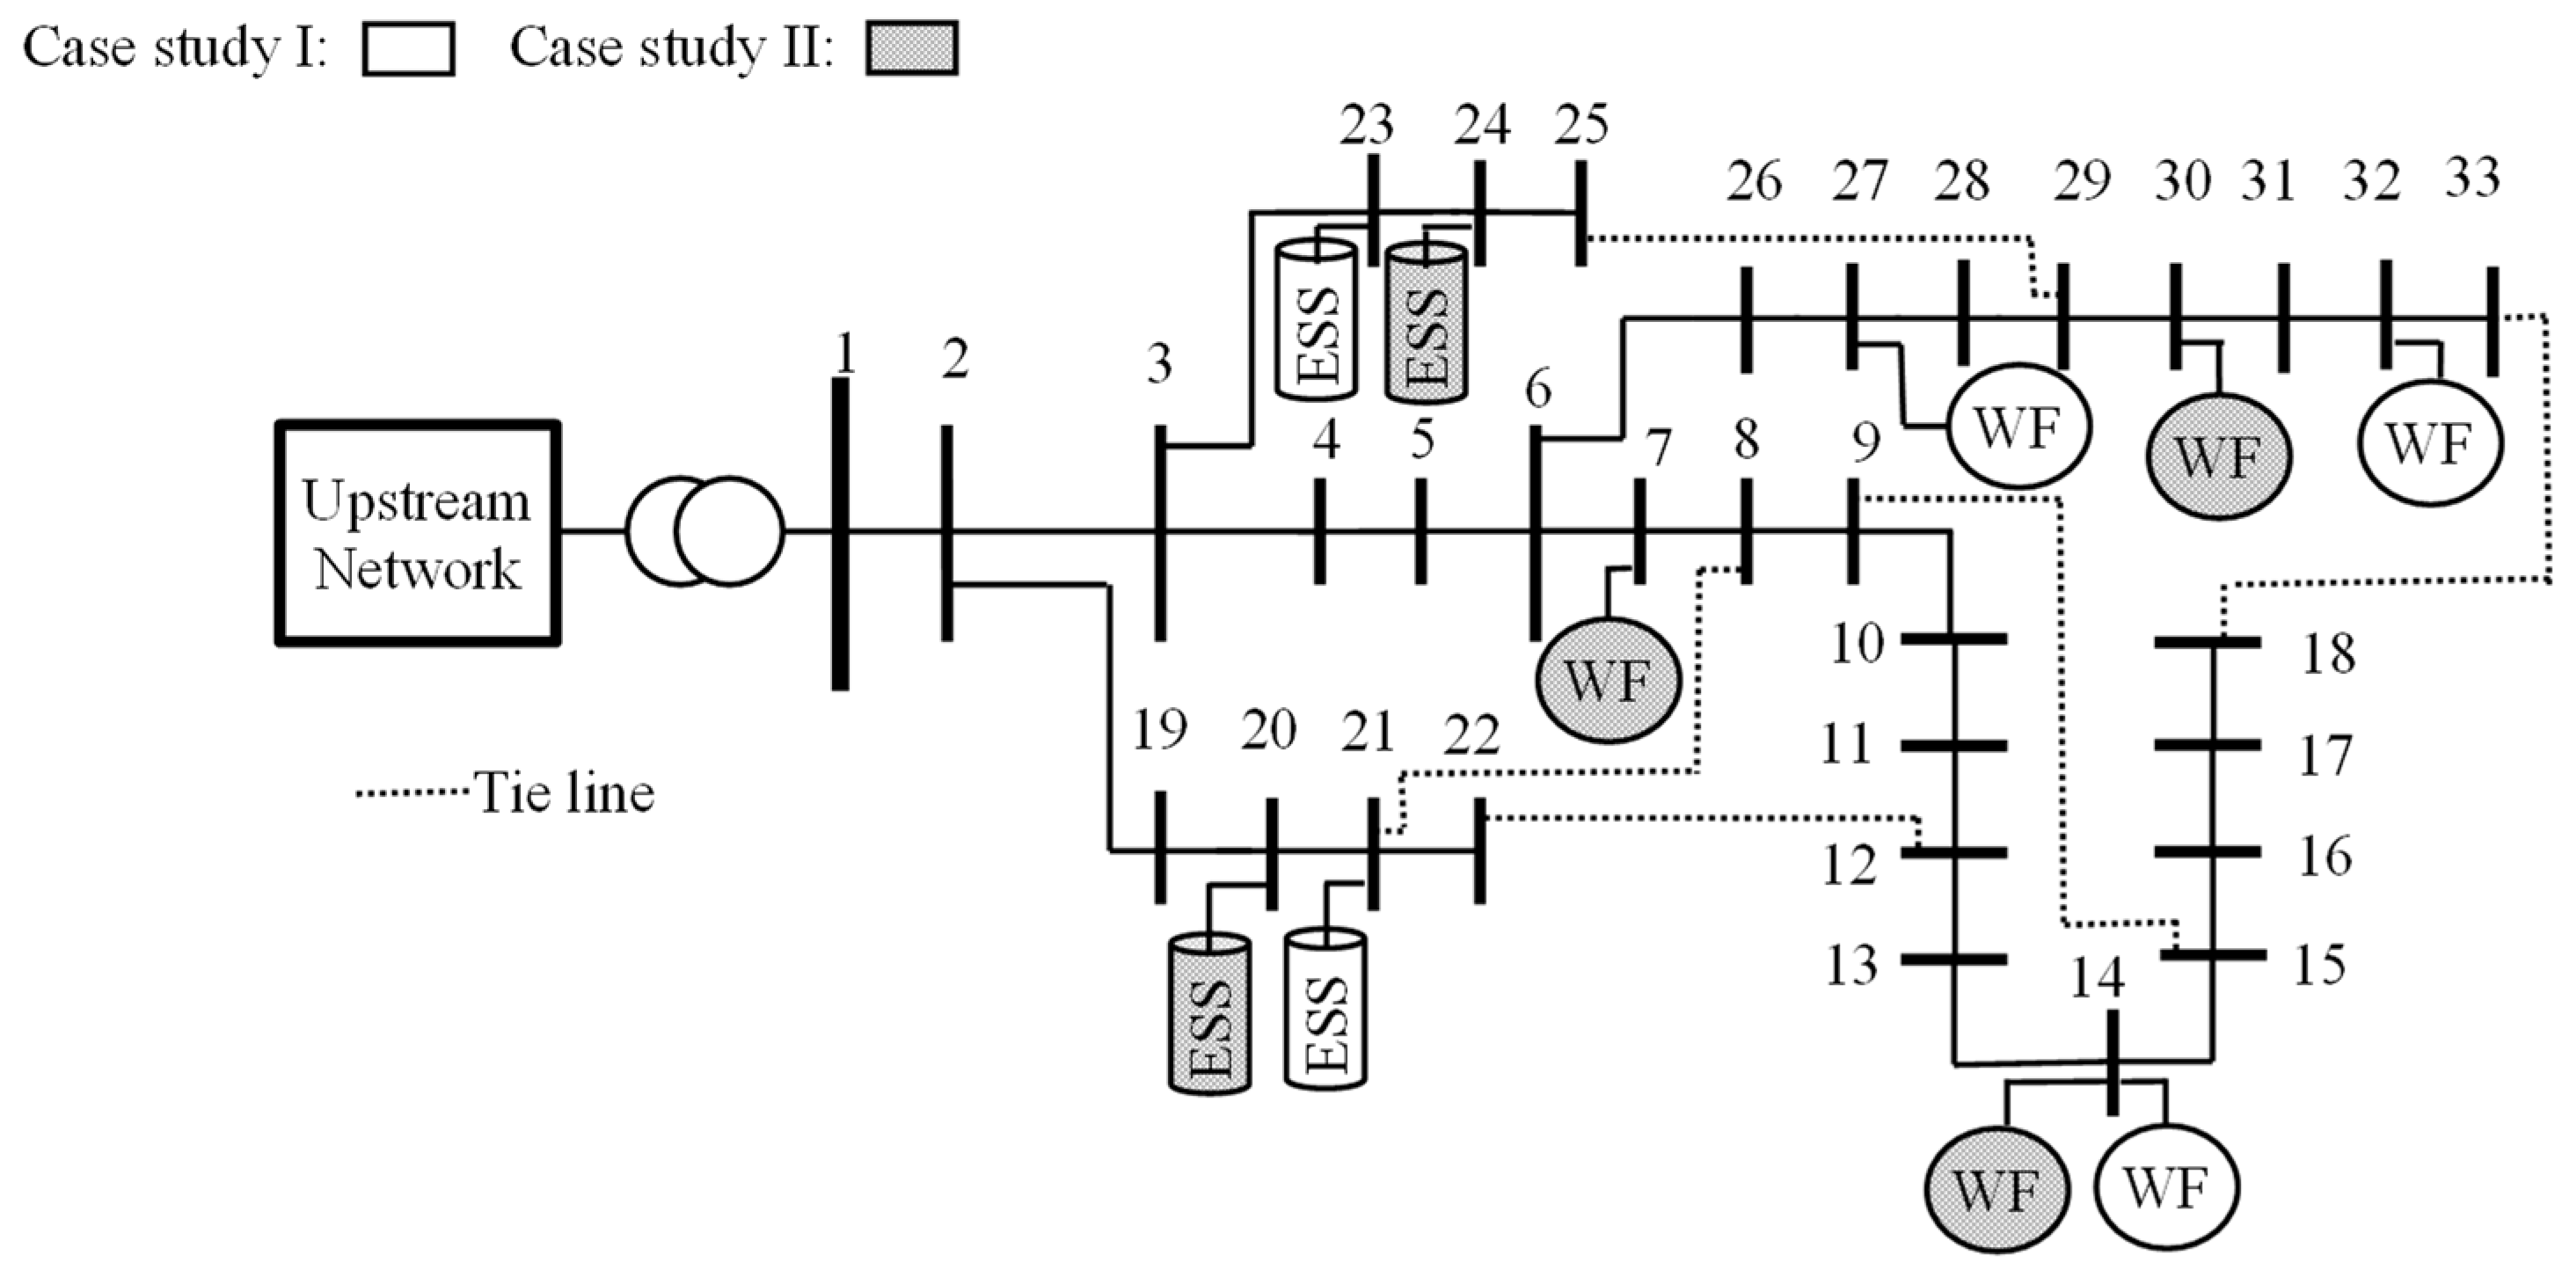
4. Simulation Parameters
5. Results and Discussion
5.1. Sensitivity Analysis
5.2. Contingency Analysis
6. Conclusions
Author Contributions
Funding
Data Availability Statement
Conflicts of Interest
Nomenclature
| Indices | |
| Index for system buses | |
| Index for transmission lines | |
| Index for times | |
| Sets | |
| Set of substations connecting the distribution network to the upstream networks | |
| Set of transmission lines | |
| Set of system buses | |
| Set of ESS installed buses | |
| Set of WF installed buses | |
| Set of times | |
| Variables and Parameters | |
| Active/reactive power injected from substation to bus i at time t at IOP (pu) | |
| Active/reactive power consumption of load connected to bus i at time t at IOP (pu) | |
| Active/reactive power injected from substation to bus i at time t at MLP (pu) | |
| Active/reactive power consumption of load connected to bus i at time t at MLP (pu) | |
| Active/reactive power flow that leaves node i toward node j at time t at IOP (pu) | |
| Active/reactive power flow that leaves node i toward node j at time t at MLP (pu) | |
| Binary variable for the line between buses i and j (1 = connected, 0 = disconnected) | |
| Binary variable for location of ESS installed at bus i (1 = installed, 0 = otherwise) | |
| Binary variable for location of WF installed at bus i (1 = installed, 0 = otherwise) | |
| Capacity factor of WF installed at bus i at time t | |
| Charging/discharging efficiencies of ESSs | |
| Charging/discharging decisions of ESSs (1 = allowed, 0 = not allowed) | |
| Charge/discharge power of ESS installed in bus i at time t (pu) | |
| Conductance/susceptance of line between buses i and j (pu) | |
| Current flow through line l at time t (pu) | |
| Desired loading margin (pu) | |
| Electricity price cost at time t (USD/MWh) | |
| Imaginary current flow component of branch between buses i and j at time t at IOP (pu) | |
| Imaginary current flow component of branch between buses i and j at time t at MLP (pu) | |
| Injected active/reactive power of WF installed in bus i into the grid at time t (pu) | |
| Lead/lag power factor of WFs | |
| Loading parameter (pu) | |
| Maximum/minimum active/reactive power of substation i (pu) | |
| Standard capacity of wind turbine installed at bus i (pu) | |
| Maximum current flow between buses i and j at IOP (pu) | |
| Maximum current flow between buses i and j at MLP (pu) | |
| Maximum/minimum SOC of ESS installed at bus i (pu) | |
| Maximum number of WFs that could be installed in the network | |
| Maximum number of ESSs that could be installed in the network | |
| Phase angle between buses i and j at time t at IOP | |
| Phase angle between buses i and j at time t at MLP | |
| Real current flow component of branch between buses i and j at time t at IOP (pu) | |
| Real current flow component of branch between buses i and j at time t at MLP (pu) | |
| Rate of load change at bus i | |
| Rate of change in active power of substation i | |
| Resistance of line l (pu) | |
| State of charge of ESS installed in bus i at time t (pu) | |
| Timeslot duration (h) | |
| Voltage magnitude of bus i at time t at IOP (pu) | |
| Voltage magnitude of bus i at time t at MLP (pu) | |
| Base apparent power (MVA) | |
| An integer variable for number of wind turbines in WF i | |
| Maximum number of wind turbines that could be installed in WF i | |
References
- Fankhauser, S.; Smith, S.M.; Allen, M.; Axelsson, K.; Hale, T.; Hepburn, C.; Kendall, J.M.; Khosla, R.; Lezaun, J.; Mitchell-Larson, E.; et al. The meaning of net zero and how to get it right. Nat. Clim. Chang. 2021, 12, 15–21. [Google Scholar] [CrossRef]
- Alahyari, A.; Pozo, D. Performance-based virtual power plant offering strategy incorporating hybrid uncertainty modeling and risk viewpoint. Electr. Power Syst. Res. 2021, 203, 107632. [Google Scholar] [CrossRef]
- Alahyari, A.; Pozo, D. Online Demand Response for End-User Loads. In Proceedings of the 2019 IEEE Milan PowerTech, Milan, Italy, 23–27 June 2019; pp. 1–6. [Google Scholar] [CrossRef]
- Nikkhah, S.; Sarantakos, I.; Zografou-Barredo, N.M.; Rabiee, A.; Allahham, A.; Giaouris, D. A Joint Risk-and Securi-ty-Constrained Control Framework for Real-Time Energy Scheduling of Islanded Microgrids. IEEE Trans. Smart Grid 2022, 13, 3354–3368. [Google Scholar] [CrossRef]
- Alahyari, A.; Ehsan, M.; Moghimi, M. Managing distributed energy resources (DERs) through virtual power plant tech-nology (VPP): A stochastic information-gap decision theory (IGDT) approach. Iran. J. Sci. Technol. Trans. Electr. Eng. 2020, 44, 279–291. [Google Scholar] [CrossRef]
- Global Wind Report 2022. Available online: https://gwec.net/global-wind-report-2022/ (accessed on 18 February 2023).
- Farrokhifar, M.; Aghdam, F.H.; Alahyari, A.; Monavari, A.; Safari, A. Optimal energy management and sizing of renew-able energy and battery systems in residential sectors via a stochastic MILP model. Electr. Power Syst. Res. 2020, 187, 106483. [Google Scholar] [CrossRef]
- Mousavizadeh, S.; Alahyari, A.; Bolandi, T.G.; Haghifam, M.; Siano, P. A novel resource allocation model based on the modularity concept for resiliency enhancement in electric distribution networks. Int. J. Energy Res. 2021, 9, 13471–13488. [Google Scholar] [CrossRef]
- Rao, R.S.; Ravindra, K.; Satish, K.; Narasimham, S. Power loss minimization in distribution system using network reconfiguration in the presence of distributed generation. IEEE Trans. Power Syst. 2013, 28, 317–325. [Google Scholar] [CrossRef]
- Franco, J.F.; Rider, M.J.; Lavorato, M.; Romero, R. A mixed-integer LP model for the reconfiguration of radial electric distribution systems considering distributed generation. Electr. Power Syst. Res. 2013, 97, 51–60. [Google Scholar] [CrossRef]
- Asrari, A.; Wu, T.; Lotfifard, S. The Impacts of Distributed Energy Sources on Distribution Network Reconfiguration. IEEE Trans. Energy Convers. 2016, 31, 606–613. [Google Scholar] [CrossRef]
- Kavousi-Fard, A.; Akbari-Zadeh, M.-R. Reliability enhancement using optimal distribution feeder reconfiguration. Neurocomputing 2013, 106, 1–11. [Google Scholar] [CrossRef]
- Amanulla, B.; Chakrabarti, S.; Singh, S.N. Reconfiguration of Power Distribution Systems Considering Reliability and Power Loss. IEEE Trans. Power Deliv. 2012, 27, 918–926. [Google Scholar] [CrossRef]
- Kavousi-Fard, A.; Niknam, T. Optimal distribution feeder reconfiguration for reliability improvement considering uncertainty. IEEE Trans. Power Deliv. 2014, 29, 1344–1353. [Google Scholar] [CrossRef]
- Mazza, A.; Chicco, G.; Russo, A. Optimal multi-objective distribution system reconfiguration with multi criteria decision making-based solution ranking and enhanced genetic operators. Int. J. Electr. Power Energy Syst. 2014, 54, 255–267. [Google Scholar] [CrossRef]
- Jeon, Y.-J.; Kim, J.-C.; Kim, J.-O.; Shin, J.-R.; Lee, K. An efficient simulated annealing algorithm for network reconfiguration in large-scale distribution systems. IEEE Trans. Power Deliv. 2002, 17, 1070–1078. [Google Scholar] [CrossRef]
- Alonso, F.R.; Oliveira, D.Q.; de Souza, A.C.Z. Artificial Immune Systems Optimization Approach for Multiobjective Distribution System Reconfiguration. IEEE Trans. Power Syst. 2015, 30, 840–847. [Google Scholar] [CrossRef]
- Narimani, M.R.; Vahed, A.A.; Azizipanah-Abarghooee, R.; Javidsharifi, M. Enhanced gravitational search algorithm for multi-objective distribution feeder reconfiguration considering reliability, loss and operational cost. IET Gener. Transm. Distrib. 2014, 8, 55–69. [Google Scholar] [CrossRef]
- Nick, M.; Cherkaoui, R.; Paolone, M. Optimal Planning of Distributed Energy Storage Systems in Active Distribution Networks Embedding Grid Reconfiguration. IEEE Trans. Power Syst. 2017, 33, 1577–1590. [Google Scholar] [CrossRef]
- Bai, L.; Jiang, T.; Li, F.; Chen, H.; Li, X. Distributed energy storage planning in soft open point based active distribution networks incorporating network reconfiguration and DG reactive power capability. Appl. Energy 2018, 210, 1082–1091. [Google Scholar] [CrossRef]
- Santos, S.F.; Fitiwi, D.Z.; Cruz, M.R.; Cabrita, C.M.; Catalão, J.P. Impacts of optimal energy storage deployment and network reconfiguration on renewable integration level in distribution systems. Appl. Energy 2017, 185, 44–55. [Google Scholar] [CrossRef]
- Nikkhah, S.; Rabiee, A. Optimal wind power generation investment, considering voltage stability of power systems. Renew. Energy 2018, 115, 308–325. [Google Scholar] [CrossRef]
- Savier, J.S.; Das, D. Impact of Network Reconfiguration on Loss Allocation of Radial Distribution Systems. IEEE Trans. Power Deliv. 2007, 22, 2473–2480. [Google Scholar] [CrossRef]
- Shuaib, Y.M.; Kalavathi, M.S.; Rajan, C.C.A. Optimal Reconfiguration in Radial Distribution System Using Gravitational Search Algorithm. Electr. Power Compon. Syst. 2014, 42, 703–715. [Google Scholar] [CrossRef]
- Mohseni-Bonab, S.M.; Rabiee, A.; Mohammadi-Ivatloo, B. Voltage stability constrained multi-objective optimal reactive power dispatch under load and wind power uncertainties: A stochastic approach. Renew. Energy 2016, 85, 598–609. [Google Scholar] [CrossRef]
- Nikkhah, S.; Rabiee, A.; Soroudi, A.; Allahham, A.; Taylor, P.C.; Giaouris, D. Distributed flexibility to maintain security margin through decentralised TSO–DSO coordination. Int. J. Electr. Power Energy Syst. 2023, 146, 108735. [Google Scholar] [CrossRef]
- Mousavizadeh, S.; Alahyari, A.; Ghodsinya, S.R.M.; Haghifam, M.-R. Incorporating microgrids coupling with utilization of flexible switching to enhance self-healing ability of electric distribution systems. Prot. Control Mod. Power Syst. 2021, 6, 24. [Google Scholar] [CrossRef]
- Ameli, A.; Bahrami, S.; Khazaeli, F.; Haghifam, M.-R. A multiobjective particle swarm optimization for sizing and placement of DGs from DG owner’s and distribution company’s viewpoints. IEEE Trans. Power Deliv. 2014, 29, 1831–1840. [Google Scholar] [CrossRef]
- Baran, M.E.; Wu, F.F. Network reconfiguration in distribution systems for loss reduction and load balancing. IEEE Trans. Power Deliv. 1989, 4, 1401–1407. [Google Scholar] [CrossRef]
- Brooke, A.; Kendrick, D.; Meeraus, A.; Raman, R.; Rosenthal, R. GAMS: The Solver Manuals; GAMS Development Corporation: Washington, DC, USA, 1998. [Google Scholar]
- Nikkhah, S.; Rabiee, A. A Joint Energy Storage Systems and Wind Farms Long-Term Planning Model Considering Voltage Stability. In Operation, Planning, and Analysis of Energy Storage Systems in Smart Energy Hubs; Mohammadi-Ivatloo, B., Jabari, F., Eds.; Springer: Berlin, Germany, 2018; pp. 337–363. [Google Scholar]
- Nikkhah, S.; Nasr, M.-A.; Rabiee, A. A Stochastic Voltage Stability Constrained EMS for Isolated Microgrids in the Presence of PEVs Using a Coordinated UC-OPF Framework. IEEE Trans. Ind. Electron. 2020, 68, 4046–4055. [Google Scholar] [CrossRef]


| Ref. | Objective Function | DER | Line Contingency | HDNR | Security | Optimal Allocation | |||
|---|---|---|---|---|---|---|---|---|---|
| Technical | Economic | DG | ESS | DG | ESS | ||||
| [6] | ✓ | ||||||||
| [8] | ✓ | ✓ | |||||||
| [9] | ✓ | ✓ | |||||||
| [10] | ✓ | ✓ | |||||||
| [11] | ✓ | ✓ | |||||||
| [12] | ✓ | ✓ | |||||||
| [13] | ✓ | ✓ | |||||||
| [14] | ✓ | ✓ | |||||||
| [15] | ✓ | ||||||||
| [16] | ✓ | ||||||||
| [17] | ✓ | ✓ | |||||||
| [18] | ✓ | ✓ | |||||||
| [19] | ✓ | ✓ | ✓ | ✓ | |||||
| [20] | ✓ | ✓ | ✓ | ✓ | |||||
| [21] | ✓ | ✓ | ✓ | ✓ | ✓ | ||||
| [23] | ✓ | ||||||||
| [24] | ✓ | ||||||||
| This study | ✓ | ✓ | ✓ | ✓ | ✓ | ✓ | ✓ | ✓ | |
| 1 | 2 | 3 | 4 | 5 | 6 | 7 | 8 | 9 | 10 | 11 | 12 |
|---|---|---|---|---|---|---|---|---|---|---|---|
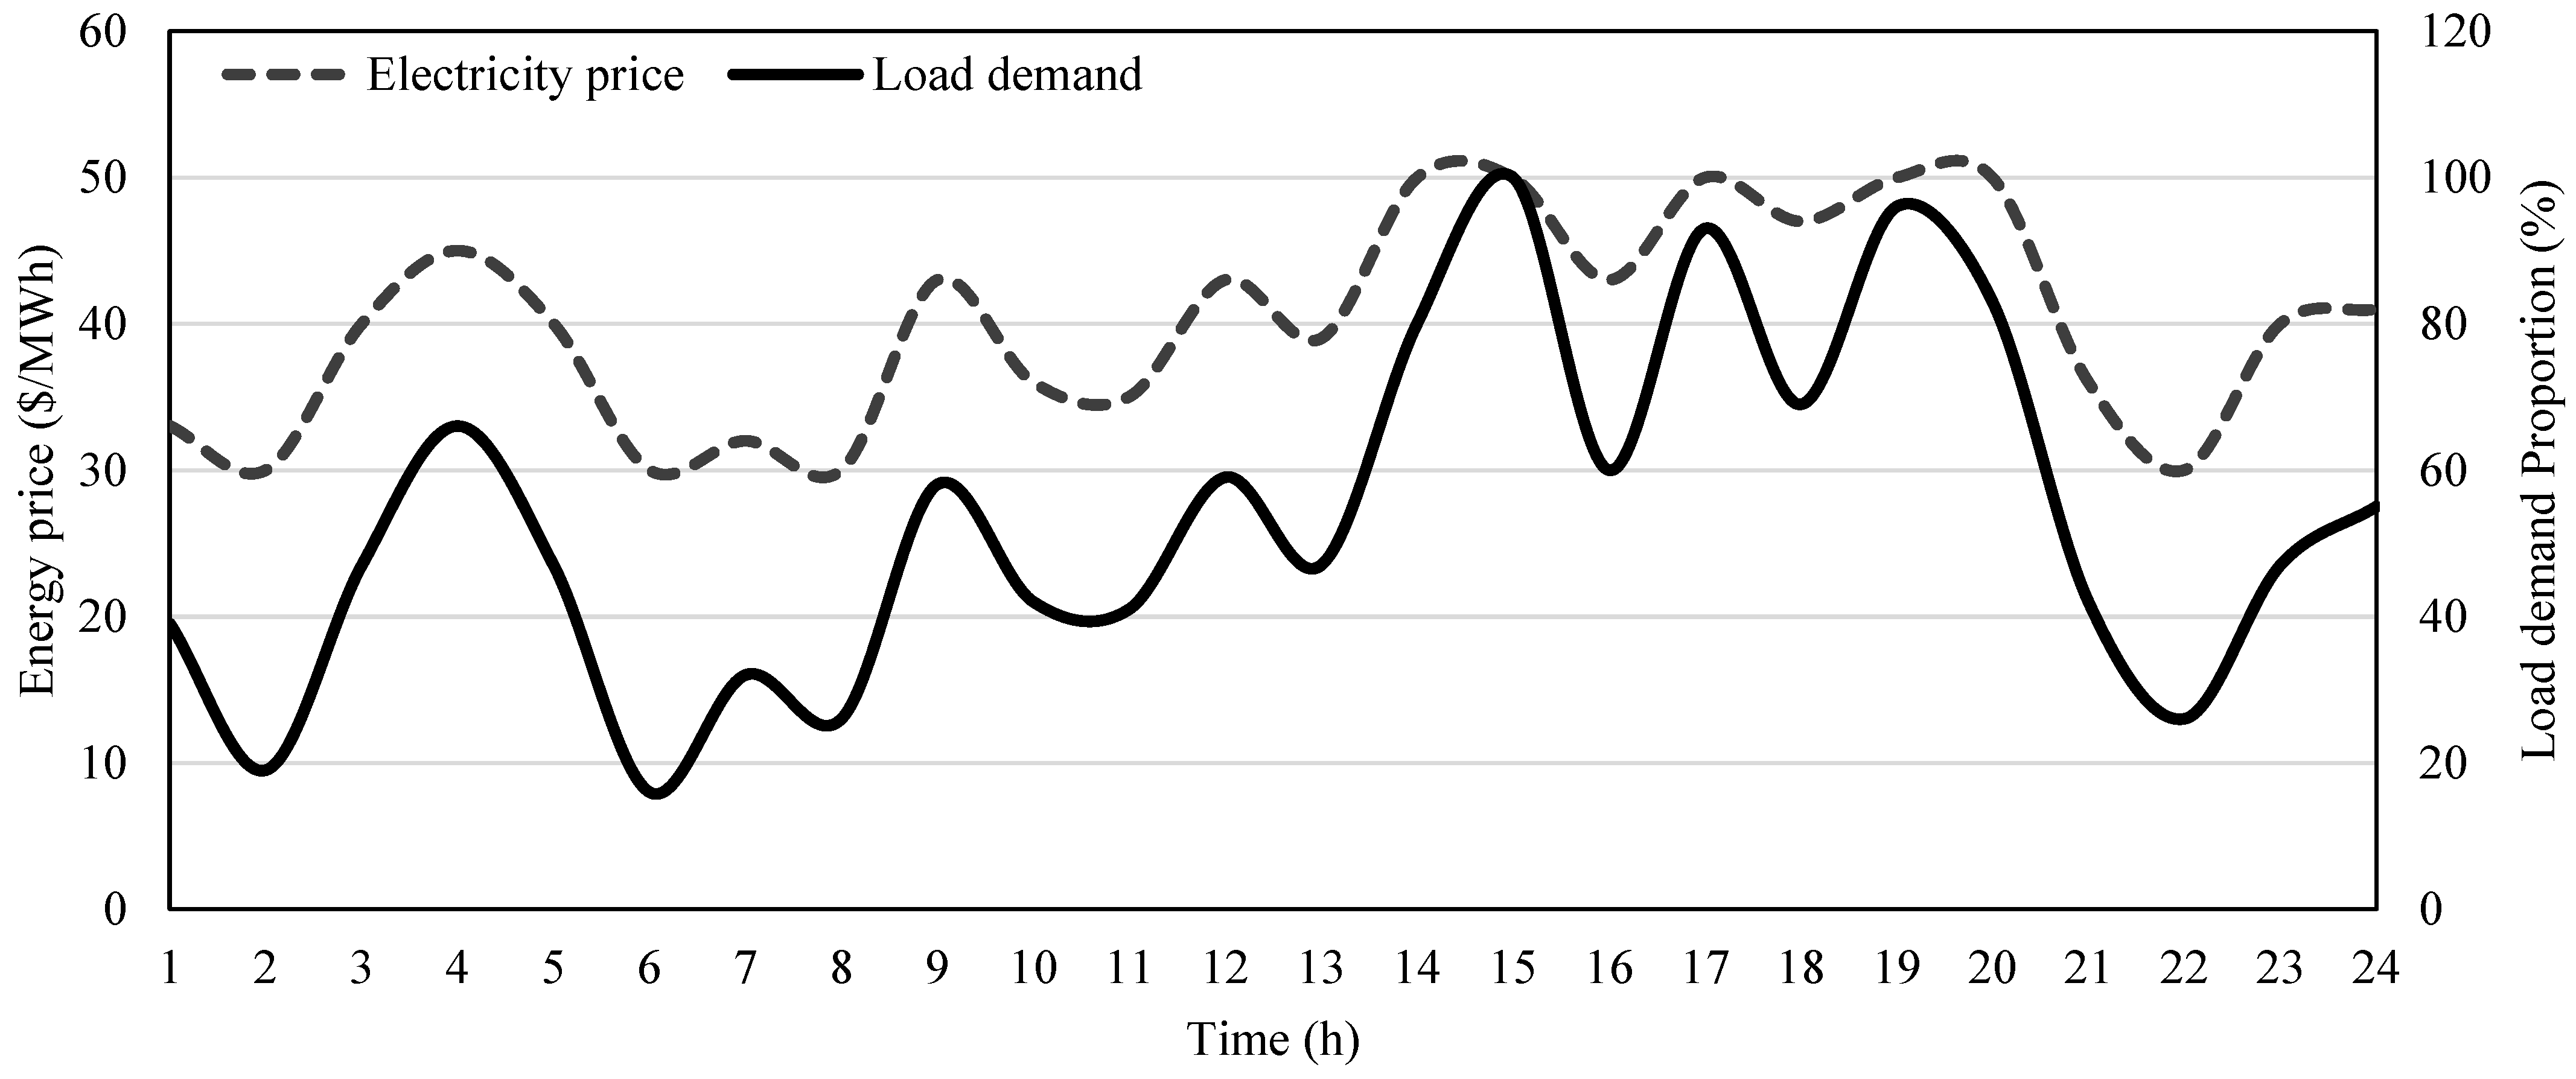
| 0.08 | 0.09 | 0.12 | 0.26 | 0.36 | 0.59 | 0.65 | 0.59 | 0.49 | 0.55 | 0.77 | 0.72 |
| 13 | 14 | 15 | 16 | 17 | 18 | 19 | 20 | 21 | 22 | 23 | 24 |
| 0.83 | 0.92 | 0.97 | 1.00 | 0.83 | 0.65 | 0.65 | 0.56 | 0.57 | 0.56 | 0.72 | 0.84 |
| 0.20 | 0.20 | 0.88 | 0.88 | 1.00 | 0.10 |
| Time (h) | Potentially Opened Lines | |||
|---|---|---|---|---|
| Without LM Constraints | With LM Constraints (λdes = 0.10) | With LM Constraints (λdes = 0.15) | With LM Constraints (λdes = 0.20) | |
| 1 | L4-5, L7-8, L9-10, L13-14, L32-33 | L6-26, L9-15, L10-11, L19-20, L32-33 | L10-11, L13-14, L14-15, L17-18, L26-27 | L2-3, L10-11, L14-15, L16-17, L25-29 |
| 2 | L9-10, L9-15, L13-14, L14-15, L24-25 | L7-8, L10-11, L13-14, L14-15, L16-17 | L3-4, L9-10, L12-13, L14-15, L31-32 | L4-5, L9-15, L11-12, L12-13, L27-28 |
| 3 | L6-7, L10-11, L14-15, L21-22, L30-31 | L6-26, L9-10, L9-15, L31-32, L32-33 | L3-4, L11-12, L13-14, L31-32, L32-33 | L4-5, L6-7, L9-15, L10-11, L31-32 |
| 4 | L6-7, L9-10, L14-15, L21-22, L31-32 | L3-4, L9-10, L12-22, L18-33, L31-32 | L8-21, L10-11, L27-28, L31-32, L32-33 | L8-9, L10-11, L12-22, L31-32, L32-33 |
| 5 | L8-21, L12-22, L13-14, L15-16, L23-24 | L3-23, L8-9, L8-21, L12-13, L17-18 | L1-2, L2-19, L3-4, L17-18, L21-22 | L4-5, L6-26, L8-21, L9-15, L13-14 |
| 6 | L3-23, L4-5, L10-11, L15-16, L30-31 | L5-6, L6-7, L10-11, L16-17, L24-25 | L8-9, L9-15, L21-22, L24-25, L32-33 | L1-2, L5-6, L9-15, L12-22, L18-33 |
| 7 | L12-22, L16-17, L20-21, L26-27, L30-31 | L4-5, L10-11, L16-17, L21-22, L30-31 | L1-2, L9-10, L9-15, L15-16, L24-25 | L1-2, L4-5, L6-7, L11-12, L18-33 |
| 8 | L1-2, L3-23, L12-22, L16-17, L20-21, | L2-19, L3-23, L4-5, L15-16, L30-31 | L3-4, L9-10, L9-15, L15-16, L24-25 | L1-2, L2-19, L3-4, L11-12, L32-33 |
| 9 | L3-23, L6-7, L12-22, L13-14, L16-17 | L1-2, L3-4, L6-26, L9-10, L15-16 | L3-4, L9-15, L17-18, L21-22, L31-32 | L2-3, L4-5, L10-11, L12-13, L18-33 |
| 10 | L8-21, L9-15, L11-12, L17-18, L21-22 | L7-8, L8-21, L10-11, L16-17, L6-7 | L1-2, L6-26, L10-11, L20-21, L21-22 | L2-3, L6-7, L10-11, L19-20, L32-33 |
| 11 | L5-6, L7-8, L12-22, L20-21, L23-24 | L10-11, L13-14, L14-15, L20-21, L25-29 | L3-23, L10-11, L18-33, L21-22, L31-32 | L1-2, L2-19, L4-5, L9-10, L18-33 |
| 12 | L6-26, L8-21, L12-13, L12-22, L16-17 | L2-3, L11-12, L12-13, L14-15, L15-16 | L2-19, L3-23, L4-5, L9-10, L27-28 | L3-23, L6-7, L8-21, L20-21, L32-33 |
| 13 | L5-6, L9-15, L12-22, L16-17, L23-24 | L3-23, L7-8, L8-21, L16-17, L30-31 | L3-4, L9-10, L9-15, L13-14, L17-18 | L4-5, L6-26, L11-12, L12-13, L23-24 |
| 14 | L9-15, L10-11, L12-13, L15-16, L23-24 | L4-5, L6-7, L9-10, L12-22, L16-17 | L1-2, L4-5, L9-10, L19-20, L21-22 | L4-5, L6-7, L10-11, L13-14, L25-29 |
| 15 | L6-7, L6-26, L8-21, L20-21, L23-24 | L3-4, L19-20, L21-22, L30-31, L32-33 | L4-5, L8-9, L11-12, L31-32, L32-33 | L5-6, L6-7, L11-12, L13-14, L23-24 |
| 16 | L5-6, L6-7, L13-14, L16-17, L20-21 | L6-7, L6-26, L10-11, L16-17, L21-22 | L3-23, L8-21, L9-15, L21-22, L32-33 | L2-19, L3-23, L4-5, L8-9, L18-33 |
| 17 | L6-26, L8-9, L12-22, L13-14, L16-17 | L6-26, L8-21, L9-10, L21-22, L23-24 | L4-5, L9-10, L20-21, L25-29, L31-32 | L1-2, L4-5, L11-12, L18-33, L19-20 |
| 18 | L6-26, L11-12, L20-21, L21-22, L23-24 | L7-8, L12-22, L18-33, L24-25, L31-32 | L3-23, L8-9, L8-21, L11-12, L16-17 | L1-2, L2-19, L12-13, L21-22, L32-33 |
| 19 | L3-4, L9-10, L12-22, L14-15, L15-16 | L3-23, L9-10, L17-18, L21-22, L30-31 | L5-6, L8-9, L10-11, L18-33, L30-31 | L2-3, L10-11, L16-17, L18-33, L26-27 |
| 20 | L3-23, L9-15, L10-11, L16-17, L21-22 | L3-23, L4-5, L11-12, L17-18, L30-31 | L7-8, L9-15, L12-22, L16-17, L23-24 | L4-5, L7-8, L8-9, L11-12, L13-14 |
| 21 | L3-23, L7-8, L12-22, L16-17, L30-31 | L4-5, L9-10, L24-25, L31-32, L32-33 | L3-23, L5-6, L9-10, L9-15, L18-33 | L1-2, L3-4, L9-10, L18-33, L31-32 |
| 22 | L8-9, L12-22, L13-14, L16-17, L20-21 | L7-8, L8-21, L10-11, L13-14, L16-17 | L8-9, L12-13, L20-21, L24-25, L32-33 | L2-19, L3-23, L4-5, L18-33, L21-22 |
| 23 | L3-23, L6-7, L6-26, L8-9, L16-17 | L6-26, L8-9, L11-12, L16-17, L20-21 | L2-19, L4-5, L8-9, L24-25, L9-15 | L4-5, L18-33, L20-21, L21-22, L30-31 |
| 24 | L3-23, L4-5, L7-8, L8-21, L13-14 | L7-8, L8-9, L11-12, L14-15, L24-25 | L1-2, L4-5, L10-11, L17-18, L21-22 | L1-2, L9-10, L12-13, L18-33, L31-32 |
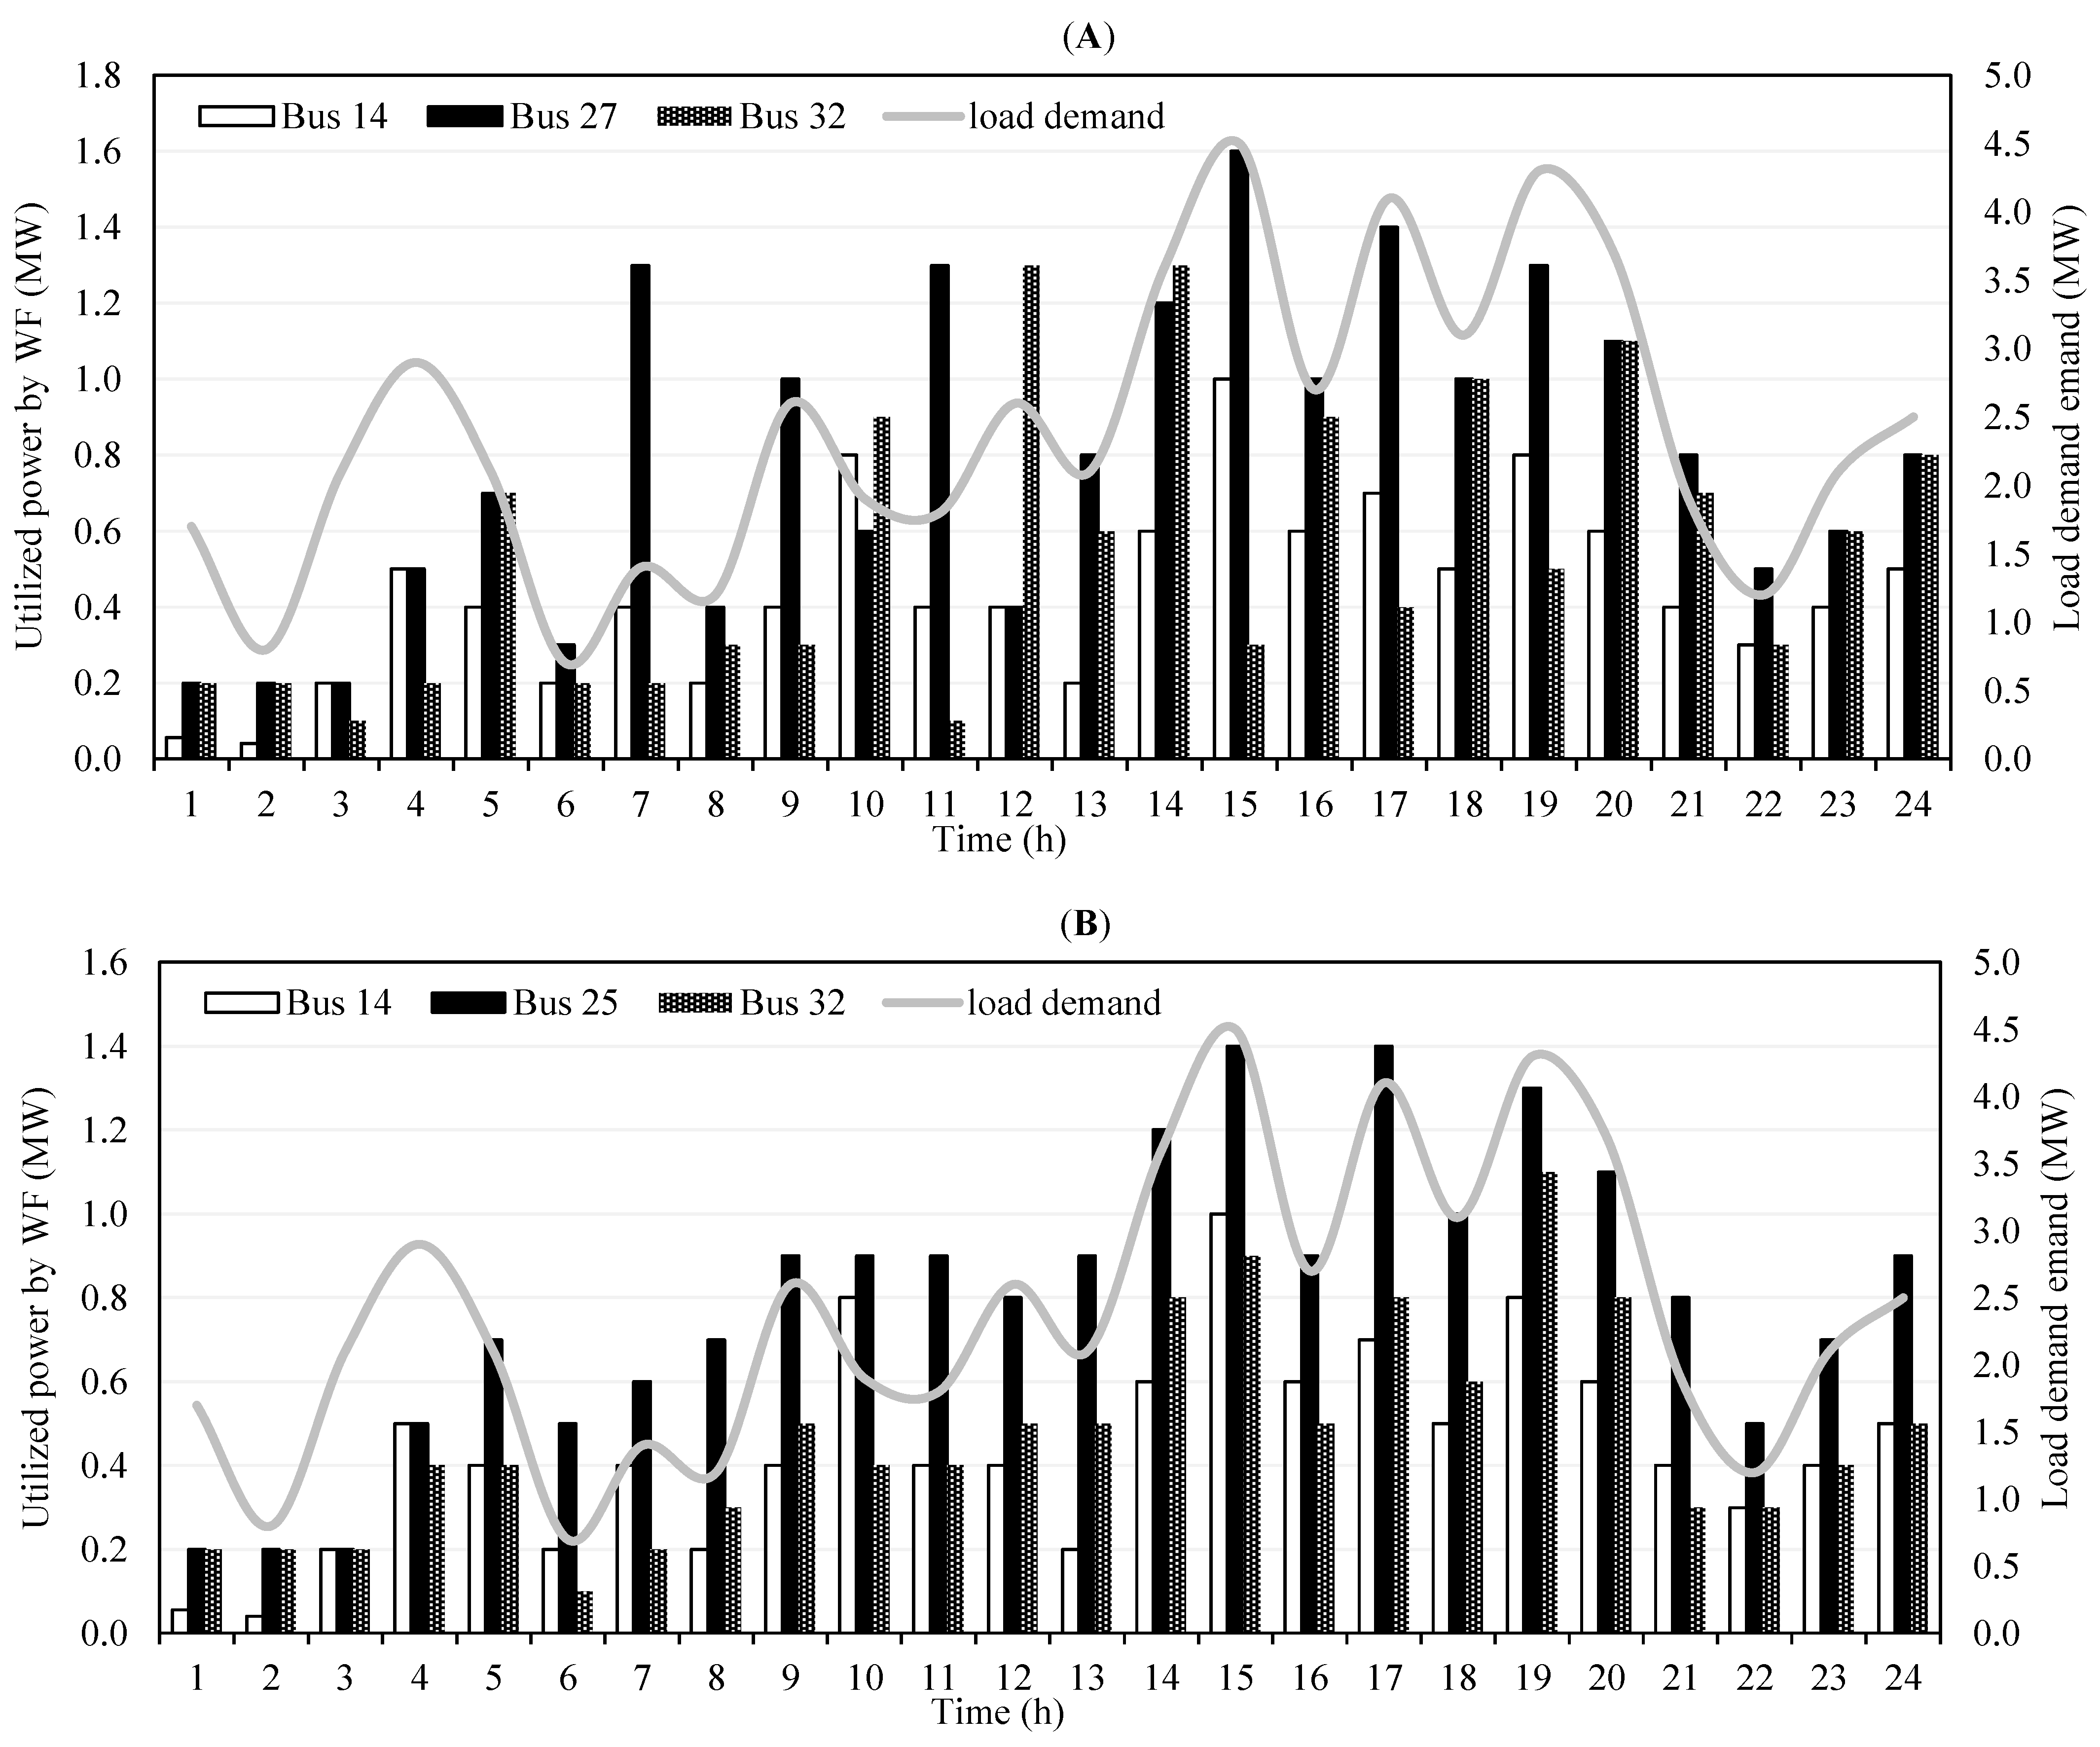
| Model State | WF (Bus No.) | Number of Wind Turbines | Cumulative Capacity (MW) | ESS (Bus No.) |
|---|---|---|---|---|
| (a) W/O LM constraints | ||||
| 14 | 5 | 1.25 | 7, 9 | |
| 25 | 6 | 1.5 | ||
| 32 | 5 | 1.25 | ||
| (b) W LM constraints | ||||
| (λdes = 0.10) | 14 | 6 | 1.5 | 5, 30 |
| 30 | 7 | 1.6 | ||
| 32 | 2 | 0.5 | ||
| (c) W LM constraints | ||||
| (λdes = 0.15) | 14 | 4 | 1 | 21, 23 |
| 27 | 7 | 1.75 | ||
| 32 | 6 | 1.5 | ||
| (d) W LM constraints | ||||
| (λdes = 0.20) | 18 | 8 | 2 | 9, 25 |
| 25 | 6 | 1.5 | ||
| 32 | 2 | 0.5 |
Disclaimer/Publisher’s Note: The statements, opinions and data contained in all publications are solely those of the individual author(s) and contributor(s) and not of MDPI and/or the editor(s). MDPI and/or the editor(s) disclaim responsibility for any injury to people or property resulting from any ideas, methods, instructions or products referred to in the content. |
© 2023 by the authors. Licensee MDPI, Basel, Switzerland. This article is an open access article distributed under the terms and conditions of the Creative Commons Attribution (CC BY) license (https://creativecommons.org/licenses/by/4.0/).
Share and Cite
Nikkhah, S.; Alahyari, A.; Allahham, A.; Alawasa, K. Optimal Integration of Hybrid Energy Systems: A Security-Constrained Network Topology Reconfiguration. Energies 2023, 16, 2780. https://doi.org/10.3390/en16062780
Nikkhah S, Alahyari A, Allahham A, Alawasa K. Optimal Integration of Hybrid Energy Systems: A Security-Constrained Network Topology Reconfiguration. Energies. 2023; 16(6):2780. https://doi.org/10.3390/en16062780
Chicago/Turabian StyleNikkhah, Saman, Arman Alahyari, Adib Allahham, and Khaled Alawasa. 2023. "Optimal Integration of Hybrid Energy Systems: A Security-Constrained Network Topology Reconfiguration" Energies 16, no. 6: 2780. https://doi.org/10.3390/en16062780
APA StyleNikkhah, S., Alahyari, A., Allahham, A., & Alawasa, K. (2023). Optimal Integration of Hybrid Energy Systems: A Security-Constrained Network Topology Reconfiguration. Energies, 16(6), 2780. https://doi.org/10.3390/en16062780