Article

Evaluating Long-Term Performance of a Residential Ground-Source Heat Pump System under Climate Change in Cold and Warm Cities of Japan

1
Faculty of Geosciences and Civil Engineering, Kanazawa University, Kanazawa 920-1192, Japan
2
Daiwa House Industry Co., Ltd., Tokyo 102-8112, Japan
3
Faculty of Engineering, Hokkaido University, Sapporo 060-8628, Japan
*
Author to whom correspondence should be addressed.
Energies 2023, 16(6), 2742; https://doi.org/10.3390/en16062742
Submission received: 16 February 2023 / Revised: 9 March 2023 / Accepted: 9 March 2023 / Published: 15 March 2023
(This article belongs to the Section H: Geo-Energy)

Abstract

:
A residential ground-source heat pump system often requires a long payback time to recover the capital cost. Long-term uncertainty in such a system’s performance increases as the climate changes. This study compares 20-years hourly heating/cooling demands of a typical residence in the present (2000–2020) and in the future (2076–2095) for two locations in Japan. This study also calculated soil temperatures as heat sources through 1D heat-transfer simulation based on the A1B climate scenario in the Intergovernmental Panel on Climate Change’s Special Report. System performance and simple payback times were compared in one cold and one warm city in Japan (Sapporo and Tokyo, respectively). Soil temperatures at a middle depth of a borehole heat exchanger were predicted to increase in the future by ~1 °C, with insignificant effects on a borehole heat exchanger. Seasonal performance factors increased in Sapporo because thermal demands would be kept even in the future, but decreased in Tokyo, which has a higher ratio of the energy used in operating the system in cooling mode compared with its small heating demand. The simple payback time was estimated at 16.2 and >20 years in Sapporo and Tokyo, respectively, both in the present and future, with the constant energy prices. If oil and gas prices doubled, the payback time would be halved in Sapporo to 8.4 years but remain around 20 years or more in Tokyo.

1. Introduction

The International Energy Agency has recently reported that heat pumps and renewable energy for heating and cooling buildings are expected to increase in order to achieve sustainable development goals [1]. The report also described that a ground-source heat pump (GSHP) system is highly efficient for various thermal uses, as the underground heat source has a more stable temperature than the outdoor air used for an air-source heat pump (ASHP) system [2]. The efficiency contributes to a GSHP system having reduced CO2 emissions relative to a conventional oil/gas boiler [3]. Therefore, GSHP systems have a growing market across the world, especially in economically advanced countries such as the USA, China, and European countries with a tradition of promoting them (e.g., Germany, Switzerland, and Sweden) [4]. Other countries have also seen increasing numbers of systems, including Canada and Turkey. However, growth remains limited in other countries, such as Japan, which had fewer than 3000 systems in 2019 [5].
GSHP systems for a residence with a floor area up to several hundred square meters consists of a small heat pump with an output power of up to 10 kW, one or more ground heat exchangers (GHEs), and output heating/cooling devices, such as a fan coil unit. Although there are various types of GHEs developed in recent decades [2], borehole heat exchangers (BHE) are the most common to obtain thermal energy from the underground by circulating heat-transfer fluids such as antifreeze brine in a U-tube installed in a borehole with a depth of several tens to over 100 m. Construction of BHEs sometimes costs more than other GHEs due to drilling in deep depths but are suitable in dense urban settings where land area is limited. The energy-saving and environmental advantages of GSHP systems in Japan were reported and studied in Japan [6,7,8,9,10].
GSHP systems are available for various thermal uses, such as heating/cooling for residences and commercial buildings. Although residences have smaller floor area and less thermal demands than commercial buildings, their total potential reduction of CO2 emission is more significant, especially in Japan [11]. The main problem with these systems is the high capital cost of installing the BHE, which is exacerbated in countries with a small market for GSHP systems. In Japan, for example, a 10 kW GSHP-based system costs ~3.8 million JPY, ~1.5 times higher than the 2.5 million JPY equivalent in the US [12]. One reason for the relatively high costs in Japan is that it is time-consuming to install BHE in unconsolidated formations, which are seen commonly in urbanized plains and basins of the country. Unconsolidated sediments have a lower effective thermal conductivity than consolidated rocks, resulting in longer and more BHEs required in a GSHP system. Another reason is the wide change of thermal demands in the land stretching in the N-S direction from 24° N to 45° N. Currently, GSHP systems are used mainly in northern areas with high heating demands. Some efficient systems in a hybrid concept with shallow geothermal and other thermal sources were proposed in southern areas with heating and cooling demands [13,14].
The efficiency of GSHP systems reduces operating costs such as monthly electricity, oil, or gas consumption. The cost-effectiveness is often discussed in terms of the payback time required for reduced operating costs to balance the capital cost. Domestic properties often have longer payback times (e.g., over ten years [15]) than commercial buildings because of their small thermal demand for saving. The payback time of each GSHP system depends on its energy-saving performance relative to a conventional system, which in turn varies with time depending on various factors such as thermal load, facility specifications, and underground conditions [16]. Although simulation methodologies (including some commercial tools) have been developed for evaluating the performance, and hence payback time, of the GSHP system [17,18], it remains problematic in practice to quantify the factors necessary for the simulation, especially given the need to account for their long-term variation. Performance evaluation becomes increasingly uncertain owing to ongoing climate change, as rising outdoor temperatures will alter thermal demands [19,20]. Soil temperatures are also increasing as heat transfers from the air and ground surface to deeper underground [21]. Increasing soil temperatures in the current century have been attributed to human activity [22]. Regional studies have also analyzed increasing soil temperatures in different countries [23,24].
Previous studies have modeled performances of residential GSHP systems under future conditions of increased outdoor temperatures due to climate change. Kharseh et al. [25] calculated the present and future thermal loads of residential GSHP systems for a floor area of 144 m2 in Stockholm, Istanbul, and Doha. They used the A1B climate scenario of the Intergovernmental Panel on Climate Change (IPCC)’s Special Report on Emissions Scenarios (SRES). The change in annual energy consumption varied between −8.5% for the cold city to 18.7% for the hot city under an assumption of negligible changes in ground temperature. Shen et al. [26] calculated future soil temperatures (for 2040–2069) in four climate zones of the USA using an analytical method for climate scenarios A2 and A1P1 in the report. They also simulated GSHP operation for residences, finding slightly increased driving energy in all four locations. These studies indicated that the future performance under climate change would vary in different cities of individual climates. In addition, the payback time is also not only dependent on the performance but also on the economic scenarios of future changes in electricity and oil/gas prices. However, previous studies evaluating the economic advantage performance of GSHP systems in the future remain limited. Therefore, performance and cost-effectiveness must be modeled for specific locations, doing so for countries such as Japan would help popularize GSHP systems and increase their market.
This study aims to evaluate the operating performances of residential GSHP systems in the future under climate change considering all engineering factors in climatology, geology, and building environments, only some of which were in the previous studies above. This study conducted system’s energy performance and simple payback time considering the variations of outdoor and soil temperatures due to climate change. Performances for 20 years were considered to evaluate the simple payback times, both at present (2000–2020) and in the future (2076–2095). The residential systems were in two Japanese cities of different climates: Sapporo in a cold climate and Tokyo in a warm climate. This study used hourly outdoor temperatures to estimate thermal loads, whereas previous studies used monthly data. The future analysis used hourly climate projections. Hourly weather data effectively represented demand peaks, which more greatly affected system performance than constant pulses within each day as in the previous studies. This study also calculated the daily ground temperatures (the heat source for the GSHP) through 1D vertical numerical simulation of heat transfer considering heat and water budgets on the subsurface in order to obtain more reasonable predictions than analytic solutions. Seasonal performance factor (SPF) and the simple payback time (PT) were evaluated for three different scenarios of energy pricing. The impact of climate change and the cost-effectiveness of the system in two Japanese cities are discussed.

2. Data and Methods

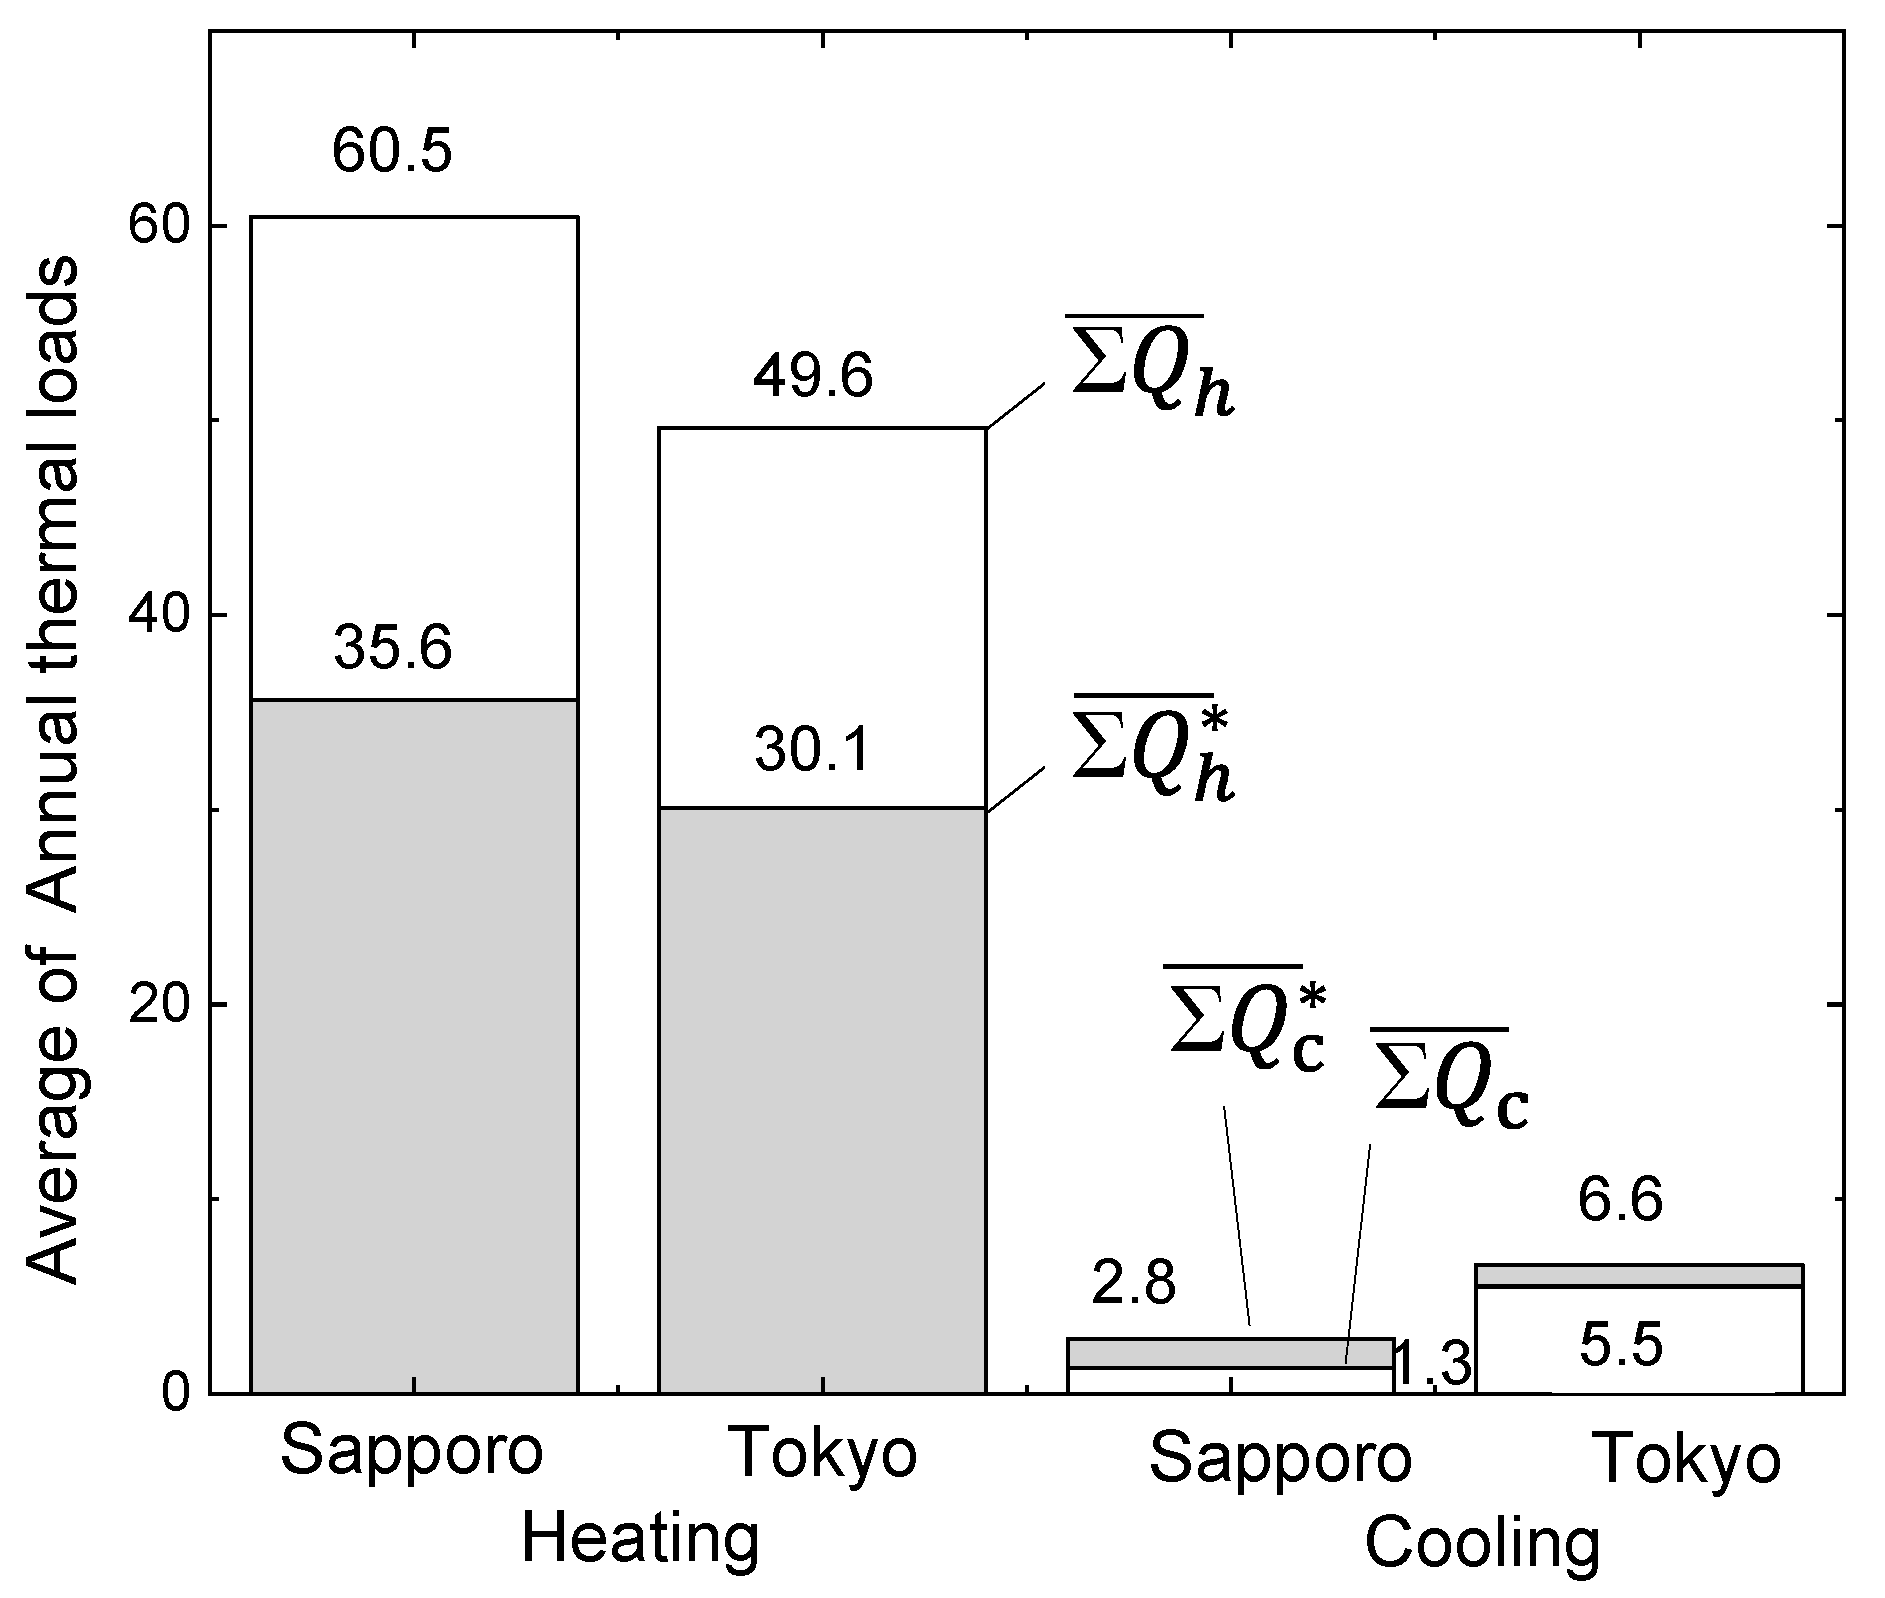
2.1. Climate Data and Present and Future Thermal Loads

This study evaluated the 20-year thermal performance of a residential GSHP system in two cities with different climates: Sapporo at 43.06° N, 141.35° E and Tokyo at 35.68° N, 139.75° E (Figure 1). Sapporo is the largest city, with approx. two million people in the subarctic zone, the cold area of Japan; Tokyo, the capital of the country, is in the extratropical zone, the warm area. Hourly climate data, including outside temperature (Ta), solar radiation, relative humidity, wind velocity, and precipitation at meteorological stations in both cities, were available by the Japan Meteorological Agency (JMA) [27]. This study assigned hourly observations for 2001–2020 as the present data. This study also used the agency’s hourly calculations for 2071–2076 in the Global Warming Projection (Volume 8) [28] as future data. Projection data across Japan were obtained with radiative forcing under an assumption of the IPCC SRES A1B emissions scenario only. Forward modeling of Volume 8 data for the past 1981–1999 allowed validation of the method by comparing the results with observations.
The histograms of hourly temperatures in Figure 2a compare calculated results and observations for the past 20 years. Considering the histograms as the probability distributions, this study modified hourly data for the future, 2076–2095, in Volume 8 using the linear difference between the calculated and observed distributions for each temperature pitch. The modification is compared with the original projection for the future data in Figure 2b. Table 1 summarizes the statistics of hourly outdoor temperatures Ta in both cities observed for 2001–2020 and predicted for 2076–2095. Table 1 also lists degree days, Dd, these being the summation of the difference between Ta and the threshold values of 18 °C for heating and 24 °C for cooling. The average, maximum, and minimum Ta increased by 1.2–4.3 °C from the present to the future due to climate change. The increases in the three statistics were 1–2 °C higher in Tokyo than in Sapporo. The Dd for heating was greater than that for cooling for both the present and future in each city. In Sapporo, the Dd for heating for the present was 3468 day·K, over twice that for Tokyo (1514 day·K). The future increases in Ta are expected to decrease the Dd for heating by 19% in Sapporo and 46% in Tokyo. In contrast, the Dd for cooling is expected to increase by 540% in Sapporo and 186% in Tokyo. In the future, despite increases in Ta, Dd for cooling in Sapporo was still one order of magnitude less than that for heating. Tokyo also had a relatively small Dd for cooling, similar to Sapporo. However, the difference between it and the Dd for heating decreased in future modeling.
Figure 3 shows monthly averaged trends of Ta for the present and future in the two cities. The average Ta increased in all months, with relatively large increases from January to March. However, the standard deviation of >3 °C indicates extremely high or low Ta observed or predicted in each month. This study used the average increased but stochastically variable Ta on an hourly scale to analyze the performance of a GSHP system. Monthly averaged solar radiation, another climate component for thermal load analysis, changed by <10% (data are omitted in this paper). The analysis assumed a negligible difference in the climate data except for Ta between the present and future.
This study considered a residential GSHP system installed in a two-floor wooden residence with one dining room and four bedrooms with a total floor area of 200 m2. The residence model’s inside structure was assumed to be similar with those of a standard residence [29]. Hourly thermal loads for the present and future were calculated to multiply the difference of temperatures between indoor and outdoor by the heat transfer rate through residence’s walls. The heat transfer rate was assumed to be a product of the UA value and the total wall area (700 m2). The inside temperature was assumed to be 22 °C for heating and 24 °C for cooling. The UA values were defined as the legal targets of 0.46 W/(m2·K) for Sapporo and 0.82 W/(m2·K) for Tokyo. Considering improvements in residential thermal insulation, target UA values of 0.34 and 0.46 W/(m2·K) were assumed for the two cities, respectively [30]. The modeled GSHP systems were operated continuously during the hours when the outside temperature was <16 °C (heating) or >24 °C (cooling). After the calculation, thermal loads of no more than 0.5 kW were neglected to reduce costs and keep stability in the system simulation below.
Figure 4 shows histograms covering 20 years of hourly thermal pulses in Sapporo City for heating (Qh) and cooling (Qc) in the present and future. Figure 4a shows Qh varying from <1 to 7 kW during the present; the histogram follows a nearly normal distribution with a peak of ~4 kW. Increasing Ta in the future, as shown in Figure 4b, shifted the distribution to lower values, and Qh varies within a narrower range of <1 to 5 kW. In contrast, Qc for the present in Figure 4c follows a log-normal distribution, with a relatively small range of <1 to 3 kW. The histogram for the future in Figure 4d is shifted higher because of climate change; heat pulses of >2 kW are limited, similar to the results for the present. Figure 5 summarizes the changes between the present and future in the average of total annual loads for heating (ΣQh) and cooling (ΣQc) in Sapporo and Tokyo. The annual loads in Sapporo changed from 60.5 to 35.6 GJ/y for heating (the future load being 59% of the present load) and from 1.3 to 2.8 GJ/y for cooling (the future load is 215% of the present load). The percentage changes were smaller than those of degree days, Dd, because this study assumed the UA values would decrease in the future. For Tokyo, the total load reduced from 49.6 to 30.1 GJ/y for heating (future load being 61% of the present load) and increased slightly for cooling from 5.5 to 6.6 GJ/y (future load being 120% of the present load). In both cities, the heating loads decreased in the order of 101 GJ/y, while the increases in cooling loads were only in the order of 102 GJ/y. This means that climate change in this scenario would decrease total residential thermal loads in Japan.

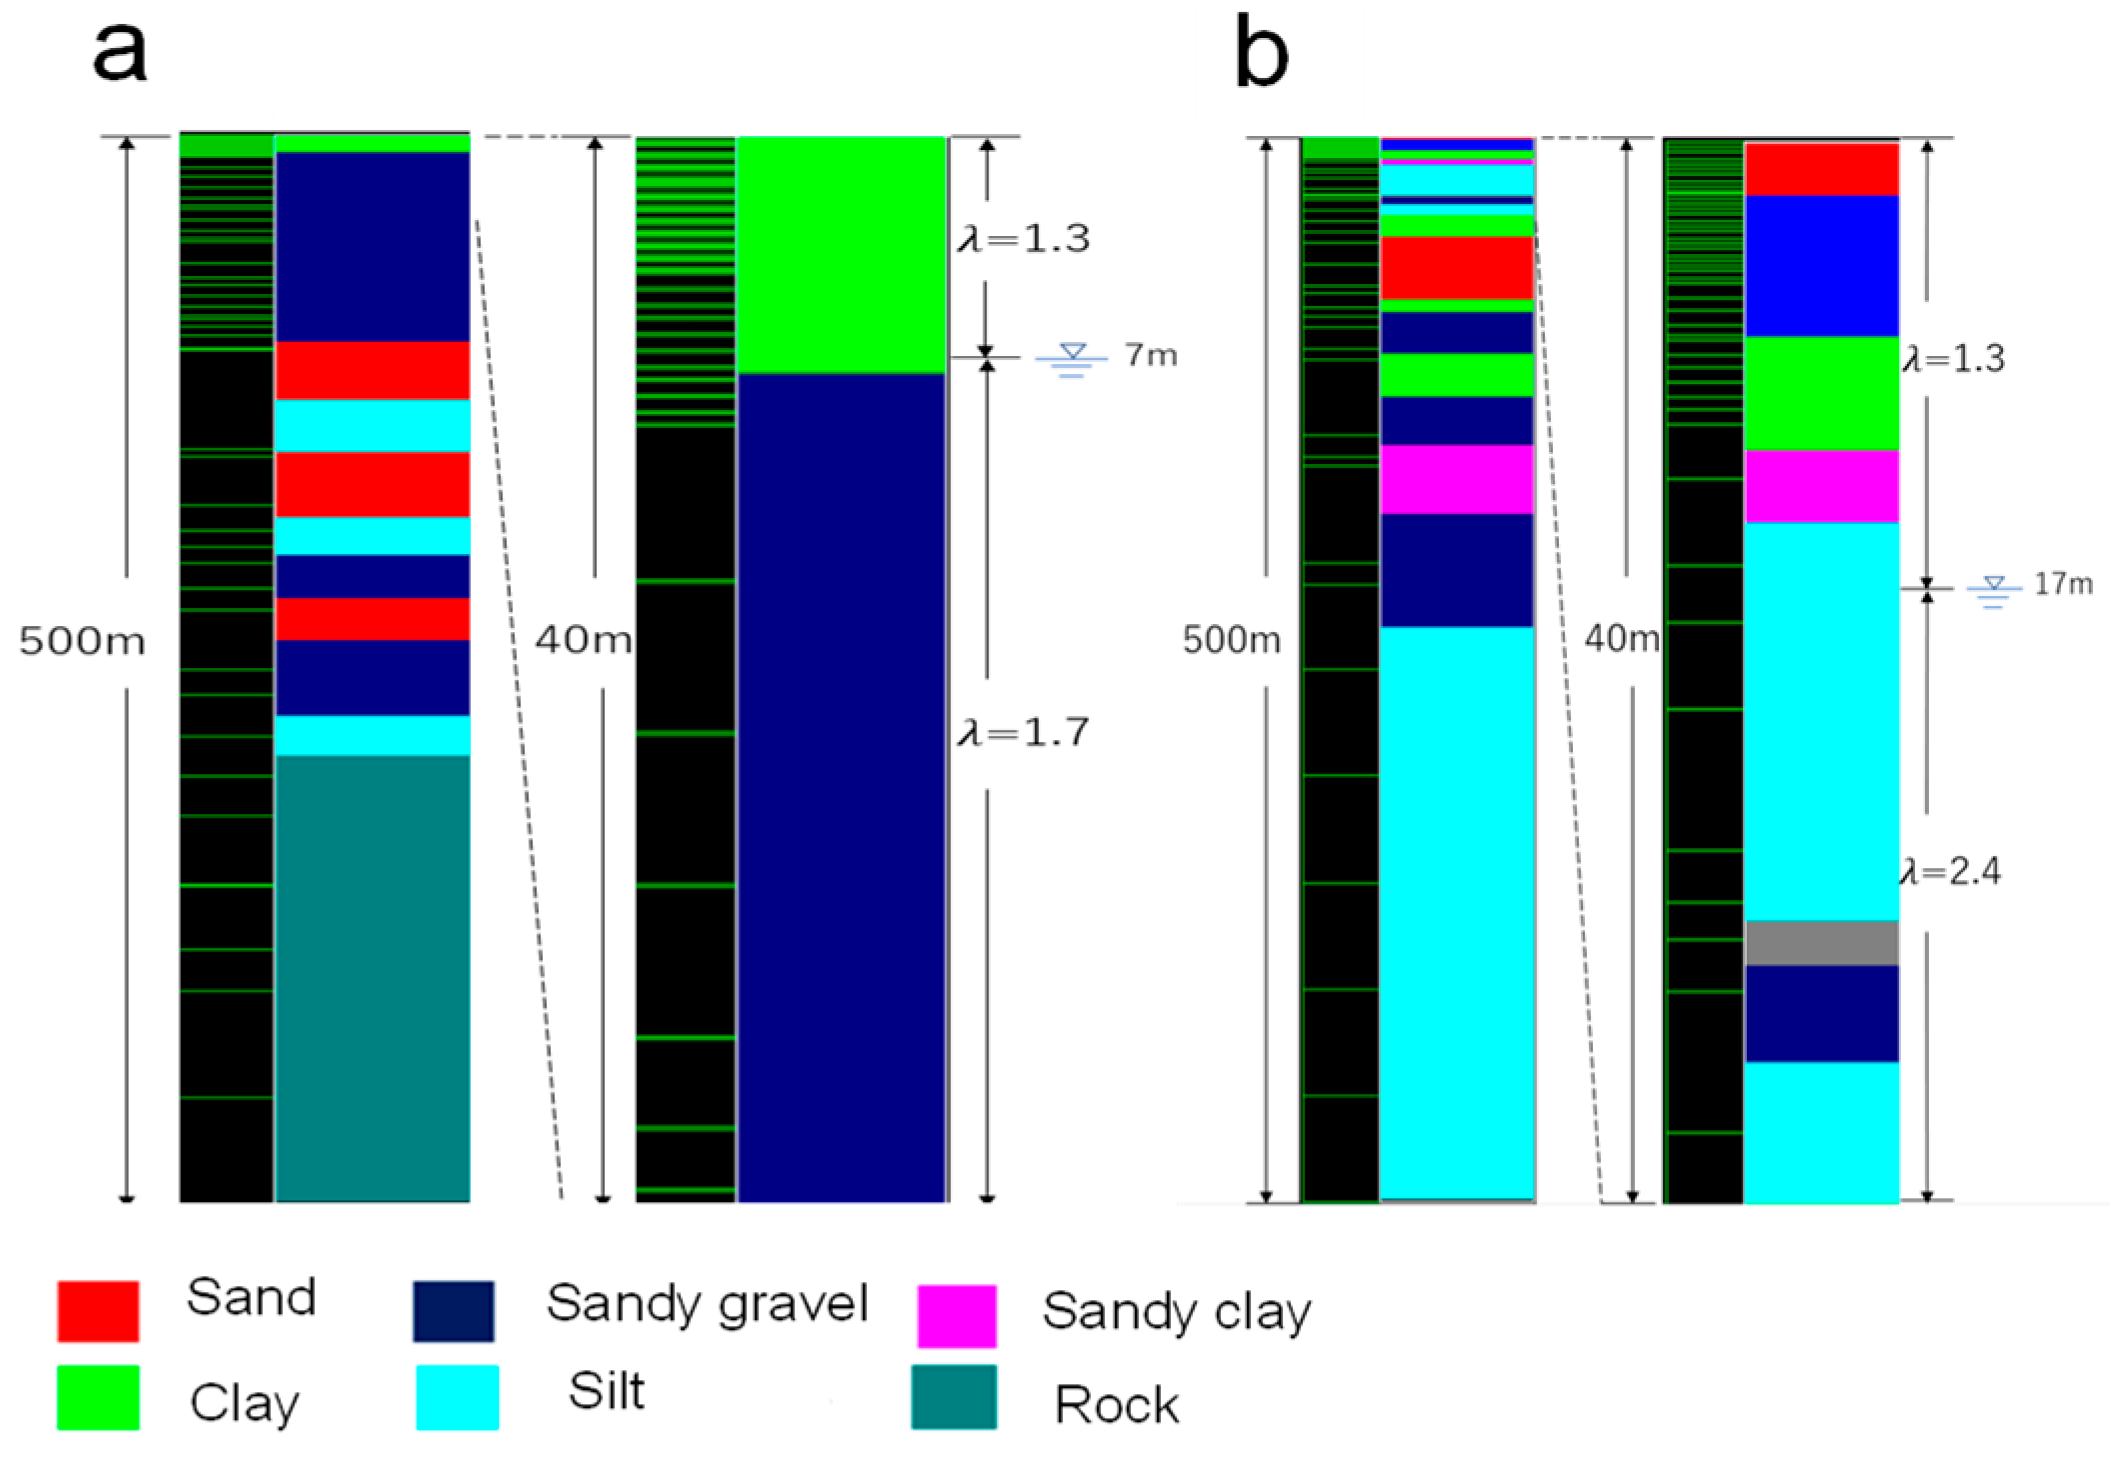
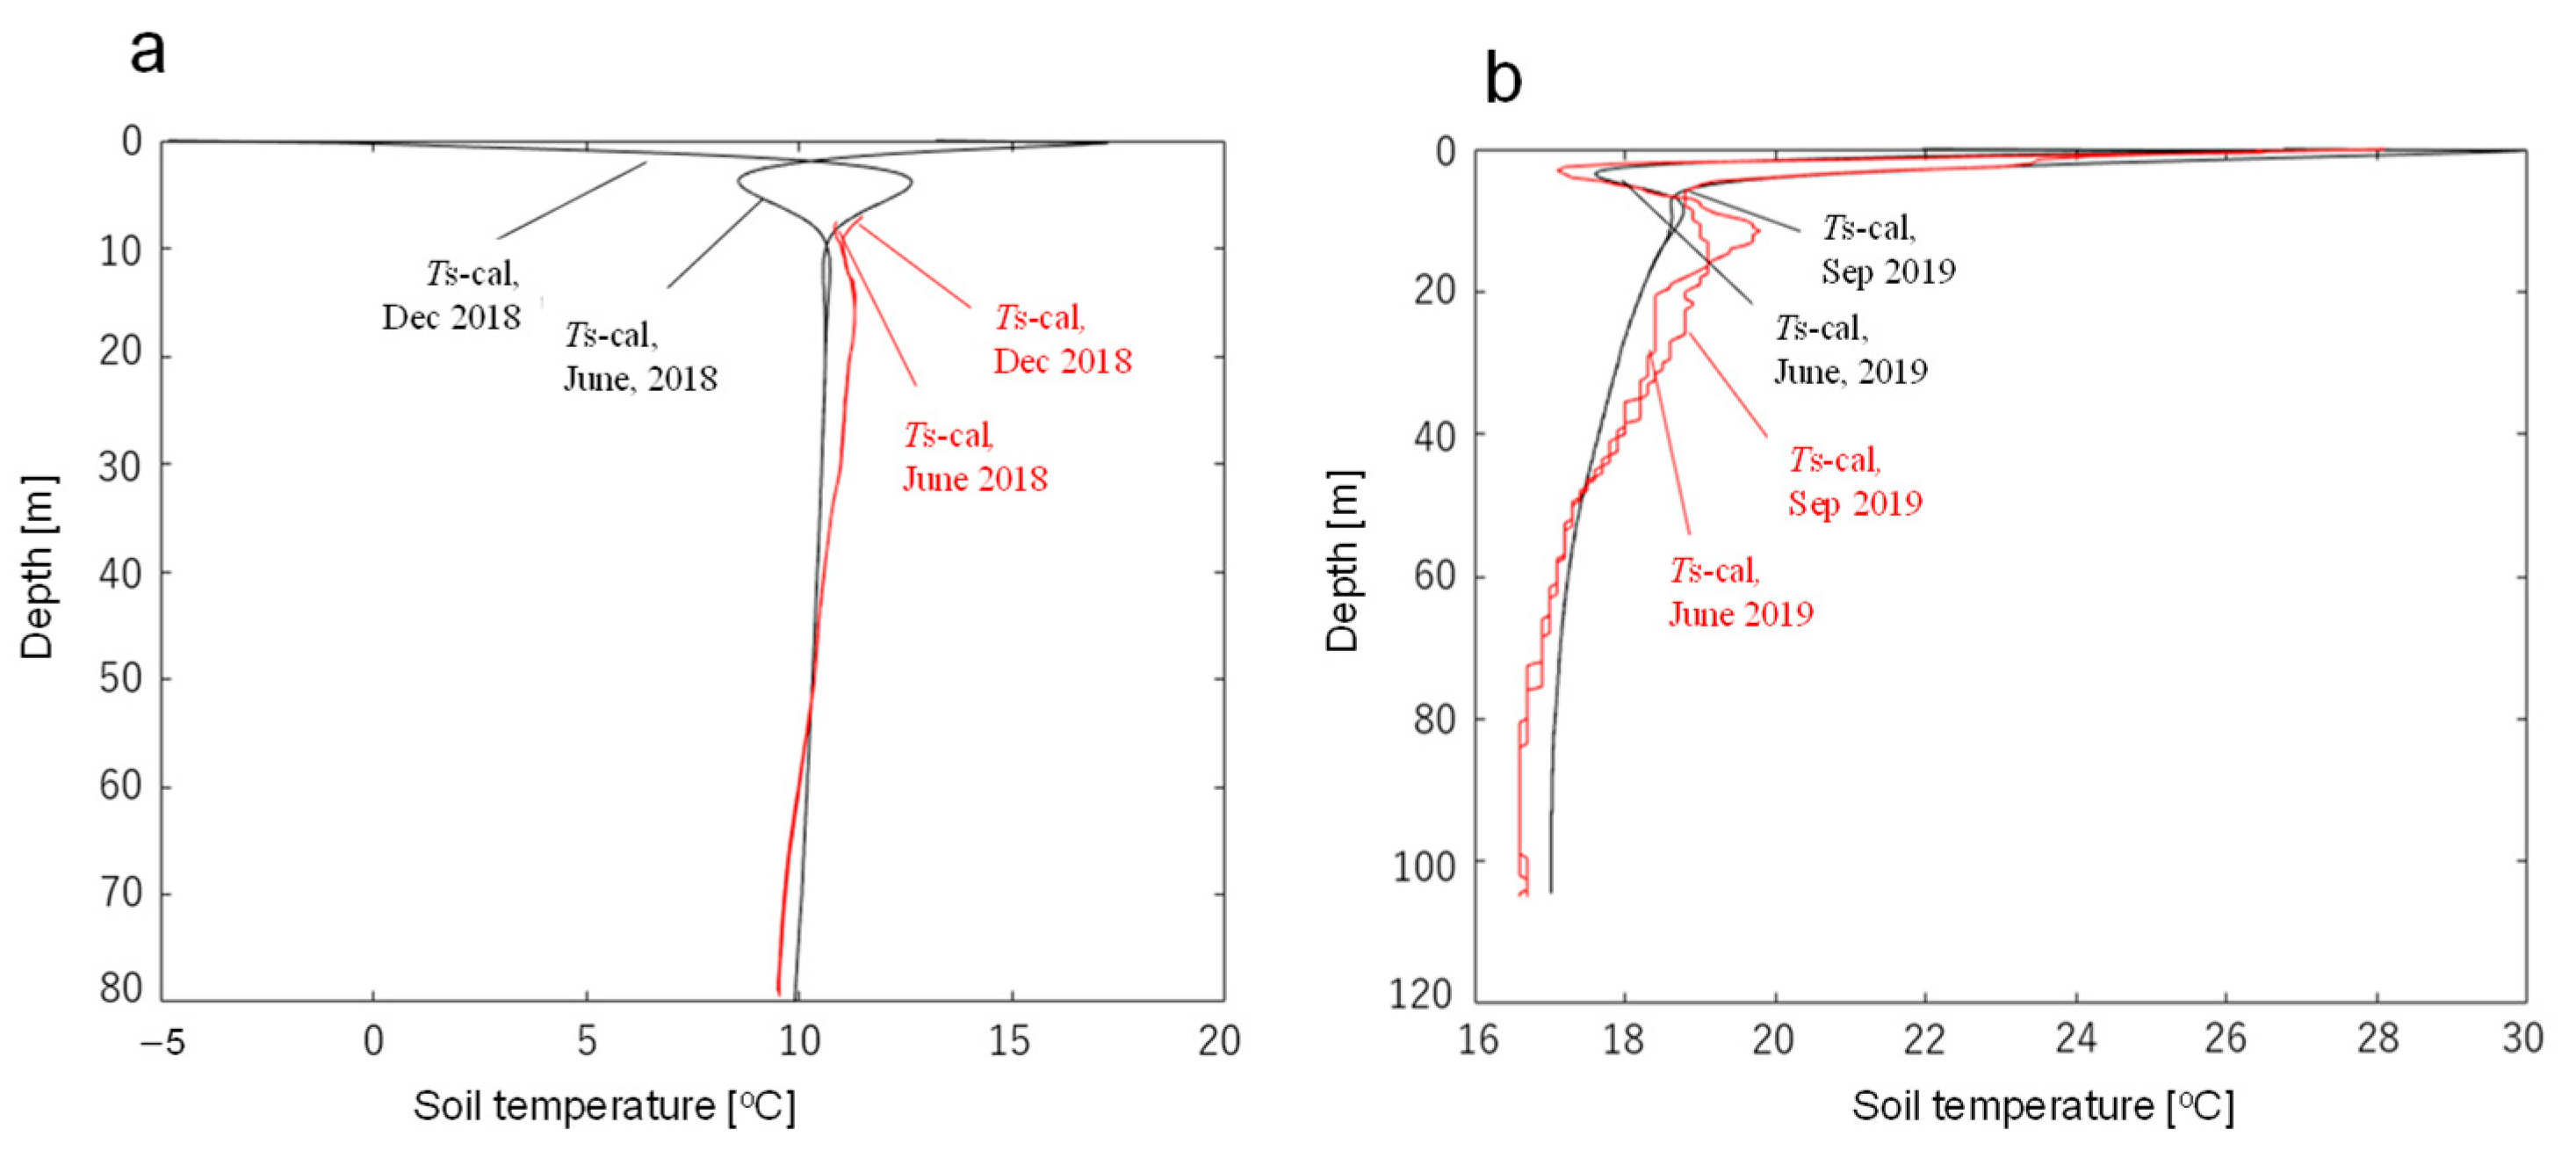
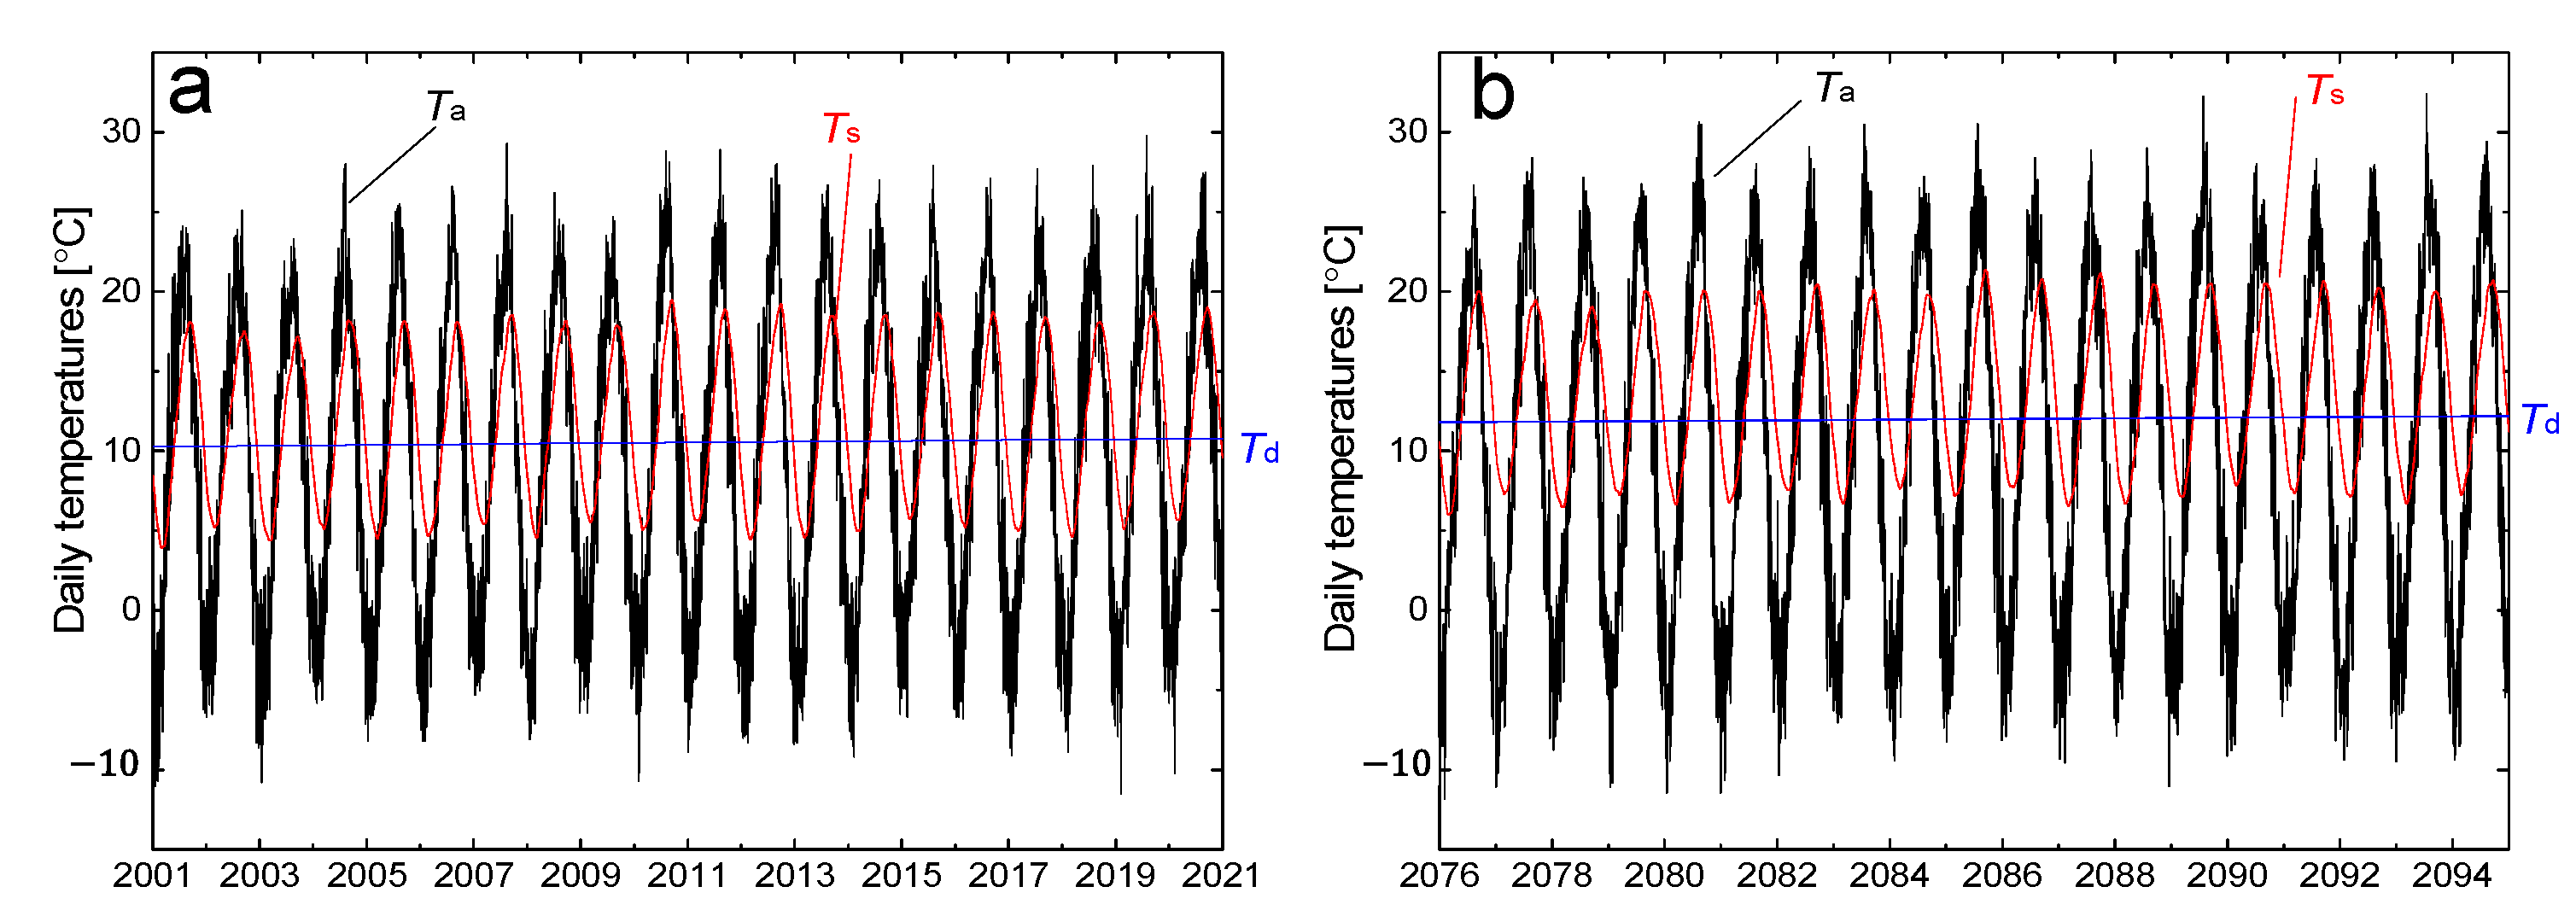
2.2. Prediction of Soil Temperatures

Soil temperature was essential for the performance of a GSHP system as the ambient temperature of the underground heat source. This study estimated the daily soil temperature profiles through a one-dimensional, numerical simulation of vertical heat conduction and convection. Hydrus 1D [31] was used here with a package for using input climate data to calculate underground heat fluxes considering thermal budgets on the ground surface. This study assigned outdoor temperatures for the present and future, as described above. Other climate data for solar radiation, relative humidity, and wind velocity were obtained from the same data source (mentioned above). Figure 6 shows the mesh designs for the 1D numerical simulation for both cities. The model domain in the vertical direction was 500 m; the vertical mesh size was 0.2 m to a depth of 5 m and became coarser with increasing depth, reaching 50 m at the bottom. The geologic conditions, denoted as different colors in Figure 6, were assigned according to the drilling records of boreholes in Sapporo and Tokyo. Following the drilling records, the water table was kept at 7 m in Sapporo and at 17 m in Tokyo. Downward fluxes of water and heat were calculated from input data in the software as the surface boundary condition. All water drained vertically without horizontal flow because of the almost flat ground at each site. The effective thermal conductivity of unsaturated soil λ was assumed to be 1.3 W/(m·K), and that of saturated soil was calculated to obtain the agreement of thickness-averaged thermal conductivity (i.e., ground thermal conductivity) between the calculations and observed results from an in-situ thermal response test by the authors in each city; i.e., 1.8 W/(m·K) in Sapporo and 2.4 W/(m·K) in Tokyo. The large observed ground thermal conductivity for Tokyo was probably due to the groundwater flow effect at the test site. Other geologic parameters, such as heat capacity and porosity, were set as the software’s default values. Hydraulic conductivity for heat advection was adjusted to be 1.4 times higher than the default value to obtain sufficient agreement between each borehole’s simulated and observed temperature profiles. Figure 7 compares the simulated and observed soil temperature profiles for each city. The observed profiles showed almost zero or negative temperature gradients with increasing depth. One reason for this is that upward geothermal fluxes from the deep zone were small due to thick sediment of low thermal conductivity at each location. Another reason is the vertical groundwater flow for heat transfer to the deep zone. In Figure 7, the root mean square error (RMSE) between the calculations and observations was 0.027 °C in Sapporo and 0.037 °C in Tokyo, indicating the reasonableness of the simulation.

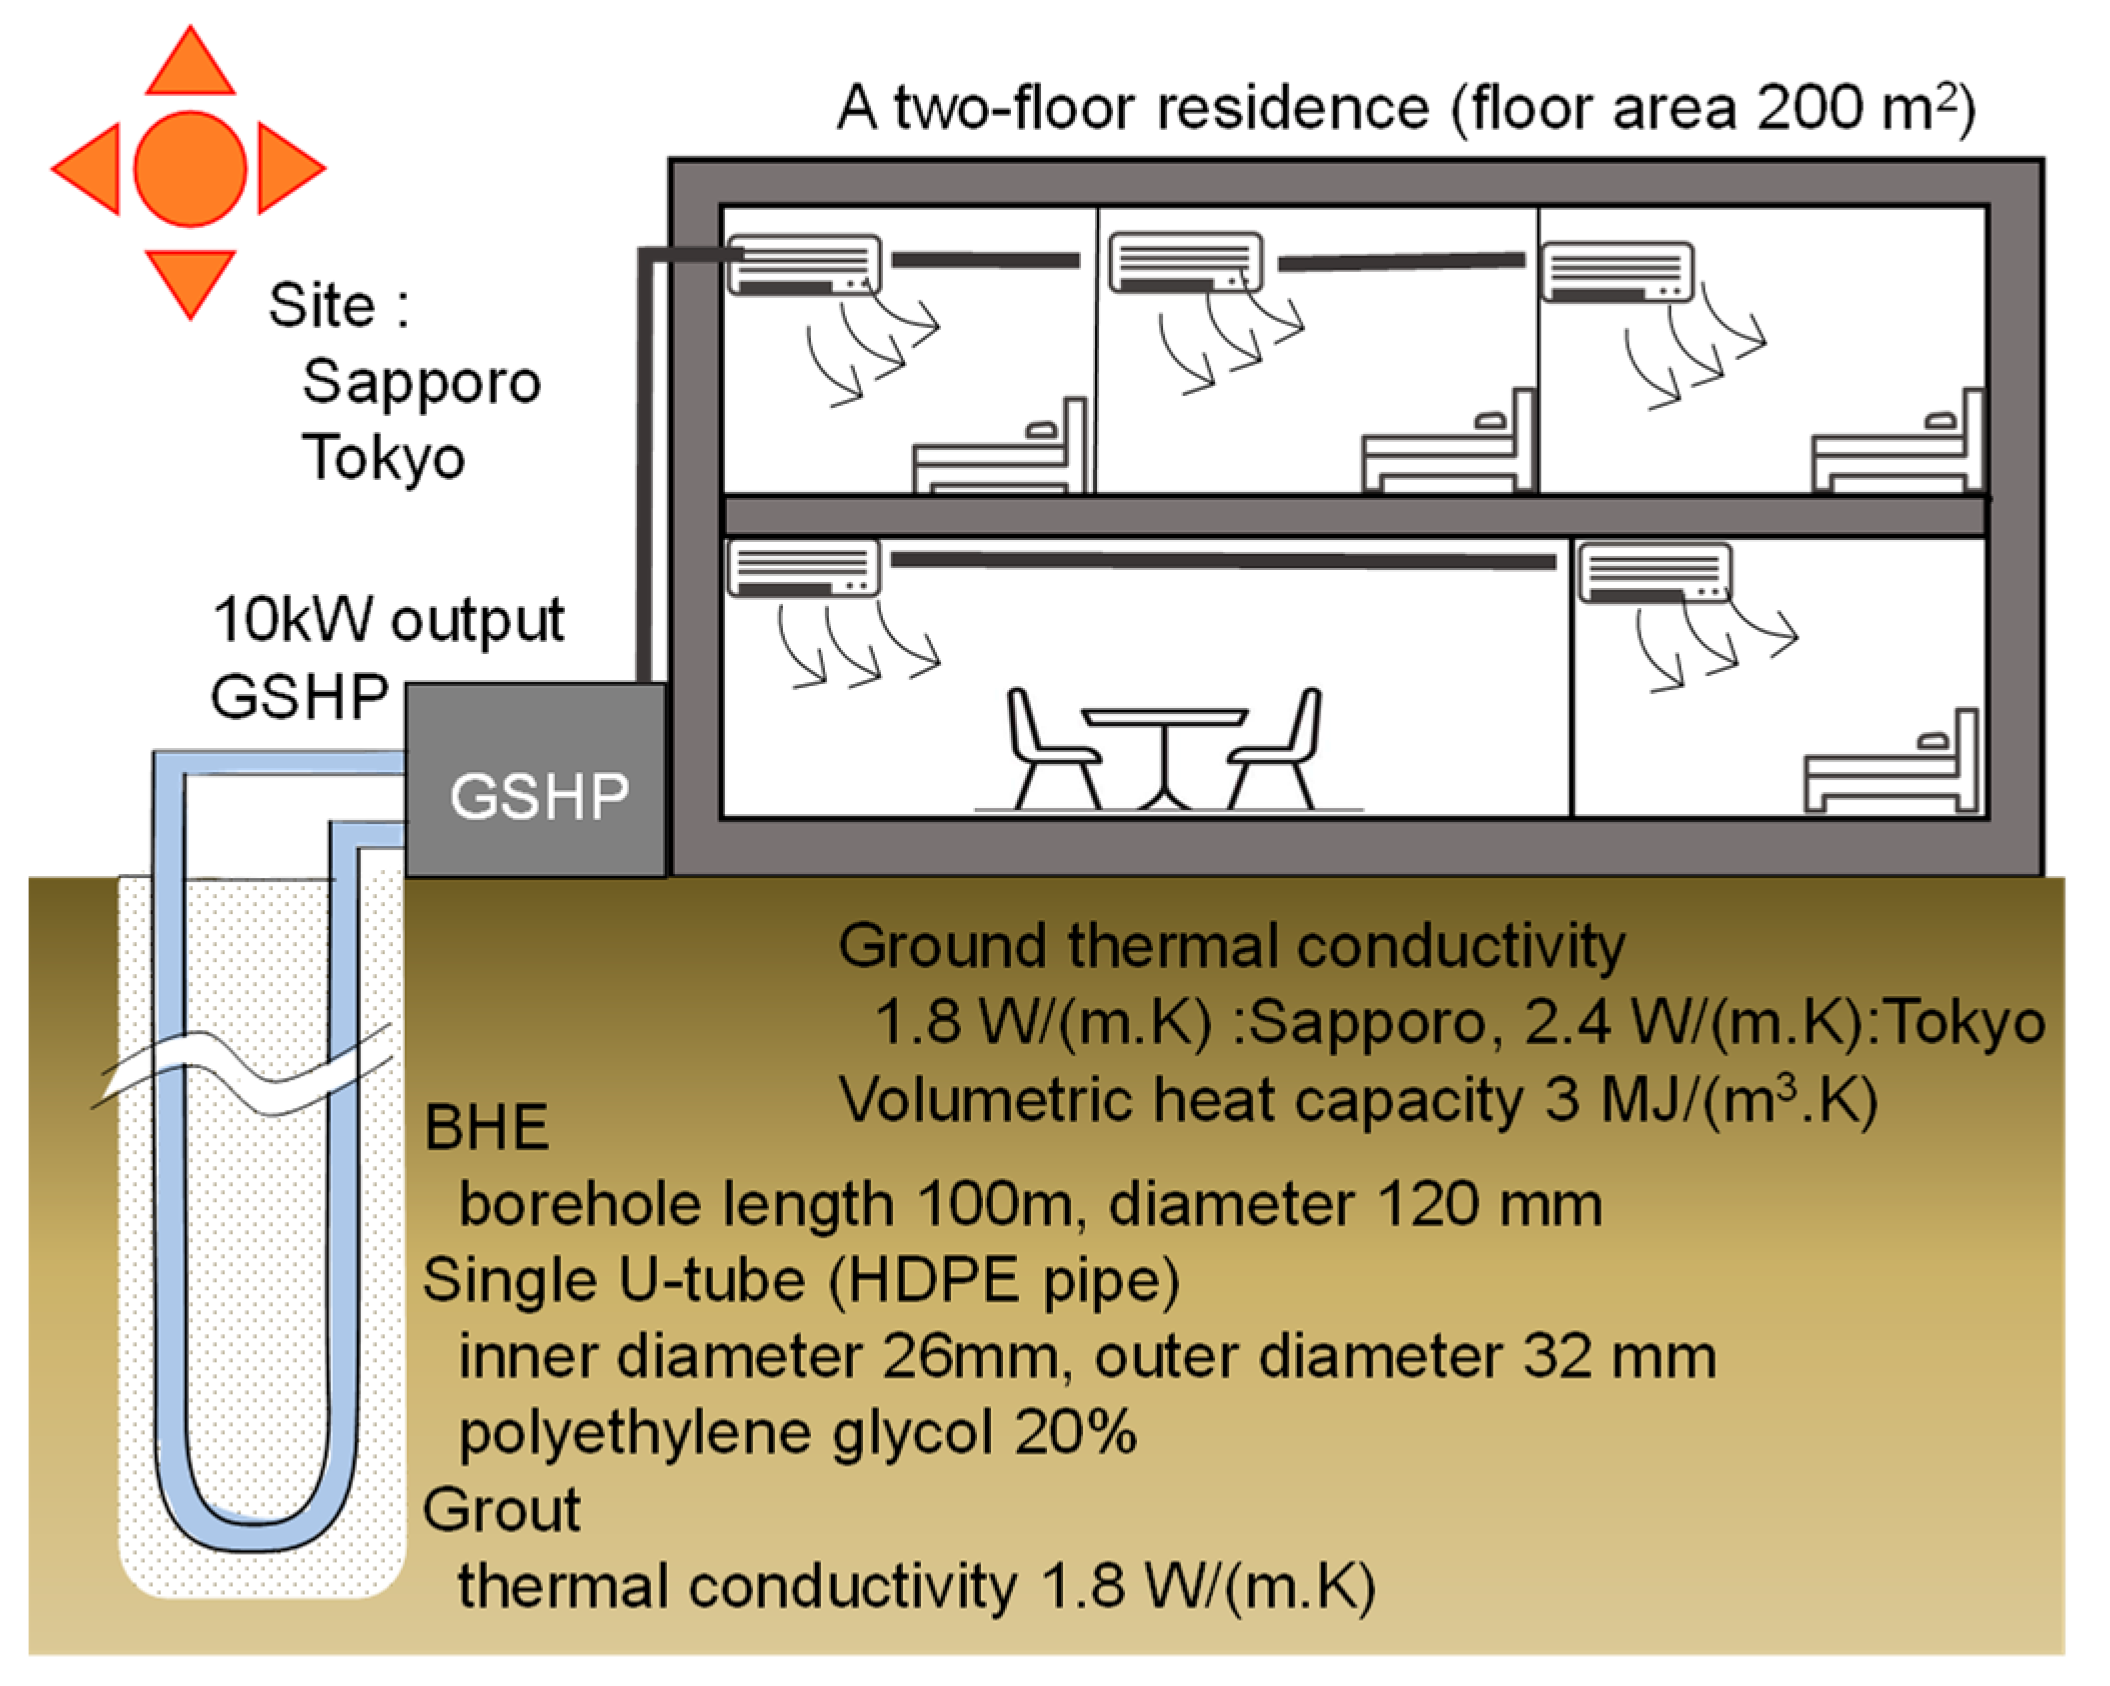
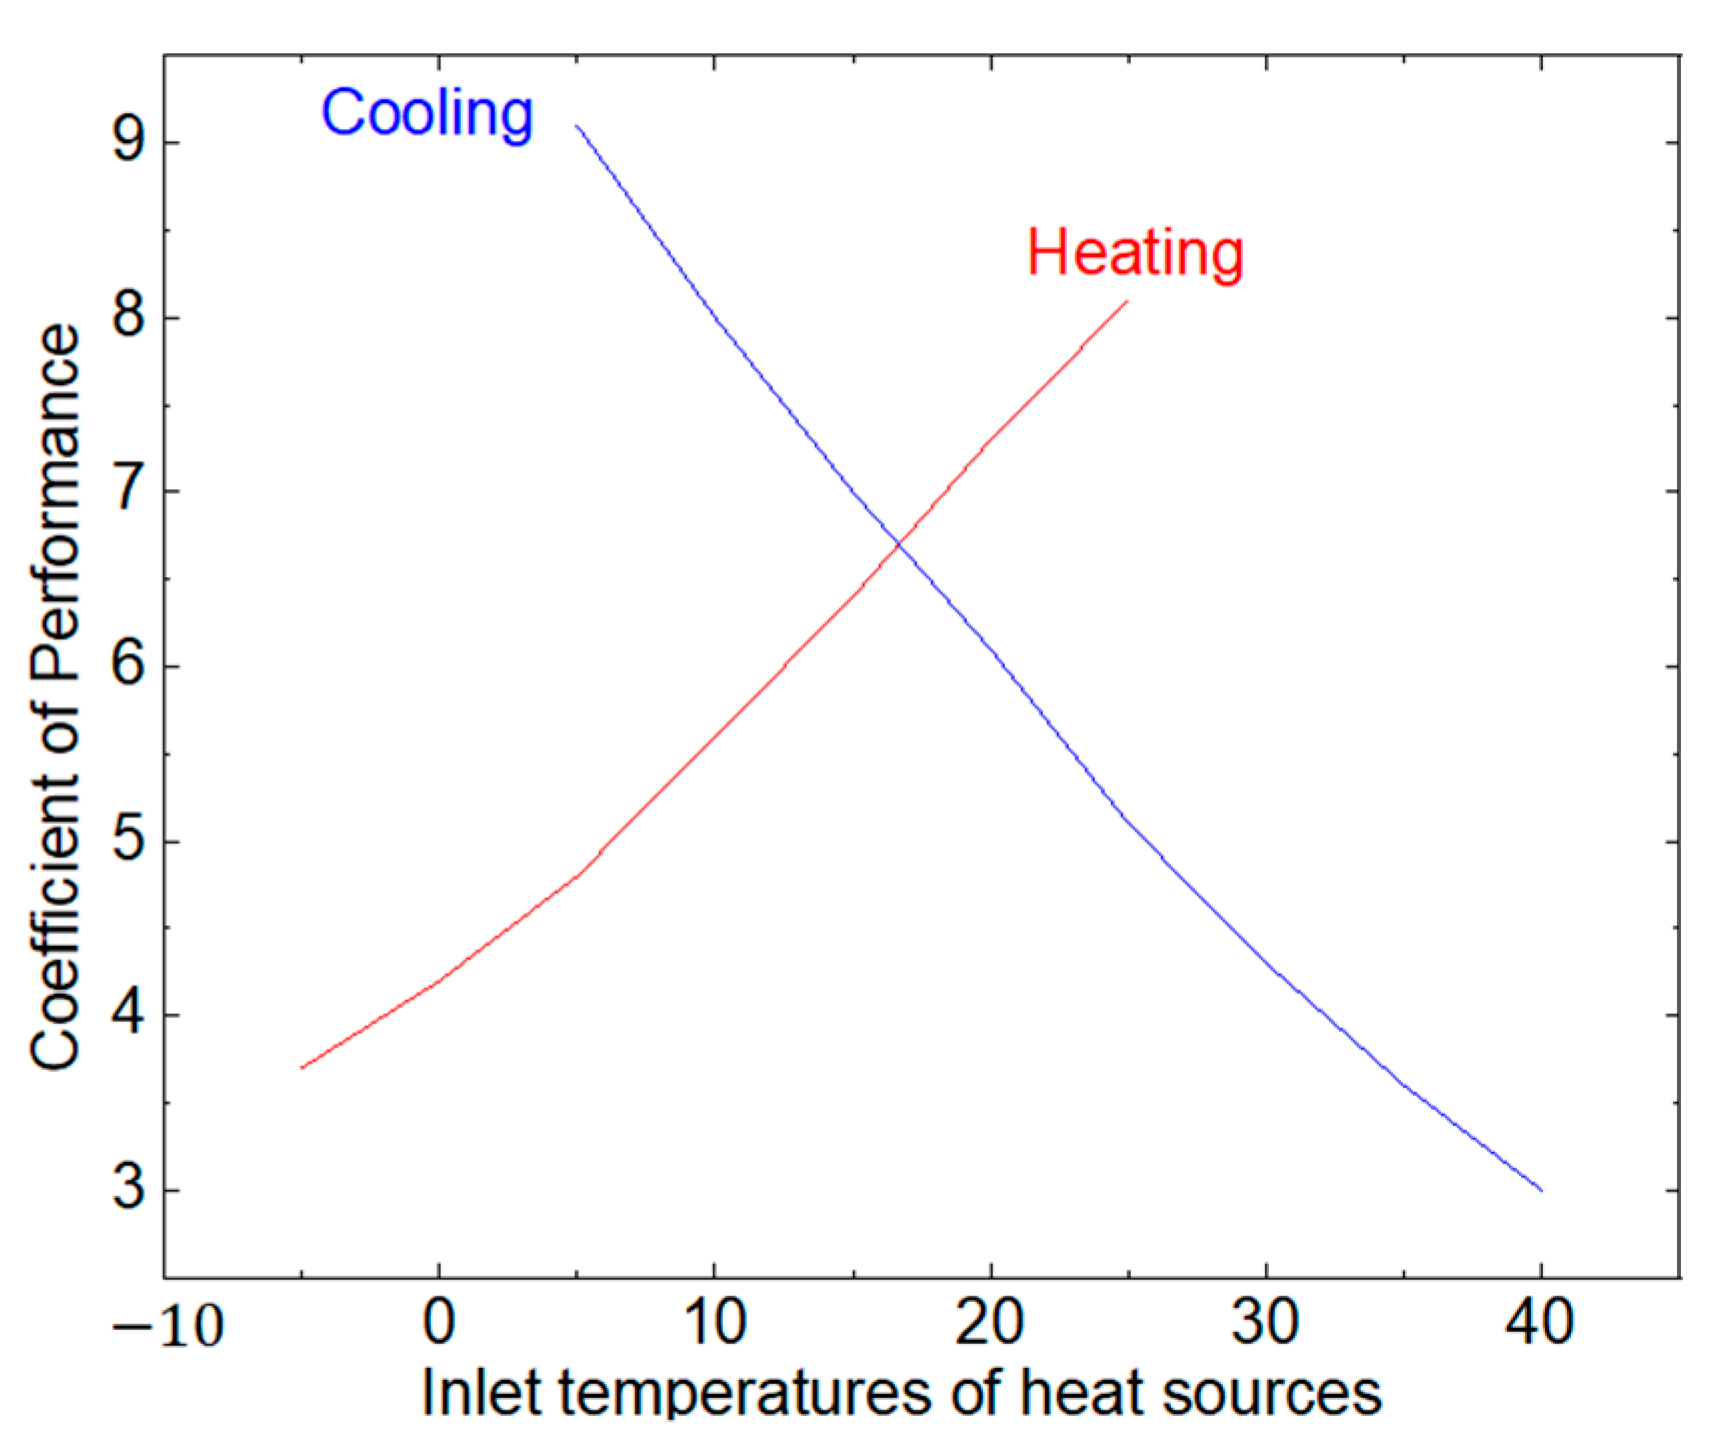
2.3. GSHP System Performance Simulation

The authors previously developed a methodology to simulate the thermal energy cycle during the operation of a GSHP system [8,32]. The methodology has been commercialized as a standard tool for the designing and planning of GSHP systems in Japan. It executes cyclic calculations for the temperatures of (1) the soil surrounding the GHE, (2) the heat-transfer fluids in the U-tubes, and (3) the fluids entering and leaving the heat pump. The calculations were performed according to hourly thermal loads, resulting in a realistic solution at the highest level [16]. At each calculation time step, the change in soil temperature around the BHE was estimated as the superposition of temperature changes according to all hourly thermal pulses. To improve the accuracy of the methodology, the calculations considered theoretical heat transfer for an infinite cylindrical source for the targeted BHE itself instead of an infinite linear heat source. The theoretical thermal response along the cylindrical heat source was in a semi-infinite integral form. The methodology derived a nonlinear relationship of thermal responses with a dimensionless Fourier number to reduce the computational costs for hourly calculations over a long period (here, 20 years). The calculations based on the infinite source theory were modified by correction factors for finite heat sources such as a BHE. The heat transfer rate between the fluid and soil was calculated from their temperature difference with respect to the borehole thermal resistance. The borehole thermal resistance was estimated using a 2D boundary element method for the steady temperature difference between the fluid and the borehole surface, considering the properties of the circulating fluid, the materials, the U-tube geometry, and the grout materials. The temperature of the fluid at the shank of the outlet U-tube was calculated from the temperature of the fluid at the shank of the inlet U-tube considering the heat transfer rate between the fluid and the surrounding soil and the thermal capacity within the BHE. The electricity consumption of the GSHP was calculated at each time step using the relation between the coefficient of performance (COP) of the heat pump and the temperature of the fluid flowing into it. The temperature of fluid flowing out of the heat pump changed after heat extraction for heating or injection for cooling. The calculation cycle was carried out for each time step. The electricity consumption by the heat pump and another fluid-circulation pump were summed to estimate seasonal performance factors for heating and cooling (i.e., SPFh and SPFc, respectively).
This study assumed that the GSHP system consisted of a single BHE, a 10 kW water-to-water heat pump, and a duct system to supply heated or cooled air to each room, as shown in Figure 8. The modeled heat pump (SIJ10MER, Dimplex, Co., Tokyo, Japan) was chosen because the product catalog gives the relationship of its COP with the inlet brine temperature (Tb) of the fluids entering the GSHP, as shown in Figure 9. The relationship was assumed not to differ between the present and the future. The BHE was assumed to consist of a single vertical 32 A HDPE U-tube buried with silica sand grouting in a borehole (length, 100 m; diameter, 0.14 m), as often designed in Japan. The electricity consumption of the GSHP system was calculated from the hourly COP as a function of Tb and thermal pulses at each hourly step. A circulation pump and duct system for the heat-transfer fluid was assumed to use electricity at a constant rate of 0.4 kW at each operation time. The performance of the GSHP system was evaluated from the ratio of the total thermal load over total electricity consumption for heating and cooling, respectively. The results are represented as seasonal performance factors: SPFh for heating and SPFc for cooling.
A simple analysis established the life cycle cost (LCC) as the sum of the initial capital and the ongoing operation and maintenance costs without considering other renovation or disposal costs to evaluate payback time (PT) for the GSHP system. For neglecting the renovation cost and considering practical time limitations for the cost-effectiveness of the GSHP system, this study assumed 20 years as the calculation period of LCC. A system commonly used in Japan, especially in the north, is considered for comparison; it consists of five 3 kW ASHPs (one for each room in residence) for cooling and an oil boiler central system for heating. The COP value of the ASHP was taken from previous research [33] and assumed not to differ between the present and the future, similar to that of GSHP. As the oil and gas boilers used for heating often differ among residences, this study assumed a ratio of ASHPs, gas boilers, and oil boilers used for heating of 0.16:0.03:0.81 in Sapporo and 0.32:0.47:0.21 in Tokyo, as determined by a previous survey [34]. Our market research assessed the systems’ capital costs as 2.8, 2.0, and 0.87 million JPY, respectively. A subsidy of 0.6 million JPY for the GSHP system was also considered. The operating cost for the present was calculated as the sum of each year’s energy consumption multiplied by the energy price for that year. At the present, the prices of electricity, gas, and oil for LCC are plotted in Figure 10 [35], which shows their variability and the generally increasing trends for gas and oil prices. Maintenance costs were assumed to be 25% of the operating costs. Three future cost (prices per joule) scenarios are compared:
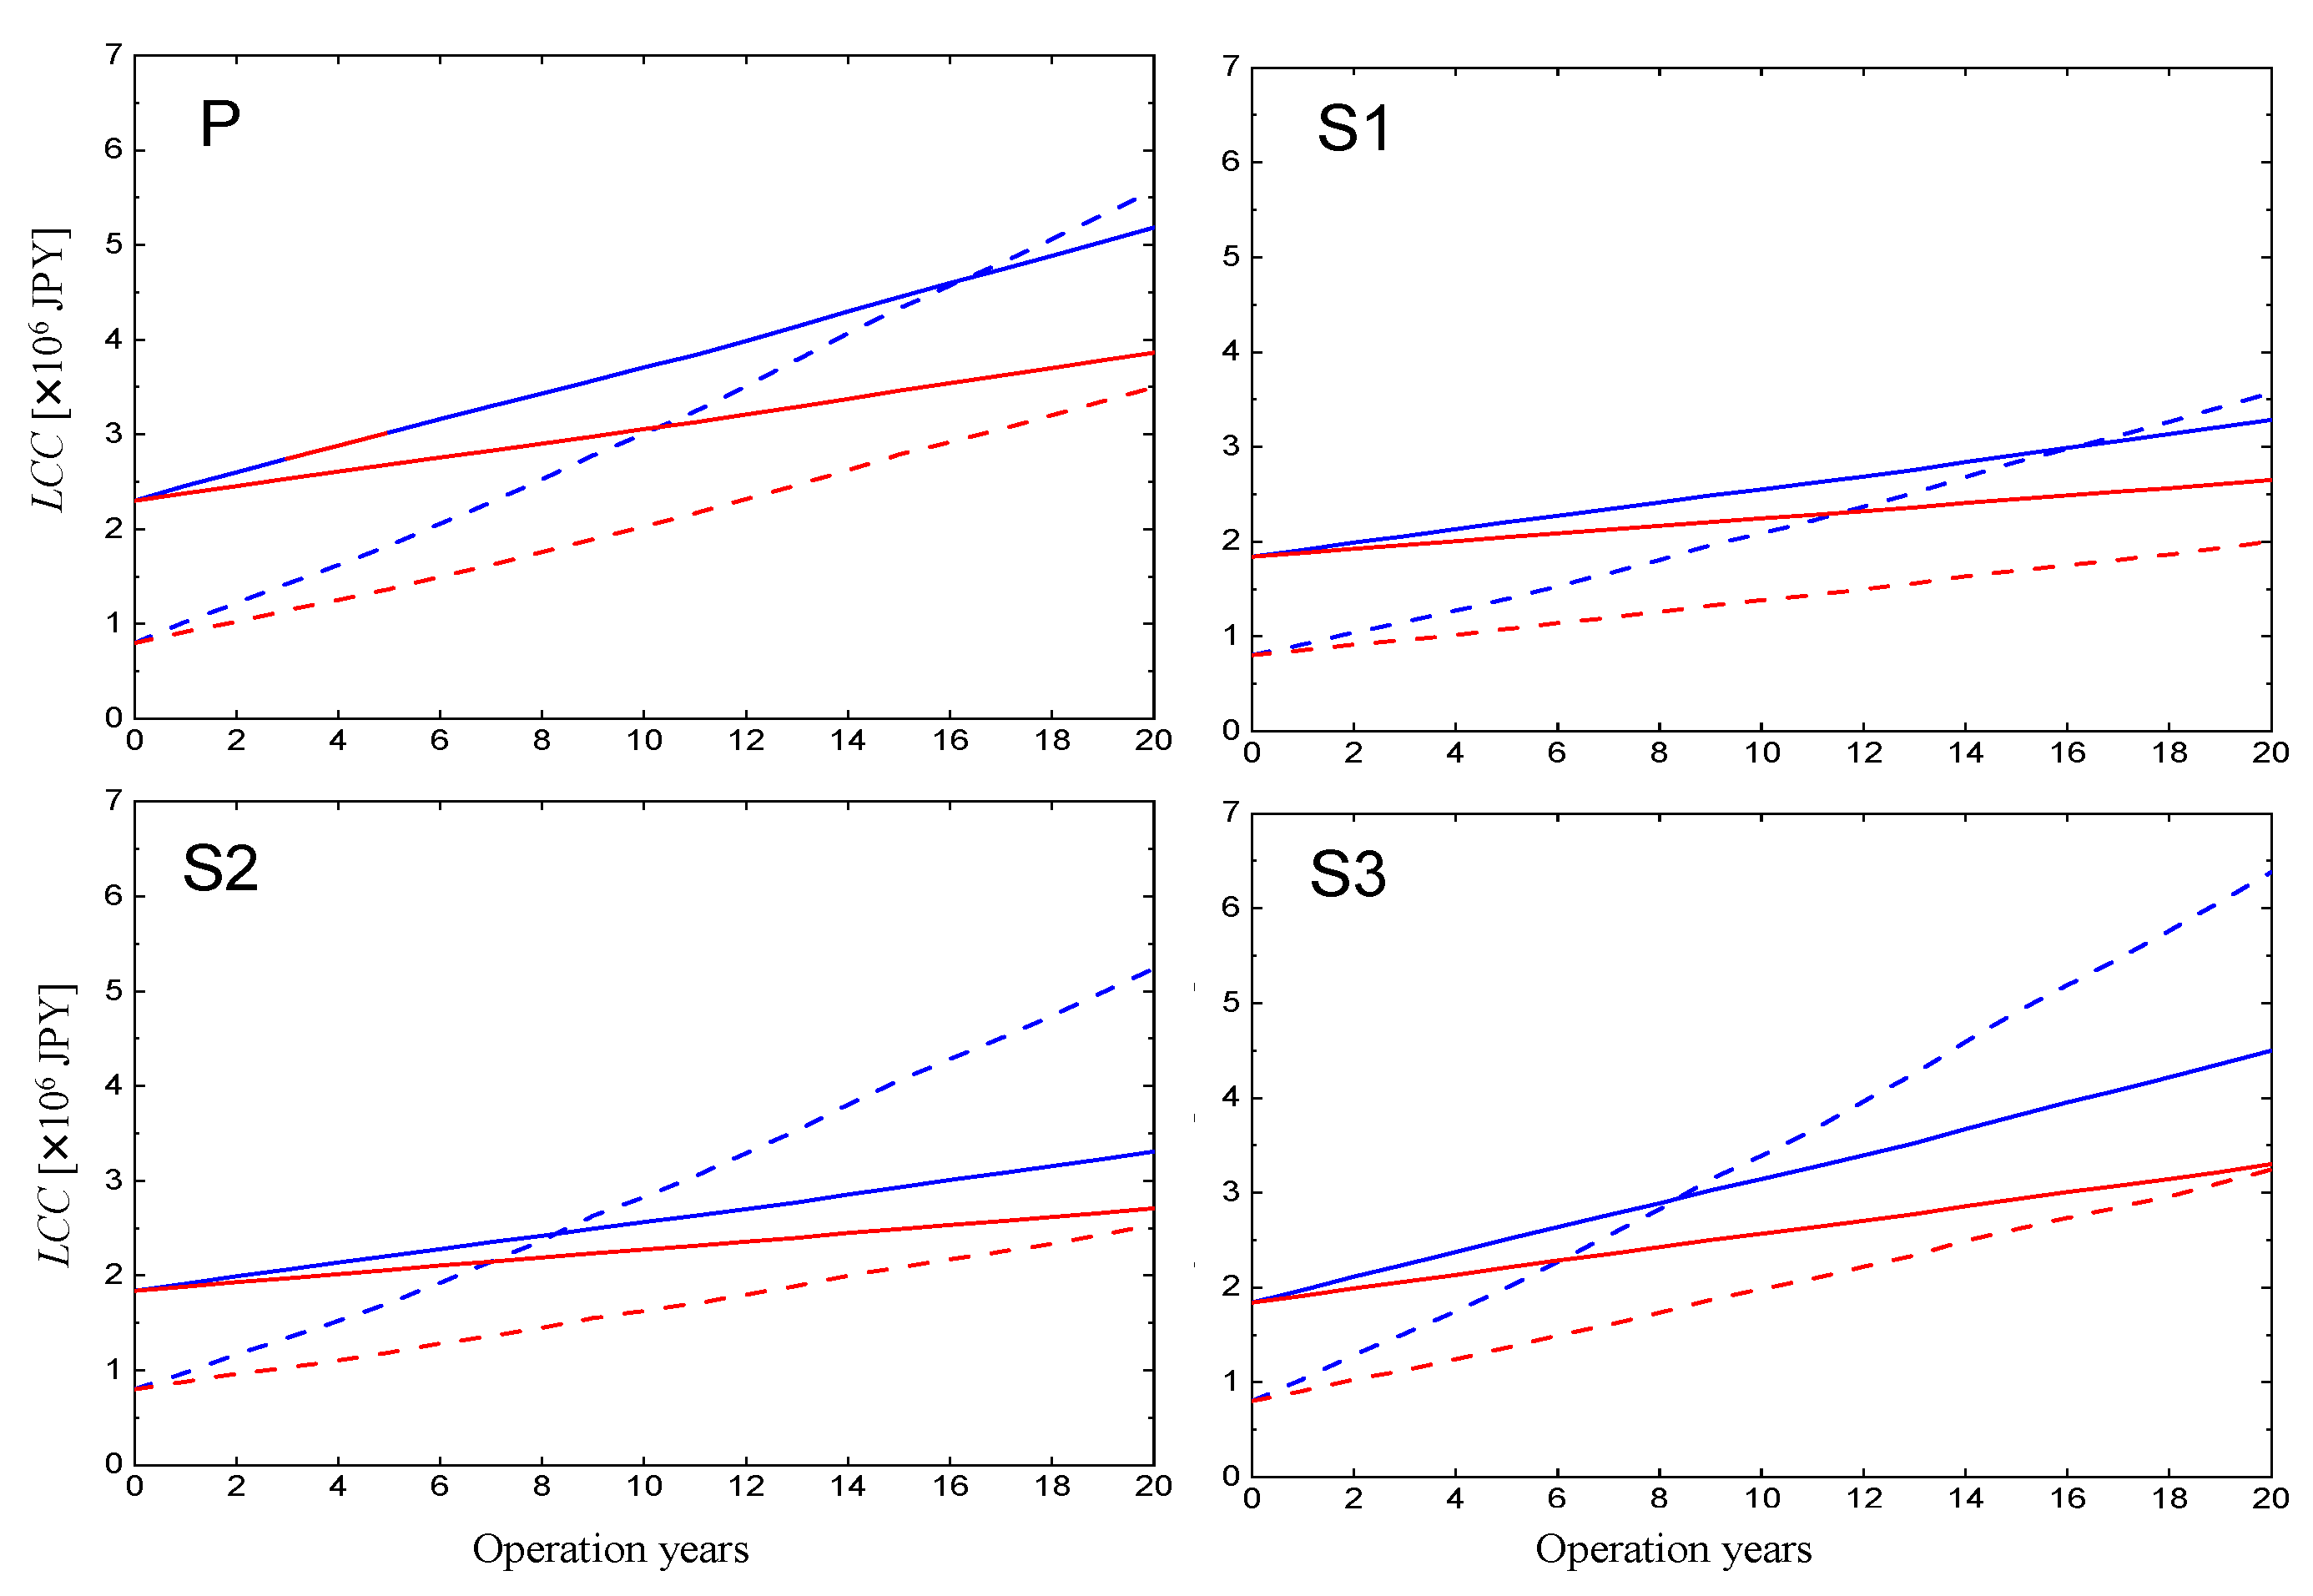
  • S1, no change from the present;
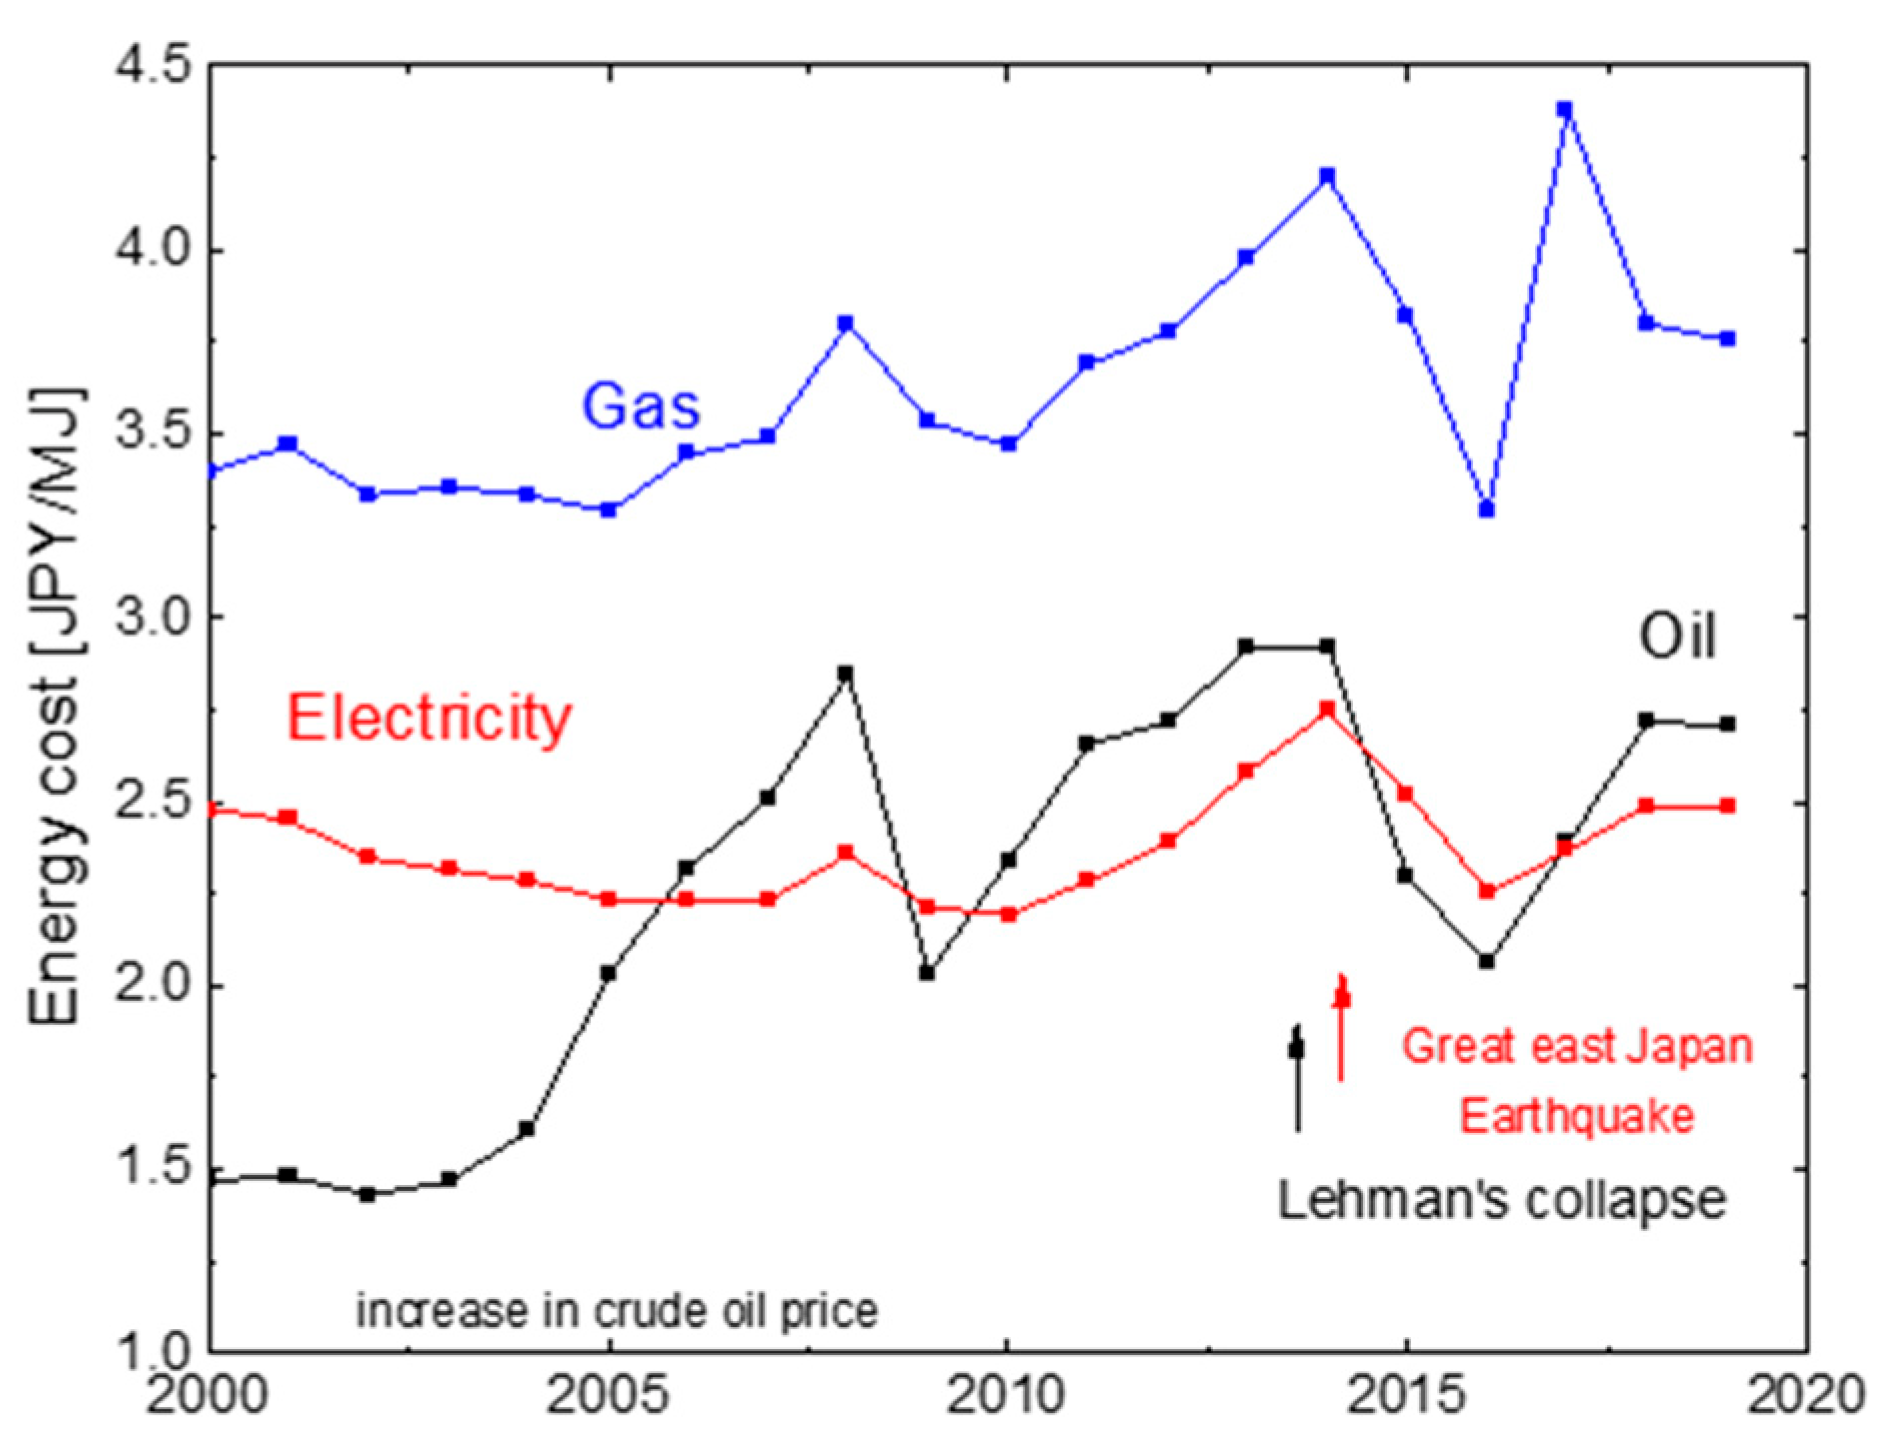
  • S2, the 20-year oil/gas prices would double those in the present while the electricity price would remain the same, considering their recent trend in Figure 10. The increase of the oil/gas prices was equal to an assumption that an annually rising rate of 5%;
  • S3, both electricity and oil/gas prices in the future would double.
Figure 10. Current 20-year trends of oil, gas, and electricity prices in Japan.
Energies 16 02742 g010

3. Results

3.1. SoilT

Figure 11 shows the calculated daily temperature at a shallow depth (2 m), Ts, and at the target depth for a BHE (50 m), Td, for the two 20-year periods (present and future) for Sapporo. The shallow temperature fluctuated seasonally like Ta but with a narrower range, and its peaks were relatively late. In contrast, Td has not fluctuated for both 20-year periods due to the superposition of the heat transfer in the deep zone. Table 2 summarizes the calculation results, indicating that both Ts and Td were, on average higher than Ta for both cities. In particular, the average Ts was ~2 K higher than the average Ta due to solar radiation and water infiltration. The annually increasing rate of temperature was about 6 to 7 °C/100 y during both the present and future periods in Sapporo. The rates of Ts were almost equal to those of Ta, whereas the slopes of Td were smaller but probably not negligible (~2 °C/100 y). The difference of 20 year-averaged Td between the future and present was 1.47 K. In Tokyo, the rates were relatively low during the present, around 1.5 °C/100 y for Ta and 0.29 °C/100 y for Ts. In the future, however, both rates will increase to around 4–5 °C/100 y in Tokyo. The rates of Td were low (1.15 °C/100 y), indicating almost constant temperatures in the deep zone. The difference of 20 year-averaged Td between the future and present was 0.61 K, which might be significant to the performance of a GSHP system considering the dependence of the GSHP assumed in this study. For example, if the inlet brane temperatures Tb increased by 0.6 K in the future after 50 years from the present, Figure 9 indicates the COP was no more than 0.1 higher for heating and lower for cooling. The differences were almost neglected, considering the accuracy of the uncertainty of various factors in the GSHP operation simulation.

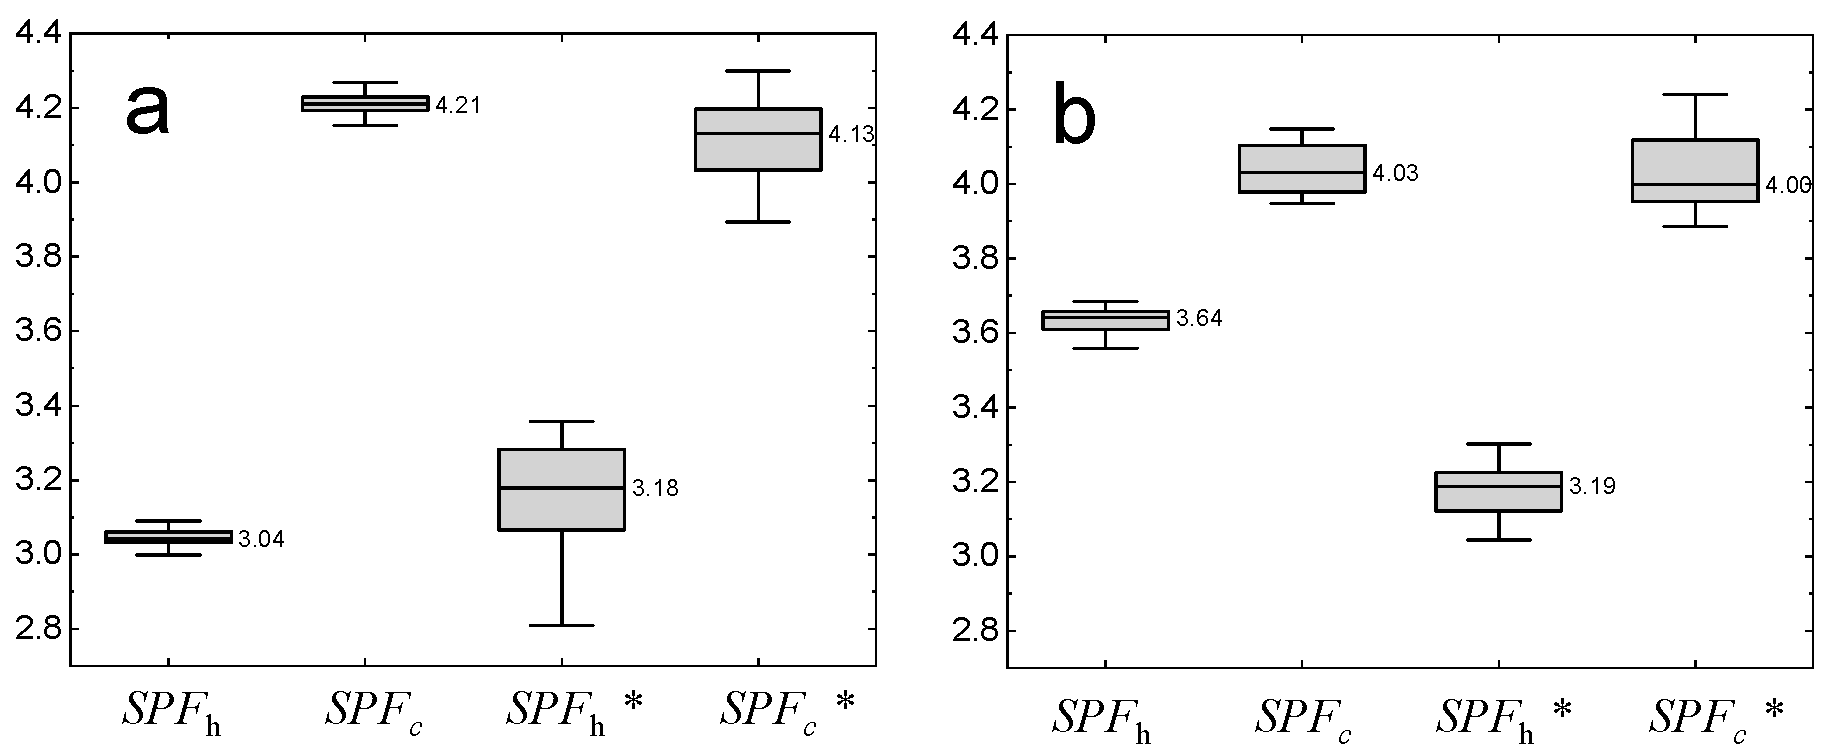
3.2. Seasonal Performance of a Residential GSHP System

The box plots in Figure 12 show the simulation results for the seasonal performance factor for heating (SPFh) and cooling (SPFc) during both 20-year periods for both cities. In Sapporo, the SPFh during the present had a median of 3.04 and a small range of <0.1. The median future SPFh * was 0.14 higher due to decreased heating demands, and the range increased owing to the different future climate conditions. SPFh and SPFh * were not sufficiently high compared with the targeted value, i.e., 4.0 [36], despite the high COP of the GSHP, as shown in Figure 9. This means that the electricity consumption used for circulation pumps and ducts (0.4 kWh in this study) was not neglected in the residential system of limited thermal loads, even in the cold region. For cooling, both present SPFc and future SPFc * showed similar medians of 4.1–4.2, and the range of SPFc * was larger than that of SPFc. This means that the system efficiency was consistent in the northern city, except for some years with exceptionally severe climates. In Tokyo, the median SPFh was 3.64, the range was small, and the value was lower than the targeted value above. SPFh * becomes lower, resulting in its median of 3.19 with a larger range. The decrease of SPFh * was caused by reduced future heating demand in the warm city, while the electricity consumption for the circulation pump and duct system remained relatively consistent. SPFc and SPFc * for cooling showed fairly similar statistics, like in Sapporo. As heating demands were greater than cooling demands in the assumed residence, the GSHP system might be sufficiently efficient for the future when heating demand would be lower.

3.3. Cost Effectiveness of a Residential GSHP System

Figure 13 shows LCC values for the residential GSHP system during the 20-year operation in Tokyo and Sapporo for the present (P) and three other future scenarios (S1, S2, and S3). Table 3 also summarizes two extracted LCC estimates after 10 and 20 years and the simple payback times under different scenarios (P, S1–S3) in Sapporo and Tokyo. The comparable cost for the conventional system consisting of an ASHP and an oil or gas boiler is also shown for each case. The PT value was determined as when the cost increase line of the GSHP system intersected with the line of the conventional system. For the present (P), PT was 16.2 years in Sapporo and over 20 years in Tokyo. One reason for the long PT in Tokyo was the low SPFh reflected the small heating demands. Another reason was the high use of the ASHP (rather than the oil/gas boiler) for the conventional system in Tokyo relative to Sapporo. For the first future scenario (S1), the thermal demands for heating decreased, and SPFh * increased relative to that of the present. In contrast, the thermal demands for cooling increased but were smaller than the heating demands. Therefore, the slope of the cost of the GSHP system was lower for the future than the present. This study assumed that the initial cost of the GSHP system was reduced from 2.3 to 1.8 million JPY. However, the slope of the cost of the conventional system also reduced due to decreased thermal demands and increased outdoor temperatures. This made PT for S1 no less than for the present in Sapporo and more prolonged than in Tokyo. For the second future scenario (S2), the cost of the GSHP system was not changed, but the conventional system had increased costs because the oil and gas prices were assumed to double those in the present; this gave the shortest PT of 8.4 for Sapporo, but still over 20 years for Tokyo. The long PT in Tokyo was because the ASHP was used mainly for heating, and its COP would increase owing to increased future outdoor temperatures, similar to the GSHP. For the third future scenario (S3), PTs in both cities increased by less than one year from those in S2, indicating the lower importance of electricity prices than oil and gas prices on PT if we assume a constant ratio of ASHP, oil boiler, and gas boiler use.

4. Discussion

This study predicted future soil temperature through a 1D simulation of heat transfer in the downward direction. The calculated temperatures Td at a depth of 50 m for a BHE of standard length (100 m) would increase little, by around 1 K on average for 2076–2095 in both Sapporo and Tokyo. The prediction results were considered reasonable, considering the increases of Ta were also no more than 2 K. This simulation also found the stability of Td as the temperatures of heat sources remained despite the hourly fluctuations of the outdoor temperatures. Considering the sensitivity of the COP of the GSHP to the inlet temperatures of entering brane Td, the increase of Td in the future had a much lower effect on the performance of the GSHP system than another change of thermal demands related to Ta. The soil temperature Ts at a shallow depth of 2 m was also calculated: Ts varied cyclically, both seasonally and daily, with a time lag following the outdoor temperatures, Ta. This means that there is less advantage to a shallow heat exchanger using Ts as a heat source (e.g., a horizontal heat exchanger and energy piles) than a deeper one using Td. The average Ts would be ~2 K higher than the average Ta. Future work should similarly evaluate a GSHP system based on a shallow BHE.
The system performances were calculated for the present (SPFh and SPFc) and future (SPFc * and SPFh *). The values for heating were sufficiently high and increased in the future, and that for cooling remained almost constant in Sapporo, where heating demands were relatively great. Despite the performance efficiency, the 20-year cost analysis showed that the simple payback time (PT) for the second scenario (S2) of unchanged future energy prices was not shorter than in the present because the cost line increased slowly owing to decreased thermal demands in the future. This study found that scenarios with the future doubling of energy prices had the residential GSHP system more cost-effective than in the present. In Tokyo, however, SPFh * was lower than SPFh because the thermal loads were reduced to be too small relative to the energy used to operate the circulation pump and duct fan. The PT in Tokyo was over 20 years in each scenario.
The high initial cost and uncertainty of PT under climate change often prevent customers and developers from installing GSHP systems, especially residential systems. This study establishes that a residential GSHP system would remain cost-effective in cold areas such as Sapporo, and its cost-effectiveness would increase as energy prices increase. However, the residential GSHP system might not be cost-effective in ware areas such as Tokyo, where thermal demands, especially for heating, are limited and set to decrease. Obtaining cost-effectiveness in such warm areas requires reduced capital costs for installing the BHE and GSHP and improved overall efficiency by reducing the system’s electricity consumption. Finally, some uncertainty remains in other conditions and future scenarios. The thermal demands would change with the city location, climate scenario, and assumed residence. Soil temperature predictions would also change with the climate and soil conditions and might greatly affect the thermal performance of the borehole heat exchanger more, even if deep underground. It is also important to evaluate the sensitivity of GSHP’s COP to the heat source temperature. The system ‘s performance and 20-year cost depend on electricity consumption, energy prices, and performance advantages (high SPFh and SPFc) compared with conventional systems. Although more detailed and realistic conditions should be assigned to the design and planning of the system at an actual site, this study examined the differences in the long-term efficiency and cost-effectiveness of a residential GSHP system in cold and warm cities in different scenarios of energy prices. The present findings revealed the problem of the GSHP system in the country and may aid the growth of the GSHP market and help establish targets for research and development to reduce costs and improve efficiency.

5. Conclusions

This study evaluated the operating performance of a residential GSHP system in the future under climate change considering all engineering factors in climatology, geology, and building environments in cold and warm climates of Japan. Hourly climate data were used to establish demand peaks for realistic performance estimation. The prediction of future outdoor temperatures was statistically modified from the previous projection data; the outdoor temperature was set to increase by ~3 K in both cities for the case of climate change. Future annual heating demands are set to decrease by ~40%. The increased cooling demands were much smaller than the heating demands, similar to the present. Soil temperature was calculated daily using a 1D numerical heat conduction and advection simulation. Soil temperatures at a middle depth of a borehole heat exchanger (50 m) were modeled to increase by ~1 K in the future, which might not significantly affect the performance of a BHE. However, the temperatures at 2 m depth were more variable and higher than the outdoor temperatures, indicating a potential influence on any system based on a shallow heat exchanger.
Seasonal performance factors for heating increased slightly in Sapporo, which has relatively large thermal demands but decreased in Tokyo owing to the operating energy input needed for the small heating demands. Factors for cooling were mostly the same in both cities. The simple payback time for the present was 16.2 years in Sapporo but more than 20 years in Tokyo. The payback times in both cities were not changed for the future scenario that assumes the same 20-year trends in energy prices. However, the economic scenarios assuming that oil and gas prices double have the payback time reduced by half in Sapporo, reflecting the sensitivity to oil and gas prices of conventional systems. On the other hand, the payback time remained over 20 years in Tokyo in the future scenarios owing to the small future thermal demands. This means that the cost-effectiveness of the GSHP system is changed more in cold cities with large thermal demands than in warm cities. Technology development or cost-saving products would be required to make the GSHP system more cost-effective in a warm city.
This study remains some limitations to address in a future study. The analysis will be conducted on different scenarios of climate change. Other prediction databases by some institutes and organizations, for example [37], are available. This study assumed only one residence as a standard in Japan. However, the analysis would differ in various cases, such as insulation level, floor area, and human activity. The configurations of the GSHP system were also assumed; the factors, such as the COP of a GSHP product (Figure 9) and the length of BHE (100 m in this study), affected the simulation results. In addition, a BHE could be changed to another type of ground heat exchanger, such as a horizontal heat exchanger. Geologic components in the underground formation and its ground thermal conductivity are generally variable at locations within each city. In particular, this study neglected an advection effect of groundwater flow. If groundwater flows fast, as often seen in Japan, the performance of GSHP systems can enhance and reduce the payback times of the systems. This study assumed the energy prices would double in scenarios S2 and S3, but the increase ratio was uncertain. The future study will discuss the sensitivity of the ratios on LCC and the cost-effectiveness of a residential GSHP system.

Author Contributions

Conceptualization, formal analysis, visualization, and writing—original draft preparation, project administration, and funding acquisition, Y.S.; data curation and investigation, Y.A.; methodology and supervision, writing—review and editing, T.K.; validation, writing—review and editing, and supervision, K.N. All authors have read and agreed to the published version of the manuscript.

Funding

This research was financially supported by the Fund for the Promotion of Joint International Research (Fostering Joint International Research (A): No. 19KK0370.

Data Availability Statement

Not applicable.

Conflicts of Interest

The authors declare no conflict of interest.

References

  1. IEA Tracking Buildings 2020 Heating and Cooling. Available online: https://www.iea.org/reports/tracking-buildings-2020 (accessed on 25 December 2021).
  2. Kavanaugh, S.; Rafferty, K. Geothermal Heating and Cooling; ASHRAE: Atlanta, GA, USA, 2014. [Google Scholar]
  3. Schiel, K.; Baume, O.; Caruso, G.; Leopold, U. GIS-based modelling of shallow geothermal energy potential for CO2 emission mitigation in urban areas. Renew. Energy 2016, 86, 1023–1036. [Google Scholar] [CrossRef]
  4. Lund, J.W.; Boyd, T.L. Direct utilization of geothermal energy 2015 worldwide review. Geothermics 2016, 60, 66–93. [Google Scholar] [CrossRef]
  5. FY2020 Report of Shallow Geothermal Energy Utilization in Japan. Available online: https://www.env.go.jp/press/files/jp/115893.pdf (accessed on 12 July 2021).
  6. Hamada, Y.; Ochifuji, K.; Nakamura, M.; Nagano, K. Energy Balance of Low Energy House with Ground Source Heat Pump in Hokkaido. In Proceedings of the 34th Intersociety Energy Conversion Engineering Conference, Vancouver, BC, Canada, 2–5 August 1999. SAE Technical Paper, 1999-01-2667. [Google Scholar] [CrossRef]
  7. Nagano, K.; Katsura, T.; Takeda, S. Development of a design and performance prediction for the ground source heat pump system. Appl. Therm. Eng. 2006, 26, 1578–1592. [Google Scholar] [CrossRef]
  8. Nagano, K. The progress of GSHP in Japan. IEA Heat Pump Cent. Newsl. 2015, 33, 21–25. [Google Scholar]
  9. Iba, C.; Takano, S.; Hokoi, S. An Experiment on Heat Recovery Performance Improvements in Well-Water Heat-Pump Systems for a Traditional Japanese House. Energies 2018, 11, 1023. [Google Scholar] [CrossRef] [Green Version]
  10. Shrestha, G.; Yoshioka, M.; Fujii, H.; Uchida, Y. Evaluation of Suitable Areas to Introduce a Closed-Loop Ground Source Heat Pump System in the Case of a Standard Japanese Detached Residence. Energies 2020, 13, 4294. [Google Scholar] [CrossRef]
  11. Sakata, Y.; Katsura, T.; Nagano, K. Nation-scale evaluation of CO2 emission reduction by ground source heat pump systems. J. JSCE 2018, 74, I_359–I_367. [Google Scholar] [CrossRef]
  12. NEDO Annual Report 2019. Available online: https://www.nedo.go.jp/events/report/ZZFF_100015.html (accessed on 1 October 2022).
  13. Liu, M.; Hino, T.; Ooka, R.; Choi, K.W.W.; Lee, D.; Ikeda, S. Development of distributed multiple-source and multiple-use heat pump system using renewable energy: Outline of test building and experimental evaluation of cooling and heating performance. Jpn. Archit. Rev. 2021, 4, 241–252. [Google Scholar] [CrossRef]
  14. Bina, S.M.; Fujii, H.; Tsuya, S.; Kosukegawa, H. Comparative study of hybrid ground source heat pump in cooling and heating dominant climates. Energy Convers. Manag. 2022, 252, 115122. [Google Scholar] [CrossRef]
  15. Sakata, Y.; Katsura, T.; Nagano, K. Importance of groundwater flow on life cycle costs of a household ground heat pump system in Japan. J. JSRAE 2018, 35, 365–370. [Google Scholar] [CrossRef]
  16. Ree, S. Advances in Ground Source Heat Pump Systems; Elsevier: Duxford, UK, 2016. [Google Scholar]
  17. GLHEPro 4.1 for Windows User’s Guide. Available online: https://hvac.okstate.edu/sites/default/files/GLHEPRO_4.1_Manual.pdf (accessed on 1 February 2023).
  18. BEED v3.2. Earth Energy Designer. 2015. Available online: www.buildingphysics.com.http://www.buildingphysics.com/manuals/EED3.pdf (accessed on 1 February 2023).
  19. Kevin, K.W.; Danny, W.; Li, H.W.; Liu, D.; Lam, J.C. Future trends of building heating and cooling loads and energy consumption in different climates. Build. Environ. 2011, 46, 223–234. [Google Scholar] [CrossRef]
  20. Wang, H.; Chen, Q. Impact of climate change heating and cooling energy use in buildings in the United States. Build. Environ. 2014, 82, 428–436. [Google Scholar] [CrossRef] [Green Version]
  21. Bodri, L.; Cermak, V. Borehole Climatology: A New Method How to Reconstruct Climate; Elsevier: Oxford, UK, 2007. [Google Scholar]
  22. Huang, S.; Pollack, H.N.; Shen, P.Y. Temperature trends over the past five centuries reconstructed from borehole temperatures. Nature 2000, 403, 756–758. [Google Scholar] [CrossRef] [Green Version]
  23. Taniguchi, M.; Hokman, I.P. (Eds.) Groundwater Response to Changing Climate; CRC Press: Boca Raton, FL, USA, 2010. [Google Scholar]
  24. Kim, S.K.; Lee, Y. Evaluation of ground temperature changes by the operation of the geothermal heat pump system and climate change in Korea. Water 2020, 12, 2931. [Google Scholar] [CrossRef]
  25. Kharseh, M.; Althorkmany, L.; Al-Khawaja, M.; Hassani, F. Analysis of the effect of global climate change on ground source heat pump systems in different climate categories. Renew. Energy 2015, 78, 219–225. [Google Scholar] [CrossRef]
  26. Shen, P.; Lukes, J.R. Impact of global warming on performance of ground source heat pumps in US climate zones. Energy Convers. Manag. 2015, 101, 632–643. [Google Scholar] [CrossRef]
  27. Japan Meteorology Association (JMA). Weather Data Base. Available online: https://www.data.jma.go.jp/ (accessed on 15 May 2020).
  28. Japan Meteorology Association (JMA). Global Warming Projection (Volume 8). Available online: https://metadata.diasjp.net/dmm/doc/JMA_GWP-DIAS-ja.html (accessed on 15 May 2020).
  29. Building Research Institute of Japan. Available online: https://www.kenken.go.jp/becc/house.html (accessed on 25 September 2021).
  30. The Society of Hyper-Enhanced Insulation and Advanced Technology Houses for the Next 20. Available online: https://www.heat20.jp/grade/ (accessed on 25 September 2021).
  31. PC-Progress, Hydrus 1D. Available online: https://www.pc-progress.com/en/Default.aspx?hydrus-1d (accessed on 15 May 2020).
  32. Katsura, T.; Nagano, K.; Takeda, S. Method of calculation of the ground temperature for multiple ground heat exchangers. Appl. Therm. Eng. 2008, 28, 1995–2004. [Google Scholar] [CrossRef]
  33. Akabayashi, S.; Sakaguchi, J.; Ohashi, T.; Ichikawa, H.; Ainami, H. Study on ate of COP and regional characteristics of APF for room air conditioners. AIJ J. Technol. Des. 2014, 20, 187–190. Available online: https://www.jstage.jst.go.jp/article/aijt/20/44/20_187/_pdf (accessed on 10 January 2020). [CrossRef] [Green Version]
  34. Mitsubishi Research Institute. Report on Energy Consumption Survey on FY2012. 2012; pp. 56–58. Available online: https://dl.ndl.go.jp/info:ndljp/pid/11252733 (accessed on 21 January 2022).
  35. The Institute of Energy Economics. EDMC/Energy and Economic Statistics Handbook 2021; The Energy Conservation Center: Tokyo, Japan, 2021; 360p. [Google Scholar]
  36. EN 15450:2007; Heating Systems in Buildings—Design of Heat Pump Heating Systems. The European Committee for Standardization (CEN): Brussels, Belgium, 2007; 46p.
  37. Ishii, M.; Mori, N. d4PDF: Large-ensemble and high-resolution climate simulations for global warming risk assessment. Prog. Earth Planet. Sci. 2020, 7, 58. [Google Scholar] [CrossRef]
Figure 1. Topographic map of Japan showing Sapporo and Tokyo, the cities analyzed in this study.
Energies 16 02742 g001
Figure 2. Histograms of hourly outdoor temperatures in Sapporo: (a) observation and prediction for 1981–1999 and (b) projection and modification in this study for 2076–2095.
Energies 16 02742 g002
Figure 3. Monthly averages of outdoor temperatures with standard deviation for Sapporo and Tokyo, Japan, for the present (2001–2020) and future (2076–2095).
Energies 16 02742 g003
Figure 4. Histograms of hourly thermal pulses for heating (left) and cooling (right) in (a) the present (2001–2020) and (b) the future (2076–2096) in Sapporo, and in (c) the present and (d) the future in Tokyo.
Energies 16 02742 g004
Figure 5. Average annual thermal loads [GJ/y] for heating (left) and cooling (right) in the present (2001–2020) and future (2076–2095) in Sapporo and Tokyo, Japan.
Energies 16 02742 g005
Figure 6. Mesh design of the heat transfer simulation for (a) Sapporo and (b) Tokyo.
Energies 16 02742 g006
Figure 7. Comparison of observed and calculated soil temperatures in boreholes in (a) Sapporo and (b) Tokyo.
Energies 16 02742 g007
Figure 8. A schematic of a residential GSHP system for this analysis.
Energies 16 02742 g008
Figure 9. Relationship of coefficient of performance (COP) with inlet temperature of entering brine as heat source for a product of 10 kW GSHP.
Energies 16 02742 g009
Figure 11. Calculation results of ground temperature at a depth of 2 m, Ts, and 50 m, Td, in (a) the present and (b) the future in Sapporo.
Energies 16 02742 g011
Figure 12. Box plots of seasonal performance factors for heating and cooling in 20-year periods in the present and future and in (a) Sapporo and (b) Tokyo.
Energies 16 02742 g012
Figure 13. LCC estimates for a residential GSHP system (straight lines) and comparative systems (broken lines) in Tokyo (red) and Sapporo (blue) in the present (P) and future scenarios S1, S2, and S3.
Energies 16 02742 g013
Table 1. Summary of outdoor temperature Ta and degree days Dd for the present (2001–2020) and future (2076–2095) in Sapporo and Tokyo, Japan. Future data were modified from JWA (2019), as the probabilistic distributions for 1981–1999 were matched to the projections. Degree days are the summation of differences between daily averaged temperatures and thresholds, 18 °C for heating and 24 °C for cooling.
PeriodSapporoTokyo
Ta [°C]Dd [Day·K]Ta [°C]Dd [Day·K]
AveMaxMinHeatingCoolingAveMaxMinHeatingCooling
2001–20209.435.7 14.834682016.638.9 3.61514264
2076–209512.039.2 13.6280810819.743.2 0.4819490
Table 2. Summary of soil temperature calculations, Ts and Td, at a depth of 2 m and 50 m, respectively.
PeriodCategorySapporoTokyo
TaTsTdTaTsTd
2001–2020ave[ ° C ]9.4011.6510.5216.6019.3517.73
slope[ ° C / 100 y ]6.966.002.561.451.460.29
2076–2095ave[ ° C ]11.3613.6611.9919.5120.9618.34
slope[ ° C / 100 y ]6.905.962.095.174.011.15
Table 3. Summary of estimated LCC after the 10 and 20 years, LCC10 and LCC20 [×106 JPY] and the simple payback time PT [years] in different scenarios of climate change in Sapporo and Tokyo.
PeriodSapporoTokyo
LCC10LCC20PTLCC10LCC20PT
P3.64.616.23.13.8>20
S12.53.316.02.32.6>20
S22.73.48.42.22.7>20
S33.14.58.52.53.320.0
Disclaimer/Publisher’s Note: The statements, opinions and data contained in all publications are solely those of the individual author(s) and contributor(s) and not of MDPI and/or the editor(s). MDPI and/or the editor(s) disclaim responsibility for any injury to people or property resulting from any ideas, methods, instructions or products referred to in the content.

