Article

Numerical Investigation of Pelton Turbine Distributor Systems with Axial Inflow

Institute of Energy Systems and Thermodynamics, TU Wien, Getreidemarkt 9/BA, A-1060 Vienna, Austria
*
Author to whom correspondence should be addressed.
Energies 2023, 16(6), 2737; https://doi.org/10.3390/en16062737
Submission received: 15 February 2023 / Revised: 3 March 2023 / Accepted: 9 March 2023 / Published: 15 March 2023
(This article belongs to the Special Issue Selected Contributions of the ViennaHydro 2022)

Abstract

:
In an agile power grid environment, hydroelectric power plants must operate flexibly to follow the demand. Their wide operating range and high part-load efficiencies allow for multi-injector Pelton turbines to fulfil these demands as long as the water jet quality is maintained. The water jet shape is governed by the flow in the distributor system. Pelton distributor systems with axial feed can potentially reduce the costs of the power station. Providing the flow quality at the nozzle outlet challenges the design of such Pelton distributors. Therefore, numerical simulations are performed to optimise a parameterised Pelton distributor system with axial feed. The effects of geometric parameter variations on its performance are studied. The criteria to evaluate the flow in distributor systems are presented, which are applied to quantify the power losses and secondary flows. Additionally, the second law analysis illustrates where the losses are generated. Due to various pipe bends, all designs exhibit a distinct S-shaped secondary flow pattern at the nozzle inlet. The simulations reveal that the power losses are greatly reduced by shaping the initial part of the branch line as a conical frustum. Deviation angles of the branch line close to 90° allow for lower secondary flow magnitudes at the nozzle inlet.

1. Introduction

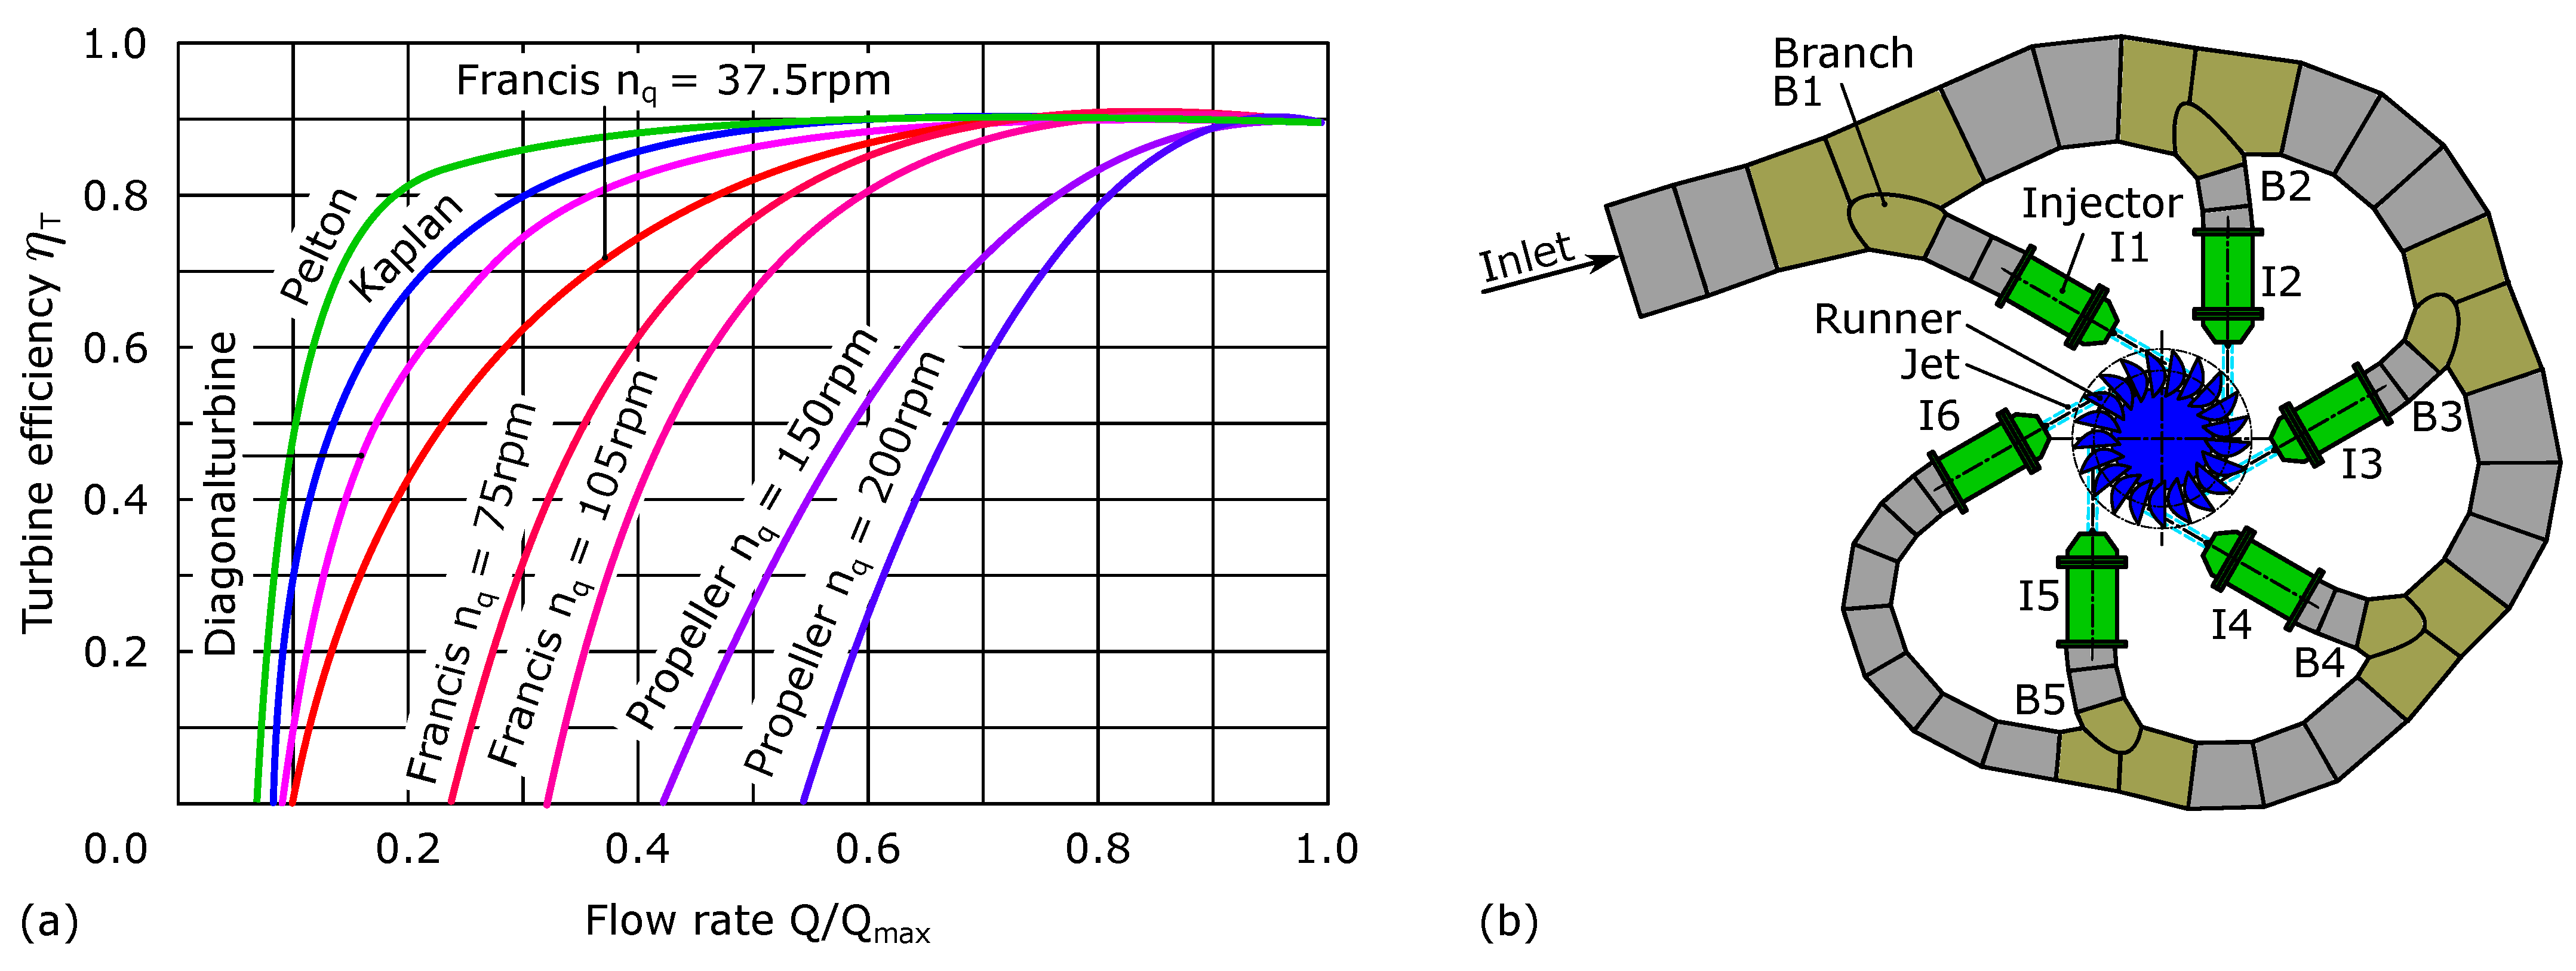
The environmental goals of the European Union and the Austrian federal government [1] motivate the expansion of renewable energy sources. Photovoltaic and wind power are intermittent renewable energy sources, where the supply does not necessarily coincide with the demand. Storage and pump-storage hydropower plants, together with locally distributed small hydropower, ensure the capability of storing surpluses from intermittent renewable energy sources and compensating for slack periods in the electricity market. Thereby, hydropower can stabilise the power grid, where excellent controllability and part-load operability must be provided. Multi-injector fed Pelton turbines are exceptionally suitable for such applications due to their wide operating range and high part-load efficiencies (Figure 1) as long as a high-quality free-surface jet can be maintained. Past research has proved the correlation between water jet quality and turbine efficiency [2,3].
With conventional Pelton turbine distributors feeding the flow to the injectors, a high-quality free surface flow is only achieved when the turbine is operated close to its design conditions. Potential tear and water jet deformation in off-design operating conditions induce additional momentum transfer losses during jet–bucket interactions, resulting in reduced efficiencies [4,5,6]. The conventional Pelton turbine distributor design is disadvantageous regarding manufacturing effort and costs, e.g., each of the five branches, from B1 to B5, have different hydraulic shapes. This, in particular, is a burden for small hydropower plants where construction and manufacturing costs are a decisive factor. Hence, a design providing the same inflow conditions to every injector yet all the same consisting of simple, standardised pipe sections is desirable. A possible design approach for such Pelton turbine distributors has been shown by Erlach and Staubli [7], as well as Erlach and Erlach [8,9].
Figure 1. Curves of turbine efficiency ηT against the flow rate Q normalised by the maximum flow rate Qmax for common turbine types, recreated and modified from [10] (a). Explanatory sketch for Pelton turbines with conventional distributor system (b).
Energies 16 02737 g001
The present contribution focuses on the flow quality assessment in Pelton turbine distributor systems with axial inflow. The criteria for comparing the system losses and the amount of secondary flow are presented. By numerical flow simulation, four basic manifold designs are evaluated. The impact of parametric design changes on the flow in the distributor system is discussed thereafter.

2. Materials and Methods

2.1. Pelton Turbine Distributor System with Axial Inflow—AxFeeder

In contrast to conventional Pelton turbine distributor systems, this new approach of a distributor system, which we call AxFeeder, first described in a patent from 2008 [7], exhibits some significant differences that shall be explained by a universal sketch as depicted in Figure 2. In the flow direction, the penstock line with a diameter D1 is directly connected to the manifold element, where the incoming flow is divided into n equal portions while inducing as few losses and secondary flows as possible. Unlike in conventional distributor systems, where only one branch line separates from the main line at a certain time, here, all n branch lines separate from the manifold at once. The n branch lines, ranging from station 51 (5n) to station 101 (10n), are connected to the manifold with the diameter ALk and the deviation angle δ. The last branch line component is the injector bend, ranging from stations 81 to 101. It is pivoted by the angle γ relative to the branch line. The exact value of γ can be adjusted according to the pitch cycle diameter Dp of the runner.

2.2. Description of Investigated Basic Manifold Designs

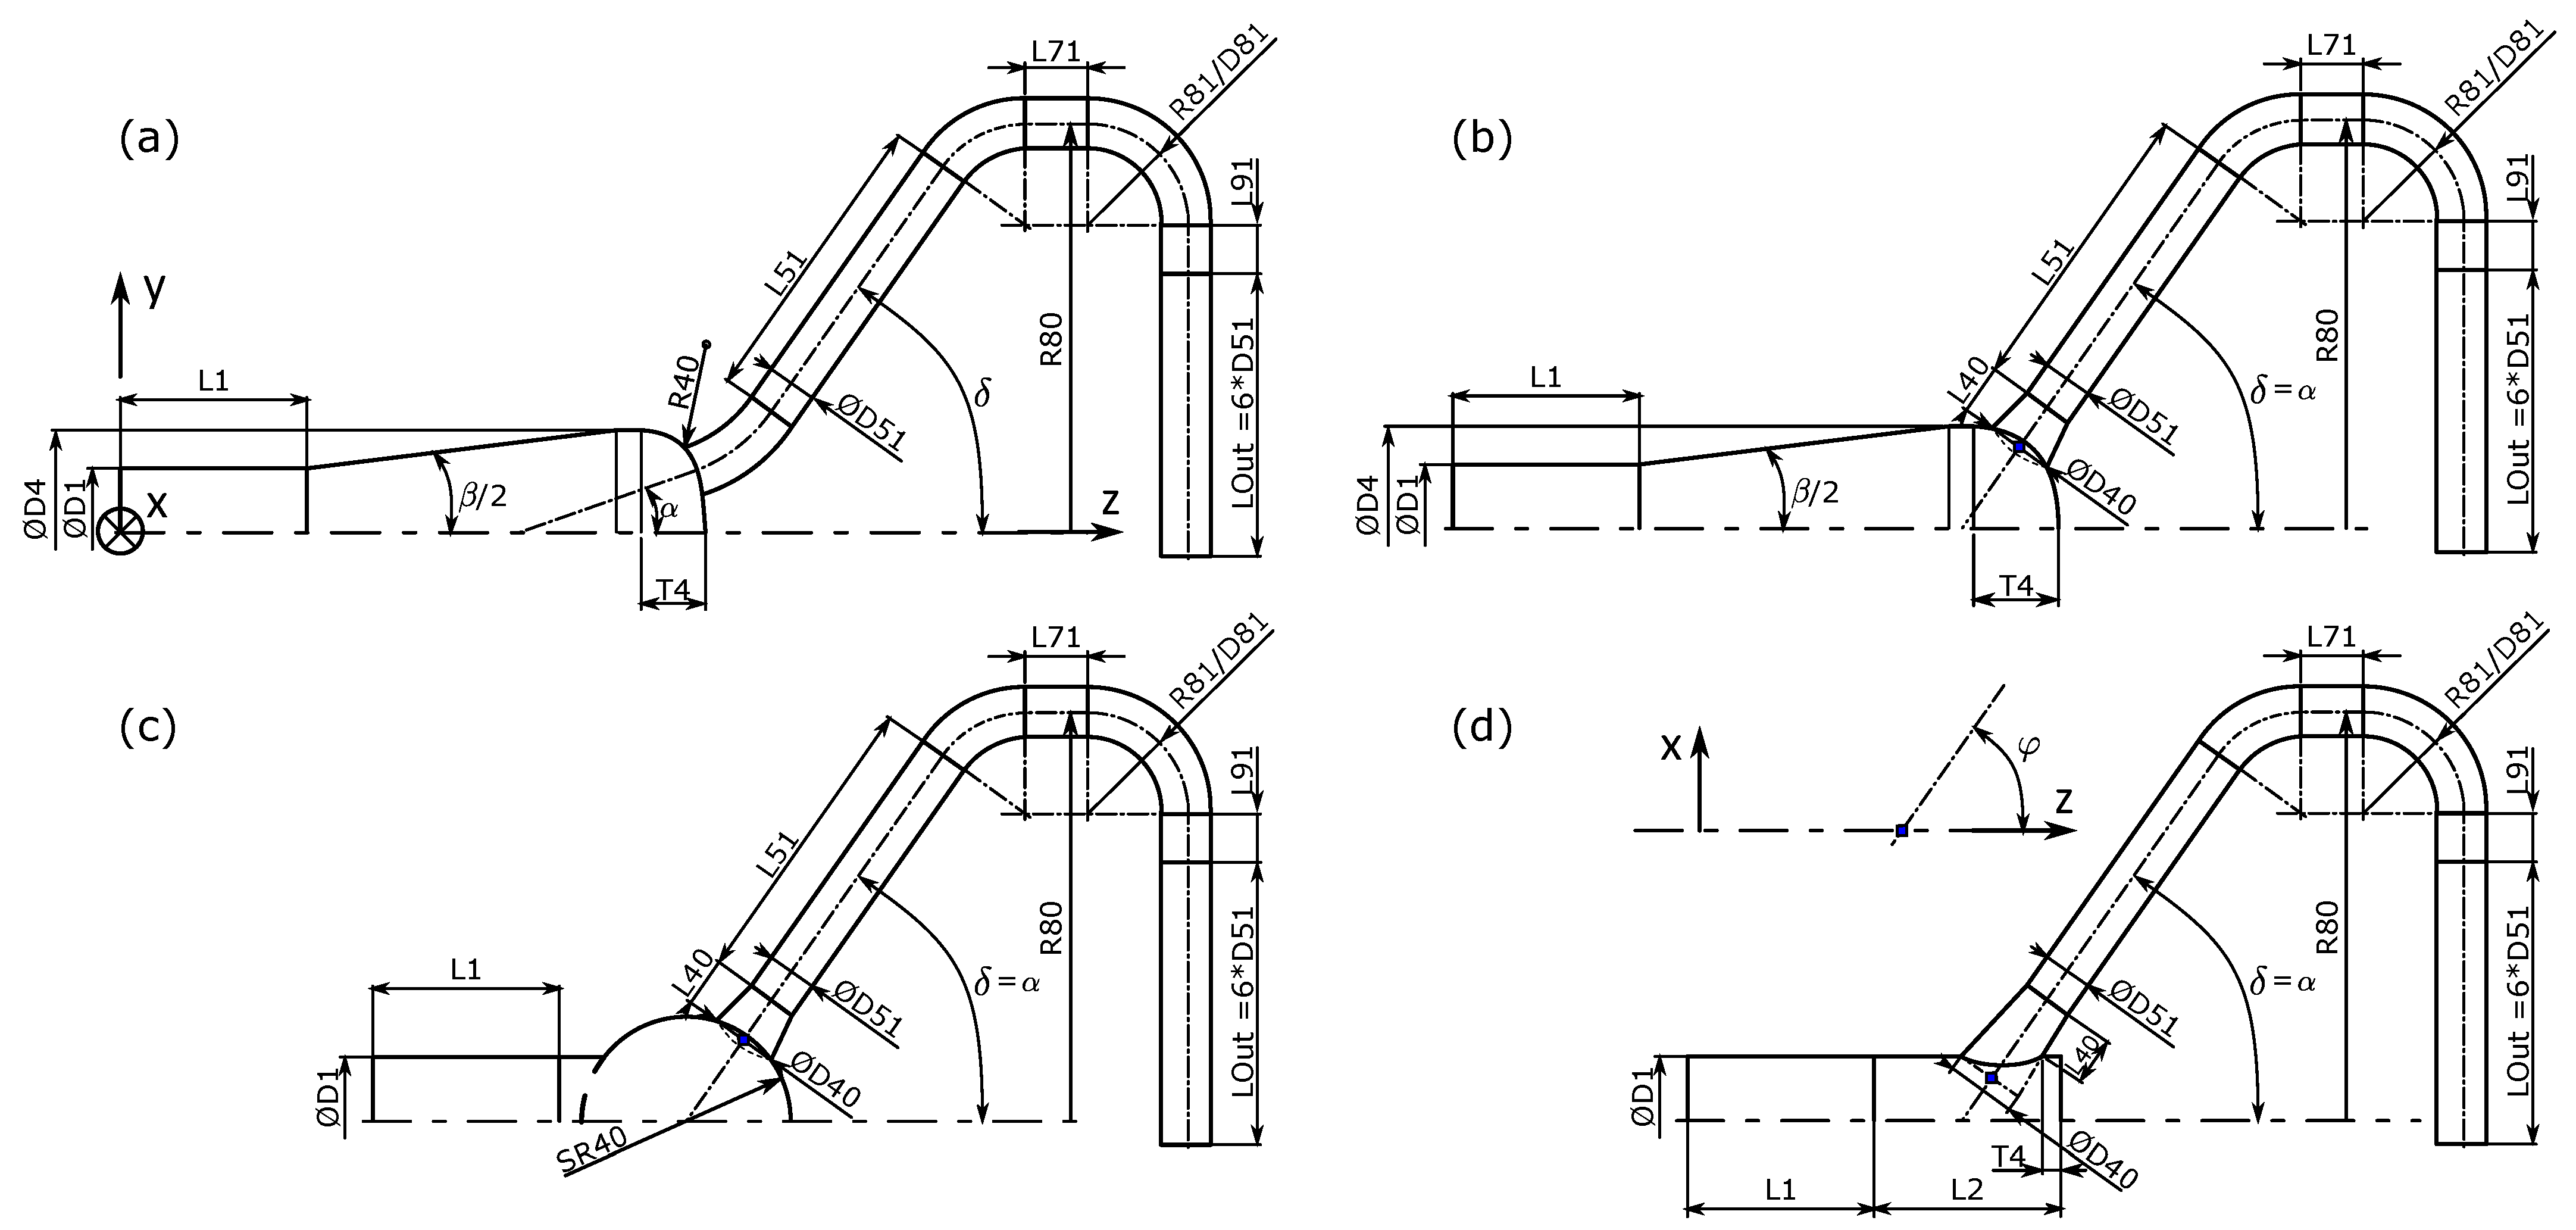
The AxFeeder design should be compact and deliver excellent jet flow quality. Four different distributor designs were investigated, mid-section cuts of which are shown in Figure 3. Starting from a basic model (Figure 3a), which was also used for the grid refinement and symmetry study, these four designs can be mainly distinguished by the manifold body; while the basic designs shown in Figure 3a,b have a diffuser-shaped manifold, the variants (c) and (d) have spherical and cylindrical manifold bodies, respectively. The first branch line section is shaped similarly to a conical frustum (except for the basic model (a)). This allows for a smoother transition between the manifold and the branch lines. While the diffuser-shaped manifold in designs (a) and (b) decelerate the flow before dividing it into n = 6 equal portions, the overall length of the spherical (Figure 3c) and the cylindrical manifold (Figure 3d) is significantly shorter than for the designs (a) and (b). Therefore, the one main goal of the parameter study presented in Section 3 is to evaluate the effects of these four different designs on the flow quality at the interface of the injector (station 101).

2.3. Flow Quality in Piping Systems

For Pelton turbines, the flow quality in the distributor pipe is determined by both the pressure losses and the flow disturbances. These flow perturbations are generated at bends and bifurcations of the distributor pipe. Thereby, the jet shape is deteriorated [11], which ultimately worsens the water jet–bucket interaction. While pressure sensors can directly measure the pressure losses in the distributor, the losses due to disturbances cannot be evaluated directly. Thus, many researchers opted to measure the turbine efficiency instead [2,3,5,12]. Investigations in the framework of Pelton turbines that compute the pressure losses in the distributor typically describe the losses in the form of a normalised total pressure drop similar to Equation (1). This normalised total pressure drop is frequently labelled as “energy loss” [13] or “head loss” [12,14]. In other industrial applications, e.g., reactor design [15] and piping systems [16,17], the total pressure drop is expressed as a “pressure resistance coefficient”, similar to Equation (2).
To understand the mechanisms leading to the disturbances in the flow, often local quantities, such as velocity profiles [11,12], contour plots of secondary velocity [12], vorticity [11], or streamlines, are analysed qualitatively. Attempts to quantify these local quantities for Pelton turbine distributors are rare. Patel et al. [14] analysed a non-dimensionalised form of the secondary kinetic energy.
We introduce two forms to compute the power losses in addition to the total pressure drop. A criterion to rate the flow disturbances is formulated by defining the secondary velocity ratio. These quality criteria are ultimately applied to rate the design variants described in Figure 3.

2.3.1. Total Pressure Drop

For the assessment of the “quality” of internal flow systems, i.e., Pelton turbine distributors, a commonly used quantity is the total pressure drop Δ p t = p t , inlet p t , outlet between inlet and outlet station. This total pressure drop is often normalised by the geodetic head, H, of the power station resulting in the expression
η distributor = 1 Δ p t ρ g H = 1 p t , inlet p t , outlet ρ g H = p t , outlet ρ g H ,
which represents the hydraulic efficiency. For the purpose of defining loss quantities, we assumed that p t , inlet ρ g H . The dependency on the geodetic head illustrates the proportional losses of the total supplied energy. Due to the referencing to a specific supplied energy level, the hydraulic efficiency, η distributor , is not suitable for comparing the quality of different Pelton turbine distributor designs.

2.3.2. Power Loss—Classical Approach

Alternatively, the total pressure loss coefficient, Kpt, can be defined in the form [16,17]
K p t = 2 · p t , inlet p t , outlet ρ u inlet 2 ,
which is commonly used for piping systems. For systems with one inlet and n outlets, like all Pelton turbine manifolds, a better way is to extend the definition of Kpt by using the fluxes of total pressure p t = p + 0.5 ρ u 2 . Integrated over the entire surface area A with unit normal vector n at the station i,
P m T E , i = A i p + ρ 2 u 2 u · d A
the flux can be also interpreted as the power of mechanical total energy (hence the symbol P m T E ), where u = u , v , w T is the vector of the flow velocity with magnitude | | u | | = ( u 2 + v 2 + w 2 ) . Furthermore, the kinetic energy flux PKE is likewise defined as the area integral of the dynamic pressure p d y n = p t p = 0.5 ρ u 2 at a station i,
P K E , i = A i ρ 2 u 2 u · d A .
Combining Equations (3) and (4) according to the concept of Equation (2), one arrives at the definition of the power loss coefficient between a reference station ref and station i for an arbitrary Pelton turbine distributor pipe
ζ P m T E 1 i = P m T E , ref P m T E , i P K E , ref = A ref p + ρ 2 u 2 u · d A A i p + ρ 2 u 2 u · d A A ref ρ 2 u 2 u · d A .
This definition is independent of the pressure level (head), and therefore, allows for the comparison between different distributor pipes without specific application. Equation (5) can be employed to evaluate a single branch line. A lumped power loss coefficient can be obtained by summing all n individual branch line outlets:
ζ P m T E 1 i = A ref p + ρ 2 u 2 u · d A i = 1 n A i p + ρ 2 u 2 u · d A A ref ρ 2 u 2 u · d A 2 · m ˙ ref · p t , ref i = 1 n m ˙ i · p t , i m ˙ ref · ρ u ref 2 = 2 · p t , ref i = 1 n m i ˙ m ˙ ref · p t , i ρ u ref 2 .
In this form, which was already employed in [18], the power loss coefficient is computed by weighing the individual contributions of every branch line by their mass flow rate.

2.3.3. Power Loss—Second Law Analysis

Instead of computing the losses by balancing the power of mechanical total energy between two stations, the irreversible entropy produced within the system’s borders can be integrated. This approach is based on the second law of thermodynamics. Follows its name the second law analysis (SLA), which was elaborated in [19,20]. Applications of this method have been shown for analysing and optimising conduit components such as bends [21,22], diffusers, nozzles [23], and external flows [24]. The following paragraph gives an overview of the implementation of the SLA concept in the present study. Brief general introductions to this concept in the context of hydraulic machinery can be found in [18,25].
Analogously to Equation (5), a dissipation power coefficient ζΦ can be defined as
ζ Φ = P Turb + P Vis P K E , 1 ,
with PTurb and PVis being the power of turbulent (Turb) and viscous (Vis) dissipation, respectively. These two terms are computed by the volume integrals of the corresponding dissipation terms over the volume of interest
P Turb = V Φ Turb d V and P Vis = V Φ Vis d V .
With Reynolds averaging, the viscous (direct) dissipation ΦVis follows from inserting the time-averaged velocity components u ¯ , v ¯ , w ¯ into the product of shear stresses τij and velocity gradients u i / x j
Φ Vis = τ ¯ i j · u ¯ i x j = μ · 2 · u ¯ x 2 + v ¯ y 2 + w ¯ z 2 + + u ¯ y + v ¯ x 2 + v ¯ z + w ¯ y 2 + u ¯ z + w ¯ x 2 .
The turbulent (indirect) dissipation is calculated using k, ε, and ω (turbulence kinetic energy, turbulent eddy dissipation, and turbulent eddy frequency) as well as the turbulence model coefficient β* = 0.09 as defined in Menter’s k-ω shear stress transport (SST) model [26]
Φ T u r b = ρ · ε = β * ρ ω k .

2.3.4. Secondary Flows

In Pelton turbine distributor systems, secondary flows are mainly caused by (a) changes in flow direction in the distributor pipe and branch lines, (b) flow divisions in the manifold or the branches, and (c) by the interior parts of the injector. Installations, such as baffles or guides, may trigger additional secondary flows. These secondary flows are the primary source of the free water jet disturbances [27]. The typical quantification criteria of the water jet quality, as defined in [27], are jet dispersion, jet deviation, and “out of roundness”. Hence, the lowest amount of secondary flow generation is desirable for Pelton turbine distributors.
The secondary velocity ratio at an arbitrary station i (of an internal flow system) can be defined as
ϕ I I , i = | | u I I | | | | u I | | i = u I I 2 + v I I 2 + w I I 2 u I 2 + v I 2 + w I 2 i ,
with | | u I | | = u · n being the magnitude of the primary flow velocity u I = ( u · n ) · n and | | u I I | | being the magnitude of the secondary flow velocity u I I = u u I = u ( u · n ) · n . The primary flow velocity is the velocity component in principal flow direction n and the secondary flow velocity is the velocity component orthogonal to the principal flow direction, such that u I I · n = 0 . Equation (11) can be evaluated by comparing the momentum fluxes
ϕ I I , i = A i ( ρ | | u I I | | ) u · d A A i ( ρ | | u I | | ) u · d A
at a station of interest. The secondary flow ratios can be summed over all injectors and weighted by the corresponding mass flow rate to obtain a lumped evaluation parameter for rank the overall manifold performance [18]
ϕ I I , i = Σ i = 1 n A i ( ρ | | u I I | | ) u · d A Σ i = 1 n A i ( ρ | | u I | | ) u · d A Σ i = 1 n m ˙ i · | | u I I , i | | Σ i = 1 n m ˙ i · | | u I , i | | .
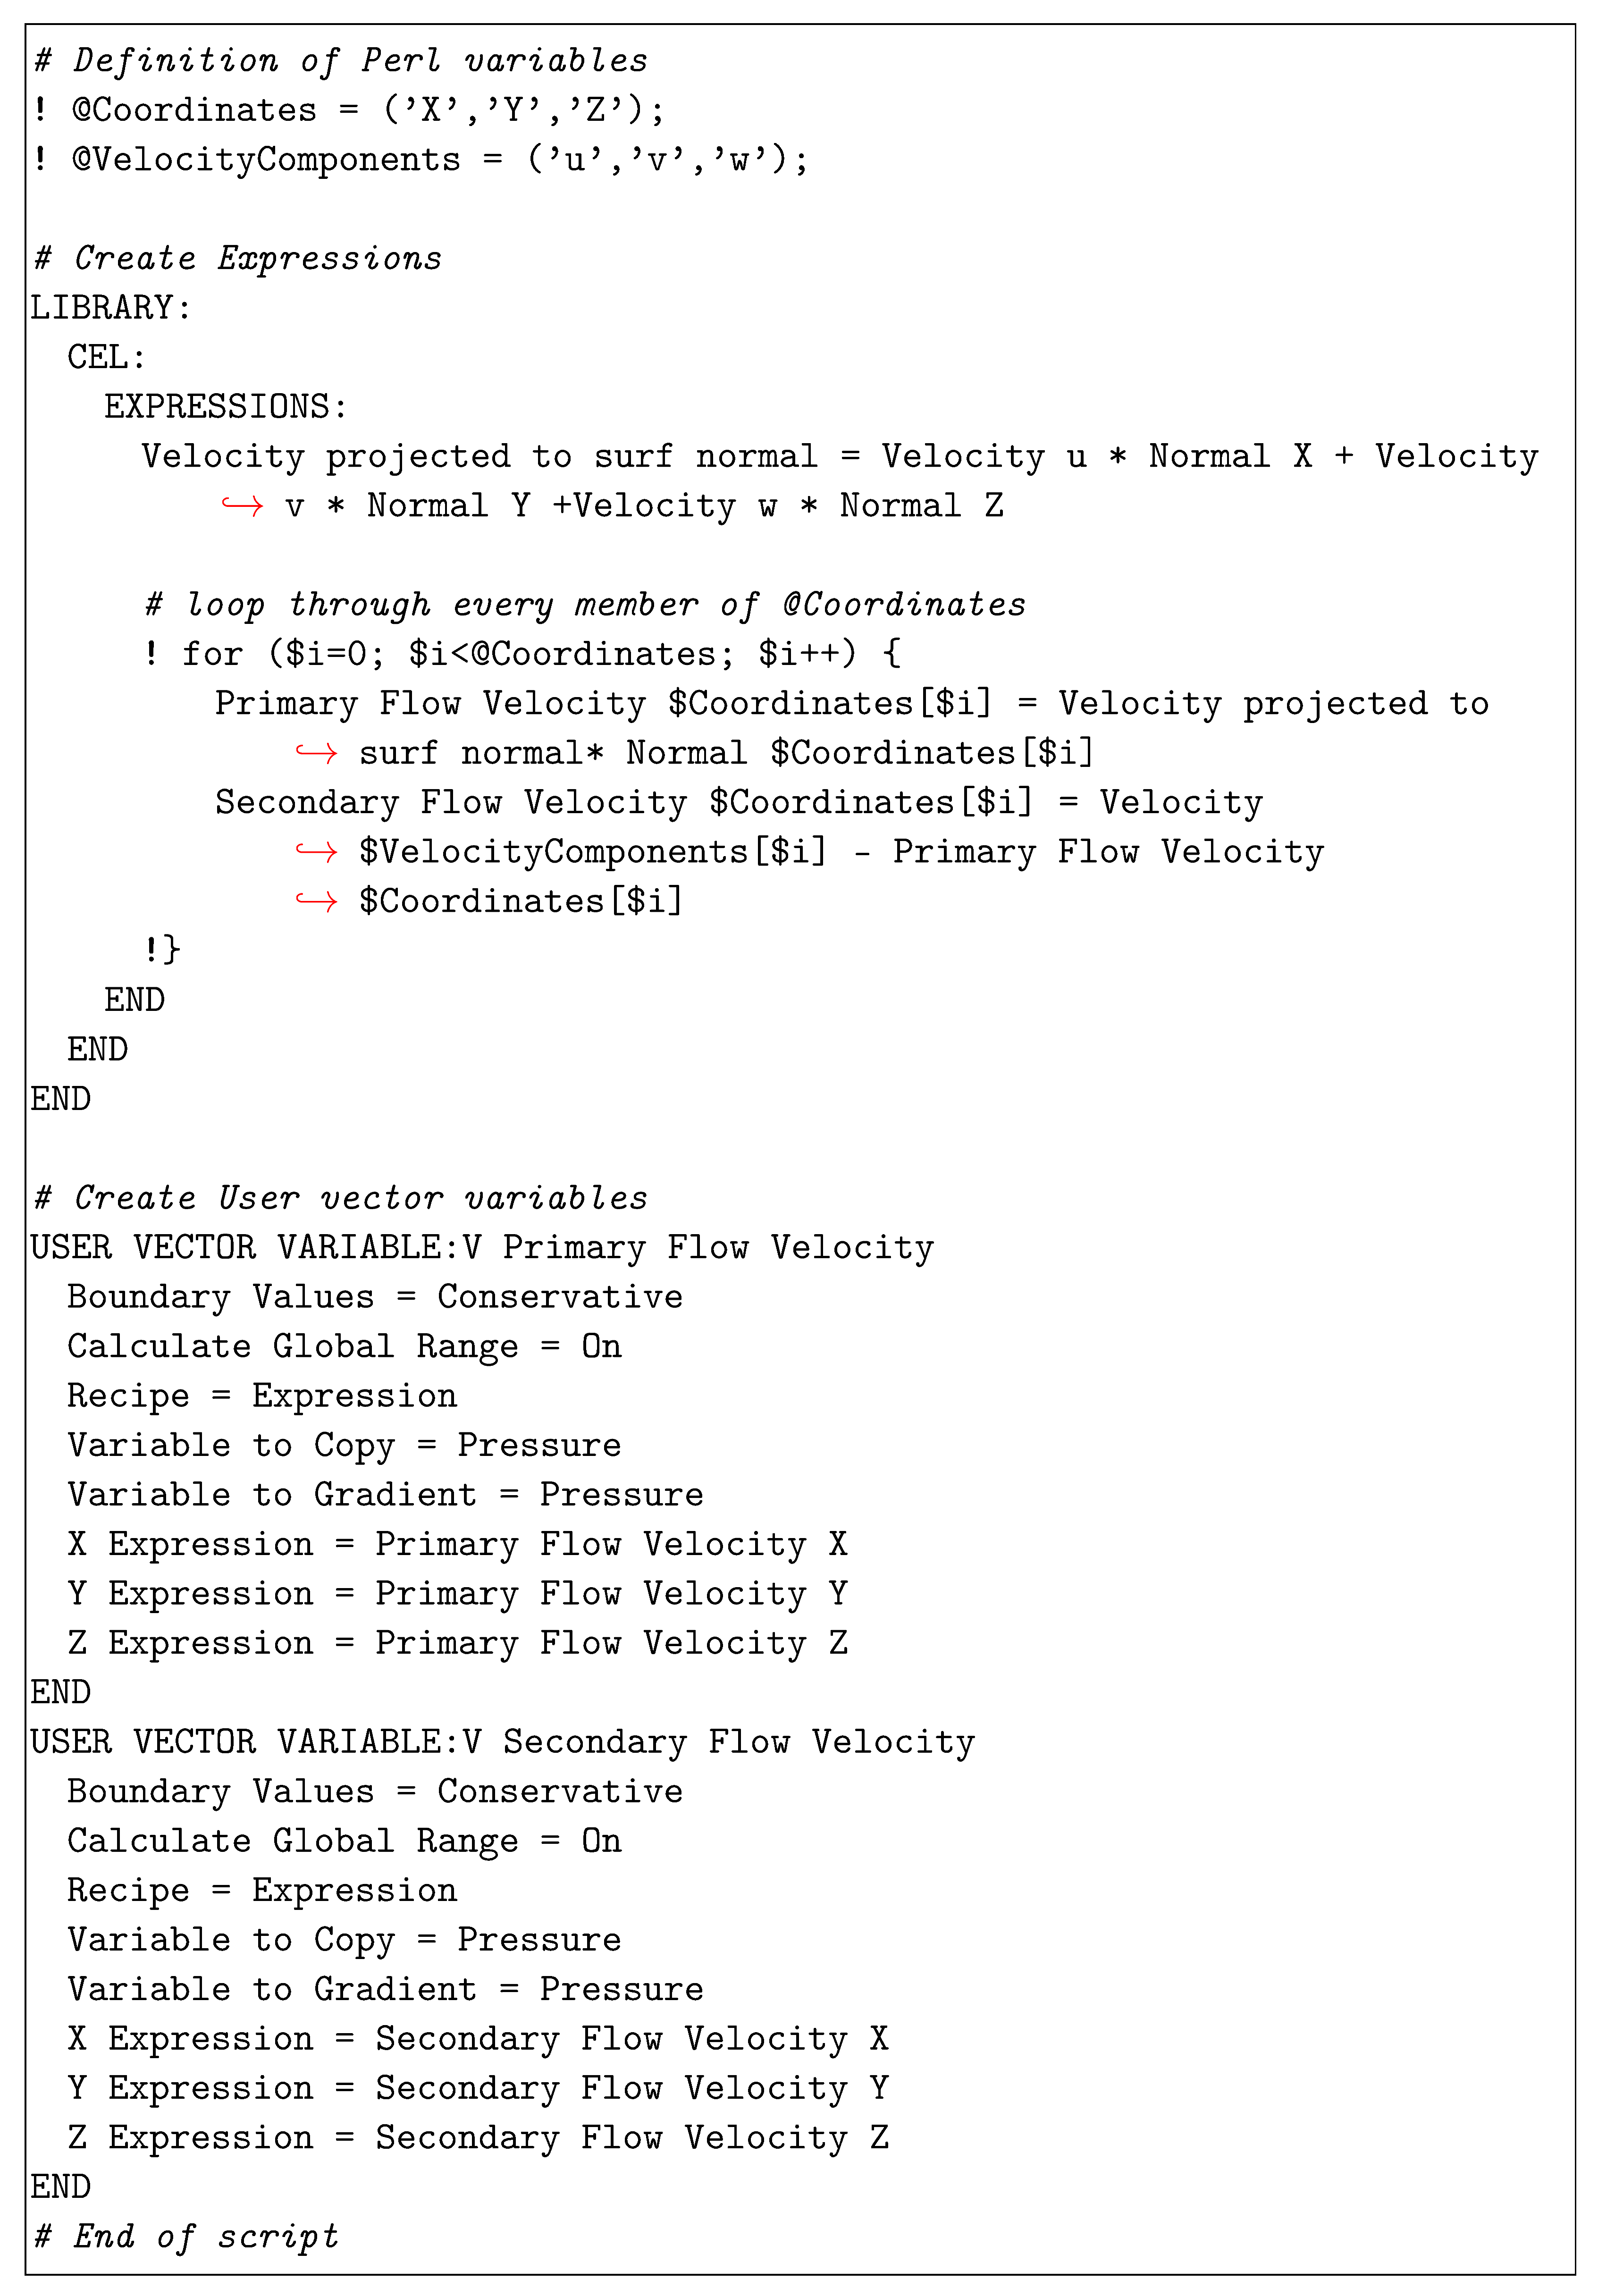
The implementation of the equations necessary to compute the secondary velocities in the post-processing utility is explained in Appendix A.1.

2.4. Computational Domain and Simulation Setup

The aim of this study is the optimisation of the hydraulic design of the manifold and the branch lines. Thus, the injectors were not considered. Instead of the injectors, an outlet body was fitted at the downstream end of each of the branch lines. To ensure a fully developed inflow, the inlet pipe was extended upstream of station 1. The complete model with six branch lines was tested in the grid sensitivity study. For the subsequent parametric optimisation, rotational symmetry was used, i.e., the domain was reduced to a 60° sector model including only one branch line. The differences in the head losses were below 0.5% and the differences in the predicted secondary velocity ratios were about 5%. The computational domain is shown in Figure 4a.
All simulations were conducted with the commercial solver ANSYS CFX 19.2. A top hat velocity profile corresponding to a Reynolds number of 106 was specified at the inlet of all cases. Only for the cases presented in Section 3.1 the Reynolds number was changed. The pressure boundary condition was set to 1 bar at the outlet. A turbulence intensity of 5% together with a turbulent length scale corresponding to the hydraulic diameter of station 1 were set as turbulence boundary conditions at the inlet. At all walls, a no-slip boundary condition was employed and all walls were set to be hydraulically smooth. The flow is assumed to be steady, incompressible, and isothermal. The density and dynamic viscosity of water at 25 °C were set to ρ = 997 kg/m3 and μ = 8.899 × 10⁻⁴ Pa s. The k-ω SST model [26] was employed as turbulence closure. The advection terms were solved using the high-resolution scheme, which is a second-order scheme that automatically blends to a first-order formulation if stability issues arise [28]. The advection of turbulence was discretised by a first-order upwind scheme.

2.5. Grid Refinement Study

A grid resolution study was performed according to the procedure proposed in [29]. Three meshes were composed of hexahedral elements for the pipe segments and the tetrahedral elements in those zones of the manifold were the branch lines attached. The overall node counts for the three meshes were 2.7 × 10⁶, 6.6 × 10⁶ and 16.9 × 10⁶. The maximum y+ value at the walls was below 1 for all investigated cases. The discretisation uncertainties were computed for ζ P m T E , 1001 , ζΦ, and ϕ I I , 100 .
While both head loss coefficients converge monotonically towards their extrapolated values, the secondary velocity ratio exhibits oscillatory convergence (see Figure 4b). The grid convergence index (GCI) for ζ P m T E is just above 1%, indicating excellent convergence, whereas both ζΦ and ϕ I I , 100 are more sensitive to mesh refinements, thus yielding a GCI of 14.6% and 13.7%, respectively. One reason for the higher GCI of the secondary flow can be seen in Figure 4c, in which the normalised velocity magnitude at a horizontal line in station 101 is plotted for the three meshes. At this station, directly downstream of the injector bend there is a velocity deficit at the inner wall of the bend. The exact prediction of this deficit poses an inherent challenge for flow modelling. Therefore, the local GCI values, indicated by the error bars in Figure 4c, are significantly higher than at the rest of the profile. The mean value of the order of accuracy poa lies above three. In order to maintain an adequate balance between computational times and numerical accuracy, the medium mesh was chosen for all subsequent simulations.

3. Results

In this section, the results of the parametric study are described in detail. At first, the operating regime of the AxFeeder is discussed and then, for each of the basic models, the effects of geometric variations on power losses and secondary flows are elaborated. Table 1 provides an overview of the parameters varied for the four basic design models.

3.1. Operating Regime

For determining the operating regime of the distributor system, the model designs as shown in Figure 3 are fully parameterised. This means that the only independent geometric parameter is the diameter D 1 of the penstock line. All other lengths can be scaled with respect to D 1 . The second quantity to be varied is the Reynolds number R e 1 at station 1. By specifying R e 1 and D 1 , the operating point and all dimensions of the AxFeeder are set. The power loss coefficient ζ P m T E , 1011 and the dissipation power coefficient ζ Φ between stations 1 and 101 as well as the secondary velocity ratio ϕ I I , 101 at station 101 for an expected Reynolds number range from 2 × 10 5 to 2 × 10 6 are plotted in Figure 5 for five different diameters D 1 ranging from 100 mm to 500 mm . From these data, three characteristic curves are computed by interpolation, resulting in one trend-line for each, the power loss coefficient, the dissipation power coefficient, and the secondary velocity ratio. All three trend lines follow a power function, e.g., y = k · R e 1 a . They gradually decline, which seems to level off at higher Reynolds numbers. The approximate exponents of the trend lines are 1 / 9 for the power loss, 1 / 8 for the dissipation, and 1 / 16 for the secondary velocity ratio. While the variations of ζ P m T E and ζ Φ are almost negligible, the data points for ϕ I I , 101 display a much wider spread. This observation further indicates that the secondary flow reacts more sensitively to parameter changes. A detailed analysis of the cause of this behaviour will be subject to future studies. The subsequent parameter studies were conducted for a diameter D 1 of 300 mm and a Reynolds number R e 1 of 1 × 10 6 , as the operating charts show that these values provide for a realistic operating point. The values of the power loss coefficient ζ P m T E and the secondary velocity ratio ϕ I I , 101 at this operating point are further used as reference values for normalising the variables in Section 3.6.

3.2. Parametric Variations of the Basic Model

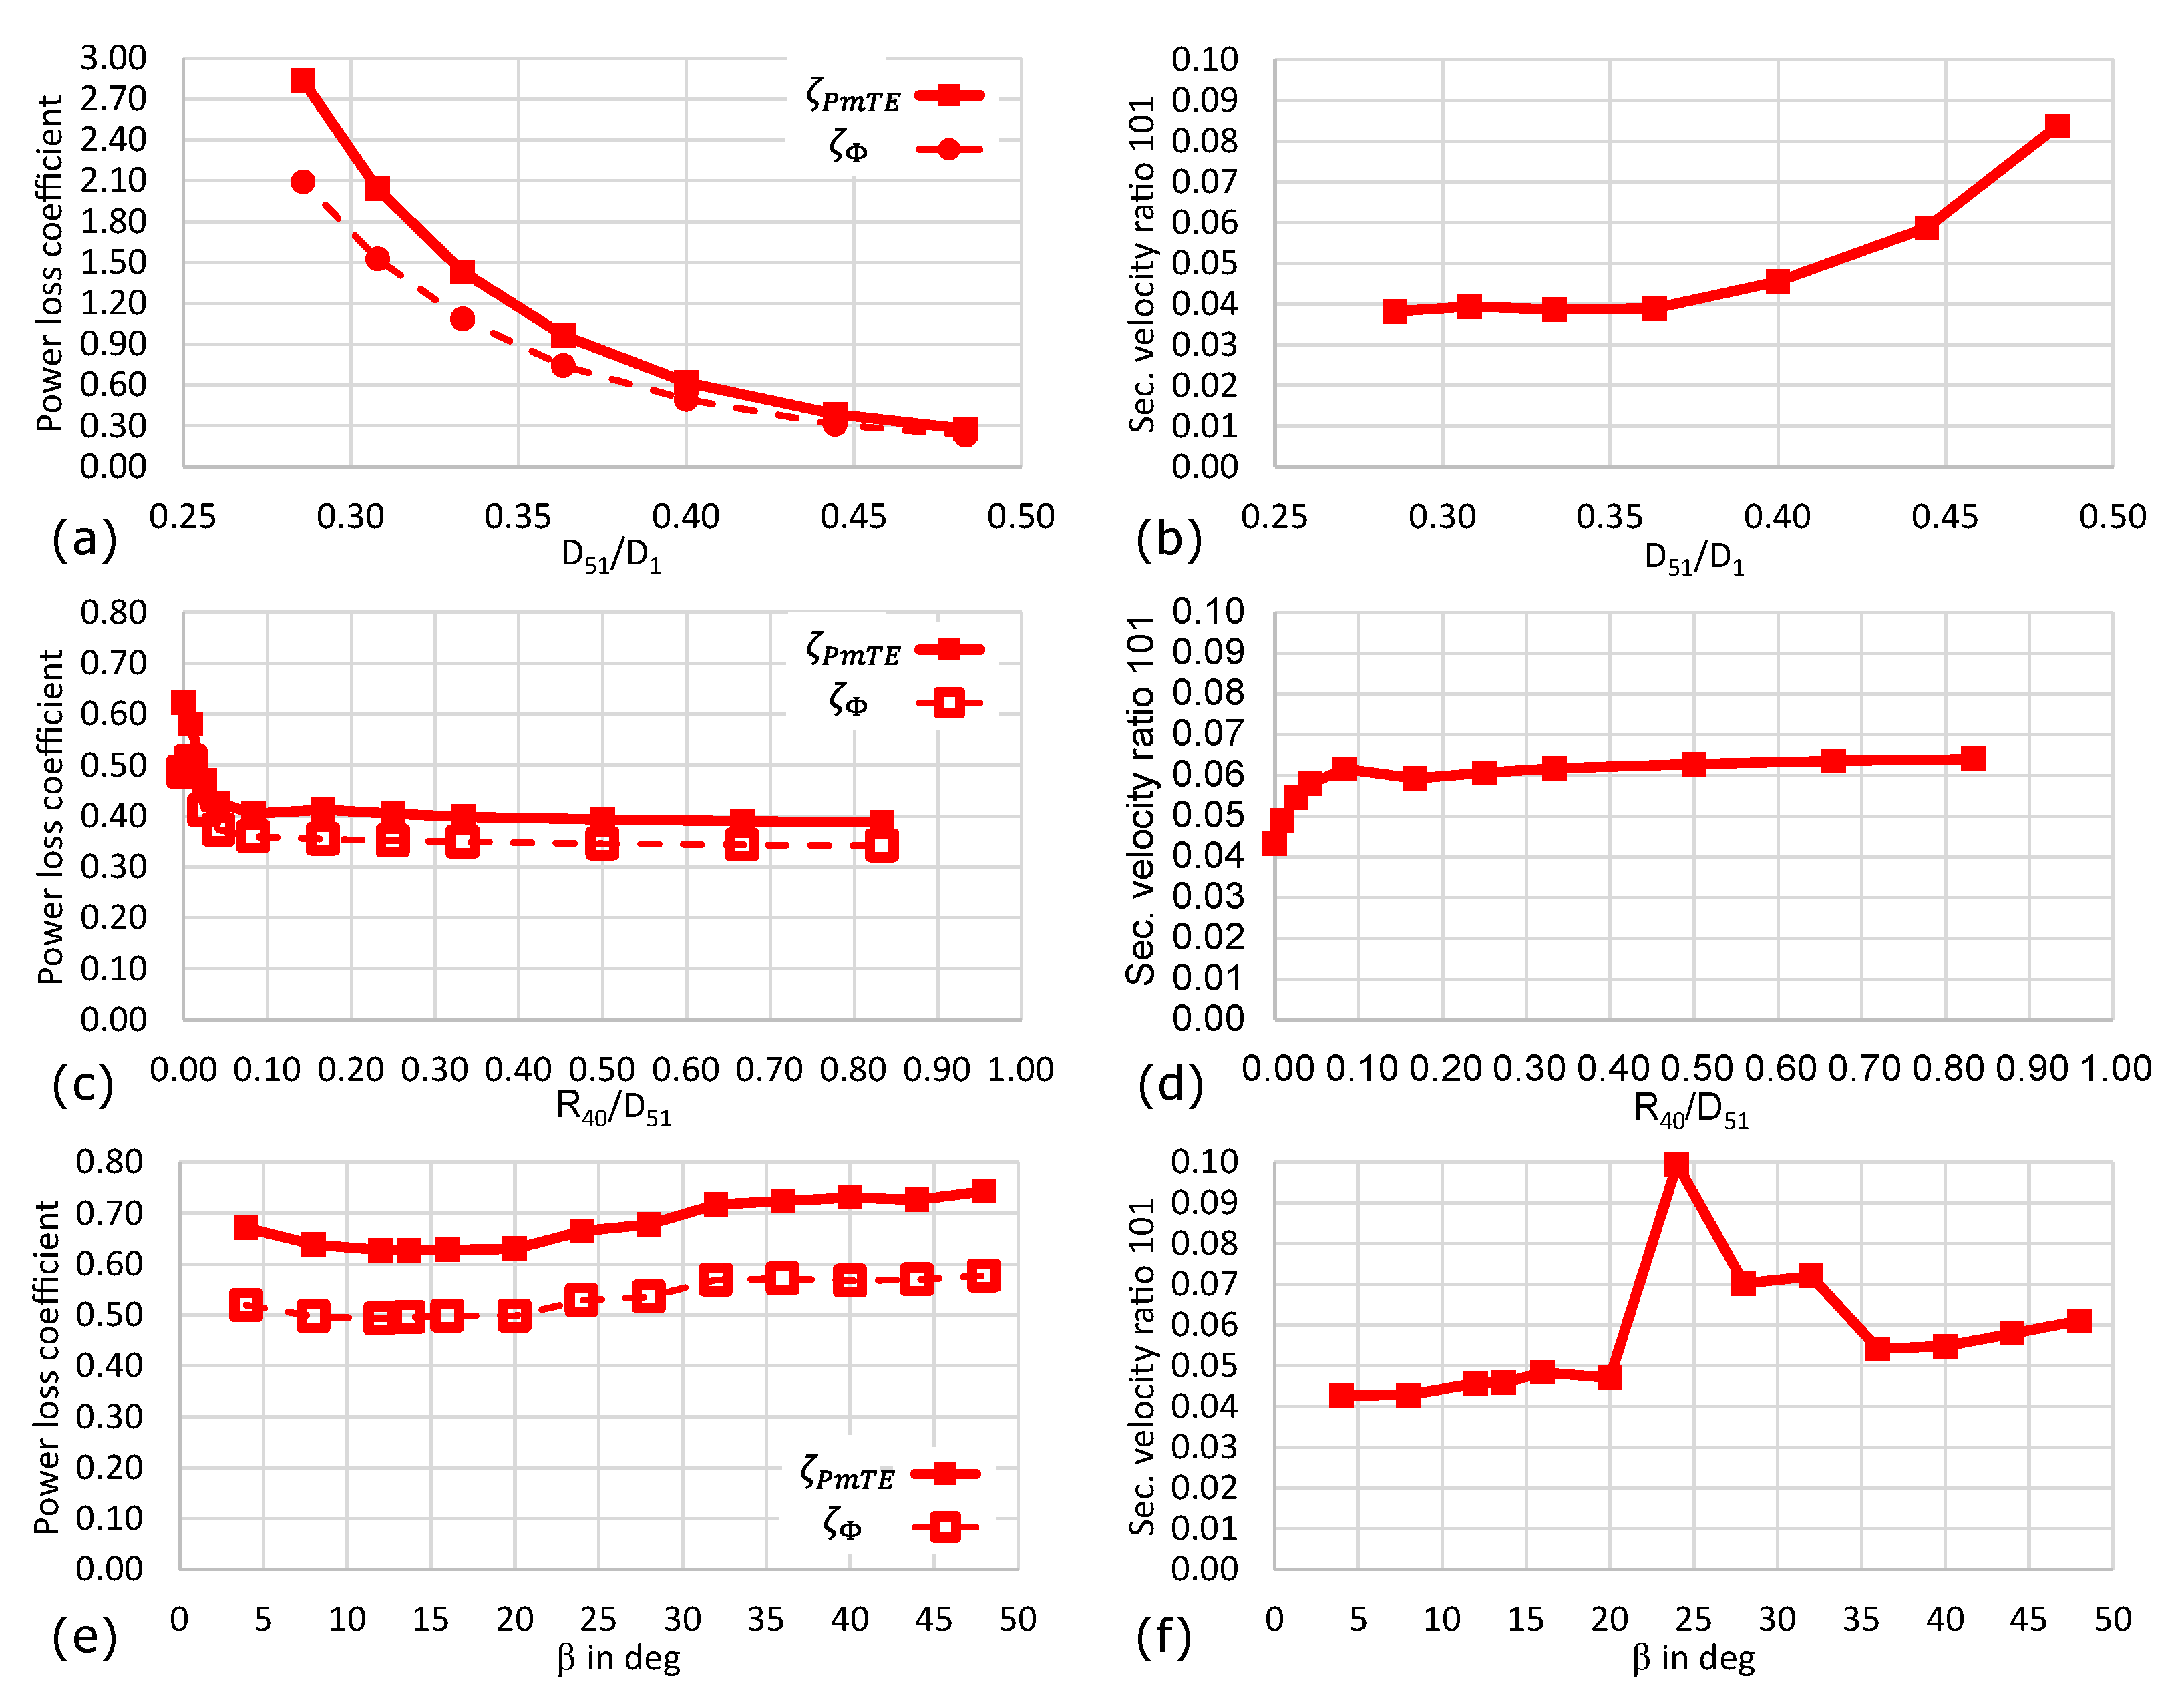
For the basic model as shown in part (a) of Figure 3, three parameters, namely the diameter ratio D 51 / D 1 ( D 1 was kept constant), the fillet radius R 40 / D 51 , and the diffuser angle β , were varied. The impact of an individual parameter change on the quality criteria is plotted in Figure 6. While the power losses decline with larger values of D 51 , the secondary velocity ratio increases. This decrease in power losses can be attributed to the constriction reduction at those locations where the branch lines are attached to the manifold. Likewise, bigger diameters of D 51 cause a reduced principal flow velocity in the branch lines and, thus, higher secondary velocity ratios. The magnitude of the secondary flow velocity exhibits higher dependency on how the branch lines are connected to the manifold and the branch lines’ flow path rather than the diameter ratio D 51 / D 1 . Figure 3c,d reveal that even a relatively small fillet radius of about 5 % of D 51 can reduce the power losses by about 50 % , but in turn, this also increases the secondary flow in the system by the same amount. Therefore, a fillet at the connection edge of the branch lines and the manifolds does not seem applicable. The choice of diffuser angle is crucial. For opening angles in the range of about 20 to 36 , the flow starts to asymmetrically separate from the diffuser wall, which leads to unsteady flow phenomena. The peak of secondary flow for β = 24 results from these phenomena. As we know that steady-state simulations cannot precisely capture this flow behaviour, we recommend that the opening angle β shall not exceed 16 to avoid flow separation securely. Optimum pressure recovery and, thus, minimum power losses are achieved for opening angles of 12 14 .

3.3. Parametric Variations of the Basic Model with Conical Frustum

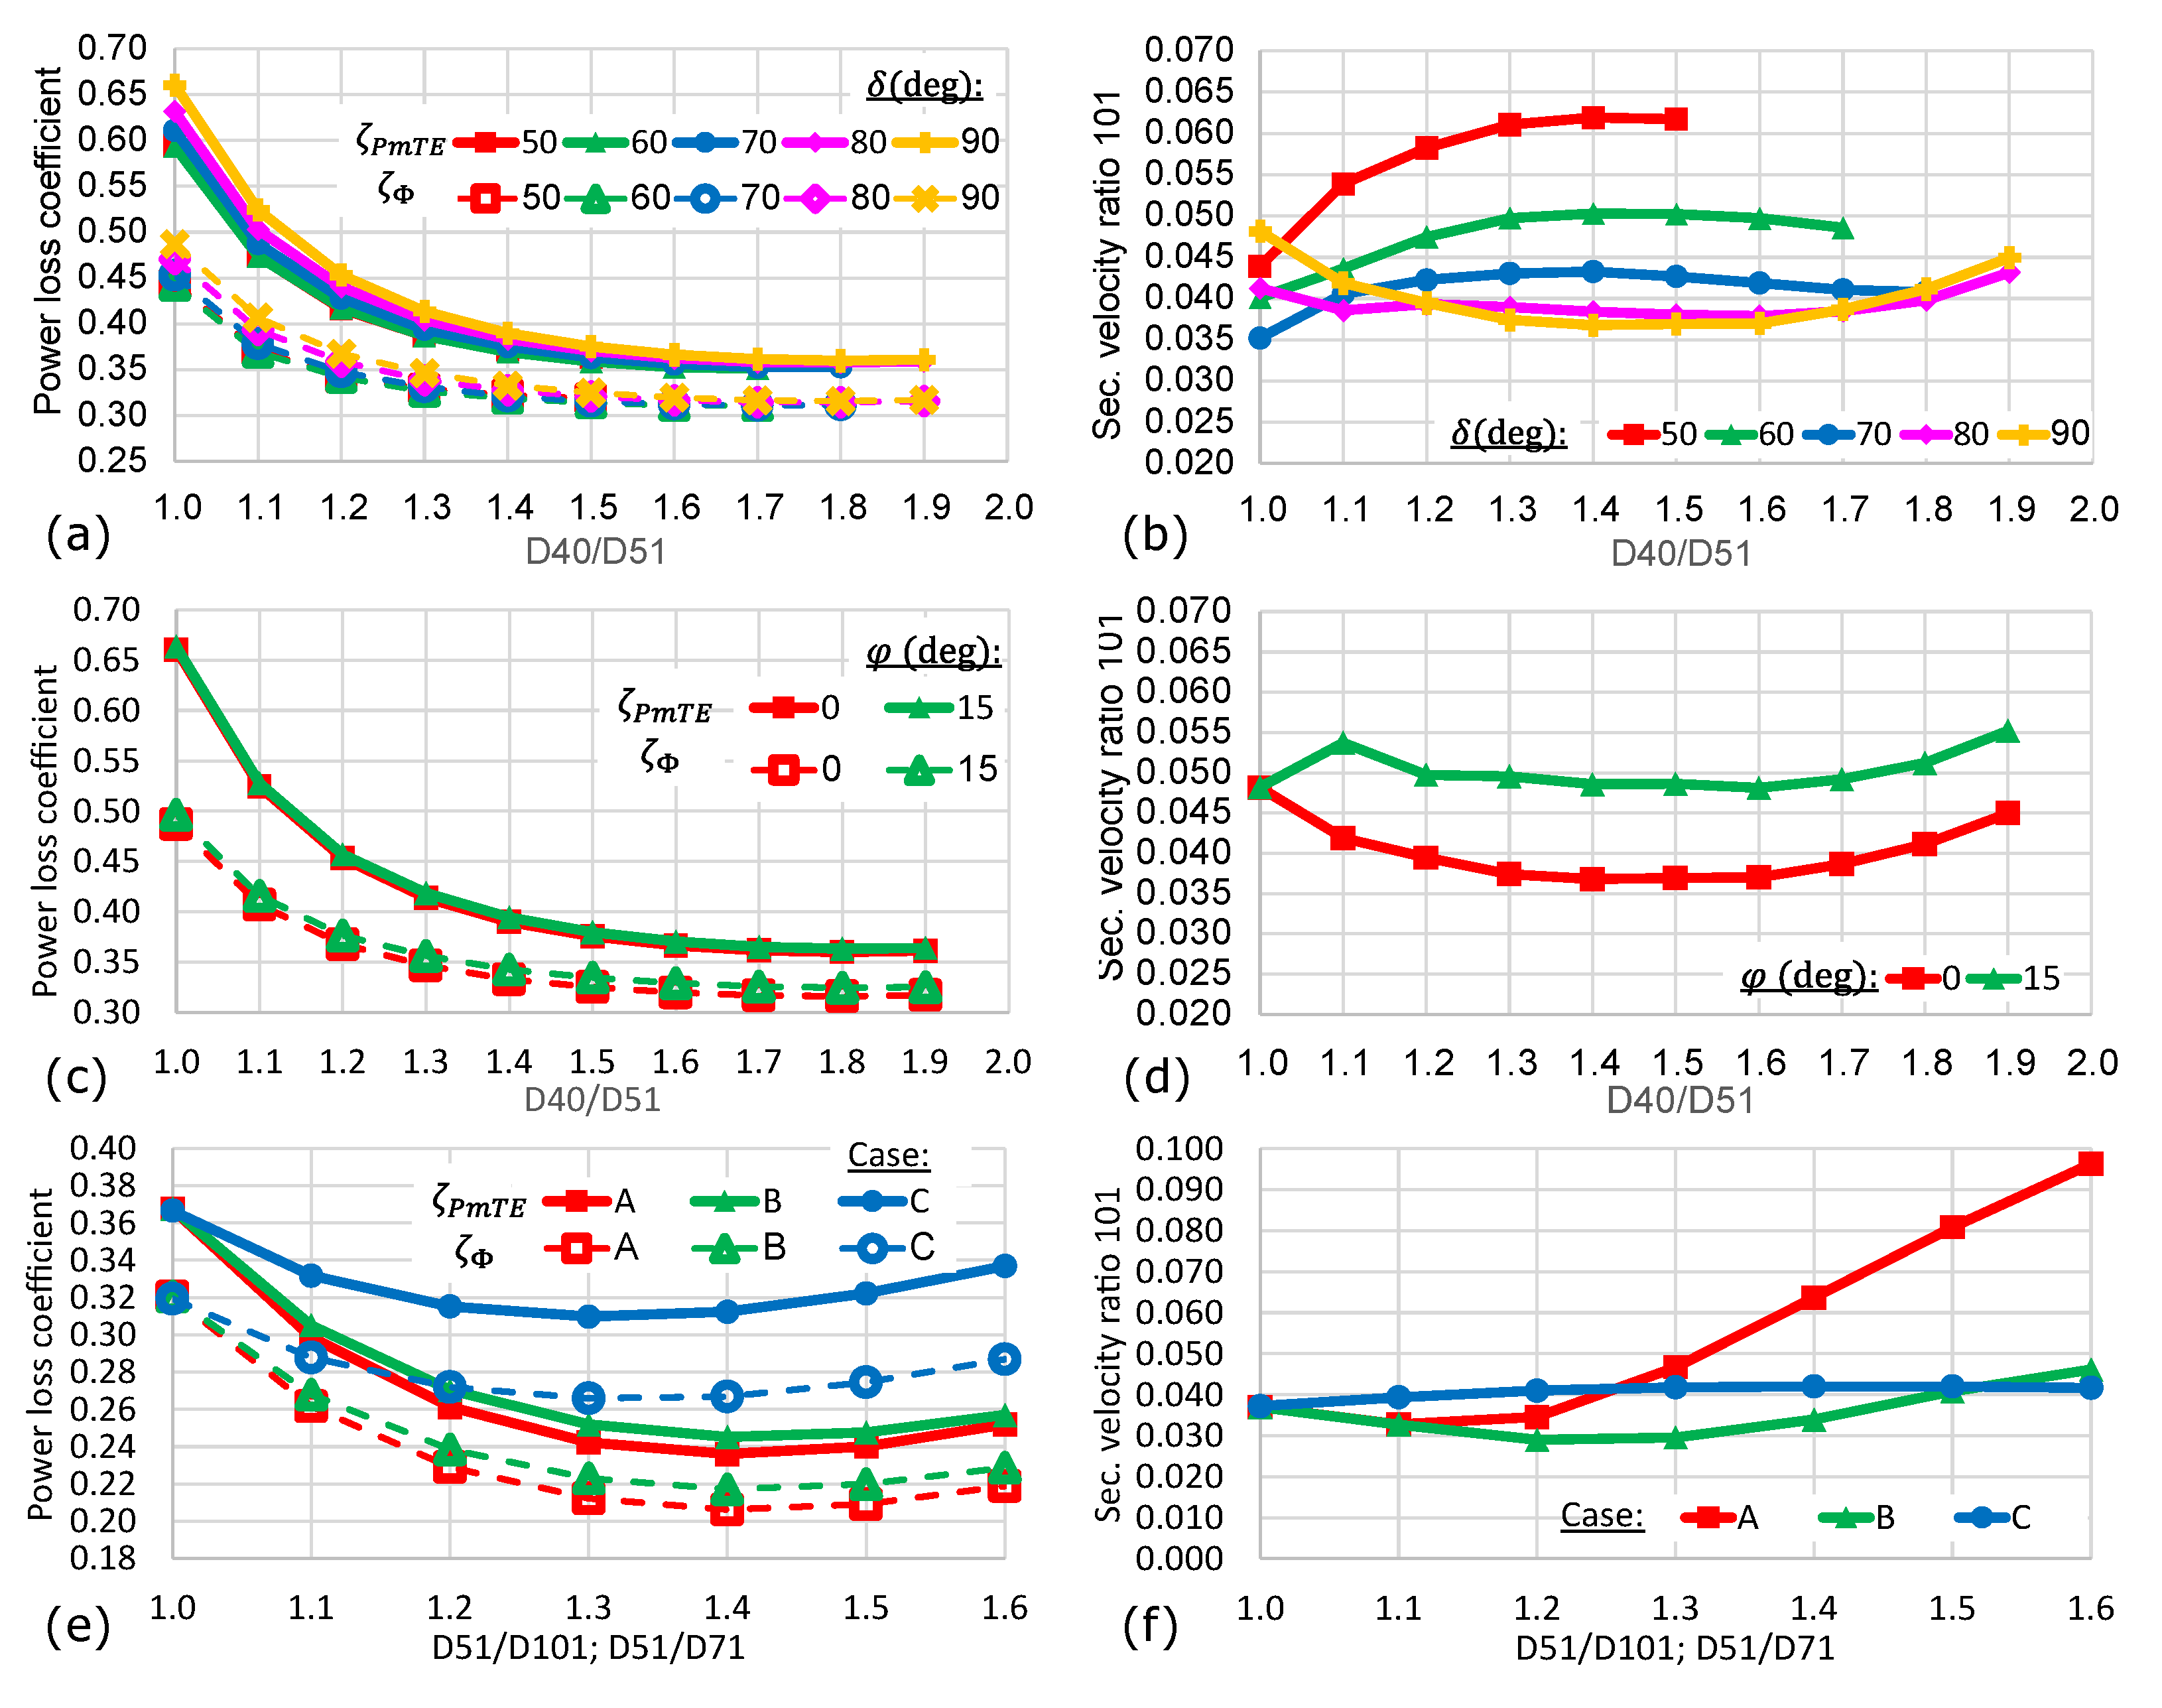
In contrast to the basic model (Figure 3a), the branch lines are connected to the manifold by a conical frustum (Figure 3b). The deviation angles α and δ coincide for this configuration. The merged deviation angle will be referred to as deviation angle δ . A variation of the ratio of the base diameter D 40 to the top diameter D 51 of the conical frustum (Figure 7a,b) reveals that for all deviation angles, δ , the power losses drop rapidly with an increasing diameter ratio D 40 / D 51 . Compared to the effect of other parameters, the frustum, as a connecting part between the manifold and the branch lines, has the largest impact on the power losses. The secondary velocity ratio reacts sensitively to combinations of the D 40 / D 51 and δ . A clear trend of secondary flow reduction at station 101 can be noted with steeper deviation angles. Furthermore, the curve for δ = 90 has a parabolic shape with a minimum at D 40 / D 51 1.5 1.6 . This indicates that a "smooth" (low losses) parting of the incoming flow into six equal portions becomes more likely if the flow can choose its path freely in the manifold part and the connecting frustum. For configurations with a deviation angle δ = 90 , the effect of pivoting the entire branch line by an angle φ = 15 around the vertical axis was investigated. Pivoting the entire branch line by 15 would result in the same pitch cycle diameter as pivoting only the injector bend by an angle γ .
The power loss chart, shown in Figure 7c, does not reveal a difference between these two designs. However, the secondary velocity ratio (Figure 7d) is about 20 to 30 % higher for the design with φ = 15 .
The charts shown in Figure 7e,f indicate a possibility for reducing both power losses and secondary flow by implementing convergent bend sections in the branch line. Three cases were tested: A—converging bend from 81 to 91, axial length z fixed; B—converging bend section from stations 81 to 91, the curvature radius of this bend section fixed; C—converging bend section from 61 to 71, the curvature radius of this bend section fixed. The diameter ratios D 51 / D 101 (A and B) and D 51 / D 71 (C) were varied between 1.0 and 1.6 in all three cases. Parabolic power loss curves can be observed with minima at about a diameter ratio of 1.4 for cases A and B, and 1.3 for case C. Only configuration B, with the converging bend between station 81 and 91, just upstream of the injector, reduces the secondary flow for diameter ratios between 1.2 and 1.3 . This is a result of the fixed curvature of this bend type, in contrast to configuration A, where the curvature radius of the bend becomes smaller (hence more prone to flow separations) if the diameter ratio increases.

3.4. Parametric Variations of the Distributor Model with Spherical Manifold

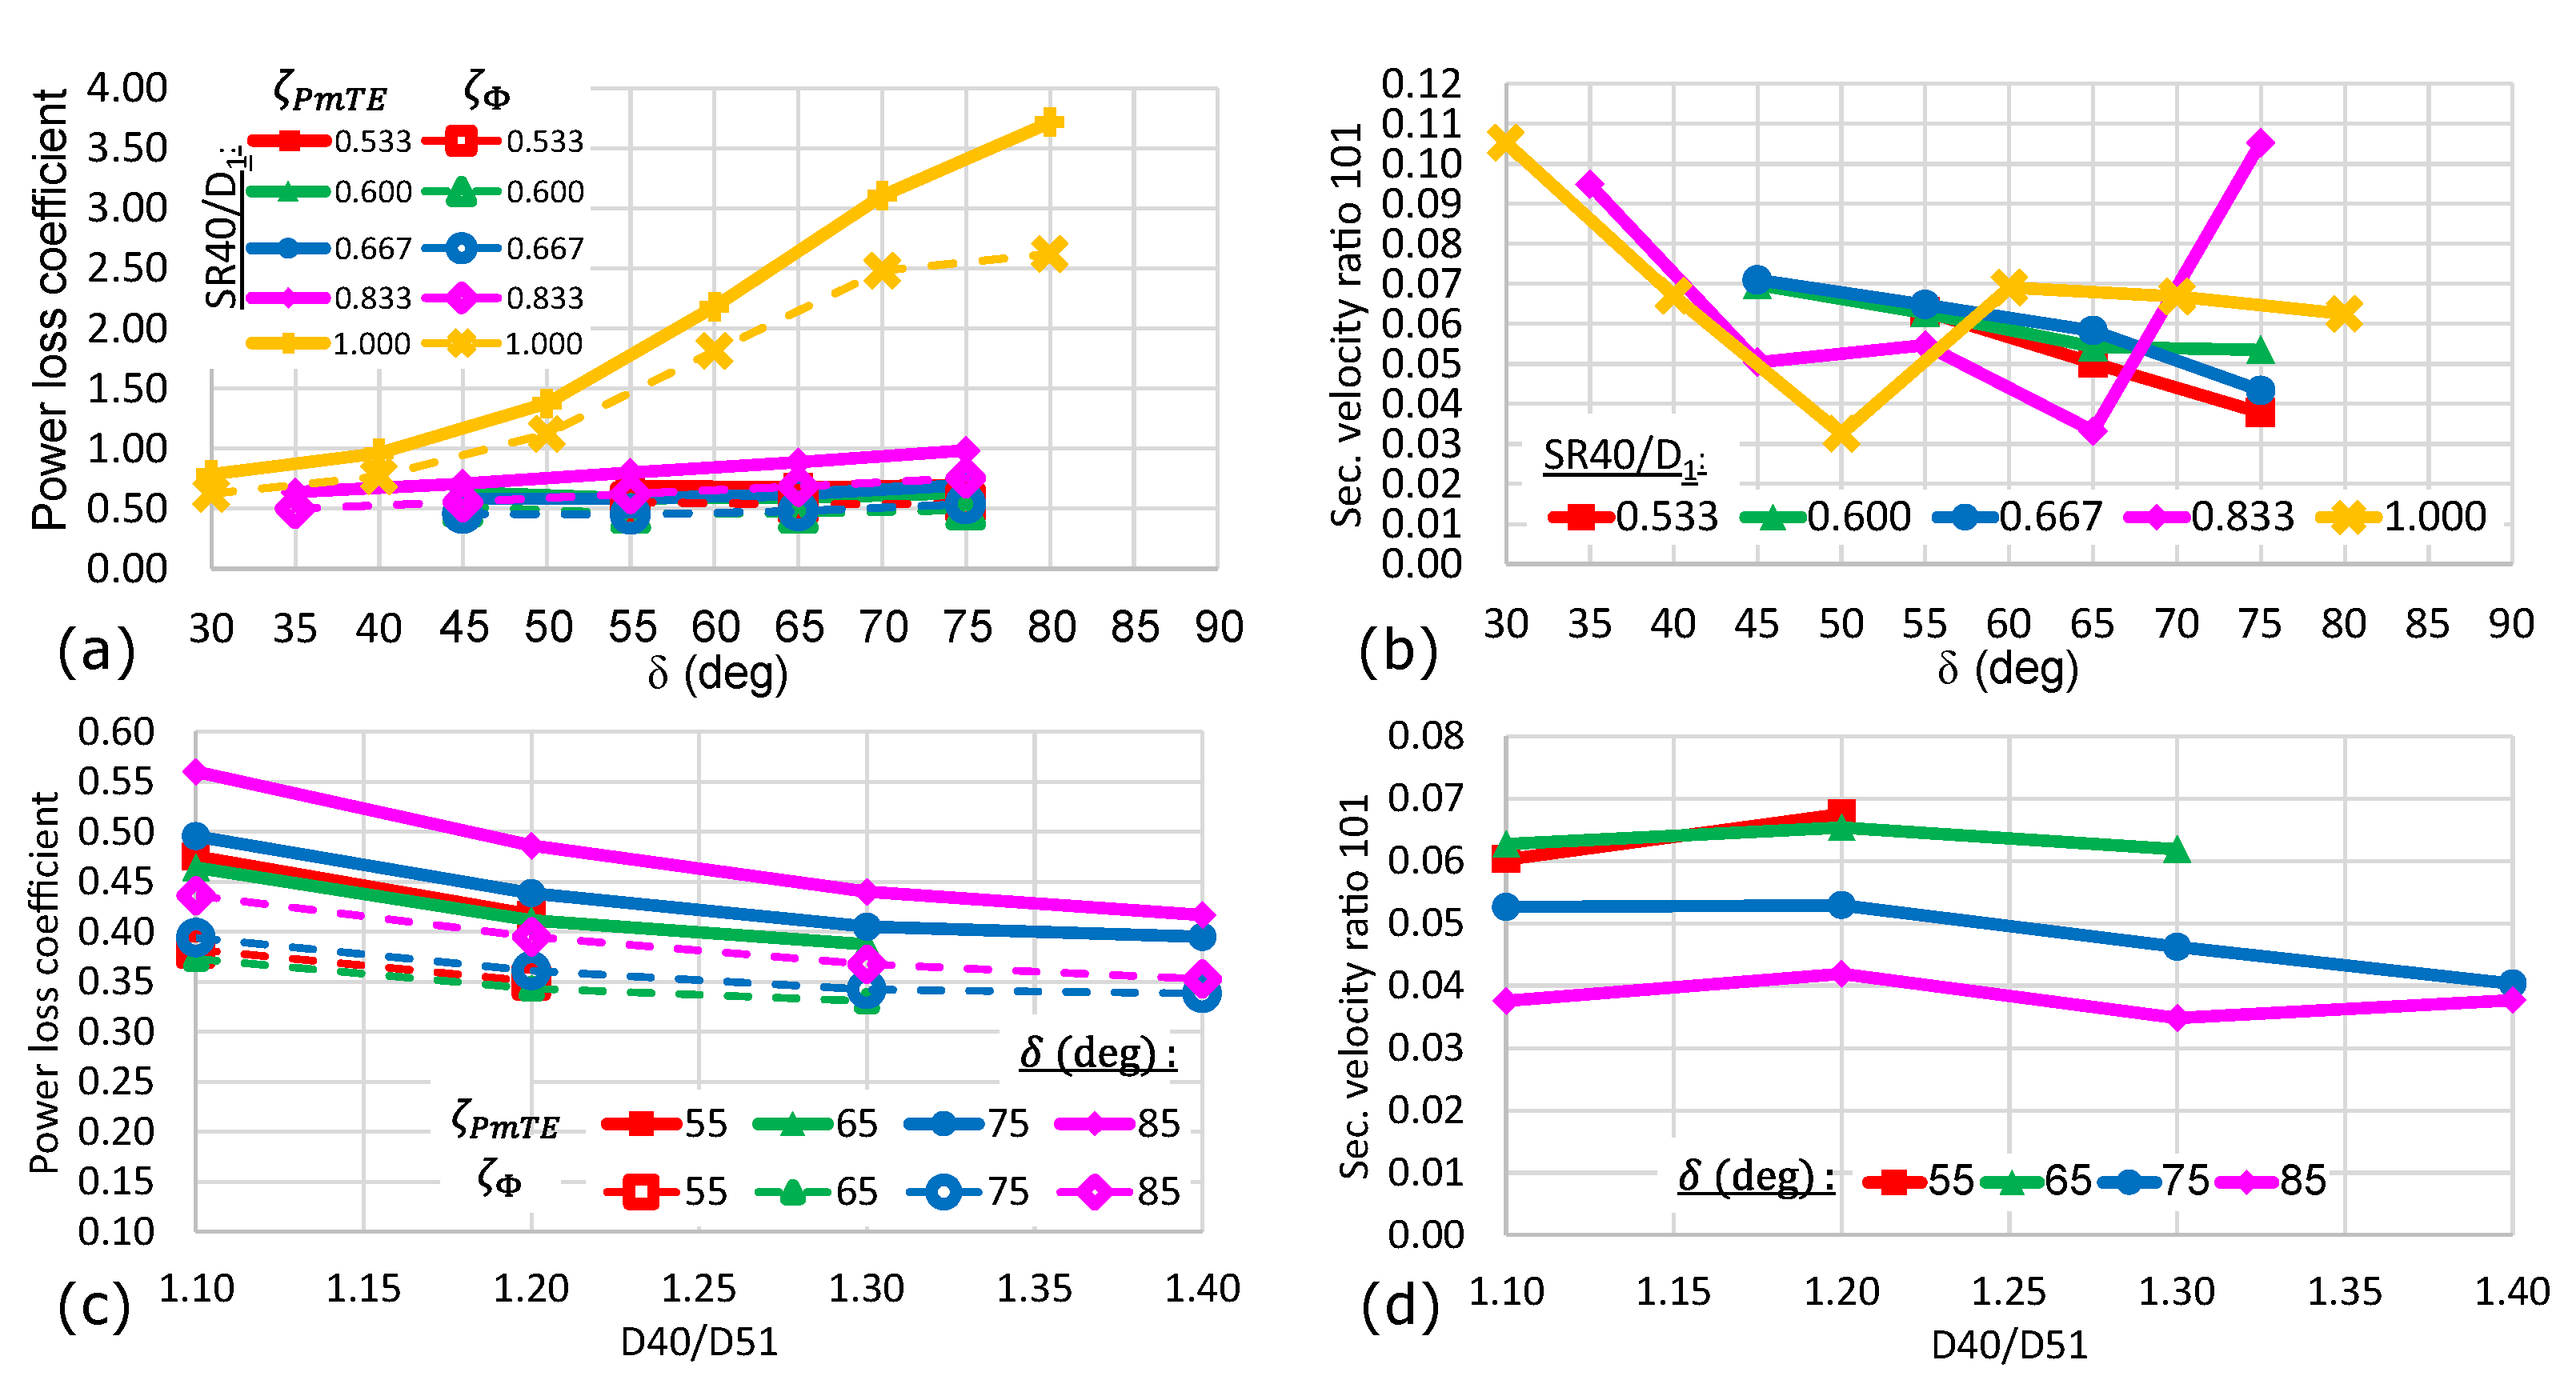
For this model, the diffuser-shaped manifold of the previously shown designs was replaced by a sphere. A spherical manifold has two potential advantages compared to a diffuser-shaped manifold. First, the axial length is reduced (as notable by comparison of the designs in Figure 3). Secondly, a more even distribution of the stresses should result theoretically from the hydrostatic pressure. However, these potential advantages are only relevant if the spherical shape of the manifold does not adversely affect the flow quality. Figure 8a shows that for small sphere diameters S R 40 / D 1 , the power losses are similar to the previously discussed designs, but the losses rise dramatically when increasing sphere diameters. The secondary velocity ratios (depicted in Figure 8b) are similar to previous designs for small spheres. Furthermore, the decrease in ϕ 101 with steeper deviation angles δ can be observed again. However, for big sphere radii, the secondary velocity curves start to oscillate. This behaviour can be attributed to flow separation at the entrance of the sphere, causing an unsteady swirl in the entire downstream branch line. Therefore, a sphere diameter of S R 40 / D 1 > 2 3 should be avoided. For studying the effect of a frustum connecting the sphere and the branch lines, S R 40 / D 1 = 0.6 was chosen. Although a reduction in the power losses can be observed when increasing the base diameter D 40 / D 51 of the frustum (Figure 8c), the secondary flow ratio is not affected much by the frustum. However, as seen before in Section 3.3, increasing the deviation angle δ of the branch lines again contributes severely to a reduction in the secondary flow (Figure 8d).

3.5. Parametric Variations of the Distributor Model with Cylindrical Manifold

Similar to the design with a spherical manifold, the design with a cylindrical manifold has a reduced axial length compared to the basic manifold designs (Figure 3a,b). Another advantage of the cylindrical manifold is the simpler manufacturing process, as most components can be made from standardised pipes. However, the power loss is higher compared to the basic manifold designs. This observation is emphasised by Figure 9a, in which the power loss is plotted against the deviation angle δ . For all three axial positions T 4 / D 51 , the curves show a parabolic shape with their minima at about δ = 60 . Figure 9b depicts the secondary velocity ratio exhibiting a linear trend towards lower values of ϕ 101 for steeper deviation angles. Again, the power loss is reduced if a fillet radius at the connecting edge of the manifold and the branch line is considered (Figure 9c), but the secondary velocity ratio increases.

3.6. Comparison of the Four Design Variants

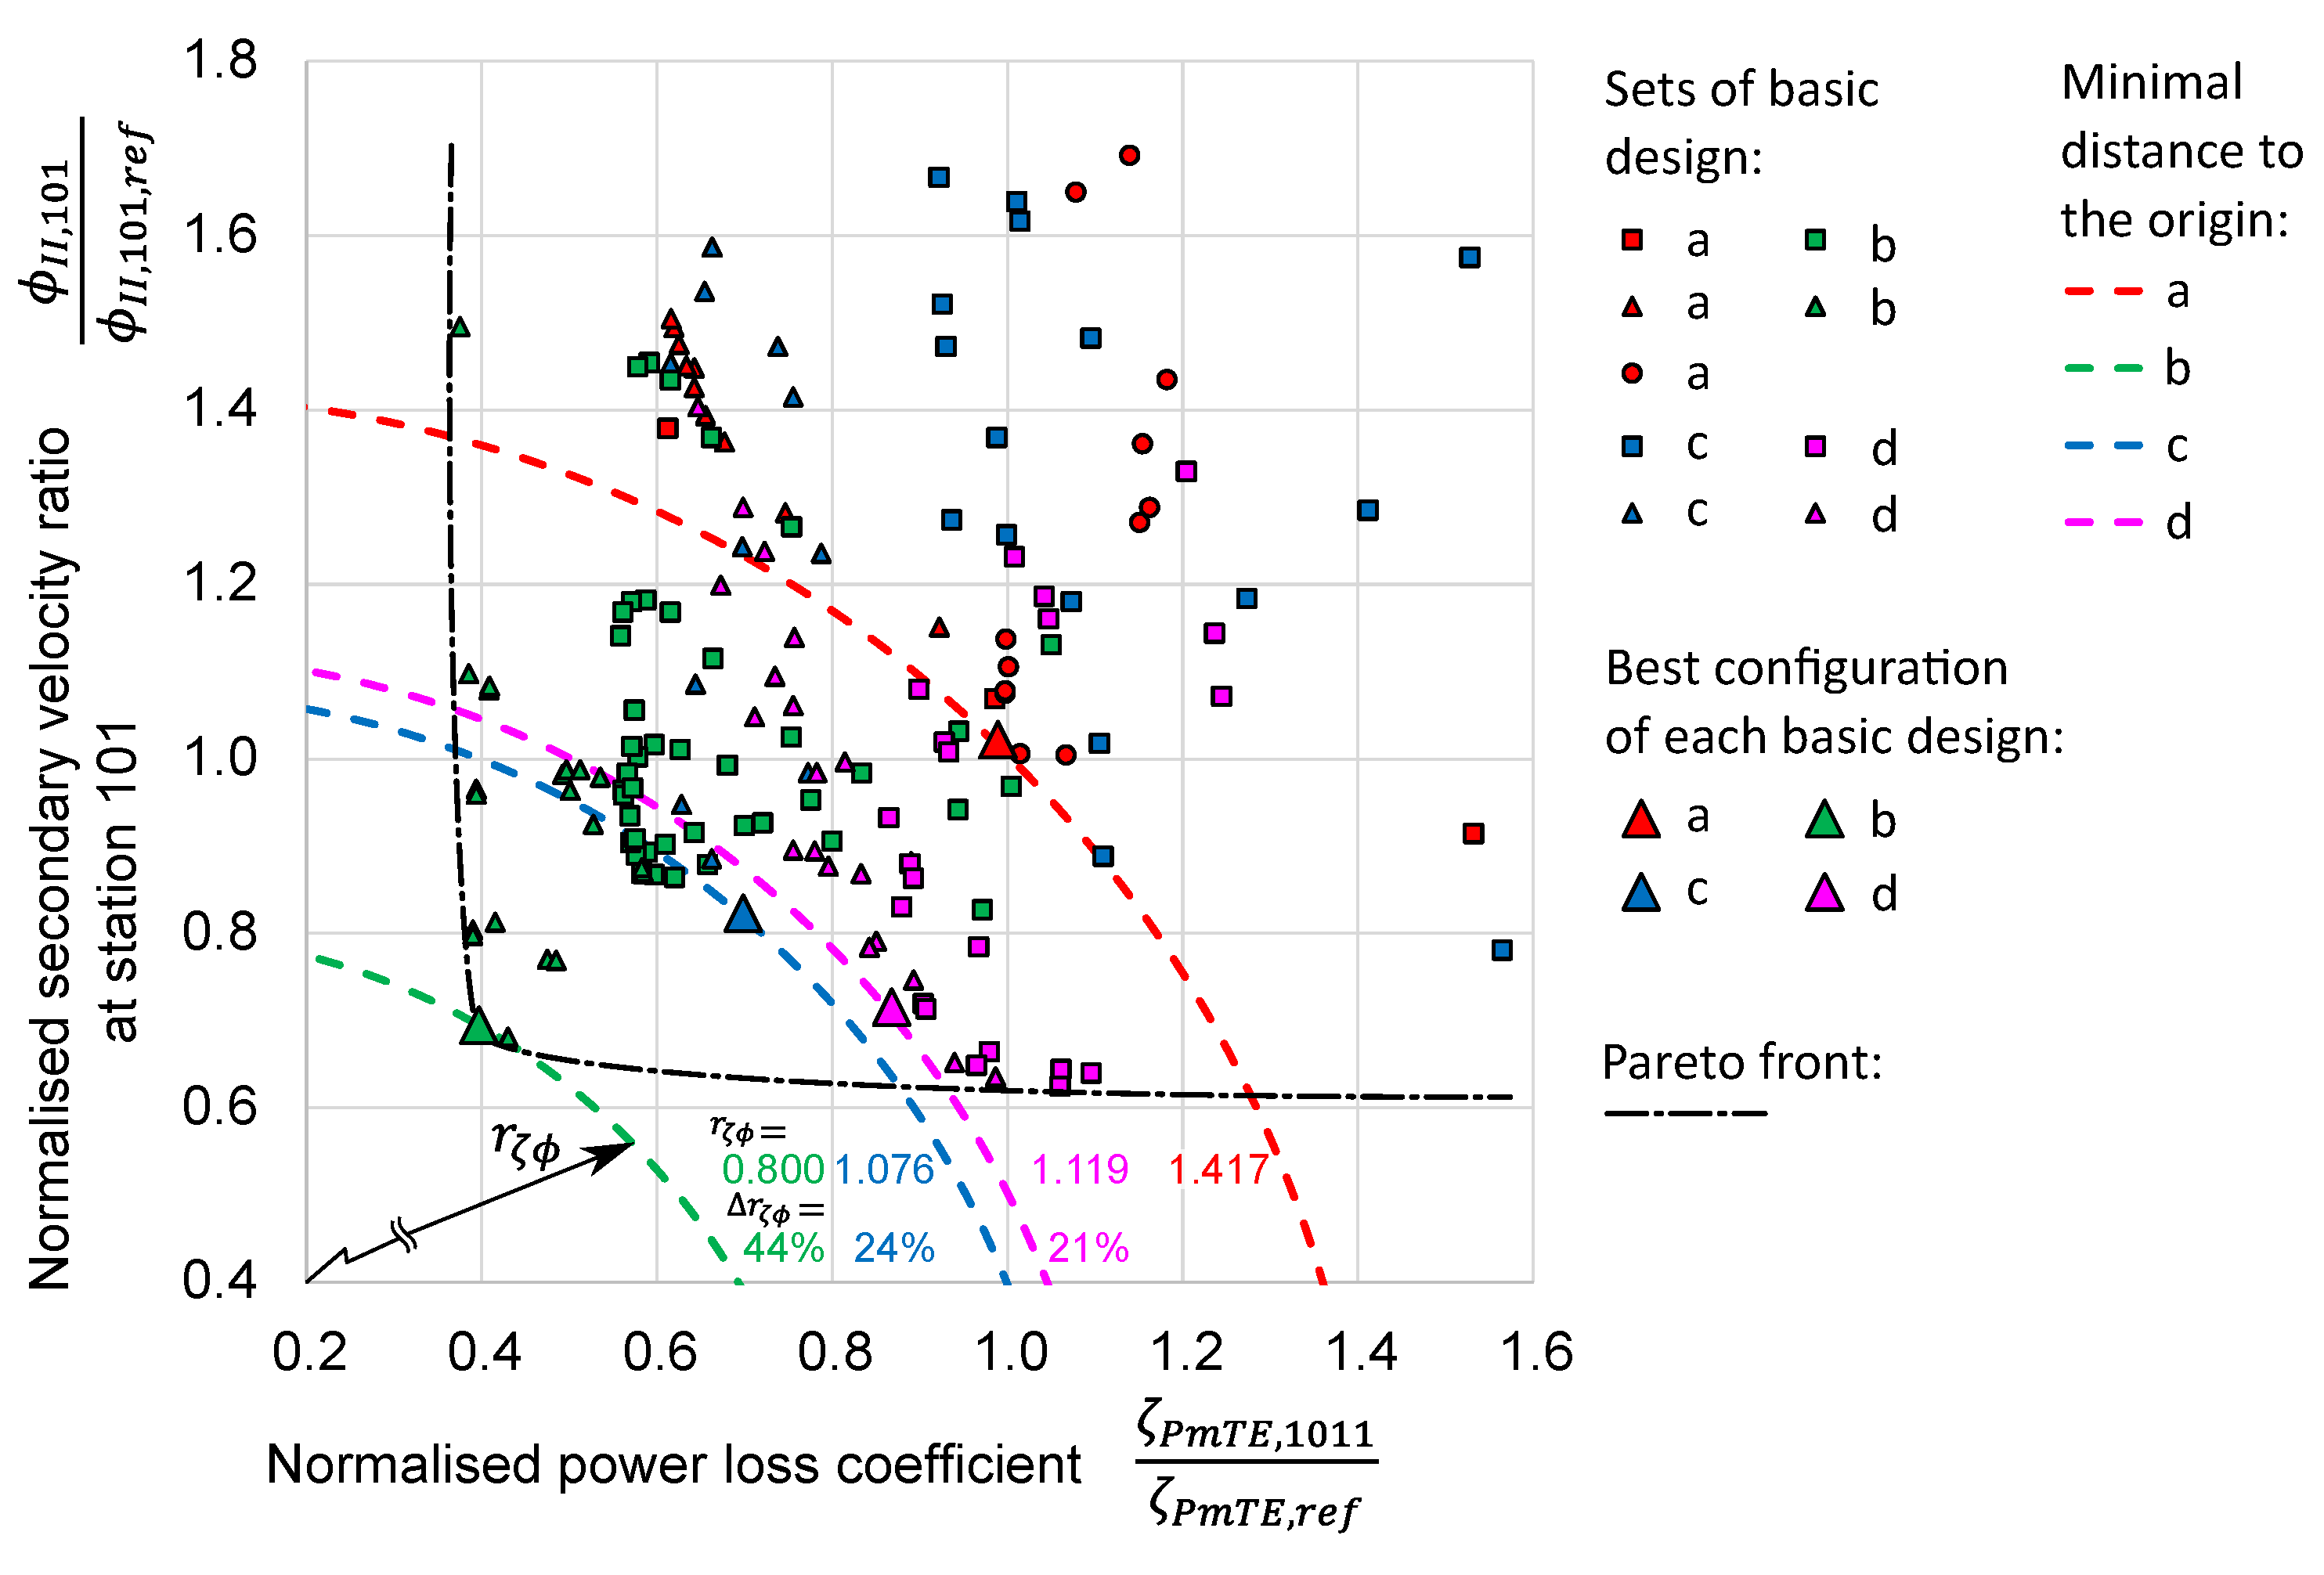
While the preceding subsections focused on investigating the effect of geometric changes on the flow quality of the four basic designs, this subsection provides an overall comparison of the simulated AxFeeder configurations. Therefore, the secondary velocity ratio ϕ I I , 101 at station 101 is plotted in Figure 10 against the power loss coefficient ζ P m T E , 1011 between stations 1 and 101 for each of the tested configurations. Both quantities are normalised by the corresponding reference values acquired from the basic model as specified in Section 3.1. In this figure, each of the four basic designs is assigned a dedicated colour, red for design (a), green for (b), blue for (c), and pink for (d). Within a basic design, different parameter sets are indicated by different marks. The best configurations, i.e., the ones with the smallest distance value r ζ ϕ of each basic design are indicated by an enlarged mark. In the present case, the marks for all four best configurations happen to be triangles.
Since low power losses and a low level of secondary flow are desired for Pelton turbine distributor systems, we assume that both criteria are equally important. Hence, the overall quality of a design is measured by its distance r ζ ϕ from the centre point ( 0 , 0 ) of Figure 10. This distance requires an equal weighting of both criteria, power losses, and secondary flow ratio, and hence the use of the normalised quantities ζ P m T E , 1011 ζ P m T E , 1011 , r e f and ϕ I I , 101 ϕ I I , 101 , r e f is necessary. With the help of Pythagorean addition, the distance r ζ ϕ is then defined as
r ζ ϕ = ζ P m T E , 1011 ζ P m T E , 1011 , r e f 2 + ϕ I I , 101 ϕ I I , 101 , r e f 2 .
In Figure 10, the radial distances of the best configuration (identifiable by the enlarged triangle mark) of each of the four basic designs from (a) to (d) to the origin are indicated by dashed quarter circles. The distances from the best configuration of design (a) to the best configuration of the three improved designs are computed by
Δ r ζ ϕ = 1 r ζ ϕ , ( b , c , d ) r ζ ϕ , a
and also shown in this figure.
A comparison of the four basic designs reveals that the majority of the design configurations of basic design (a) (red marks) lie in the upper right part of the scatter plot. Thus, these design points are expected to demonstrate unfavourably increased power losses and secondary flows, which may lead to unwanted effects in Pelton turbine applications. The green marks of basic design (b) are significantly moved towards the left, exhibiting reduced power losses. Furthermore, a shift to lower secondary velocity ratios is observed. The design points of basic design (c) spread across the upper right of the plot, where most configurations display undesirably high power losses or secondary flow ratios. Nonetheless, the best design points are closer to the origin than the basic design (d). The basic design configurations (d) are concentrated in the lower plot area. However, due to significantly higher power losses, this can be largely attributed to the transition from the manifold to the branch line (see Figure 11), as the distance r ζ ϕ , d of the best configuration of design (d) to the origin is greater than for the best configuration of (b) and (c). The most suitable design within this comparison is basic design (b), with its best configuration being 44% better than the best configuration of basic design (a). While the best configuration of (b) demonstrates lower power losses and secondary flow ratios than the other three best configurations, there are some non-dominated configurations of design (d) that have similar or even lower values for the secondary velocity ratio. Likewise, there are some non-dominated configurations of (b) that have similar or even lower values for the power losses. All these non-dominated configurations form the Pareto front, which is shown in Figure 10.
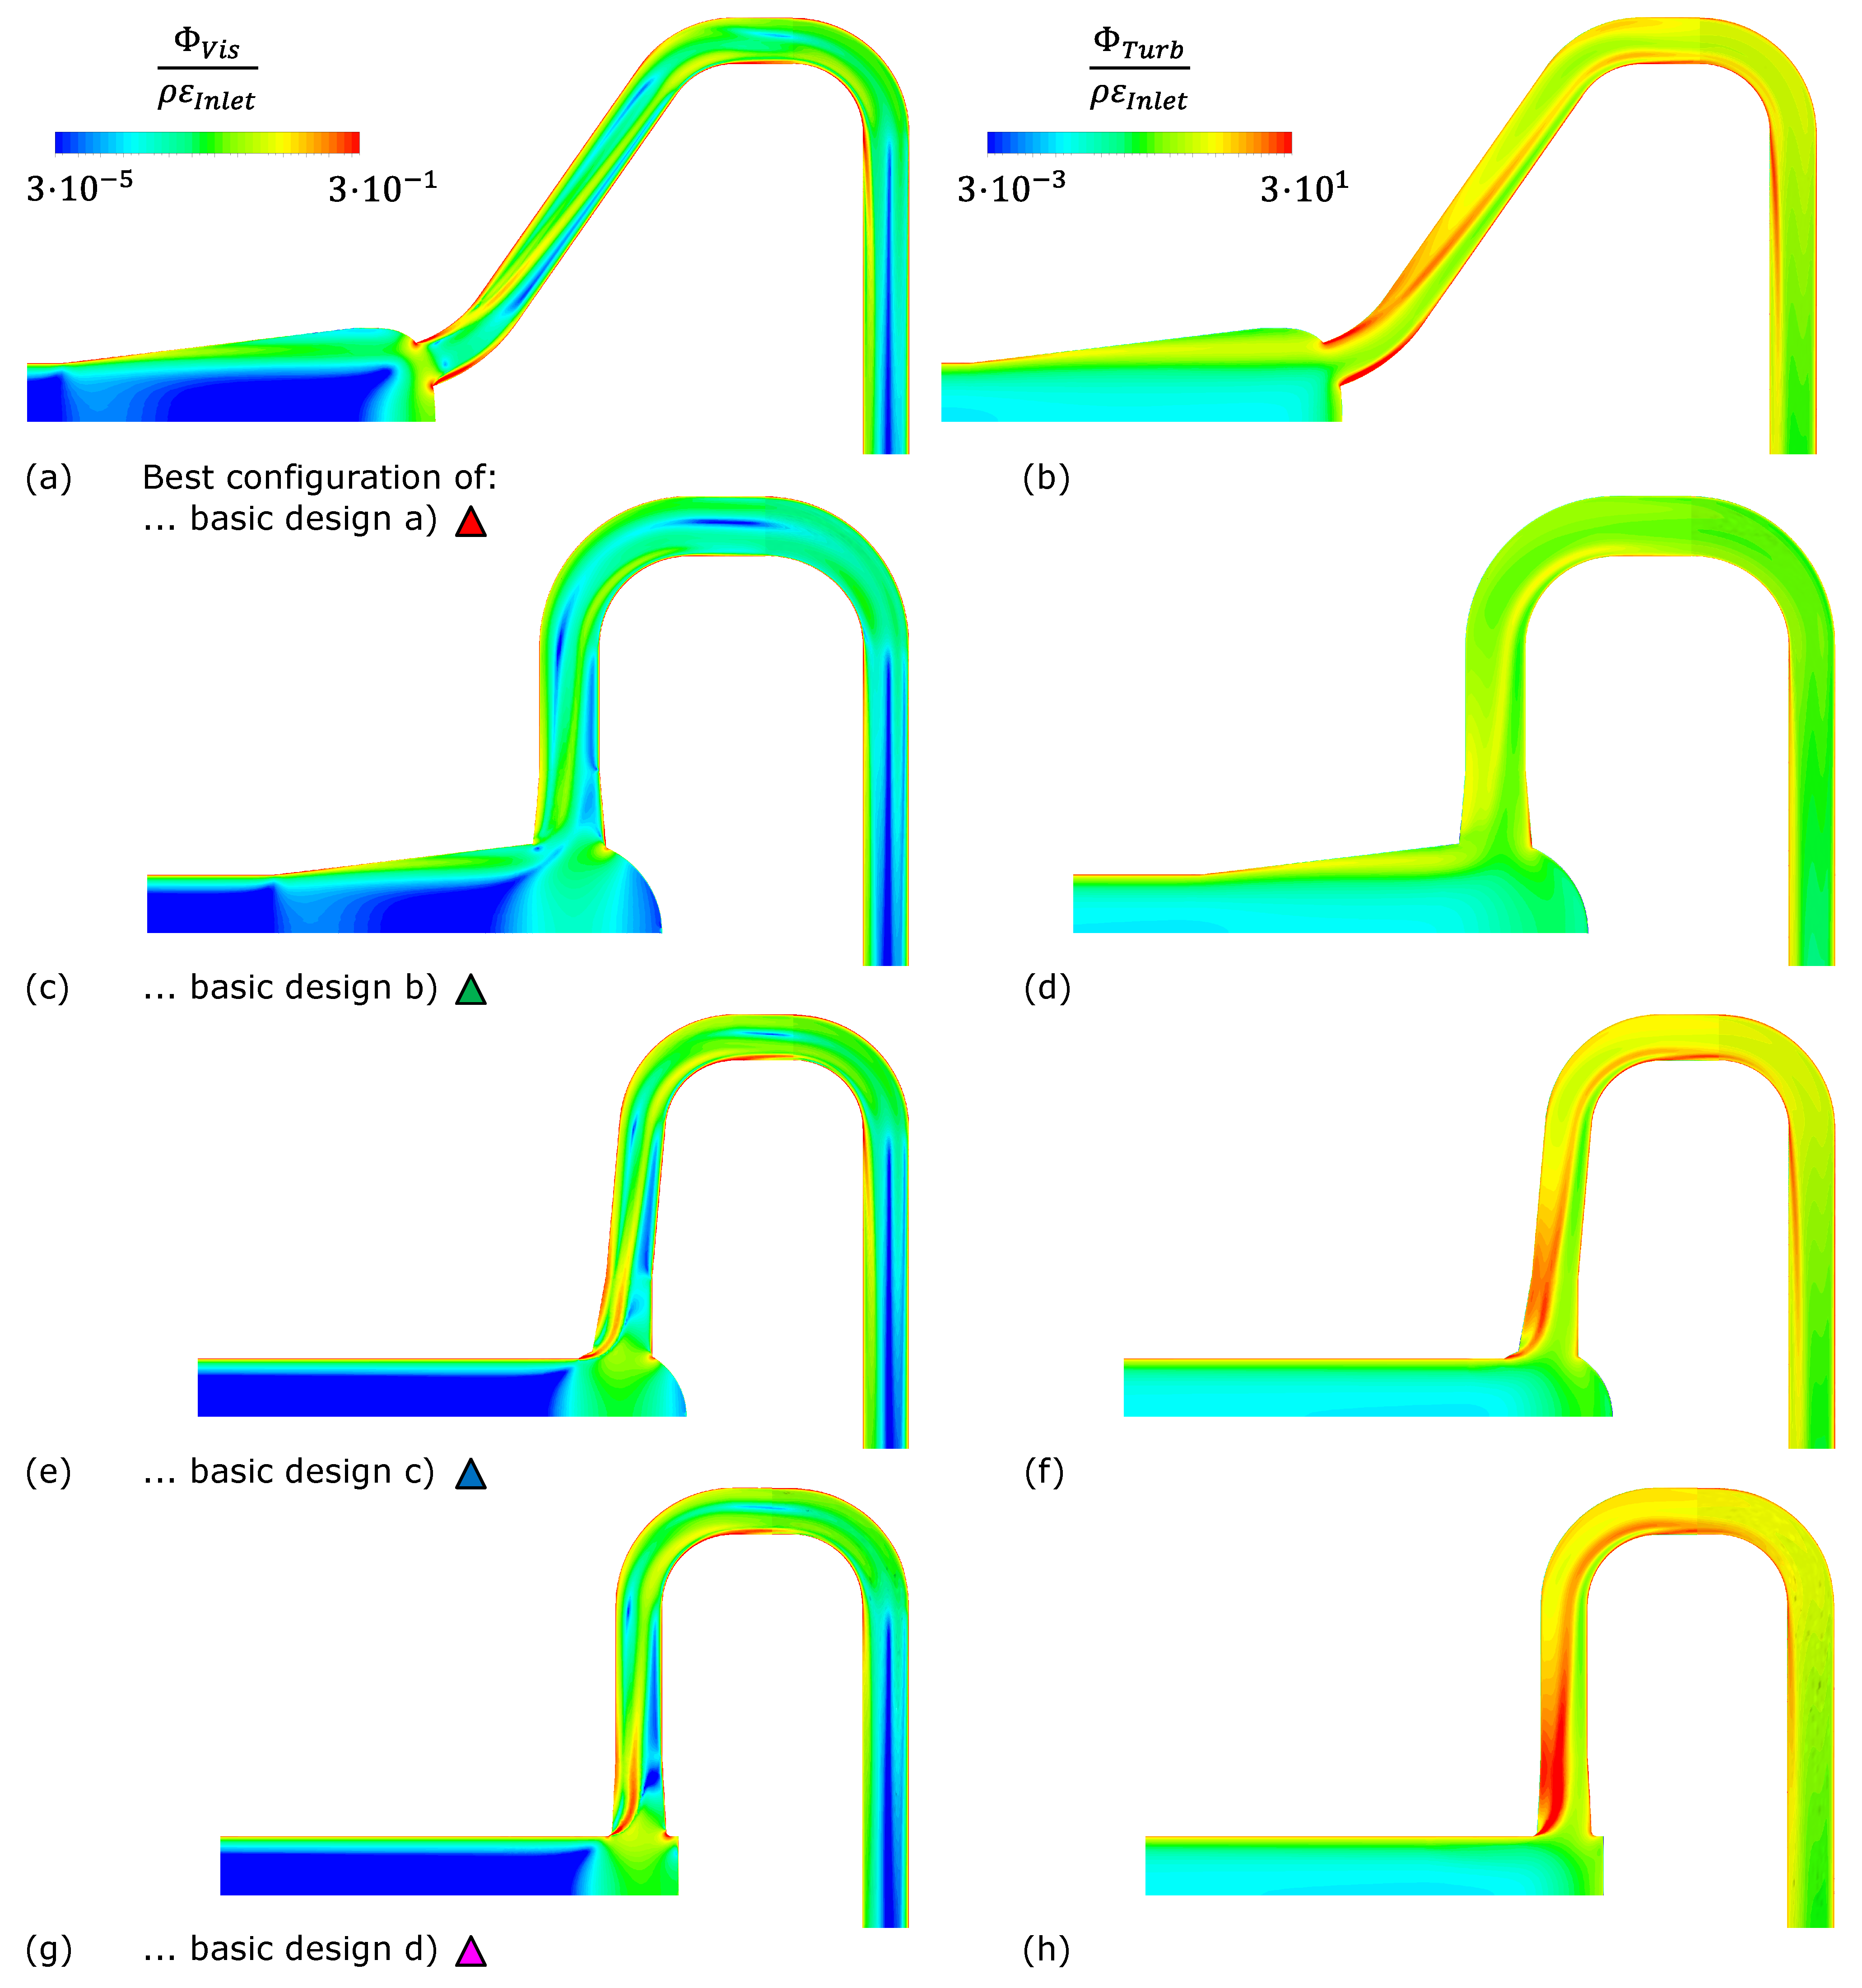
For the best configurations of each basic design, the local losses in the mid-plane, expressed in the form of viscous and turbulent dissipation, are compared in Figure 11. The losses caused by the oncoming flow are comparable for all four cases. A difference in the local dissipation becomes visible as soon as the flow enters the manifold part. The diffuser angle in configuration (a) appears to be overly steep, and therefore the losses in this section of the manifold are slightly higher than in design (b). In all configurations, the most significant production of entropy occurs at the throat, where the branch line is connected to the manifold, while the contours of the dissipation are qualitatively similar. It is design (b), where the magnitudes of both viscous and turbulent dissipation are considerably lesser than for the three other designs. This can be attributed to a combination of factors. First, as a result of the combination of the diffuser-shaped manifold and the frustum-shaped first segment of the branch line, the flow velocities in the areas where the flow changes its direction are lower. Hence, less shear stress and less turbulent kinetic energy are induced in the flow. Second, the hemispherical shape of the manifold end cap allows for the flow to enter the frustum part of the branch line more evenly than in designs (a) or (d). Third, the diameter of the branch line of the best configuration of design (b) is larger than that of designs (a), (c), and (d). Therefore, the flow velocity in the first part of the branch line is lower, and less entropy is produced in the straight pipe sections as well as in the two bends.

4. Discussion

The quality criteria for evaluating the flow in distributor systems with one inlet and multiple outlets are presented. These criteria were applied to rate different manifold designs. How changes in the geometric parameters affect the flow quality for each of these four designs was analysed. This final section highlights the core findings of the parametric study and provides additional insights.

4.1. Core Findings

The key aspects are as follows:
  • The transition from the penstock to the manifold is crucial, while the model with a spherical manifold becomes susceptible to unsteady flow phenomena if the sphere radius exceeds a certain value, similar unsteady effects were observed for the model with a diffuser-shaped manifold and too-steep diffuser angles β .
  • The first component of the branch line in the flow direction should be shaped as a conical frustum. It reduces power losses by over a third and decreases the secondary flows for branch lines with steep deviation angles.
  • A steeper deviation angle (ideally δ = 90 ) has multiple advantages: First, the secondary velocity ratio is lowered significantly (see Figure 12). Second, the axial length of the distributor system is shortened, and third, the connection between the manifold and the branch lines becomes easier to manufacture. The slight increase in power losses for steeper deviation angles becomes negligible.
  • An injector bend with a converging diameter from station 81 to 91 and a fixed curvature radius allows for a reduction in both quality criteria of up to one-third.
  • Only the conical frustum and the converging injector bend reduce power losses and secondary flows simultaneously. The majority of the geometric parameters decrease one but increase the other target quantity. For example, a fillet radius at the connection of the branch lines and the manifold greatly reduces power losses, but amplifies the secondary velocity.

4.2. Additional Insights

4.2.1. On the Secondary Flows at Station 101

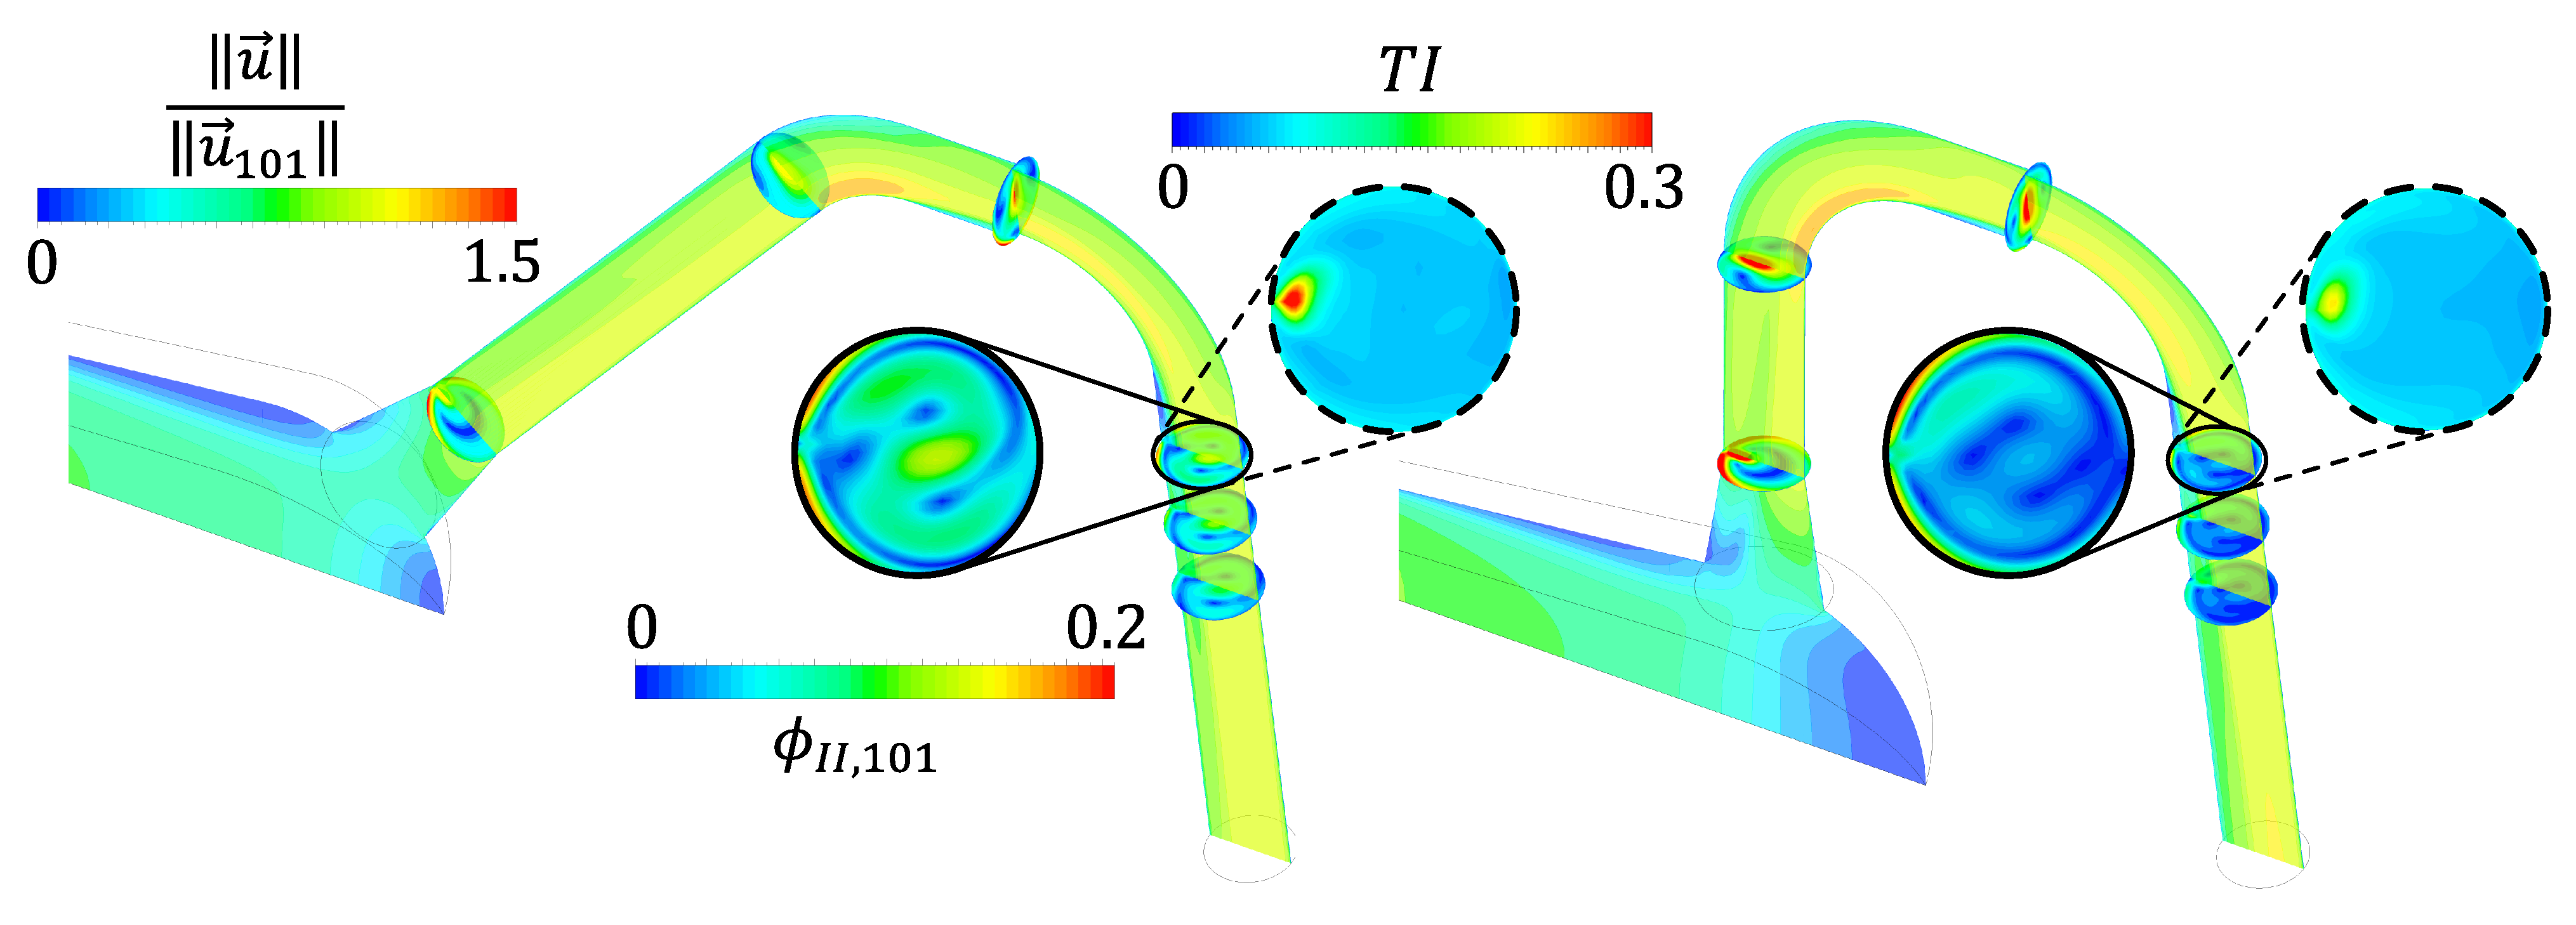
The detail plots of the secondary velocity ratio at station 101 in Figure 12 reveal an S-shaped secondary velocity pattern. The secondary flow patterns are commonly symmetric with respect to the bucket with conventional Pelton manifold distributors. The significance of the S-shaped secondary velocity pattern on the Pelton turbine performance calls for further investigations.
The secondary flow magnitudes at station 101 in Figure 12 are significantly lower for designs with the steeper deviation angle. The hypothesis that turbulence dissipates the secondary flow magnitude at this station is disproved by the plots encircled by the dashed lines. Only subtle differences between the two designs can be observed at this station. A red dot with increased turbulent intensity can be spotted only at the curvature inside.

4.2.2. On the Power Losses

The charts of Figure 5, Figure 6, Figure 7, Figure 8 and Figure 9 reveal a particular offset of the power loss curves ζ P m T E computed with the classical approach and the power loss curves ζ Φ computed via the second law analysis. This offset appears similarly in all charts. The second law analysis seems to systematically underestimate the power losses compared to the classical approach with the k- ω shear stress transport model. More accurate results of ζ Φ can be achieved by extending the evaluation domain of the dissipation further downstream of the region of interest. Herwig and Schmandt [24] extended the domain well over ten times the conduit diameter for the case of a T-junction. Although quantitative loss assessment may be challenging when applying the second law analysis, source locations of loss generation can be visualised qualitatively (see Figure 11).

4.3. Outlook

The presented findings are applied to the development of a novel test rig at the hydraulic laboratory of the Institute of Energy Systems and Thermodynamics at TU Wien, which is currently under construction. In this construction phase, the trade-off between hydraulically perfect design and manufacturing effort is closely monitored to keep manufacturing costs, especially for possible future small hydro applications, at an economically feasible level. After the distributor system test rig has been fully commissioned, in the next phase of the research project, experimental investigations are scheduled to validate the numerical simulations and to gain an even deeper understanding of the flow phenomena in the manifold and the branch lines that ultimately lead to low-quality jets.

Author Contributions

Conceptualisation, F.J.J.H., A.M., B.S., and C.B.; methodology, F.J.J.H.; investigation, F.J.J.H.; data curation, F.J.J.H.; writing—original draft preparation, F.J.J.H.; writing—review and editing, F.J.J.H., A.M., B.S., and C.B.; visualisation, F.J.J.H.; supervision, A.M., B.S., and C.B.; project administration, A.M.; funding acquisition, A.M. and C.B. All authors have read and agreed to the published version of the manuscript.

Funding

The authors acknowledge the financial support through the Österreichische Forschungsförderungsgesellschaft (FFG) under the project ’AxFeeder’ 888084.

Institutional Review Board Statement

Not applicable.

Informed Consent Statement

Not applicable.

Data Availability Statement

The data presented in this study are not publicly available due to confidentiality agreements.

Acknowledgments

The computational results presented have been achieved in part using the Vienna Scientific Cluster (VSC4).

Conflicts of Interest

The authors declare no conflict of interest.

Nomenclature

The following symbols and abbreviations are used in this manuscript:
Latin symbols
A i Surface area of station im2
A L k Diameter at which the branch lines are connected to the manifold m
D 1 Penstock diameter m
D i Diameter of pipe segment at station i m
D p Pitch cycle diameter of the runner m
HGeodetic head m
K p t Total pressure loss coefficient1
kTurbulence kinetic energym2/s2
L i Length of pipe segment starting from station i m
m ˙ Mass flow rate at station i k g / s
n Normal vector of surface A = A · n 1
nNumber of branch lines1
n q Specific speedrpm
P K E Power of kinetic energy W
P m T E Power of mechanical total energy W
P T u r b Power of turbulent dissipation W
P V i s Power of viscous dissipation W
pPressure Pa
p o a Order of accuracy1
p d y n Dynamic pressure Pa
p t Total pressure Pa
QVolumetric flow rate m 3 / s
R e Reynolds number1
r ζ ϕ Non-dimensional distance from center point to design point1
T I Turbulence intensity1
u = u , v , w T Flow velocity and its components m / s
u I Primary flow velocity m / s
u I I Secondary flow velocity m / s
VIntegration volume m 3
y + Non-dimensional wall distance1
Greek symbols
α Deviation angle of first segment of the branch line of design a), see Figure 2
β Diffuser angle
γ Pivot angle of the injector bend
Δ Difference between quantitiesmisc.
δ Deviation angle of the branch line
ε Turbulence eddy dissipation m 2 / s 3
ζ P m T E Power loss coefficient1
ζ Φ Dissipation power coefficient1
η d i s t r i b u t o r Distributor efficiency1
η T Turbine efficiency1
φ Pivot angle of the branch line, see Figure 2
Φ T u r b Turbulent dissipation W
Φ V i s Viscous dissipation W
ϕ I I Secondary velocity ratio1
τ i j Shear stress tensor in index notation Pa
ω Turbulence eddy frequency 1/ s
Constants (within the framework of this study)
gGravitational acceleration9.807 m/s2
β * Coefficient of k- ω SST turbulence model0.09
μ Dynamic viscosity of water at 25 C 8.009 × 10⁻⁴ Pa s
ρ Density of water at 25 C 997 kg/m3
Common indices
dynDynamic
iStation i
KEKinetic energy
maxMaximum
minMinimum
mTEMechanical total energy
refReference
TTurbine
TurbTurbulent
tTotal
VisViscous
IPrimary
IISecondary
101Quantity evaluated at station 101
1011Quantity evaluated as difference of values at stations 1 and 101
Abbreviations
FFGÖsterreichische Forschungsförderungsgesellschaft
GCIGrid convergence index
SLASecond law analysis
SSTShear stress transport

Appendix A

Appendix A.1. Script for Creating Secondary Flow Variables in CFD-Post

The code snippet provided in Listing A1 displays a minimum working example of how to implement the algorithm to compute secondary velocities introduced in Section 2.3.4 in the post-processing utility CFD-Post. The code was tested with CFD-Post 19.2 and CFD-Post 2022 R1.
Listing A1: Minimal working example for creating secondary flow variables in CFD-Post.
Energies 16 02737 i001

References

  1. Bundesministerium für Nachhaltigkeit und Tourismus. Integrierter Nationaler Energie-und Klimaplan für Österreich; Bundesministerium für Nachhaltigkeit und Tourismus: Wien, Austria, 2019. [Google Scholar]
  2. Staubli, T.; Abgottspon, A.; Weibel, P.; Bissel, C.; Parkinson, E.; Leduc, J.; Leboeuf, F. Jet quality and Pelton efficiency. In Proceedings of the Hydro-2009, Lyon, France, 26–28 October 2009. [Google Scholar]
  3. Staubli, T.; Weibel, P.; Bissel, C.; Karakolcu, A.; Bleiker, U. Efficiency increase by jet quality improvement and reduction of splashing water in the casing of Pelton turbines. In Proceedings of the 16th International Seminar on Hydropowerplants, Laxenburg, 24–26 November 2010. [Google Scholar]
  4. Sick, M.; Drtina, P.; Schärer, C.; Keck, H. Numerical and experimental analyses of Pelton Turbine Flow Part 1: Distributor and Injector. In Proceedings of the 20th IAHR Symposium on Hydraulic Machinery and Systems, Charlotte, NC, USA, 6–9 August 2000. [Google Scholar]
  5. Peron, M.; Parkinson, E.; Geppert, L.; Staubli, T. Importance of Jet Quality on Pelton Efficiency and Cavitation. In Proceedings of the International Conference on Hydraulic Efficiency Measurements, Milan, Italy, 3–6 September 2008. [Google Scholar]
  6. Santolin, A.; Cavazzini, G.; Ardizzon, G.; Pavesi, G. Numerical investigation of the interaction between jet and bucket in a Pelton turbine. Proc. Inst. Mech. Eng. Part A J. Power Energy 2009, 223, 721–728. [Google Scholar] [CrossRef]
  7. Erlach, J.; Staubli, T. Pelton Turbine with a Supply System. WO 2008/003390 A1, 14 June 2007. [Google Scholar]
  8. Erlach, J.; Erlach, P. We proudly present the first up to Six Jets Horizontal Pelton Turbine. In Proceedings of the Hidroenergia 2014, European Small Hydropower Association (ESHA) Congress, Istanbul, Turkey, 21–23 May 2014. [Google Scholar]
  9. Erlach, J.; Erlach, P. Neues Pelton-Konzept—bis zu sechs Düsen in horizontaler Anordnung. WasserWirtschaft 2016, 106, 18–24. [Google Scholar] [CrossRef]
  10. Giesecke, J.; Heimerl, S.; Mosonyi, E. Wasserkraftanlagen: Planung, Bau und Betrieb; Springer: Berlin/Heidelberg, Germany, 2014. [Google Scholar]
  11. Han, L.; Duan, X.; Gong, R.; Zhang, G.; Wang, H.; Wei, X. Physic of secondary flow phenomenon in distributor and bifurcation pipe of Pelton turbine. Renew. Energy 2019, 131, 159–167. [Google Scholar] [CrossRef]
  12. Parkinson, E.; Lestriez, R.; Chapuis, L. Flow Calculations in Pelton Turbines—Part 1: Repartitor and Injector Numerical Analysis. In Proceedings of the 19th IAHR Symposium on Hydraulic Machinery and Systems, Singapore, 9–11 September 1998; pp. 285–293. [Google Scholar]
  13. Lei, H.; Gaofu, Z.; Ruzhi, G.; Hongda, W.; Wei, L. Physics of bad-behaved flow in 6-Nozzle Pelton turbine through dynamic simulation. In IOP Conference Series: Earth and Environmental Science; IOP Publishing: Bristol, UK, 2019; Volume 240, p. 022018. [Google Scholar] [CrossRef]
  14. Patel, K.; Patel, B.; Yadav, M.; Foggia, T. Development of Pelton turbine using numerical simulation. In IOP Conference Series: Earth and Environmental Science; IOP Publishing: Bristol, UK, 2010; Volume 12, p. 012048. [Google Scholar] [CrossRef]
  15. Shiraishi, T.; Watakabe, H.; Sago, H.; Konomura, M.; Yamaguchi, A.; Fujii, T. Resistance and fluctuating pressures of a large elbow in high Reynolds numbers. J. Fluids Eng. 2006, 128, 1063–1073. [Google Scholar] [CrossRef]
  16. Dixon, S.L.; Hall, C. Fluid Mechanics and Thermodynamics of Turbomachinery; Butterworth-Heinemann: Oxford, UK, 2013. [Google Scholar]
  17. Idelchik, I.E. Handbook of Hydraulic Resistance, 3rd ed.; Jaico Publishing House: Mumbai, India, 2005. [Google Scholar]
  18. Hahn, F.; Semlitsch, B.; Bauer, C. On the numerical assessment of flow losses and secondary flows in Pelton turbine manifolds. In IOP Conference Series: Earth and Environmental Science; IOP Publishing: Bristol, UK, 2022; Volume 1079, p. 012082. [Google Scholar] [CrossRef]
  19. Kock, F.; Herwig, H. Local entropy production in turbulent shear flows: A high-Reynolds number model with wall functions. Int. J. Heat Mass Transf. 2004, 47, 2205–2215. [Google Scholar] [CrossRef]
  20. Kock, F.; Herwig, H. Entropy production calculation for turbulent shear flows and their implementation in CFD codes. Int. J. Heat Fluid Flow 2005, 26, 672–680. [Google Scholar] [CrossRef]
  21. Schmandt, B.; Herwig, H. Internal flow losses: A fresh look at old concepts. J. Fluids Eng. 2011, 133, 051201. [Google Scholar] [CrossRef]
  22. Schmandt, B.; Herwig, H. Losses due to conduit components: An optimization strategy and its application. J. Fluids Eng. 2016, 138, 031204. [Google Scholar] [CrossRef]
  23. Schmandt, B.; Herwig, H. Diffuser and nozzle design optimization by entropy generation minimization. Entropy 2011, 13, 1380–1402. [Google Scholar] [CrossRef] [Green Version]
  24. Herwig, H.; Schmandt, B. How to determine losses in a flow field: A paradigm shift towards the second law analysis. Entropy 2014, 16, 2959–2989. [Google Scholar] [CrossRef] [Green Version]
  25. Böhle, M.; Fleder, A.; Mohr, M. Study of the losses in fluid machinery with the help of entropy. In Proceedings of the 16th International Symposium on Transport Phenomena and Dynamics of Rotating Machinery, Honolulu, HI, USA, 10–15 April 2016; pp. 1–9. [Google Scholar]
  26. Menter, F.R. Improved Two-Equation k-Omega Turbulence Models for Aerodynamic Flows; Technical Report NASA-TM-103975; National Aeronautics and Space Administration: Moffett Field, CA, USA, 1992. [Google Scholar]
  27. Staubli, T.; Bissel, C. Jet Improvement for Swiss Pelton Plants; Technical Report; swisselectric (defunct as of 2017): Bern, Switzerland, 2009. [Google Scholar]
  28. CFX 19.2: CFX-Solver Theory Guide; ANSYS, Inc.: Canonsburg, PA, USA, 2023.
  29. Celik, I.B.; Ghia, U.; Roache, P.J.; Freitas, C.J. Procedure for estimation and reporting of uncertainty due to discretization in CFD applications. J. Fluids Eng. 2008, 130, 078001. [Google Scholar] [CrossRef] [Green Version]
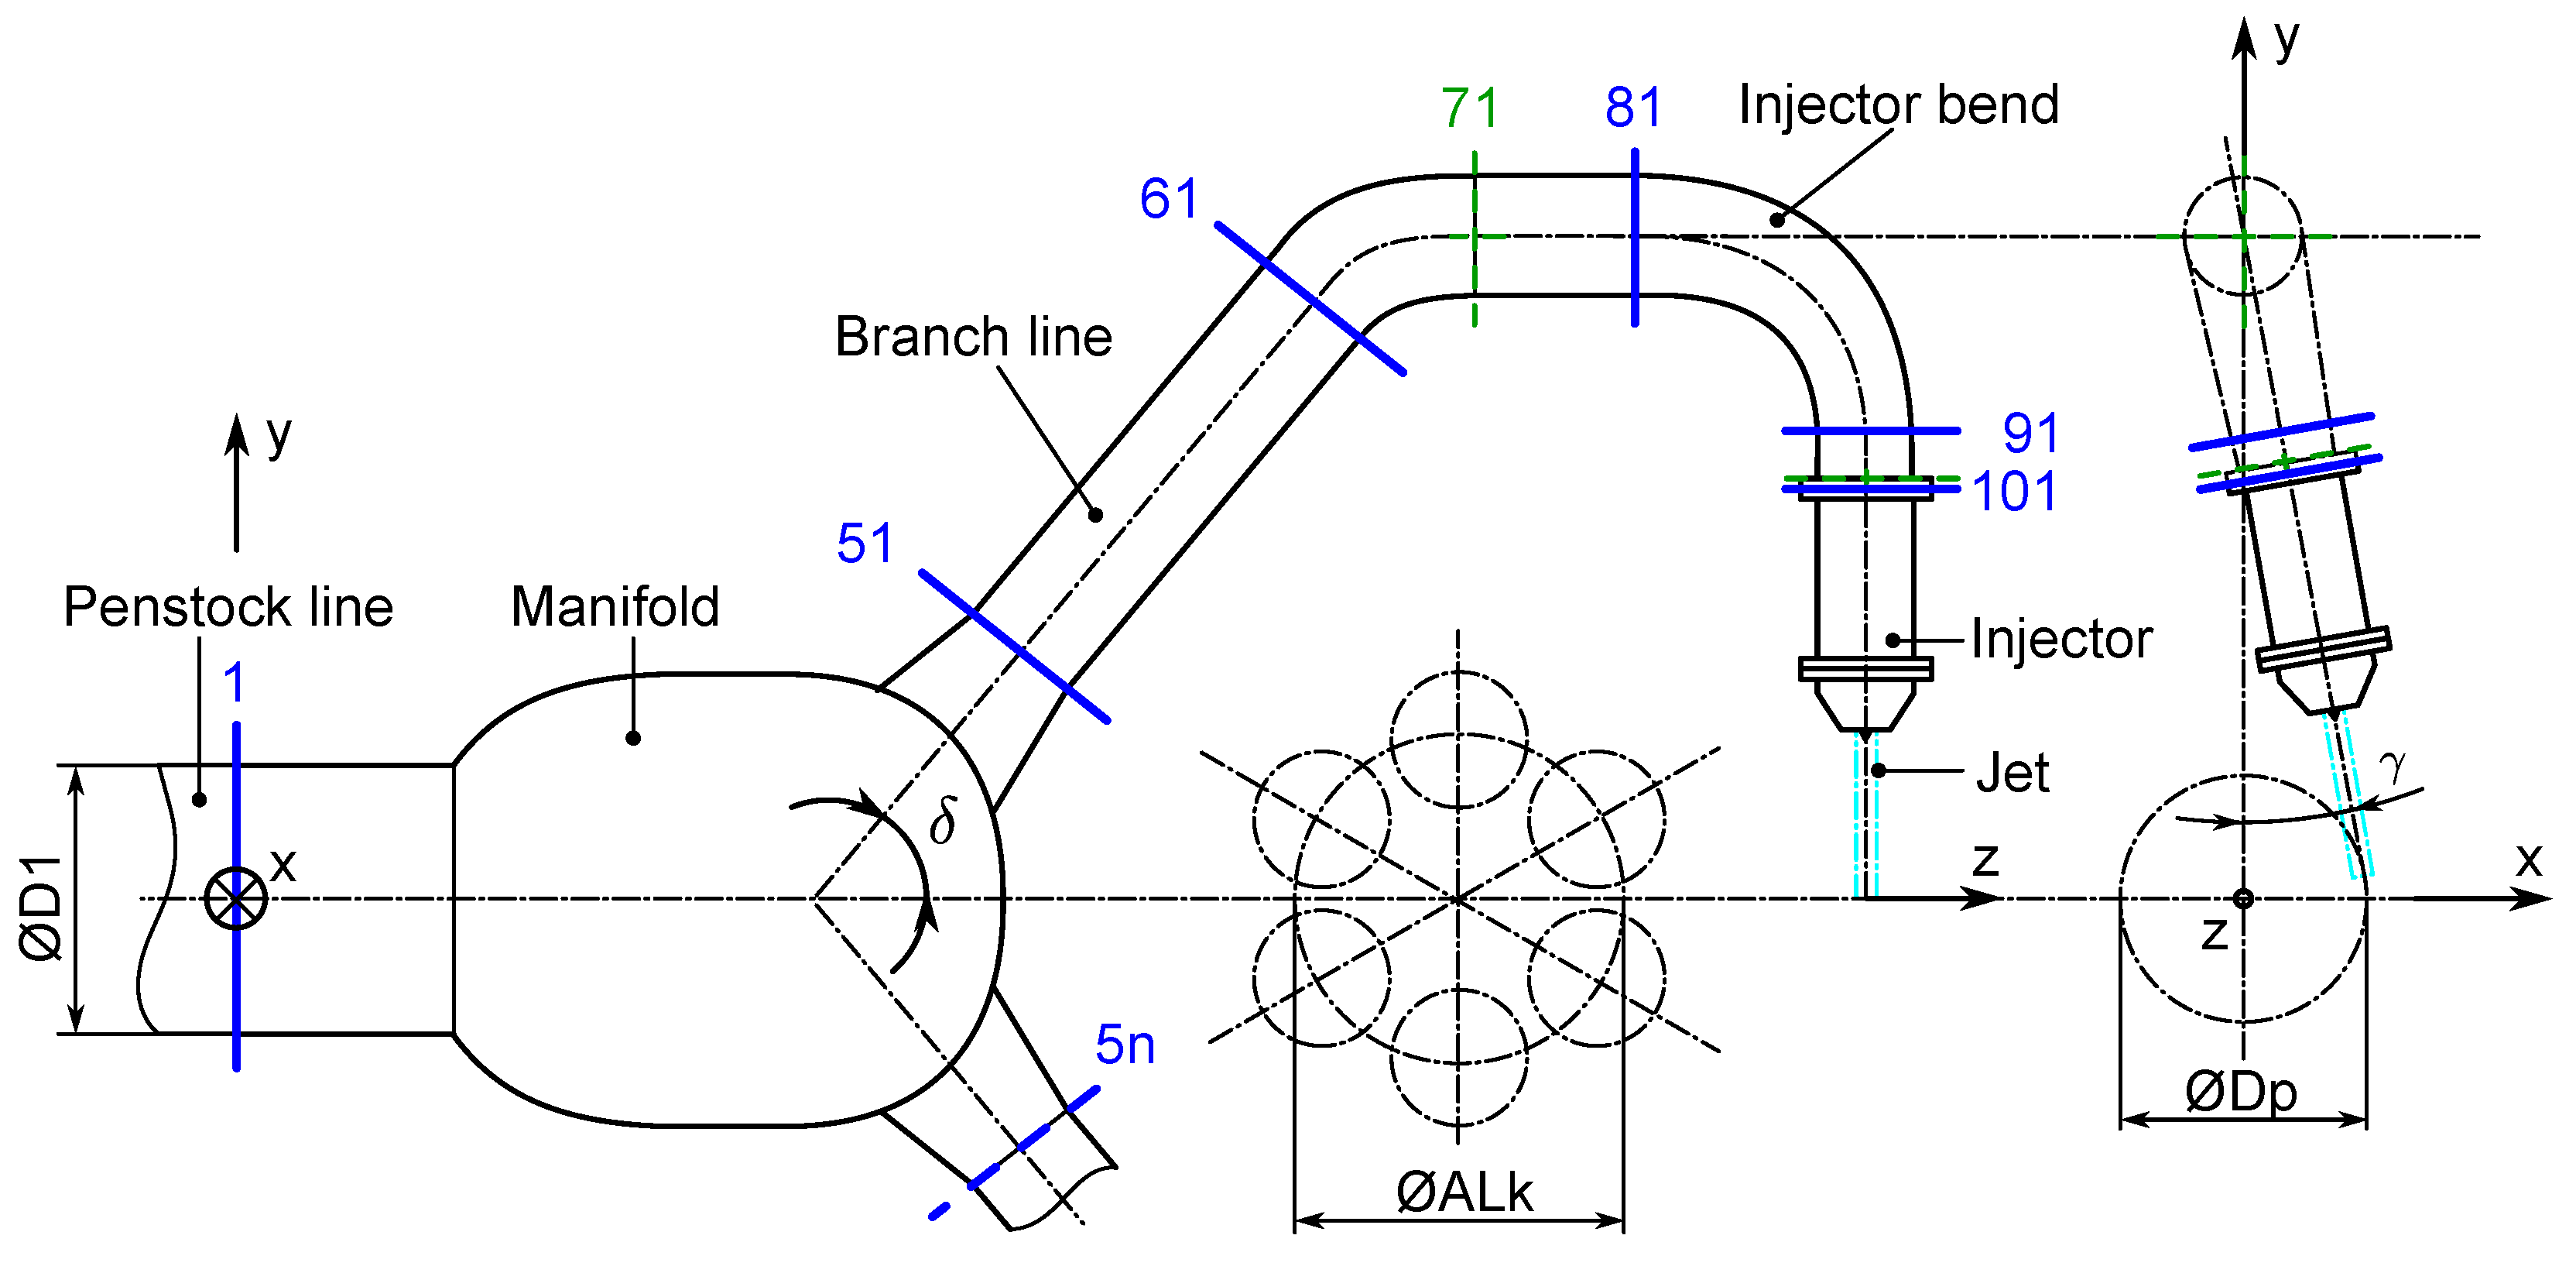
Figure 2. Generic sketch of the AxFeeder (Pelton turbine distributor system with axial inflow) with the individual components and evaluation stations from 1 to 101.
Energies 16 02737 g002
Figure 3. Sketch of the four basic investigated manifold designs: (a) basic model (for mesh and symmetry study), (b) basic model with conical frustum, (c) spherical manifold, (d) cylindrical manifold.
Energies 16 02737 g003
Figure 4. Computational domain (a), results of mesh study for integral values (b), and local velocities (c).
Energies 16 02737 g004
Figure 5. Operating charts of the AxFeeder basic model (part (a) of Figure 3) showing the power loss coefficients (a) and the secondary velocity ratio at station 101 (b) against the inlet Reynolds number.
Energies 16 02737 g005
Figure 6. Line plots of the power loss coefficients and secondary velocity ratios of basic model. Charts (a,b) show the effect of a variation in the diameter ratio D 51 / D 1 , (c,d), the fillet radius R 40 / D 51 , and (e,f) of the diffuser angle β .
Energies 16 02737 g006
Figure 7. Line plots of the power loss coefficients and secondary velocity ratios of the basic model with conical frustum. Charts (a,b) show the effect of a variation of the diameter ratio D 40 / D 51 of the frustum for different deviation angles δ . Charts (c,d) show the effect of a variation of the same diameter ratio for a horizontal pivot angle φ = 15 . Charts (e,f) show the effect of a variation of the diameter ratios D 51 / D 101 and D 51 / D 71 for converging pipe bend sections 61–71 (configuration C) and 81–91 (configurations A, B).
Energies 16 02737 g007
Figure 8. Line plots of the power loss coefficients and secondary velocity ratios of the model with spherical manifold. Charts (a,b) show the effect of a variation of the deviation angle δ for five different sphere radii S R 40 / D 1 for a configuration without a frustum. Charts (c,d) show the effect of a variation of the frustum diameter ratio D 40 / D 51 for different deviation angles δ and a fixed sphere radius of S R 40 / D 1 = 0.6 .
Energies 16 02737 g008
Figure 9. Line plots of the power loss coefficients and secondary velocity ratios of the model with cylindrical manifold. Charts (a,b) show the effect of a variation of the deviation angle δ for different axial positions T 4 / D 51 of the branch line. Charts (c,d) show the effect of applying a fillet of radius R 40 / D 51 to smooth the connection between the cylindrical manifold and the branch lines for four different deviation angles.
Energies 16 02737 g009
Figure 10. Scatter plot of normalised secondary velocity ratio at station 101 ϕ I I , 101 ϕ I I , 101 , r e f against normalised power loss coefficient ζ P m T E , 1011 ζ P m T E , 1011 , r e f . The best configuration of each of the four basic designs is marked by an enlarged triangle and the minimum distance of this point to the centre is indicated by dashed quarter circles. The Pareto front, linking all non-dominated design configurations, is sketched as a dash-dotted black line.
Energies 16 02737 g010
Figure 11. Contour plot of viscous (left column) and turbulent dissipation (right column) in the mid-plane of the best configurations of the four basic designs. The quantities are normalised by the density-weighted turbulent eddy dissipation at the inlet. Subfigures (a,b) show basic design a), (c,d) show basic design b), (e,f) show basic design c), (g,h) show basic design d).
Energies 16 02737 g011
Figure 12. Contour plots of the basic model with conical frustum (basic design b). The plots on the left show the model with a deviation angle of δ = 50 , and the model on the right has a deviation angle of δ = 90 . The contours on the mid-plane show normalised velocities, the contours encircled in solid black show secondary velocity ratios, and the contours encircled by dashed black lines show the turbulent intensity T I = 2 k 3 u 101 2 .
Energies 16 02737 g012
Table 1. Overview of cases and varied parameters.
Basic DesignVaried ParametersShown in
(a) basic modeldiameter ratio D51/D1, fillet radius R40/D51, diffuser angle βFigure 5, Figure 6 and Figure 11
(b) basic model with conical frustumdiameter ratio D40/D51, deviation angle δ, diameter ratios D51/D71 and D51/D101, pivot angle φFigure 7, Figures 11 and 12
(c) spherical manifoldsphere radius SR40/D1, deviation angle δ, diameter ratio D51/D101Figure 8 and Figure 11
(d) cylindrical manifoldaxial position T4/D51, deviation angle δ, fillet radius R40/D51Figure 9 and Figure 11
Disclaimer/Publisher’s Note: The statements, opinions and data contained in all publications are solely those of the individual author(s) and contributor(s) and not of MDPI and/or the editor(s). MDPI and/or the editor(s) disclaim responsibility for any injury to people or property resulting from any ideas, methods, instructions or products referred to in the content.