Article

Component-Oriented Modeling Method for Real-Time Simulation of Power Systems

1
The Key Laboratory of Smart Grid of Ministry of Education, Tianjin University, Tianjin 300072, China
2
NR Electric Co., Ltd., Nanjing 211102, China
*
Author to whom correspondence should be addressed.
Energies 2023, 16(6), 2731; https://doi.org/10.3390/en16062731
Submission received: 24 February 2023 / Revised: 10 March 2023 / Accepted: 14 March 2023 / Published: 15 March 2023

Abstract

:
This paper proposes a component-oriented modeling method for power system simulation, which optimizes the modeling process of the FPGA-based real-time digital simulator (FRTDS) to enhance its computational efficiency. In this paper, a component modeling method for various types of elements in the power system is presented, which makes the modeling process in FRTDS more user-friendly and highly scalable. By applying the concepts of combination and reconstruction of components to electrical components, the component-oriented modeling method becomes better suited for combined elements with fixed connection modes and elements that require online model replacement in the power system. Utilizing the characteristics of component-oriented modeling, the variable declaration structure and node elimination strategy in the simulation script are optimized, enabling the simulation script to fit better with the hardware structure of FRTDS. Additionally, a substation is simulated in FRTDS with a simulation step size of 50 µs, thus verifying the correctness of the component-oriented modeling method and its ability to improve the computational power of FRTDS.

1. Introduction

At present, with the rapid growth in the scale of power systems, the capacity, transmission distance, voltage level, and regional interconnectivity of such systems are continuously increasing. This series of developments has also made it increasingly difficult for power technicians to monitor, analyze, and control power systems, posing great challenges to the safety, reliability, and stable operation of these systems. Digital simulation technology, which can simulate an actual power system’s operating state by establishing an appropriate mathematical model, has the advantages of reproducible simulation results and easy-to-adjust parameters and has become an important tool for power system analysis and research [1,2,3]. According to the relationship between the simulation system’s time scale and the actual system’s time scale, power system simulation can be divided into real-time simulation and offline simulation [4,5]. Real-time simulation requires the calculation time in the simulation model to be consistent with real physical time. Therefore, this type of simulation can be used for hardware-in-the-loop tests and plays an important role in the design, testing, and detection of power system control and protection systems [6,7,8].
Real-time digital simulation technology using a CPU as the computing and executing hardware was developed several years ago and is now relatively mature. Mainstream real-time simulation devices such as RTDS [9], RT-LAB [10], and HYPERSIM [11] all initially used CPU-based underlying hardware. Most real-time digital simulation platforms with a CPU as the computing core use computer clusters, multi-CPU shared memory workstations, and dedicated chips and boards, enabling these systems to achieve real-time simulations through coarse-grained parallel computing [12]. However, since CPUs fundamentally work in a serial manner, their applicability is limited when the step size of real-time simulation is small [13]. A field programmable logic gate array (FPGA), which offers a fully configurable parallel hardware structure, distributed memory structure, and deep pipeline structure, has the advantages of low cost and small size. For these reasons, FPGA is gradually becoming widely used in the real-time simulation of power systems [14,15,16]. Relevant studies all designed dedicated hardware circuits in FPGA according to specific simulation objects. The advantage of this approach is that the simulation calculation time can be shortened to the greatest extent, but this type of design is not easy to develop into a commercially available simulation platform with a certain degree of generality. A real-time digital solver (FRTDS) based on FPGA and an instruction stream was designed in [17]. In this study, the most commonly used mathematical expressions and functions were encapsulated in the microprocessor core, and the simulation script was converted into instructions to drive the microprocessor core using a self-developed compiler. When using FRTDS, users only need to write simulation scripts based on the simulation calculation process and do not need to have FPGA programming abilities. This method provides a new direction for the development of FPGA-based commercial real-time simulation platforms that can be widely applied.
The power system simulation modeling process in FRTDS is reflected by the simulation script. Due to the relatively mature FRTDS hardware structure and compiling software, the quality of the simulation script is an important factor that determines whether simulation calculations can be performed in real time. In order to improve the computational efficiency of FRTDS and to make it more suitable for real-time simulation, the present study proposes a component-oriented modeling method applied to script optimization. In the second part, we provide an overview of FRTDS and how the simulation modeling process is reflected in the script of FRTDS. The third part elaborates on the principle of componentization for various elements in the power system. The fourth part proposes the concepts and methods of combination and reconstruction of electrical components. In the fifth part, on the basis of the component-oriented modeling method, the simulation script is optimized based on three aspects: the script generation method, variable declaration, and the node elimination strategy. In the sixth part, a substation with a generator set is used as a simulation example to verify the optimization effect of the component-oriented modeling method on the FRTDS simulation script and the correctness of the simulation results. Finally, the conclusions are given in the seventh part.

2. FRTDS

2.1. Overview of FRTDS

FRTDS consists of two parts: the underlying hardware in the FPGA and the software integrated in the host computer. Figure 1 shows the schematic and photo of the FRTDS-based hardware in the loop-testing system.
The underlying hardware includes a microprocessor core responsible for performing simulation calculations and an external communication interface. The microprocessor core is composed of an arithmetic unit and its controllers, data storage area, and instruction storage area. According to the calculation formulas and functions commonly used in power system real-time simulations, basic arithmetic circuits such as addition, subtraction, multiplication, and division are permanently connected or combined to form an arithmetic unit. This arithmetic unit offers generality for simulation calculations, and its operation is controlled by instructions. Instructions contain the data storage address and operation type of a formula in the simulation program, represented by a string of binary numbers. The arithmetic unit fetches the instructions from the instruction storage area at a certain working frequency and transmits them to the read controller, write controller, and selection controller. The read controller obtains the input data from the data storage area, the arithmetic unit performs calculations according to the working mode given by the selection controller, and the write controller writes the calculation result back to the data storage area. In the simulation step, the calculation instructions are executed sequentially. After the simulation step is over, the controller returns to the starting position of the instructions for cyclic execution, enabling the simulation process to continue. FRTDS generally contains multiple microprocessor cores that exchange data through multi-port reading and writing circuits between the cores [18]. The number of microprocessor cores, data area size, and working frequency should be specifically configured according to the actual resources used in the FPGA chip. During the simulation process, FRTDS needs to communicate with the host computer to receive control commands and output simulation results. As a real-time simulation tool, FRTDS also needs to communicate with secondary devices such as relay protection for hardware-in-the-loop experiments. The authors in [19] provide a design for the external communication circuit of FRTDS, which communicates with the host computer through the UDP/IP protocol and communicates with secondary equipment, such as relay protection devices, through IEC-61850 standard communication protocols, such as GOOSE and SV.
The supporting software of FRTDS includes the graphical modeling tool, the script generation tool, the instruction compiler, and the runtime monitoring system. The graphical modeling tool and runtime monitoring system constitute the user interface of FRTDS. The user specifies information such as the network structure and parameters of the simulation object through the graphical modeling tool. Through the monitoring system, the user can control the start and stop of the simulation, read the simulation results, and send commands to FRTDS during the simulation process to set faults or modify simulation parameters. The simulation script is divided into two parts: the variable declarations and the calculation expressions. The variable declarations are used to declare various variables involved in the simulation calculation, while the calculation expressions reflect the simulation calculation process of the power system. The instruction compiler abstracts the calculation expressions in the script into a directed acyclic graph (DAG), determines the dependencies of the computing tasks, formulates the priority of task execution using the list scheduling algorithm, distributes the computing tasks to each microprocessor core, and ultimately generates control instructions for each microprocessor core [20].

2.2. The Content and Limitations of the Simulation Script

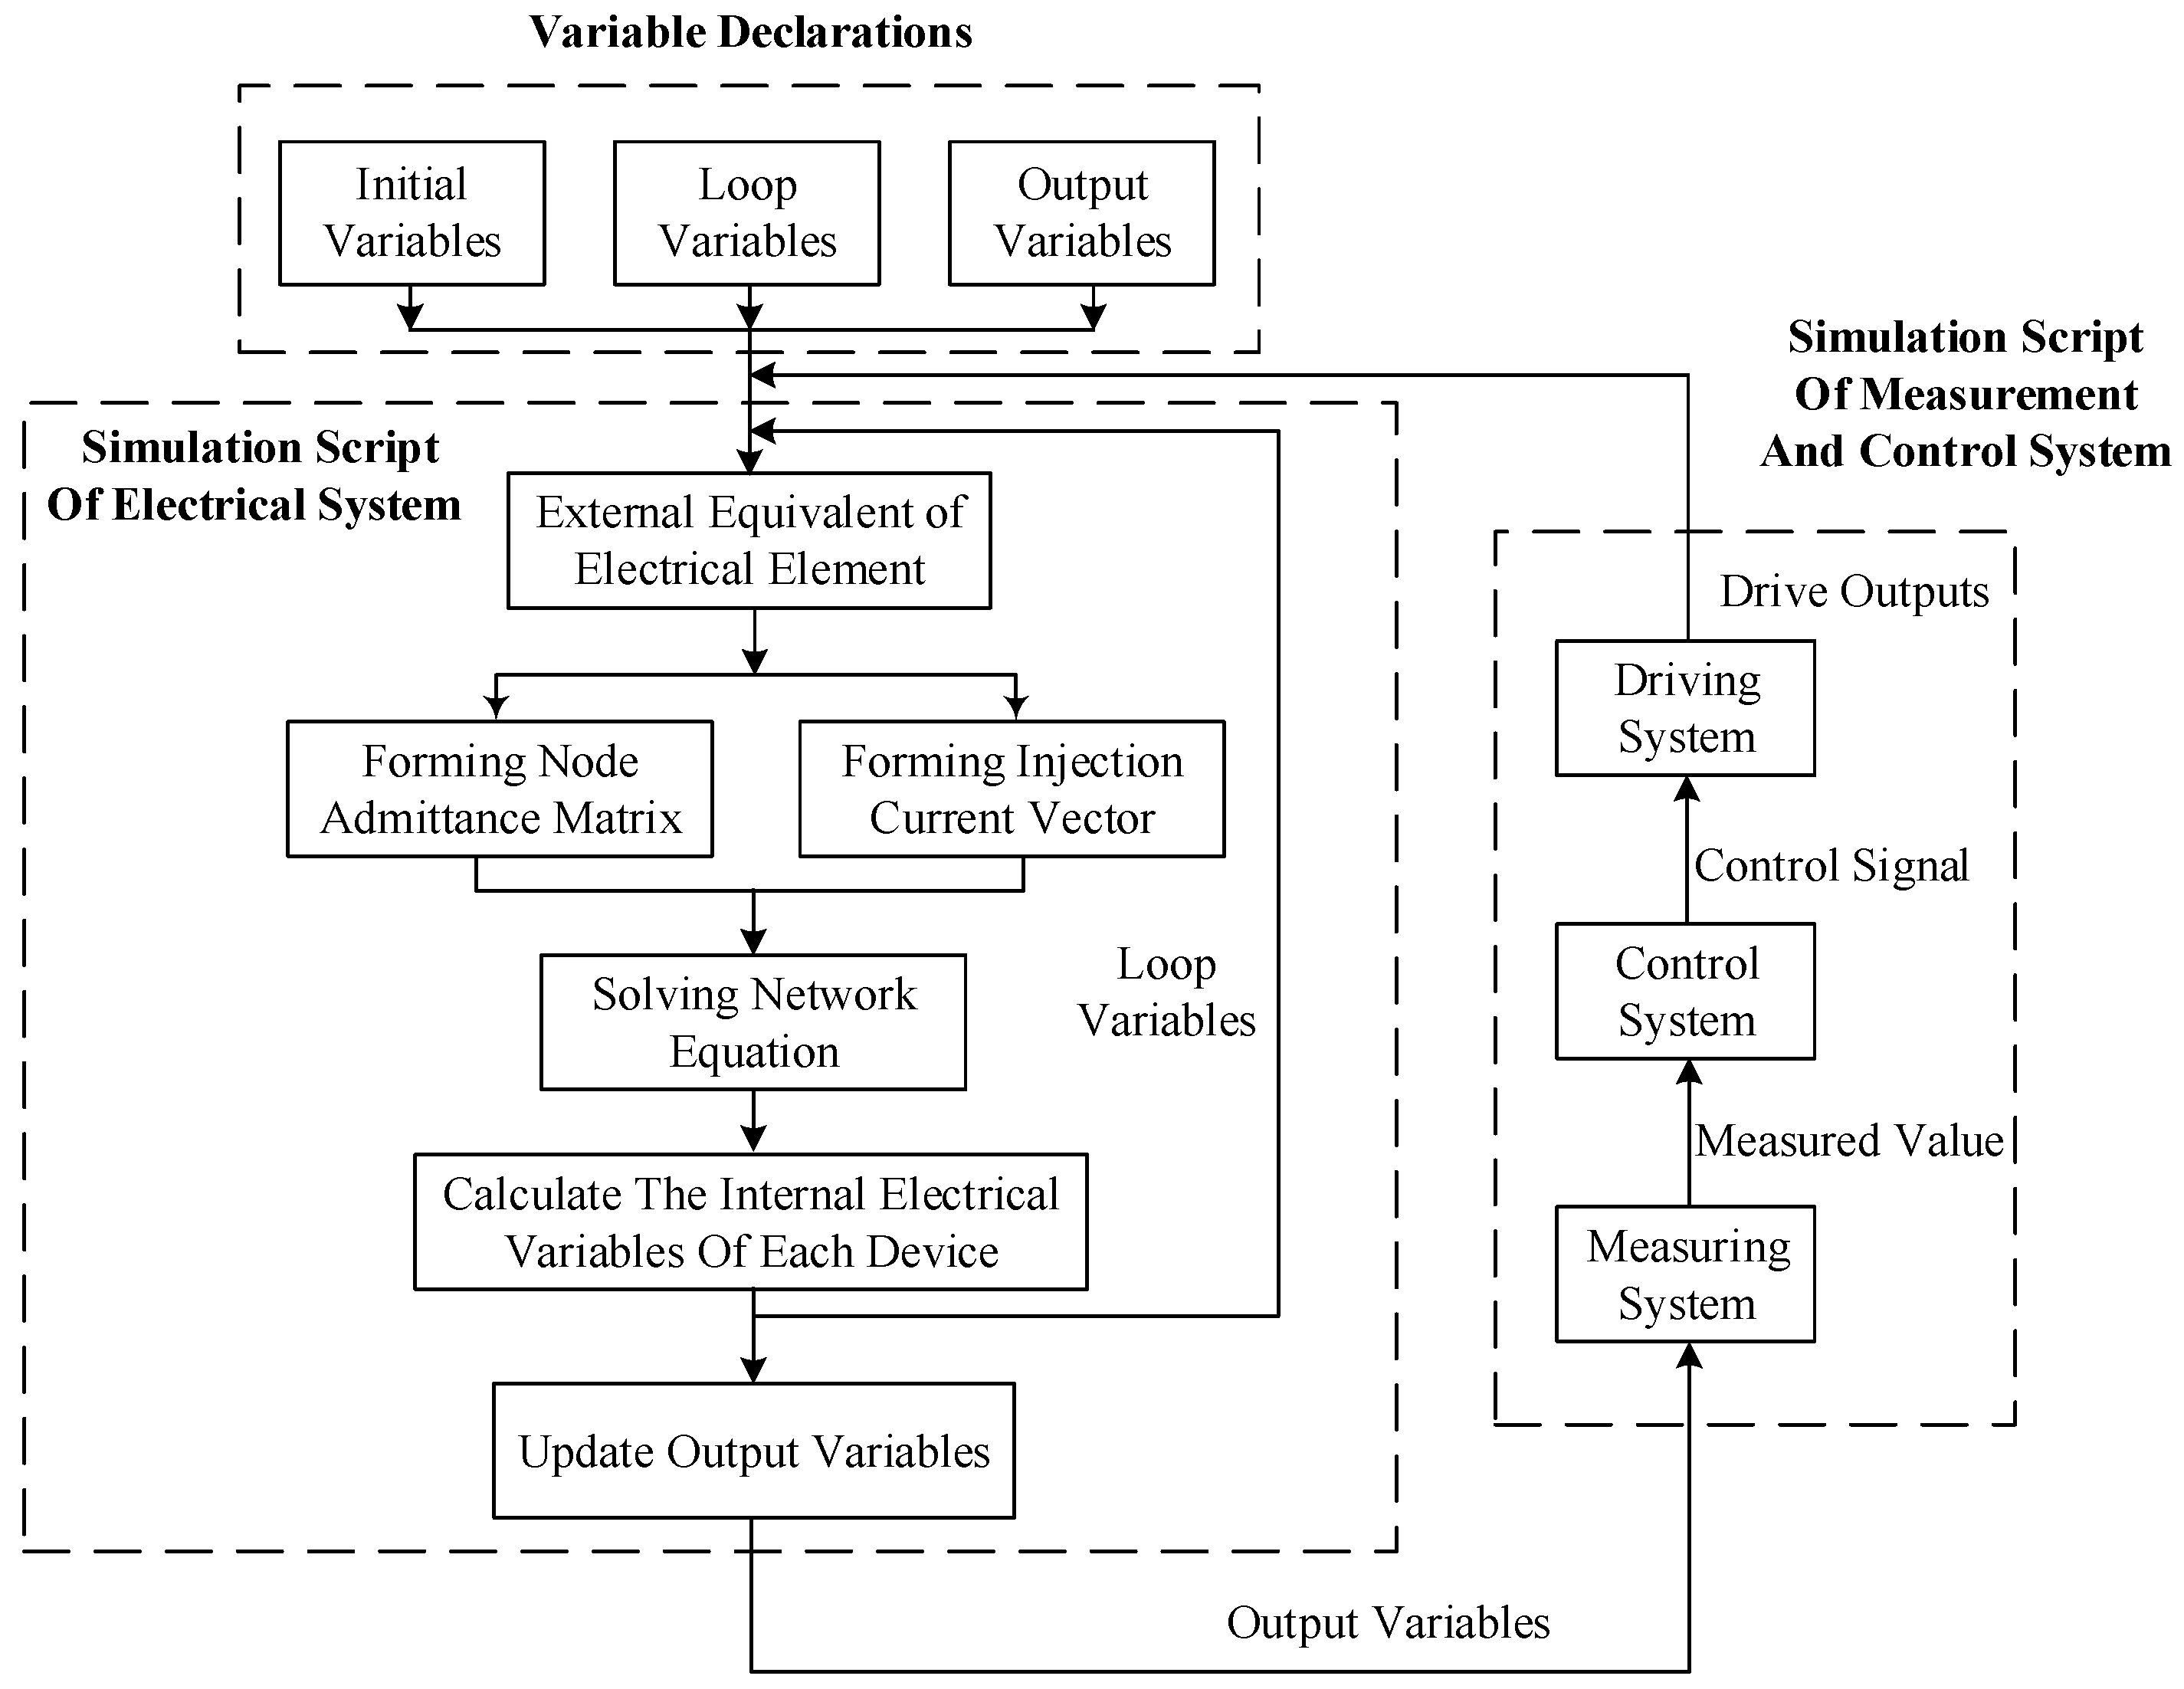
When using FRTDS for real-time simulation, the processes of simulation modeling and model solving are mainly reflected in the simulation script. Generating a simulation script featuring a high degree of fit with the hardware structure of FRTDS can improve the simulation speed and expand the simulation scale. Figure 2 shows the specific content of the simulation script. The power system includes an electrical subsystem composed of various power elements, a control subsystem for controlling the operation of the power system, and an interface subsystem for data exchange between the electrical subsystem and control subsystem. The solving methods for each subsystem are different, so the script calculation can be divided into two parts: the electrical system script and the measurement and control system script. The electrical system simulation script is used for calculations in the electrical subsystem. Based on the node analysis method, the steps of this script mainly include establishing the node admittance matrix, calculating the injected current at each node, solving the network equation to obtain the voltage at each node, calculating the branch current, and updating the historical current source. The measurement and control system script includes calculations related to the control subsystem and the interface subsystem.
Variables declared in the script can be divided into initial variables, loop variables, and output variables. Initial variables refer to data that the simulation program only reads but does not write during the simulation process, such as line parameters and transformer parameters. These data can only be modified through external inputs, such as user modification of parameters, and relay protection device trip signals. Loop values refer to data that are updated within the previous simulation time step and are needed for the calculation of the next simulation time step, such as the voltage and current used to calculate historical current sources. Output variables are simulation results that need to be output externally, such as PT voltage and CT current. In addition, some temporary variables will be generated during the calculation process, such as the temporary variables generated when using the Gauss elimination method to solve network equations. These variables do not need to be declared in the variable declaration section.
The previous script writing method was based on procedure-oriented programming, which considered the overall calculation process of the simulation. When the simulation system is large, this method requires significant work. There is strong coupling between the modeling of different elements and subsystems, making it inconvenient for users to modify, add, or delete some elements of the simulation object. In order to make the script more extensible and the modeling process more user-friendly, the component-oriented design idea can be introduced to decouple various operation links in the modeling process. Component technology originated in software engineering and refers to reusable software components that can be used to construct other software. This is a design concept independent of specific programming languages [21]. By using component-oriented design thinking, the design objects can be encapsulated. Consequently, the user does not need to understand the internal workings of the components but only needs to operate the components according to the prescribed operation methods and connection mechanisms. At the same time, component-oriented modeling methods realize the standardization and normalization of design objects, greatly increasing the system’s scalability and laying a good foundation for the implementation of large-scale systems. To apply the component-oriented modeling method to real-time simulation of power systems, first, the componentization for various types of elements needs to be provided.

3. Component Modeling of Simulation Objects

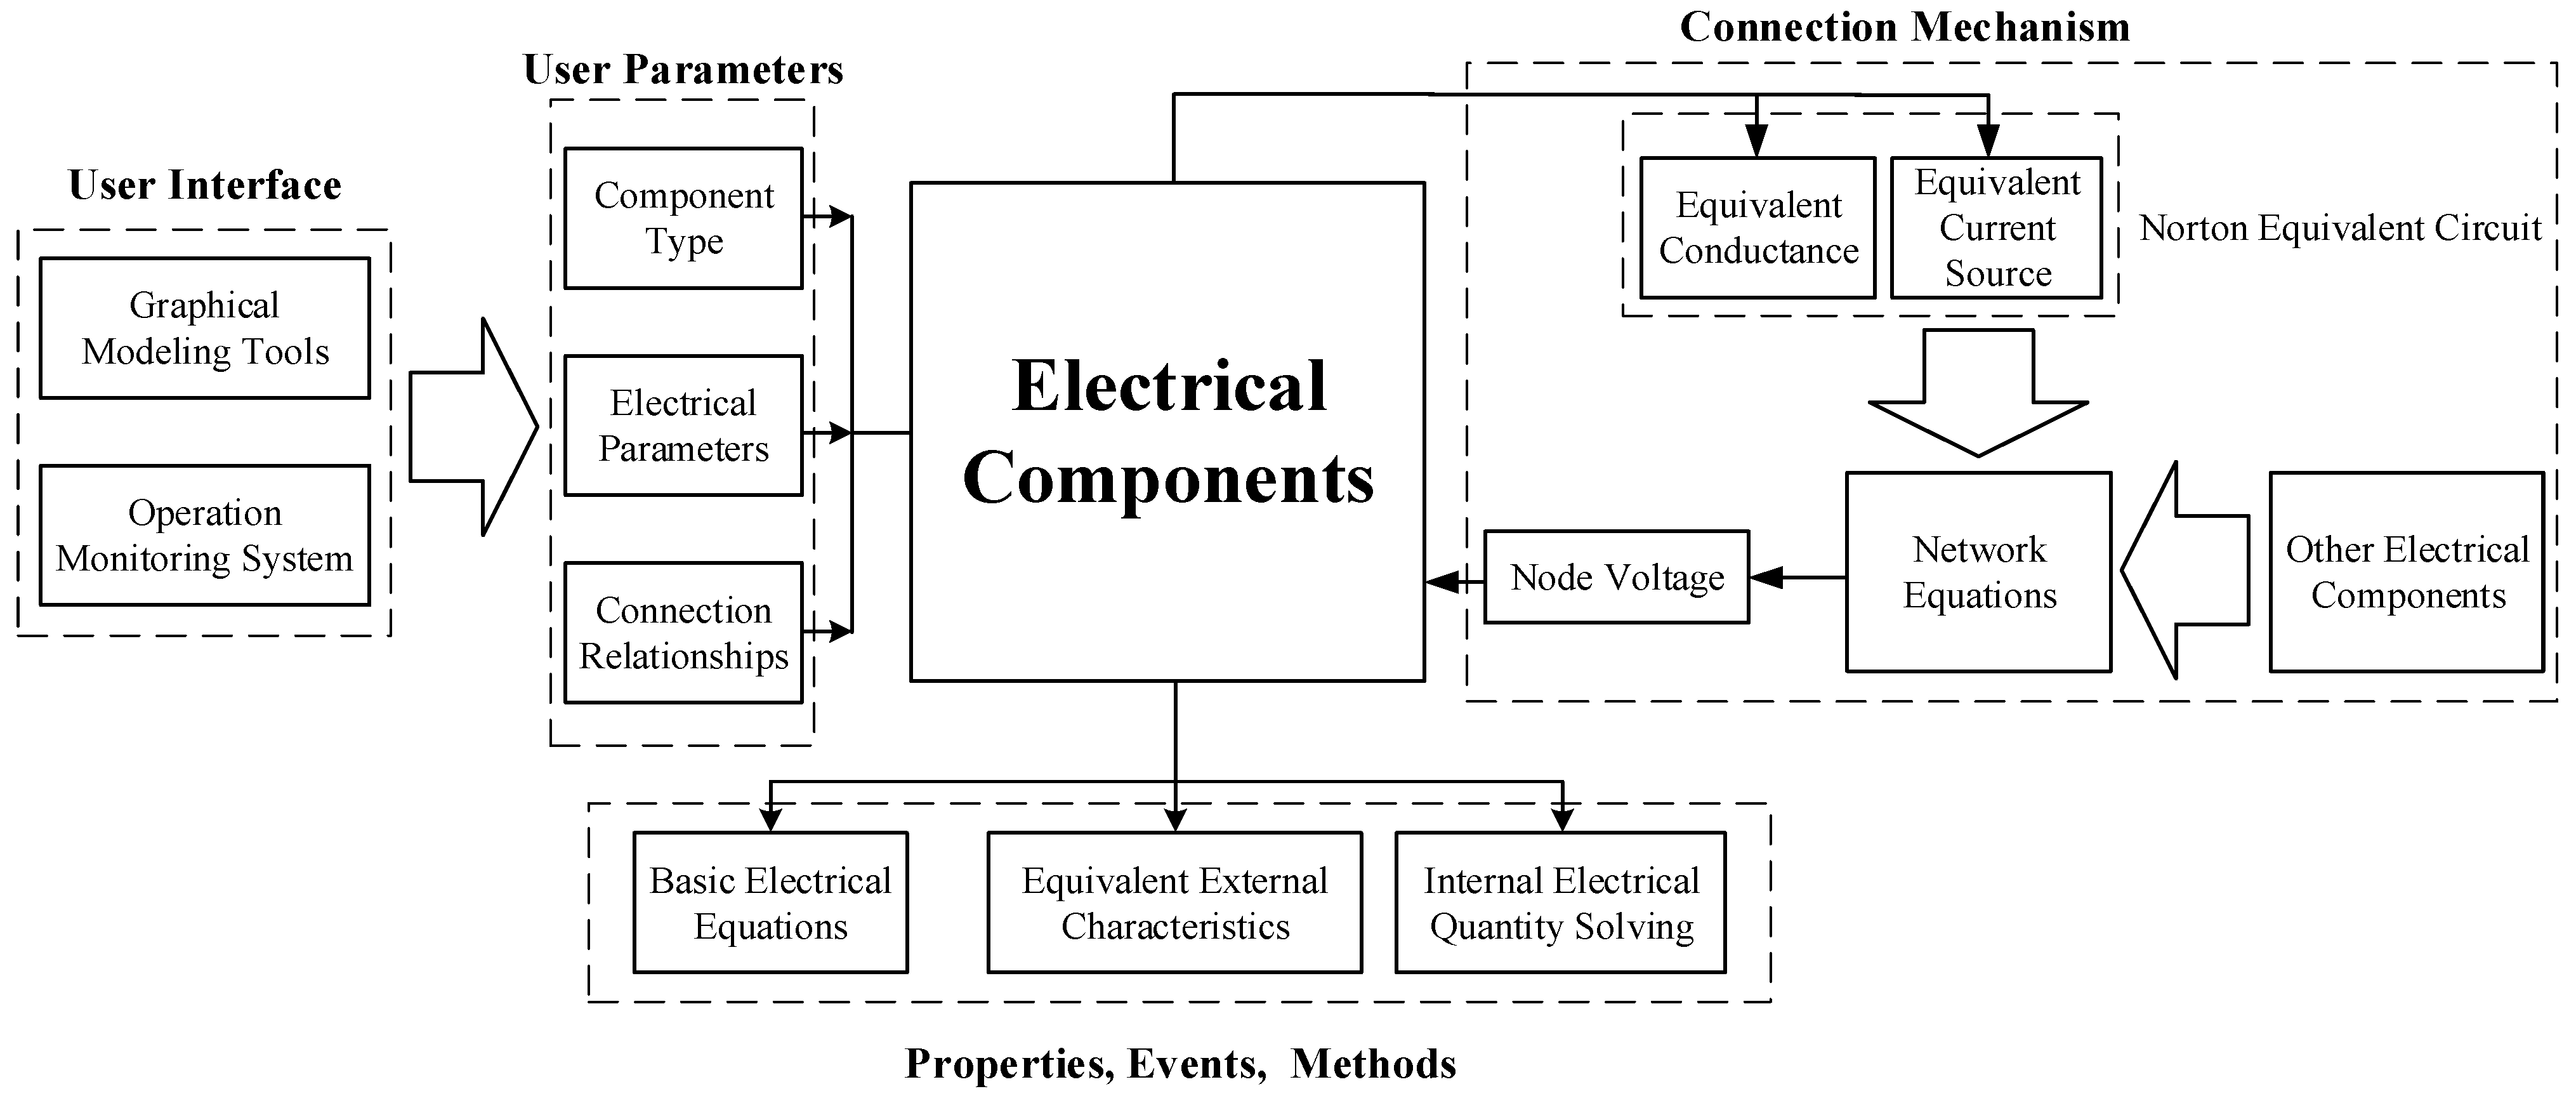
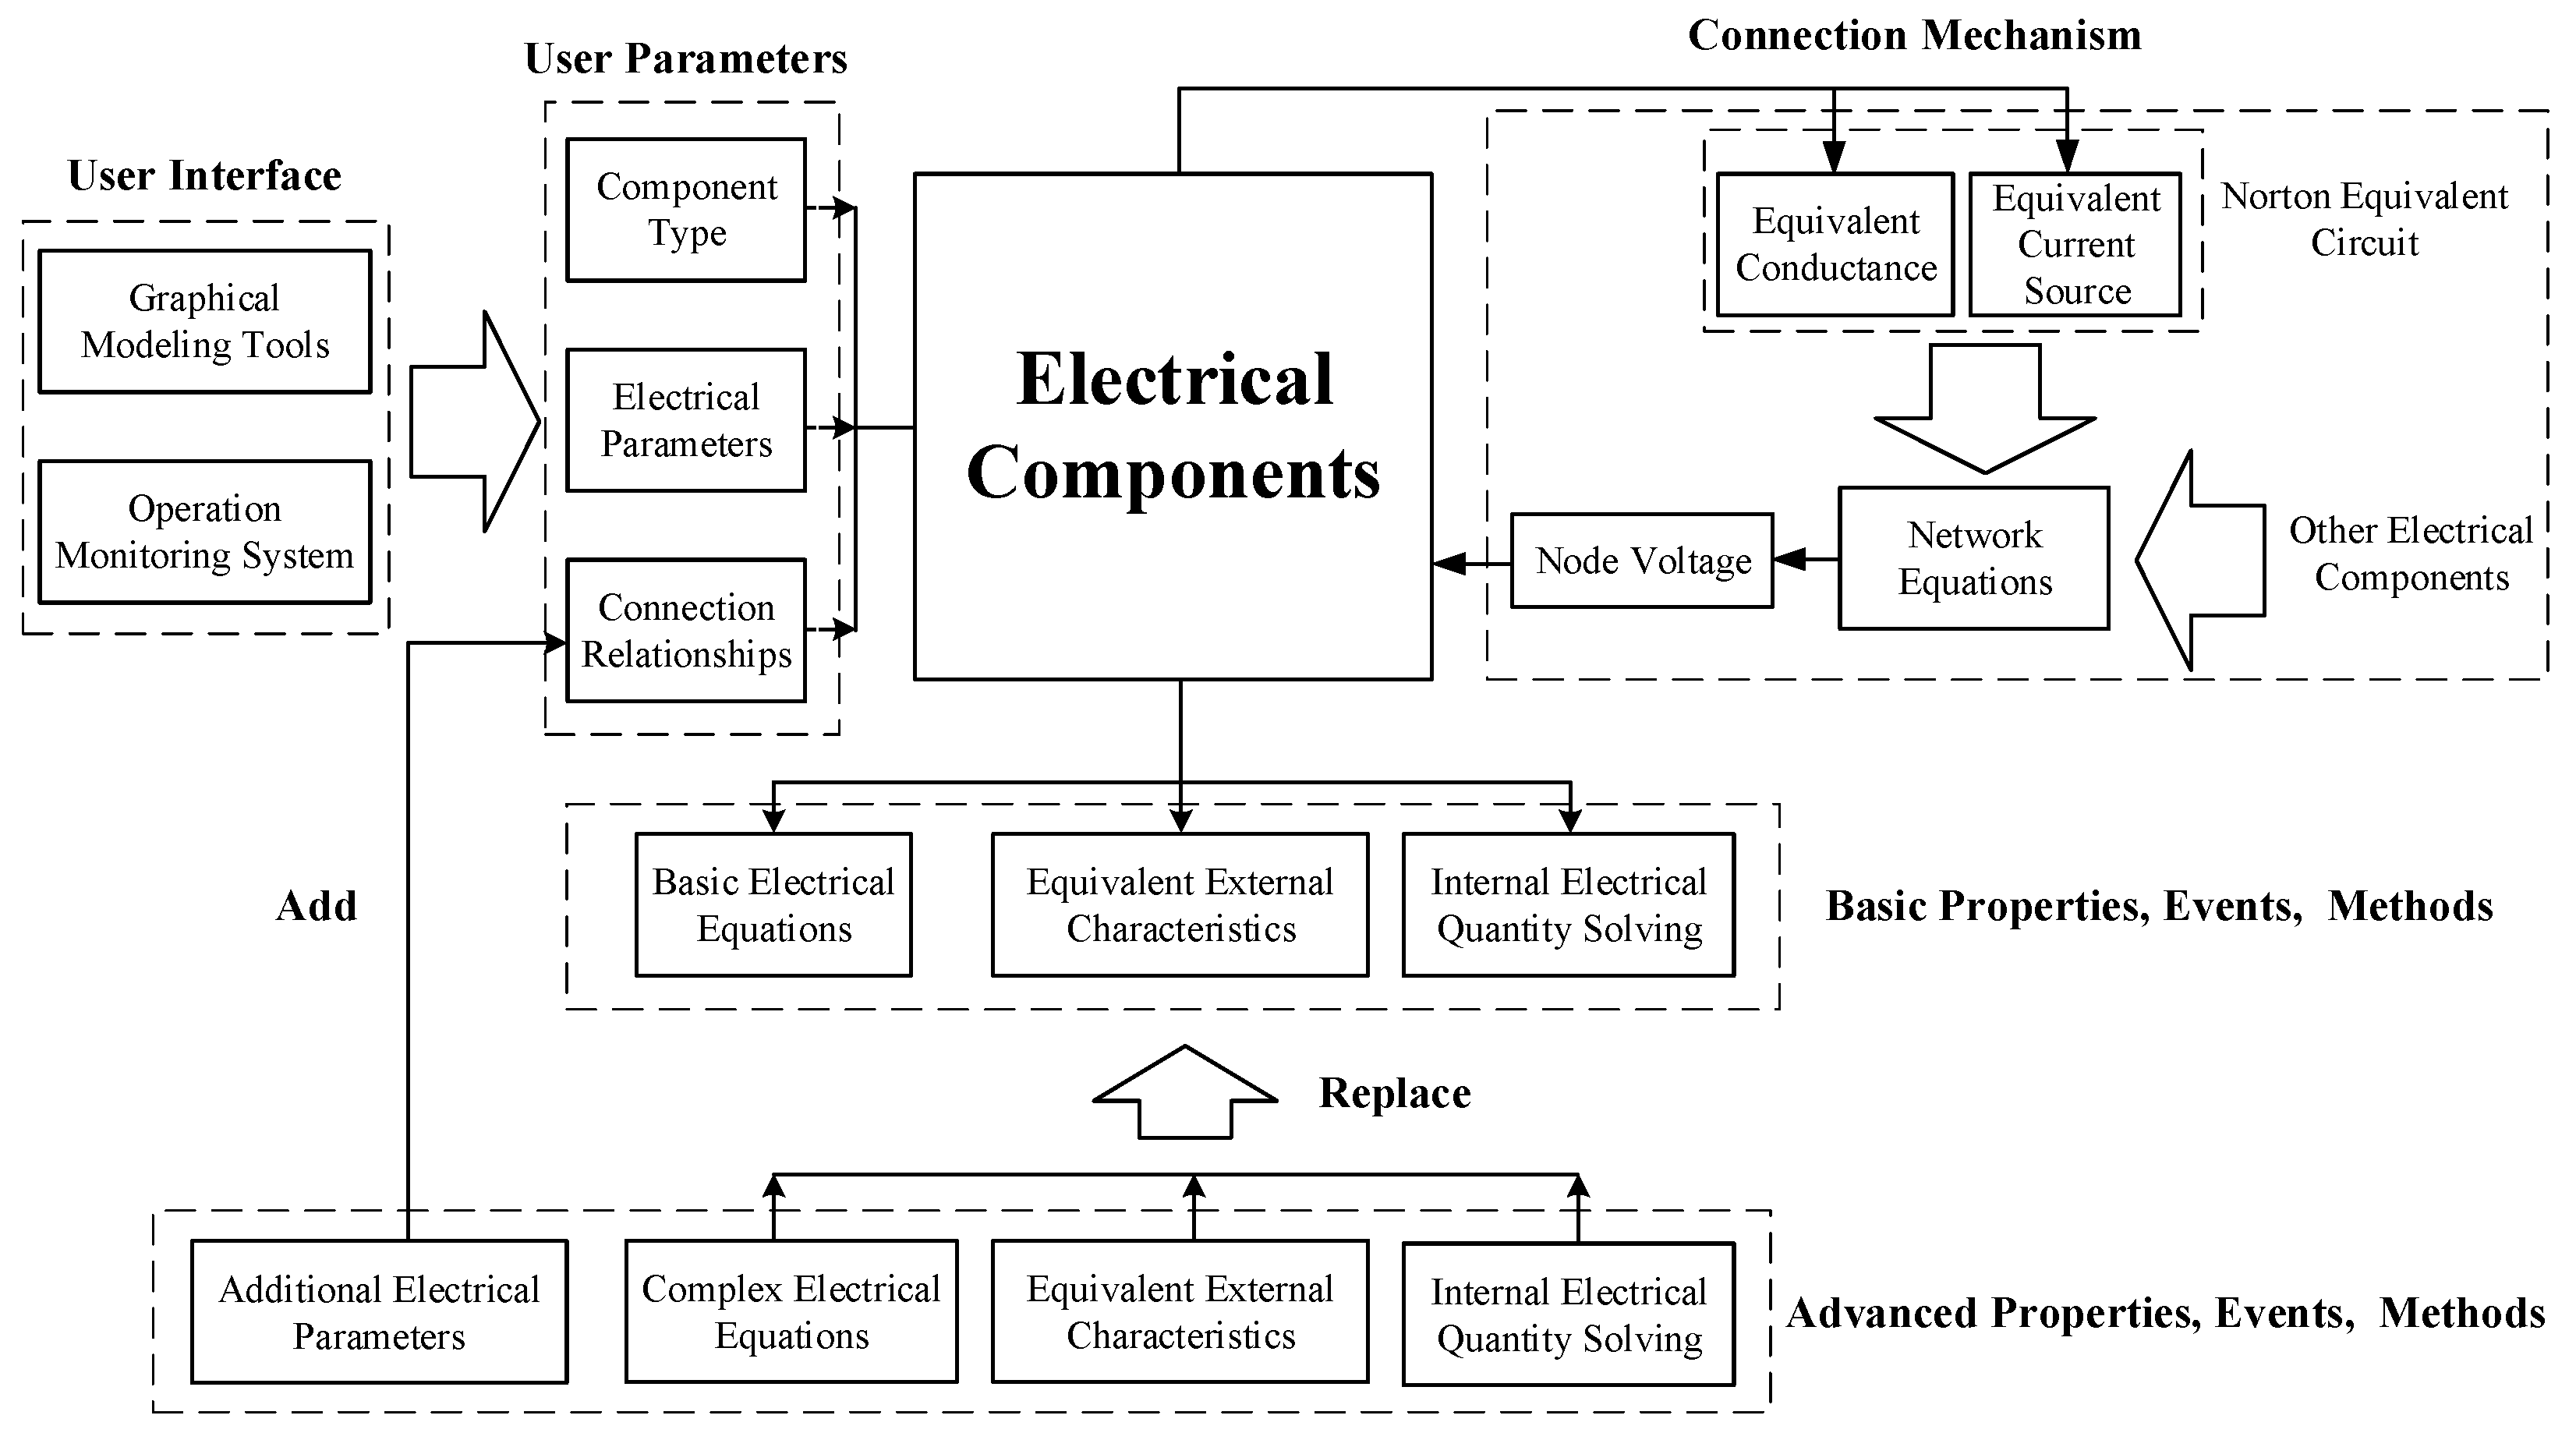
The electrical components are constructed from the electrical elements in the electrical subsystem using the component-oriented modeling method. The properties, methods, and events within the component mainly include the basic electrical equations of the elements, equivalent processes of external characteristics, and internal electrical quantity-solving equations. This information cannot be directly operated by the user and can only be indirectly operated through the user interface. The external interface connecting the electrical components to other components is the Norton equivalent circuit in which conductance and current sources are connected in parallel. Connecting each electrical component according to the topology of the power network generates the network equation of the entire electrical subsystem. After solving the network equations, the electrical component completes solving the corresponding electrical component within the time step, using the solved node voltages. Figure 3 shows the structure of the electrical components.
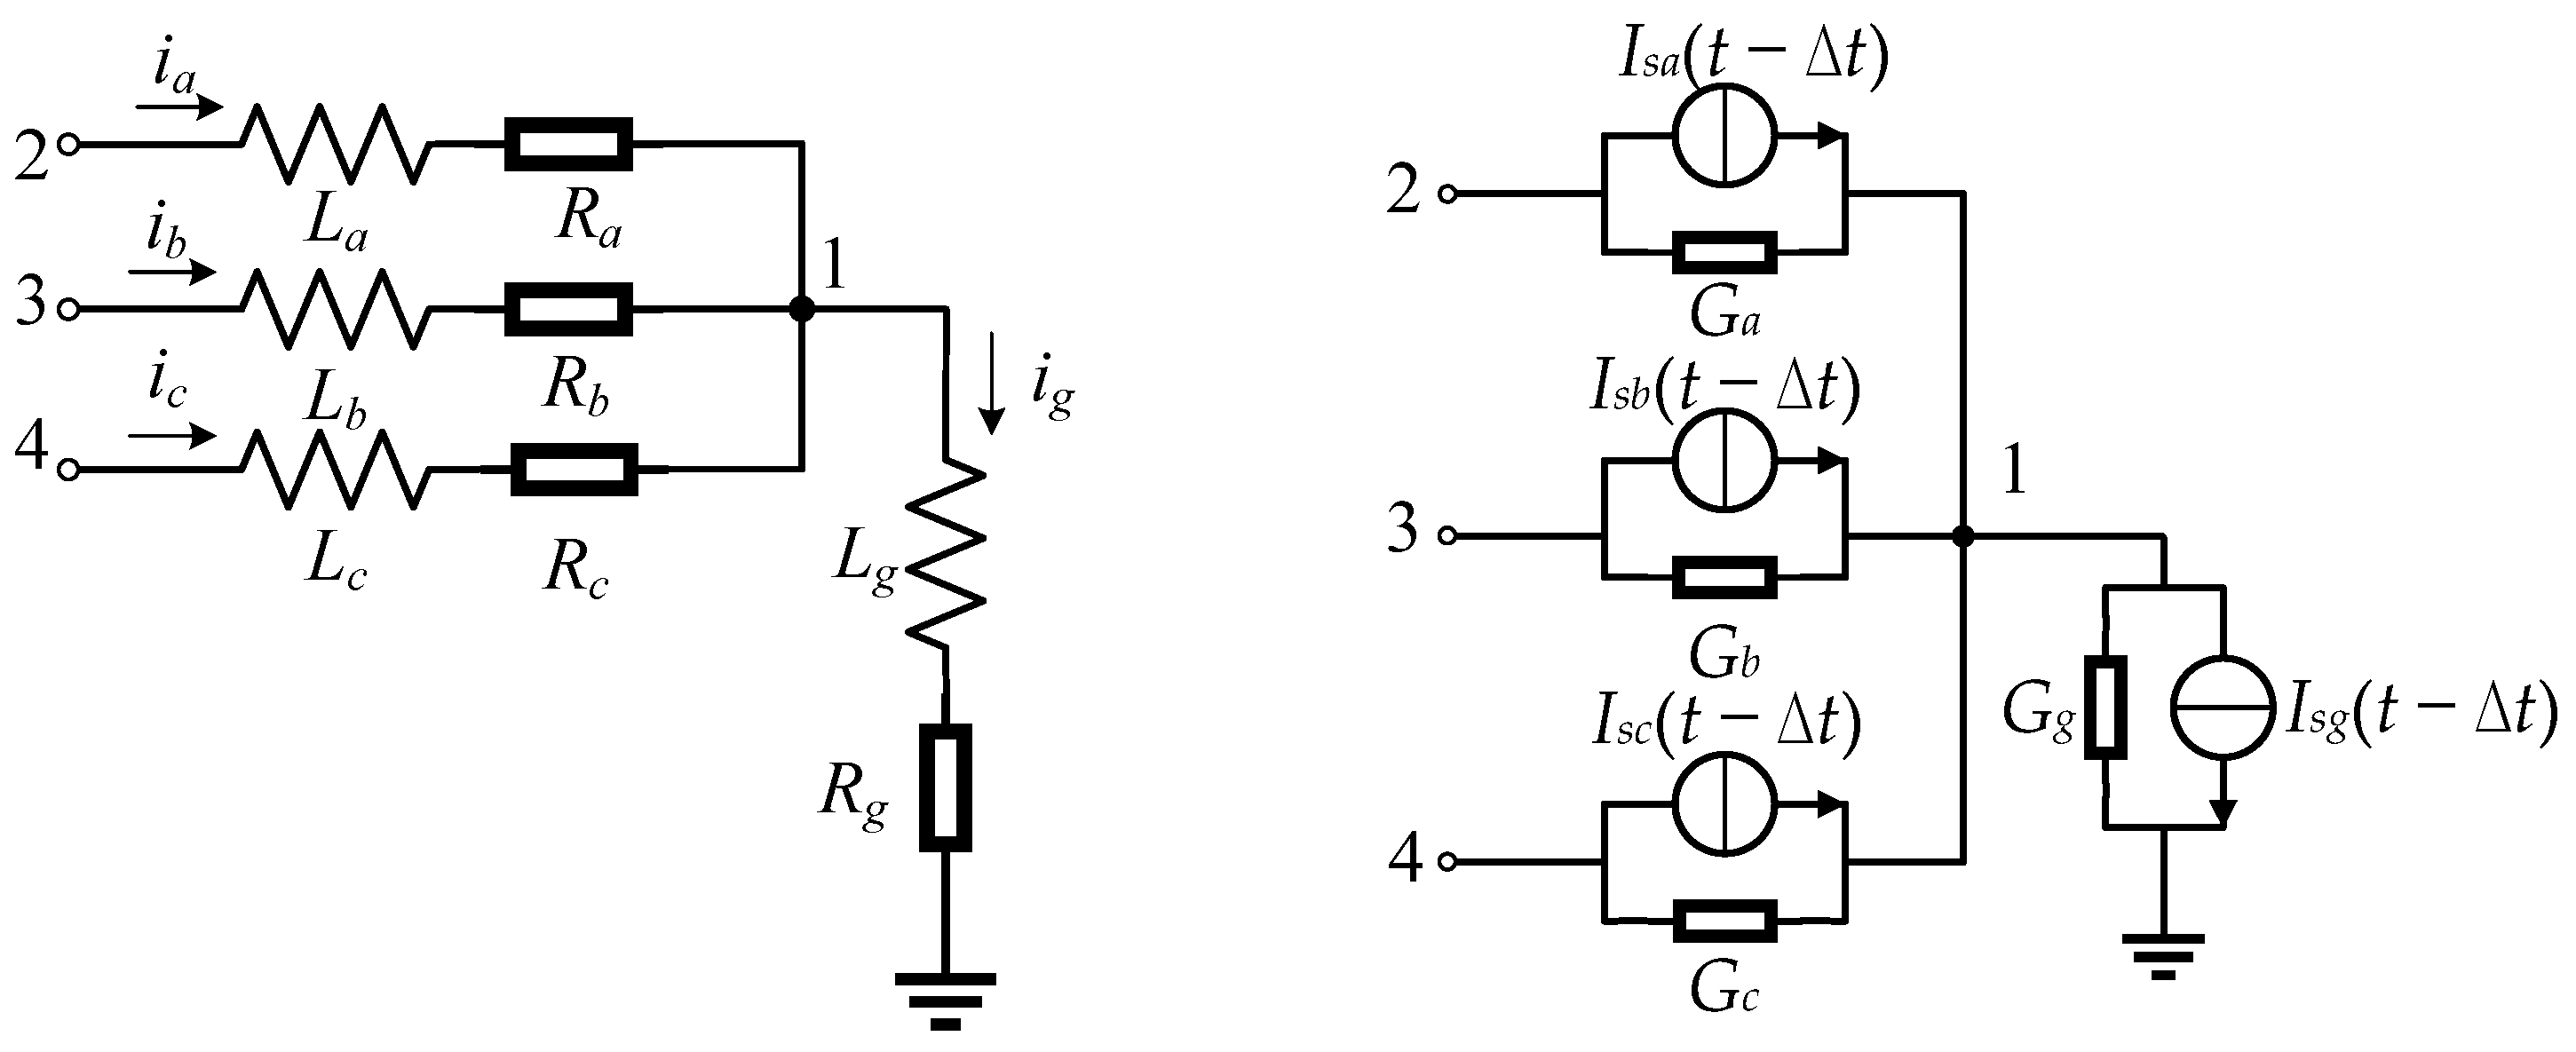
The Y-shaped three-phase load in Figure 4 is a common power element, with each phase load being a resistive and inductive branch, and the neutral point is grounded through a resistive and inductive branch. Table 1 lists the parameters of the three-phase resistive and inductive load that users can set through the user interface. Among them, the rated voltage, active power, reactive power, grounding resistance, and grounding inductance are the electrical parameters of the load, and the associated nodes indicate the connection relationship of the load.
The conversion relationship between the resistance, inductance, and other parameters of each phase load and the user parameters is
R a = R b = R c = U B 2 P P 2 + Q 2 L a = L b = L c = U B 2 Q 2 π f ( P 2 + Q 2 ) .
The circuit equation of phase A load is
u 2 ( t ) u 1 ( t ) = L a d i a ( t ) d t + R a i a ( t ) .
In the formula, u1 and u2 represent the voltages of node 1 and node 2, respectively. The simulation step size is ∆t, and the backward Euler method is used to differentiate Formula (2), which is
i a ( t ) = G a ( u 2 ( t ) u 1 ( t ) ) + I s a ( t Δ t ) .
Equation (3) is the characteristic equation of phase A load, where G a = Δ t L a + R a Δ t and
I s a ( t Δ t ) = L a L a + R a Δ t i a ( t Δ t ) ,
where Isa(t − ∆t) is the historical current source, whose value is related to the A-phase load current in the previous simulation time step. The same process is applied to the B-phase, C-phase, and ground branches to obtain the characteristic equations of the B-phase, C-phase, and ground branches. Then, the three-phase resistive and inductive load circuit in Figure 4 can be transformed into a Norton equivalent circuit. According to Kirchhoff’s current law (KCL), the node voltage equations of the three-phase inductive load can be obtained as follows:
G 11 G 12 G 13 G 14 G 21 G 22 0 0 G 31 0 G 33 0 G 41 0 0 G 44 u 1 ( t ) u 2 ( t ) u 3 ( t ) u 4 ( t ) = J 1 ( t Δ t ) J 2 ( t Δ t ) J 3 ( t Δ t ) J 4 ( t Δ t )
where G 12 = G 21 = G a , G 13 = G 31 = G b , G 14 = G 41 = G c , G 11 = G a + G b + G c + G g , G 22 = G a , G 33 = G b , G 44 = G c . J 1 ( t Δ t ) = I s a ( t Δ t ) + I s b ( t Δ t ) + I s c ( t Δ t ) I s g ( t Δ t ) , J 2 ( t Δ t ) = I s a ( t Δ t ) , J 3 ( t Δ t ) = I s b ( t Δ t ) , and J 4 ( t Δ t ) = I s c ( t Δ t ) .
Node 1 of the three-phase resistive and inductive load is an internal node, which can be eliminated in advance so that it is not included in the external interface of the electrical component. Using the Gaussian elimination method to eliminate Node 1, the following formula can be obtained:
G 11 G 12 G 13 G 14 0 G 22 G 23 G 24 0 G 32 G 33 G 34 0 G 42 G 43 G 44 u 1 ( t ) u 2 ( t ) u 3 ( t ) u 4 ( t ) = J 1 ( t Δ t ) J 2 ( t Δ t ) J 3 ( t Δ t ) J 4 ( t Δ t )
where G 23 = G 32 = G 13 G 21 G 11 , G 24 = G 42 = G 14 G 21 G 11 , G 34 = G 43 = G 14 G 31 G 11 , G 22 = G 22 G 12 G 21 G 11 , G 33 = G 33 G 13 G 31 G 11 , G 44 = G 44 G 14 G 41 G 11 , J 2 ( t Δ t ) = J 2 ( t Δ t ) J 1 ( t Δ t ) G 21 G 11 , J 3 ( t Δ t ) = J 3 ( t Δ t ) J 1 ( t Δ t ) G 31 G 11 , and J 4 ( t Δ t ) = J 4 ( t Δ t ) J 1 ( t Δ t ) G 41 G 11 .
A comparison of Equations (4) and (5) reveals that the mutual admittance between nodes 2, 3, and 4 changes from a zero value to a non-zero value after node 1 is eliminated. Here, the self-admittance and injected current values at these three nodes also changed. The topological relationship between the nodes in the model before and after eliminating node 1 is shown in Figure 5, where nodes 2, 3, and 4 are connected directly after elimination but were not connected previously.
As shown in Figure 5, the external equivalent circuit obtained after node 1 is eliminated and is the external interface of the electrical component generated by the three-phase load, which can be connected with other electrical components. After solving the network equations of the entire system, the voltages u2(t), u3(t), and u4(t) of external nodes 2, 3, and 4 can be obtained. Substituting these values back into Equation (5) yields the voltage of internal node 1 at this time step:
u 1 ( t ) = J 1 ( t Δ t ) G 14 u 4 ( t ) G 13 u 3 ( t ) G 12 u 2 ( t ) G 11 .
Then, the currents ia, ib, and ic of each phase load in this step can be obtained, based on which the historical current sources Isa, Isb, and Isc, required for the next simulation step, can be calculated.
The above is the calculation process that needs to be considered when modeling the Y-type three-phase load using the component-oriented modeling method. The calculation formulas involved in the process of user parameter conversion, external equivalence, internal solving, etc., for the electrical components are encapsulated as inherent properties and methods of the components. Users only need to set parameters based on the user interface provided by the components, without the need for simulation program coding.
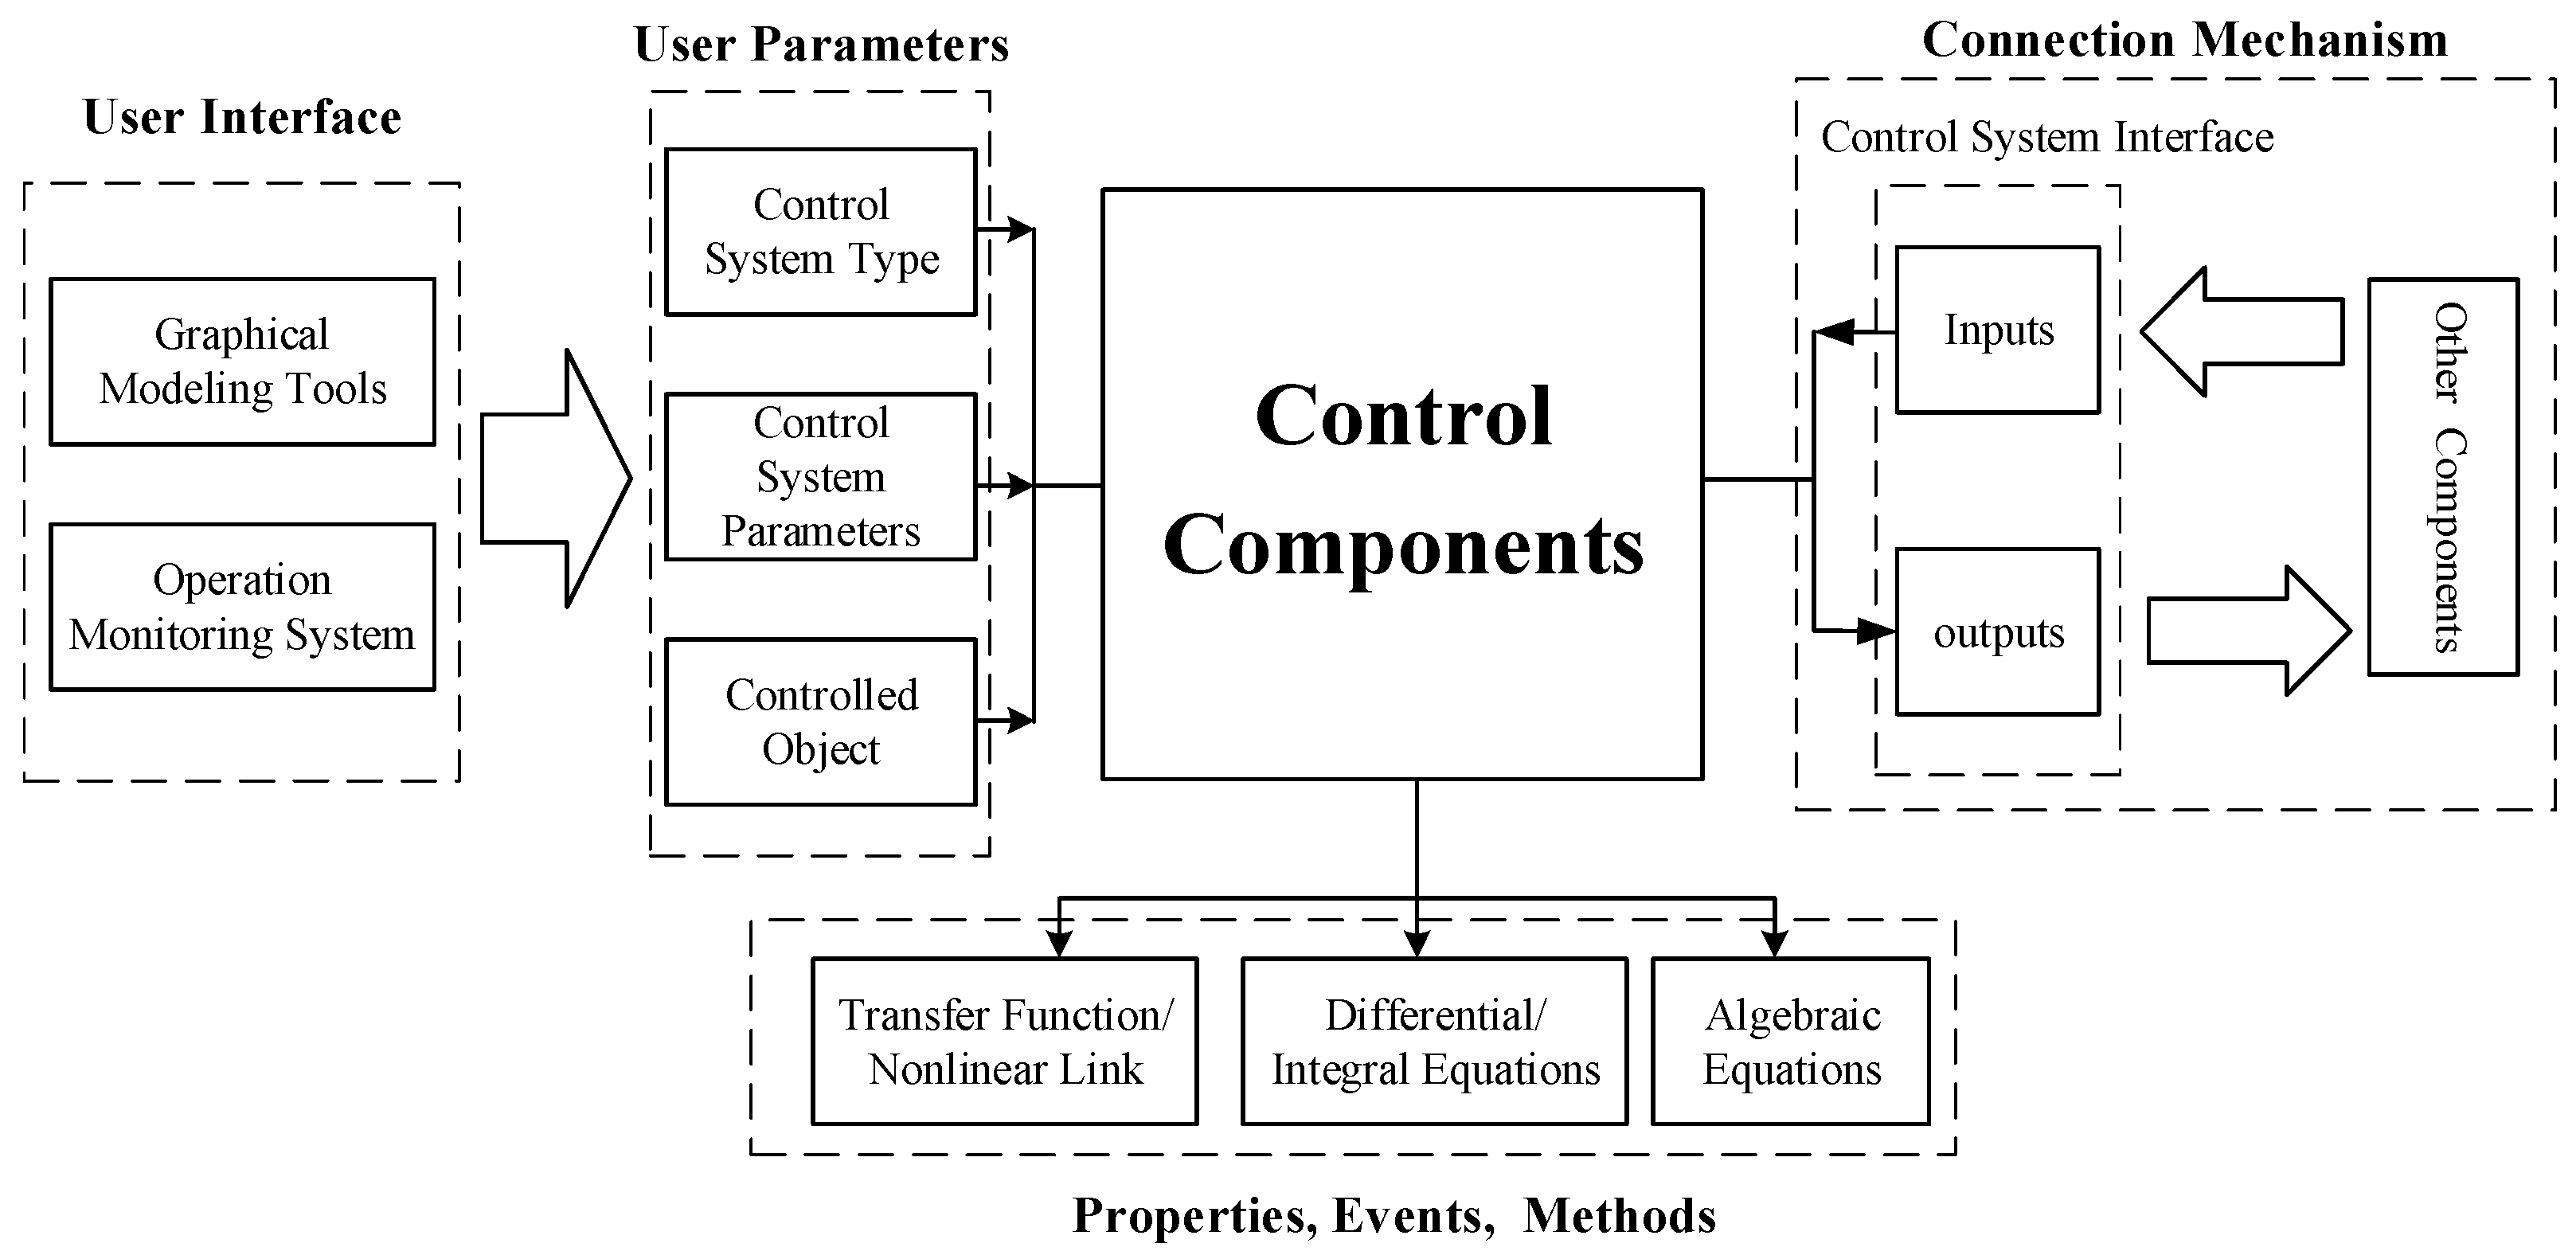
Using the component-oriented modeling approach, each unit in the control subsystem is encapsulated as a control component, as shown in Figure 6. The input–output relationship of the control subsystem is usually described by transfer functions. During simulation, the transfer function needs to be converted to a time-domain equation, and the differential and integral equations need to be discretized into algebraic equations. Therefore, the properties, events, and methods of the control component mainly include the transfer function of the control subsystem, the time-domain equation containing differential and integral equations, and the final algebraic equation. The user interface of the control component is similar to that of the electrical component, which allows users to modify the parameters through a graphical modeling tool and a runtime monitoring system. The control component is connected to other components based on the data flow between the input and output, thereby achieving the goal of control.
The component modeling method of the interface subsystem is similar to that of the control subsystem. According to the flow direction of the data, the interface components can be divided into two categories. One category is used to measure electrical quantities, such as the voltage and current calculated by the electrical system, and to pass them to the control system as input. These interface components are called measurement components. The other category processes the control signals’ output by the control system into corresponding drive signals before outputting them to the electrical system, which can be called drive components. For example, the mechanical system of the generator can convert the control signal of the generator-speed-regulating system into the speed required for the simulation of the synchronous generator. This type of interface component is called the driver component. Interface components are connected to both electrical components and control components.

4. Combination and Reconstruction of Electrical Components

4.1. Composite Electrical Component

Components have strong reusability. By connecting several components through interfaces and redefining their operations and interfaces, composite components can be formed [22]. The operation events of composite components are usually defined as a collection of operation events of each sub-component combined according to certain rules. Users cannot directly operate on the sub-components that make up the composite component and must indirectly operate them through the unique operations of the composite components. There is a certain corresponding relationship between the interface of the composite component and the interface of the sub-component, and this relationship is determined by the developer of the composite component. The interface rules can be redefined to give the composite component a new independent hierarchy from the sub-components, or the interface rules of the sub-components can be retained so that the composite component can be connected at the sub-component level. After encapsulating the composite component, its external characteristics become equivalent to a brand-new component. Thus, the components can continue to be combined on the basis of this composite component to form a higher-level composite component.
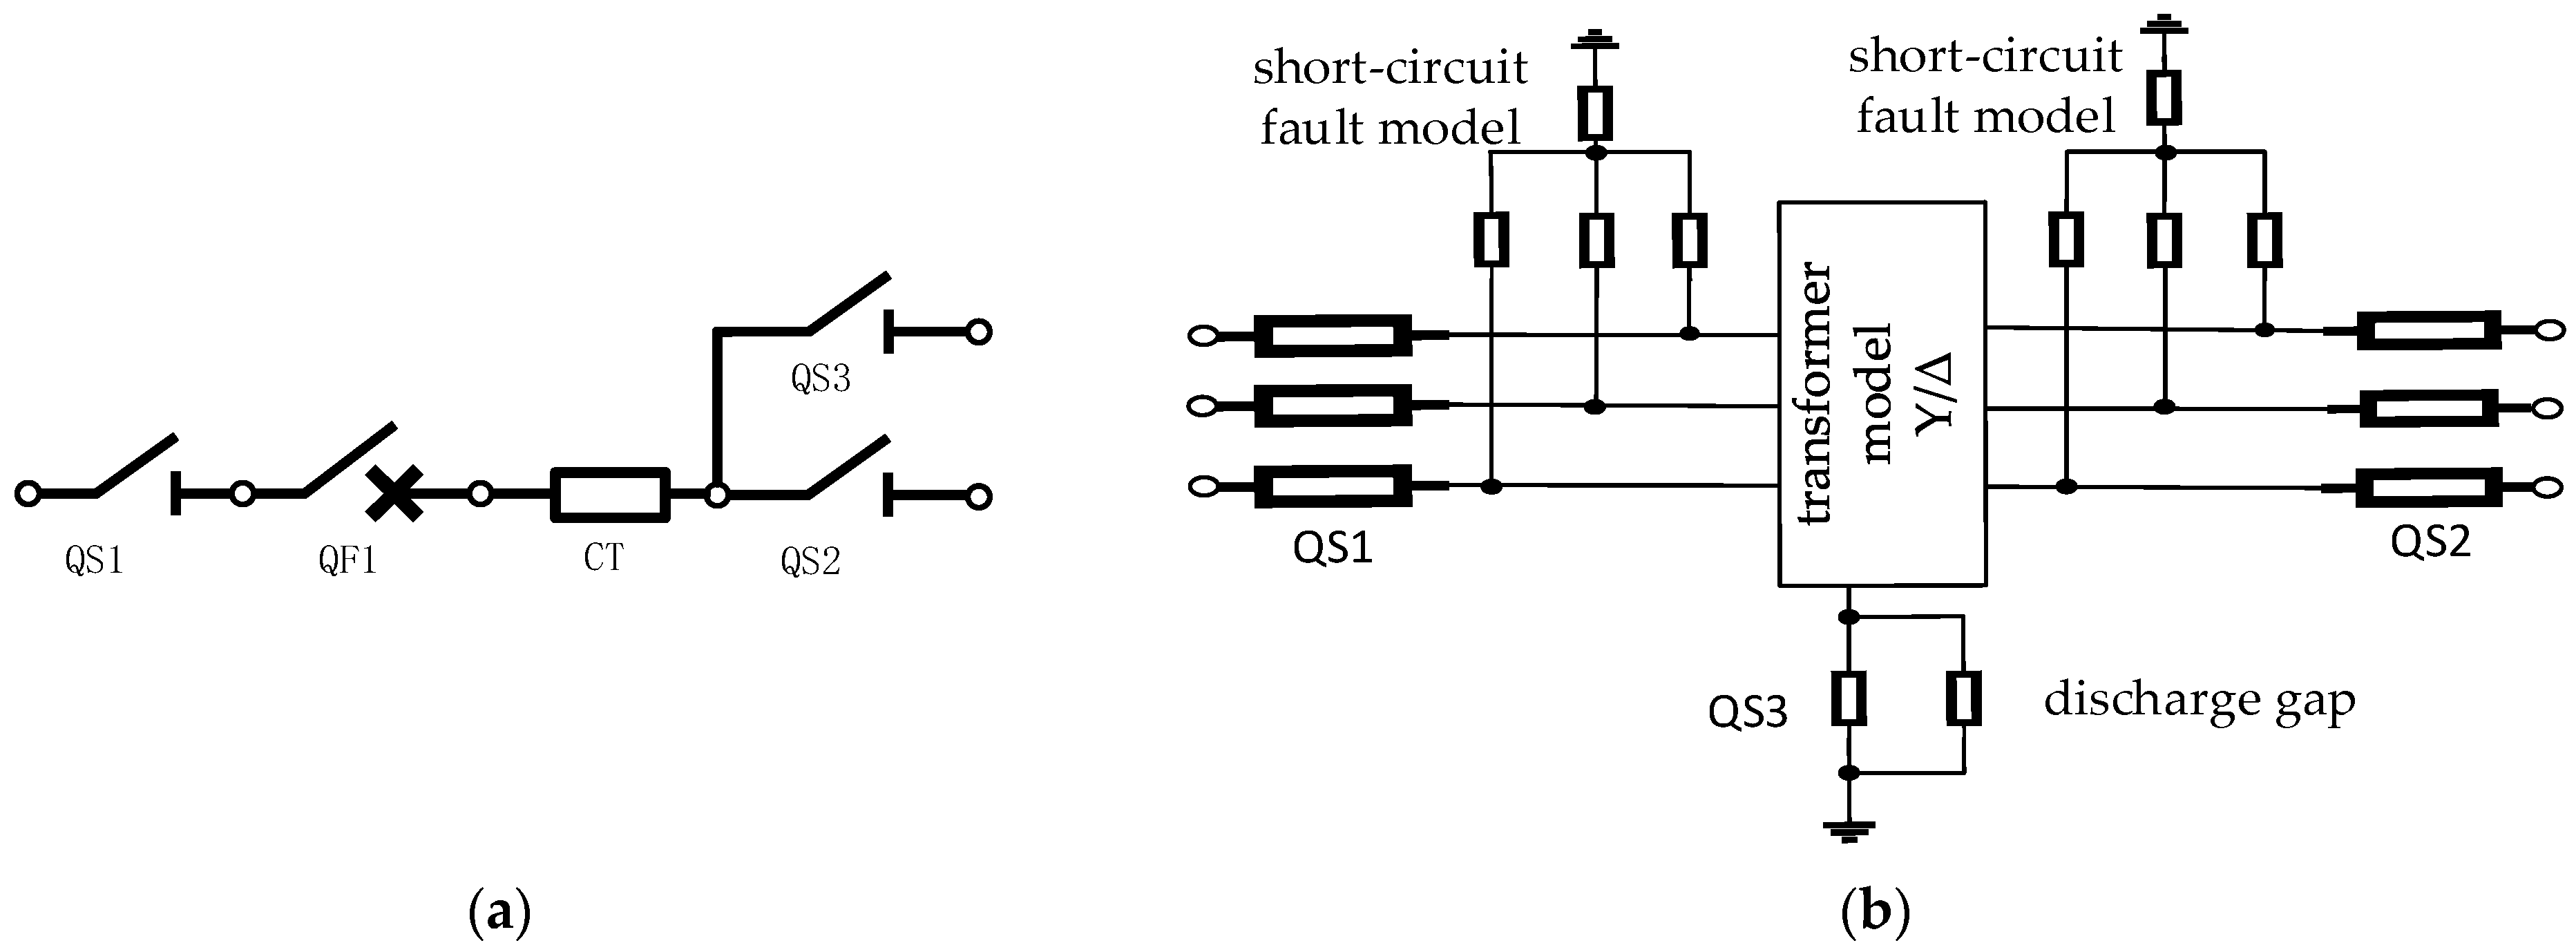
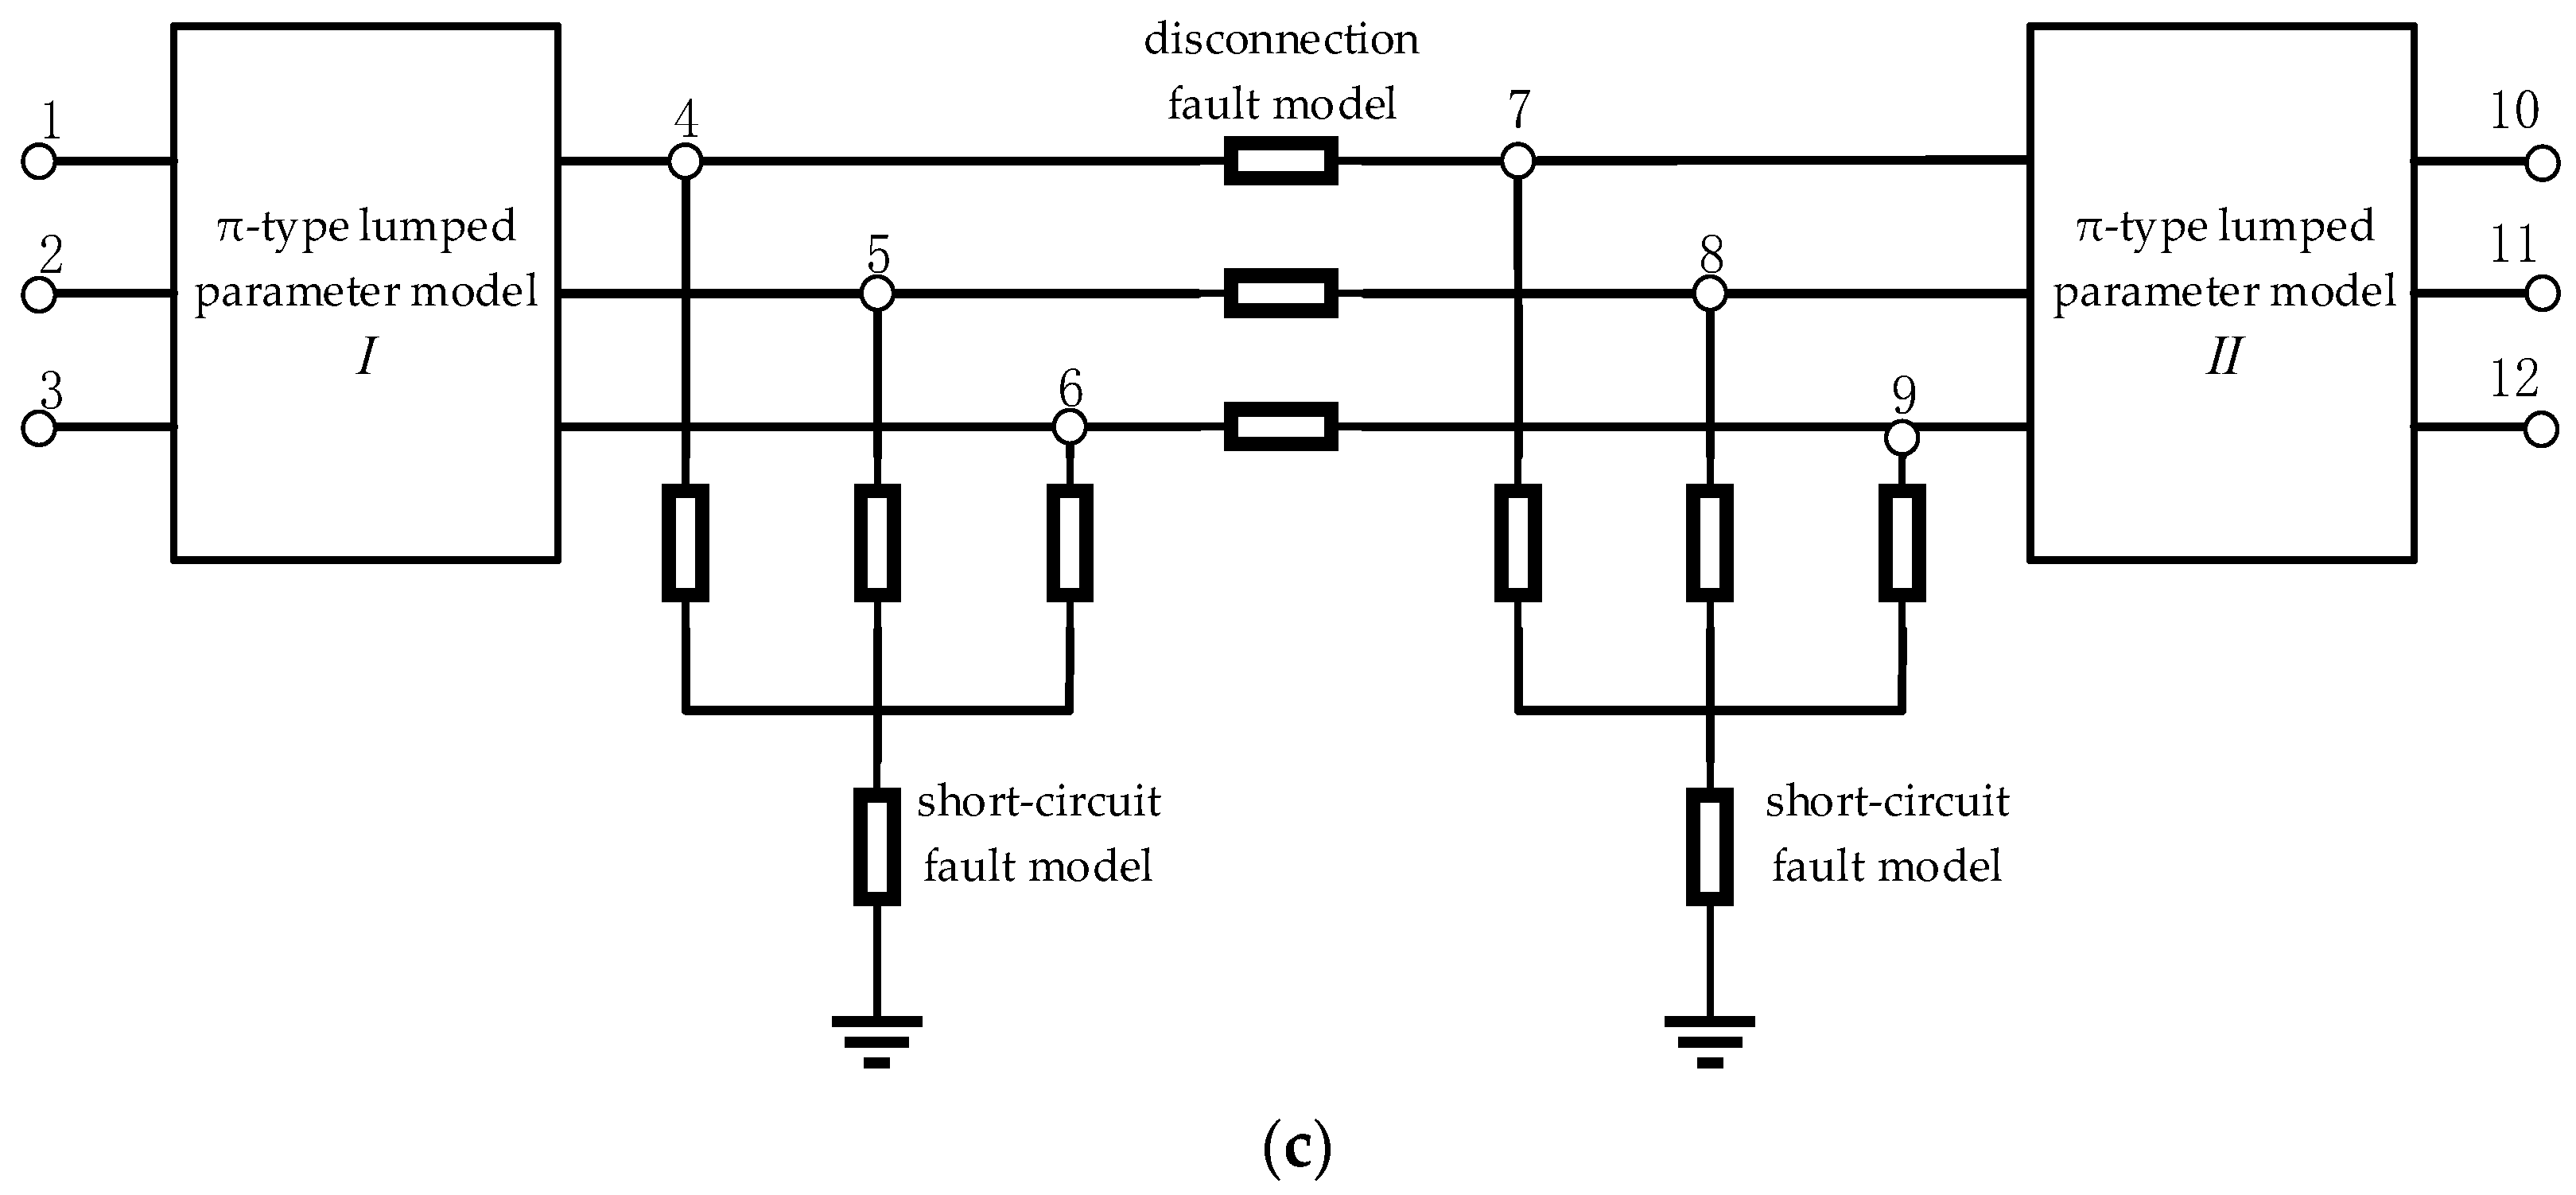
In power systems, there are many composite units composed of several basic elements in a fixed form, such as inlet/outlet interval units composed of isolation switches, circuit breakers, and current transformers; fault-settable line units composed of lines, short-circuit faults, and disconnection faults; and transformer units composed of transformers, grounding switches, and discharge gaps, as shown in Figure 7. Various combination units can form a single substation, power plant, and other smaller-scale power networks, and multiple small-scale networks can be further combined into a large-scale power system. Therefore, the composite units that are common in the power system can be modeled by combining the basic electrical components to form a composite electrical component. The events and connection mechanisms of a composite electrical component are completely identical to those of a basic electrical component, enabling a composite component to participate in electrical system operations normally. For developers, there is no need to master the specific structures and principles inside the composite electrical components; there is only a need to consider the external characteristics of the composite electrical component. The key to combining electrical components is obtaining the external characteristics of the composite component and the solving method of the internal electrical quantities.
The characteristic equation of a composite component formed by combining m sub-components can be expressed as:
( i = 1 m A r i G i A c i ) u = i = 1 m A r i J s i
where Gi represents the node admittance matrix of sub-component I; u represents the node voltage column vector of the composite component; Jsi represents the injection current column vector of sub-component i; and Ari and Aci represent, respectively, the row and column transformation matrices used to map the nodes of sub-component i to the nodes of the composite component. If node j of sub-component i corresponds to node k in the composite component, then
A r i ( a , b ) = 1 ,    a = k , b = j 0 ,    else A c i ( a , b ) = 1 ,    a = j , b = k 0 ,    else .
After grouping the internal nodes and external nodes of the composite component, Formula (7) can be rewritten into the form of the node voltage equation:
G u i ( t ) u o ( t ) = J i ( t ) J o ( t )
where G represents the equivalent node admittance matrix of the composite component, ui(t) and Ji(t), respectively, represent the node voltage column vector and injected current column vector of the internal nodes of the composite component, and uo(t) and Jo(t), respectively, represent the column vector of the node voltage and the column vector of the injection current of the external node of the combined member. After performing several row transformations on (9), all internal nodes are eliminated, and the transformed admittance matrix is written in the form of a block matrix, as follows:
G i G i o 0 G o u i ( t ) u o ( t ) = J i ( t ) J o ( t )
where Go is the admittance matrix of the external equivalent node of the combined component, and Jo′(t) is the column vector of the injection current of the external equivalent node of the combined component. The external characteristics of the combined component can be expressed as
G o u o ( t ) = J o ( t ) .
After solving the entire system and obtaining the external node voltage uo(t) of the composite component, the internal node voltage of the composite component can be obtained by substituting it back into Equation (10):
u i ( t ) = G i 1 ( J i ( t Δ t ) G i o u o ( t ) ) .
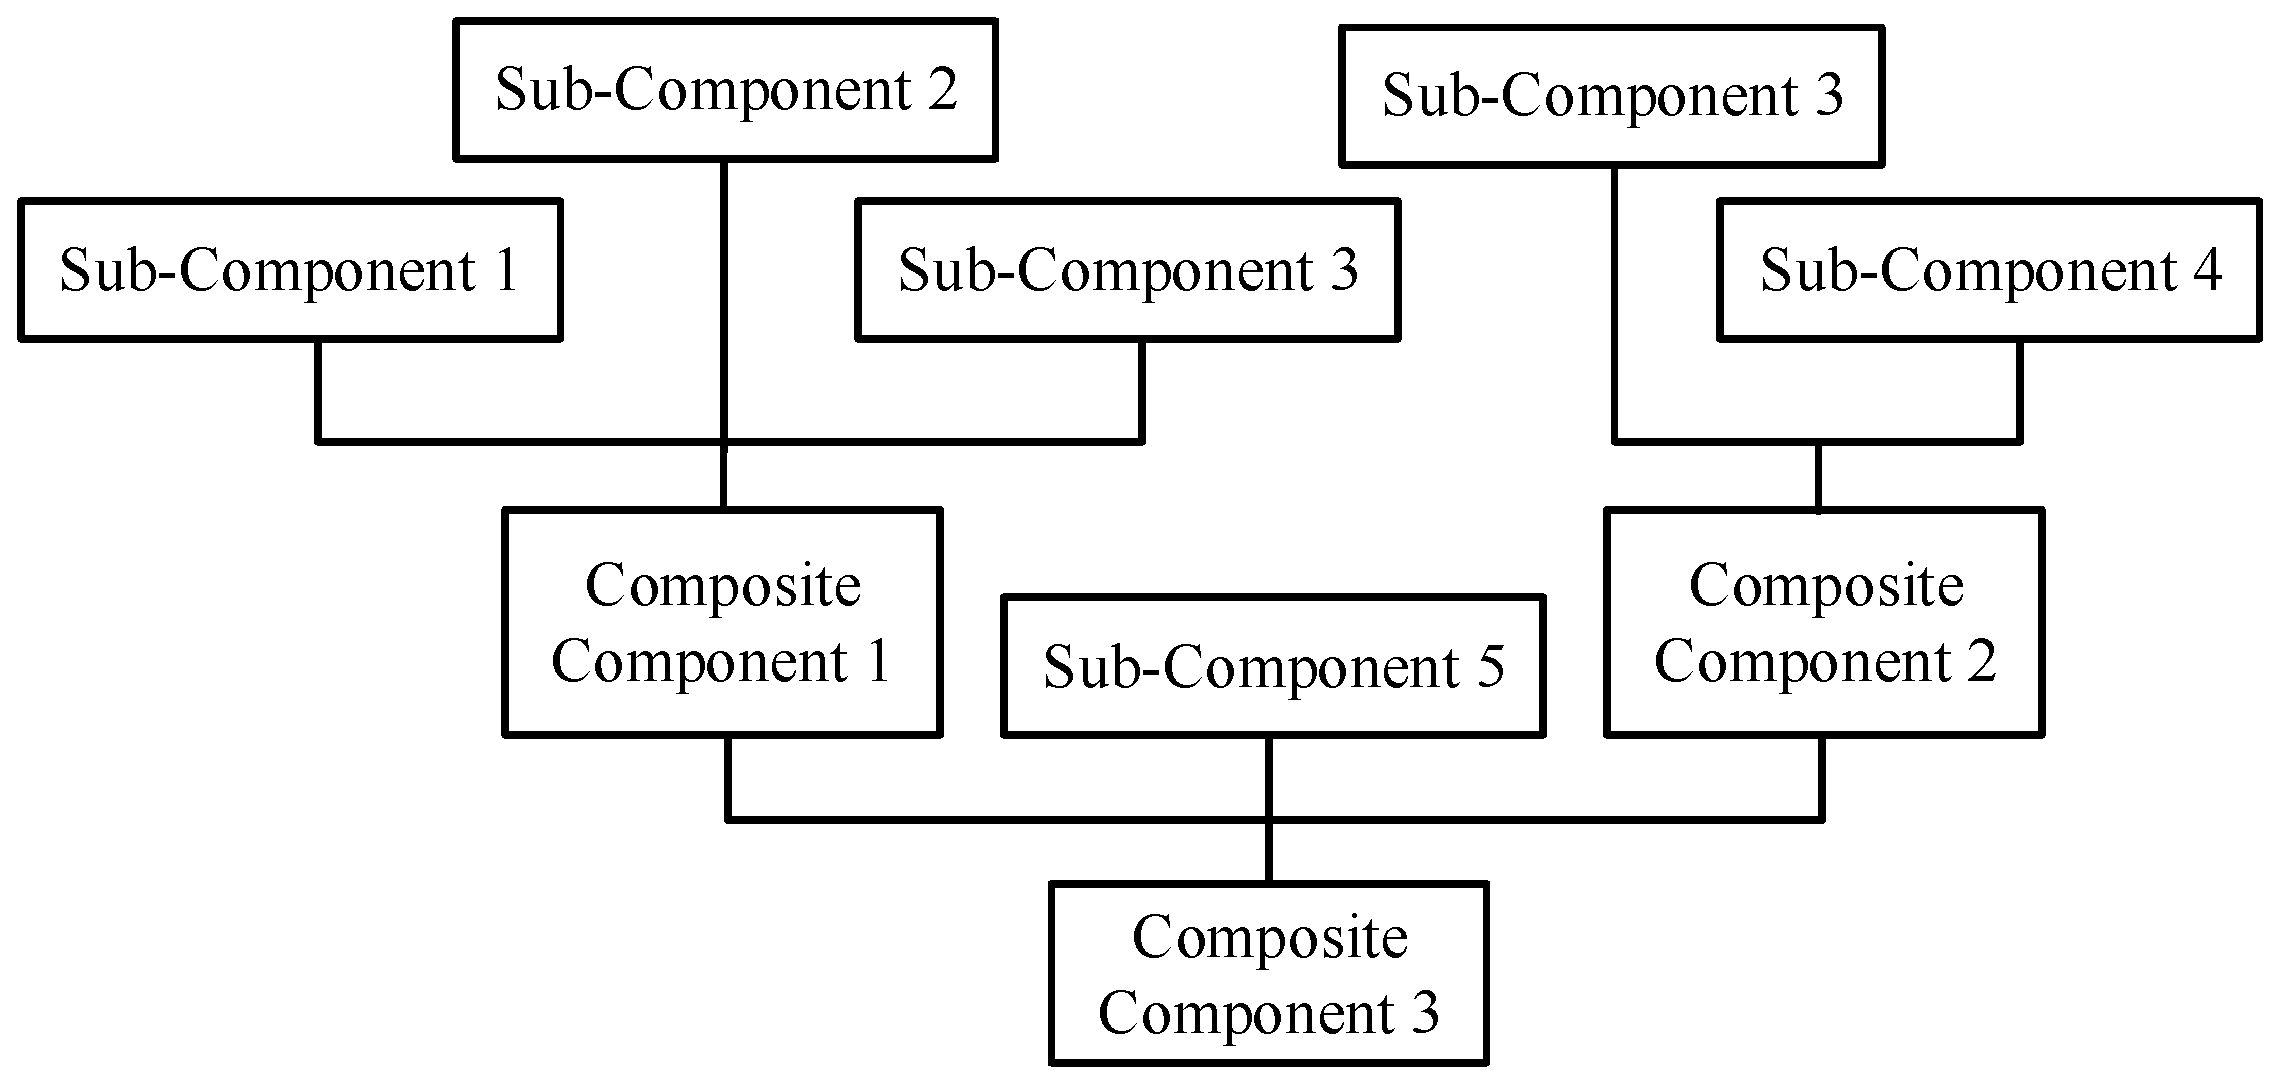
The external interface form of the composite electrical component is the same as that of the basic electrical component and can continue to be combined with other components, including basic components and other composite components, to form a multi-level composite component structure as shown in Figure 8. After the multi-level combination, the entire simulation system may only be composed of several higher-level composite components, and each composite component may be composed of several lower-level composite components. This makes the simulation object present a hierarchical structure similar to a “tree”, where the leaf nodes of the “tree” form the basic electrical components converted from a single power element.

4.2. Reconstruction of Electrical Components

Reconstruction is also a concept originating from software design, which refers to improving the internal structure of a software system without changing its external behavior, so that the system always has strong adaptability to changes in requirements [23]. As a concept that also originates from software engineering, the subsequent modification process of components can also be accomplished through reconstruction, i.e., by modifying the internal attributes, events, and methods of a component without changing its external interface, in order to achieve updates and improvements to the component.
In the process of power system simulation modeling, due to different needs, different simulation models may be used for the same type of electrical element, such as models of different orders for synchronous generators. There are differences in the internal solving processes between different simulation models of the same type of electrical element, but the external characteristics are all Norton-equivalent circuits with the same structure. Therefore, based on the basic electrical components, the original attributes, events, and methods can be replaced with a more complex and comprehensive set of attributes, events, and methods, and additional parameters required for new models can be added to the user parameters. A schematic diagram of the electrical component reconstruction is given in Figure 9. During the reconstruction process, the external interface of the original electrical components is not modified, i.e., the structure of the Norton circuit is not changed. The reconstructed electrical component is called an advanced electrical component. Compared with the basic electrical component, the characteristics of this advanced component mainly include the following:
Users can set more detailed parameters.
It can describe the characteristics of the electrical components in more detail and complete more complex simulation functions.
The external interface is similar to that of the basic electrical components and can be replaced with the basic electrical components in the simulation modeling process.
The equations describing the physical characteristics of electrical components are more complex, leading to more complicated calculation processes for equivalent external and internal solutions.
Developers can use reconstruction to further develop the basic electrical components to create more accurate or complex simulation models. In the actual modeling process, users can use different models for modeling according to the simulation needs of the actual system: For objects that are of primary concern in the simulation process, complex models can be used to achieve the best simulation results; for objects that are not of primary concern in the simulation process, basic models can be used to reduce simulation time.

5. Optimization Method for a Simulation Script Based on the Component Modeling Method

5.1. Subscripts Based on the Component Modeling Method

After the simulation objects are componentized, the FRTDS simulation script can be generated using subscripts. According to the data files provided by the user, the elements are converted into components. A component contains information such as the variable declarations of the corresponding elements, the solving formula, and the interface method, which are called subscripts. The composite components have a tree-based multi-level structure. Thus, the corresponding subscripts also have multiple levels. The subscripts corresponding to the basic components can be combined into high-level subscripts, according to certain specifications, and the high-level subscripts can also be combined at a higher level to form a complete simulation script. Using the component modeling method to generate simulation scripts no longer provides an overall description of the simulation process of the entire system but instead offers a combination of attributes, events, and methods of sub-components at all levels in the system. In this way, users can take advantage of the replaceability of subscripts to develop and research more flexibly. For example, during the simulation process, one can replace the subscripts of the corresponding components in the simulation script with real devices to conduct hardware-in-the-loop experiments.
When using FRTDS for real-time simulations, if the storage location of the variables is not reasonable, the microprocessor may not be able to directly obtain the data required for the current computational task from the data area. In this case, data transfer between data areas is required, which takes some time and is not conducive to completing the computational task within the specified step time of real-time simulations. The simulation calculation formula generated by the component modeling method can be roughly divided into three parts: (1) the external equivalent of the component, (2) the solution of the network equation, and (3) the internal calculation of the component. The data in 1 and 3 are highly private, meaning that a series of data belonging to a certain component only participates in the external equivalent and internal solution calculation processes of this particular component and does not participate in the calculation processes of other components. Therefore, the variables that belong to the same component should be declared centrally, and the affiliation relationship should be identified. Taking the variable declaration of the sub-component as the basic unit, and for the variable declaration of the sub-components that belong to the same composite component, centralized declaration continues, and the structure of the variable declaration section also presents a hierarchical structure. In this way, the compiler can more reasonably arrange the storage location of data when scheduling tasks, making it easier for computational tasks to directly obtain corresponding input data in the data area and reduce the number of data transfers caused by unreasonable data storage during the simulation process.

5.2. Influence of Component Modeling on Node Elimination Strategy

In the process of solving network equations using the Gaussian elimination method, filler elements will be introduced into the node admittance matrix, and the introduction of filler elements will increase the number of calculations needed for solving network equations. Therefore, choosing an appropriate node elimination strategy is conducive to ensuring that the real-time simulation completes the computational task within the specified step time. The most commonly used node elimination strategy is the semi-dynamic node sorting method, also known as the minimum degree method [24]. The minimum degree method recalculates the degree of all nodes after each node is eliminated and then reorders according to the size of the degree. This method first eliminates the node with a small degree and then eliminates the node with a large degree. This method makes full use of the sparsity of the node-admittance matrix so that the calculation amount of the network equation solution process can be as small as possible, making this method suitable for a serial computing hardware, such as a CPU. However, the parallelism of this algorithm is low. When computing tasks are performed on a hardware with high parallelism, such as FRTDS, the algorithm with the smallest number of calculations does not necessarily have the shortest execution time.
In [25], the node elimination strategy for the minimum degree–maximum independent set is proposed, and all nodes that can be eliminated at the same time are found. Thus, the largest independent set of nodes is eliminated so as to improve the parallelism of operations. First, one selects the node with the smallest degree as the initial node to be eliminated, marks the nodes adjacent to it as visited, and then selects the node with the smallest degree from among the unvisited nodes as the next node to be eliminated, until all remaining nodes are visited. These eliminated nodes form a maximally independent set of nodes. Among the remaining nodes, the same method can be used to find the next largest independent set of nodes until all nodes are arranged. The minimum degree–maximum independent set method eliminates as many nodes as possible simultaneously, but this process often increases the computational complexity of elimination. Moreover, if the ideal parallelism of the algorithm exceeds the parallelism capability of FTRDS, a highly parallel algorithm cannot reduce the solution time.
When using the component-oriented modeling method to generate simulation scripts, the external equivalence processes of different components are relatively independent. Additionally, in this method, these parts of the equations will have already implemented component-level parallelism. Continuing to use a high-parallelism algorithm for node elimination calculations within each component may cause the parallelism degree of these computation formulas to exceed the parallelism capacity limit of FRTDS, and some computation tasks may have to be delayed, resulting in an increase in total computation time and the “flooding” phenomenon shown in Figure 10. The shaded area represents computation tasks that exceed the parallelism capacity limit of FRTDS. At this time, increasing the parallelism degree of the computation formulas is not an effective method to reduce simulation computation time. However, reducing the total computation volume of the formulas is effective. During the overall network equation solving stage, under the composite component method, there are only a few external nodes used to connect the components in the network, so the computation volume of node elimination operations is not too large. If the selected node elimination strategy has insufficient parallelism, FRTDS’s parallelism capacity cannot be fully utilized, resulting in the “drain” phenomenon shown in Figure 10. Here, the shaded area represents FRTDS computation resources wasted. At this stage, increasing the parallelism degree of the computation formulas is the only way to reduce execution time. Therefore, the node elimination strategy used in the simulation script generated by the component-based modeling approach is as follows. For the external equivalent process of the component, the minimum-degree method with the smallest computation cost is used to perform internal-node elimination. Although the internal-node elimination process of a single component is serial, the simultaneous operation of multiple components to eliminate internal nodes itself has a relatively high degree of parallelism. For the global network equation solving stage, the minimum degree–maximum independent set method is used for elimination, which can maximize parallelism with only a slight increase in computational cost, thus reducing simulation calculation time.

6. Case Study

In this article, FRTDS was constructed in Xilinx Virtex-7 FPGA VC709. The FPGA chip of this development board is XC7VX690T-2FFG1761, which contains 693,120 logic cells, 108,300 configurable logic blocks, 3600 DSP slices, and 1470 36 KB dual-port BRAMs. FRTDS has three microprocessors for executing calculations, each of which has four data areas for storing simulation variables, and the operating frequency is 125 MHz. The software for FRTDS was developed using QT C++.
The simulation system adopts the generator–transformer group substation shown in Figure 11, which contains 182 simulation nodes and three voltage levels. The terminal voltage of the generator is 20 kV. The 20 kV bus is connected to the 220 kV bus through the main transformer and supplies power to the 6 kV factory load through the high-voltage factory transformer. The 6 kV bus can also be connected to the 220 kV bus through the standby transformer. The 220 kV busbar adopts a double busbar scheme and supplies power to the grid through two lines. The entire simulation system is composed of various components, and some combination units are modeled as combination components, including the following:
(1)
The power source composite component, represented by components A1 and F1 in the figure, including an infinite bulk electric power source, CT, PT, transmission lines, and other components;
(2)
The interval unit composite component, represented by components A2, B1, E1, and F2 in the figure, including circuit breakers, isolation switches, CT, and grounding switches;
(3)
The bus coupler composite component, represented by component D in the figure, including circuit breakers, isolation switches, CT, and grounding switches, etc.;
(4)
The transformer composite component, represented by components B2 and E2 in the figure, including transformers, discharge gaps, and grounding switches;
(5)
The generator composite component, represented by component C in the figure, including multi-winding synchronous generators, PT, CT, circuit breakers, etc.
Then, further combination is performed using the composite components closely related in topology, forming the high-level composite components A, B, E, and F, which are composed of low-level composite components and basic components. These components are referred to as branch composite components.
In order to verify the optimization effect of the variable declaration body and node elimination strategy derived from the component modeling in Part 6 on the optimization of the simulation script, three different schemes were used to generate the simulation script with a simulation step size of 50 μs:
(1)
Scheme 1: Regardless of the relative independence of the calculation process between components and the privacy of the component data, all variables of the simulation system are centrally declared and evenly distributed to four micro-processing cores and then evenly distributed into the four data areas. The node elimination strategy uses only the minimum degree–maximum independent set method.
(2)
Scheme 2: Considering the relative independence of the calculation process between components and the privacy of component data, the variables of the simulation system are declared using the component-oriented modeling method. The variables of branches A and D are assigned to microprocessor core 1, the variables of branches B and G are assigned to microprocessor core 2, the variables of branches E and F are assigned to microprocessor core 3, and the variables of branch C are assigned to microprocessor core 4. Inside each microprocessor core, variables belonging to the same component are arranged in the same data area as much as possible. This node elimination strategy uses only the minimum degree–maximum independent set method.
(3)
Scheme 3: This variable arrangement scheme is the same as scheme 2. For the external equivalent process of each component, the minimum degree method is used for node elimination; for the external network equation solution process, the minimum degree–maximum independent set method is used for node elimination.
In fact, scheme 1 is the modeling method used in previous script-generation processes. Scheme 3 is based on all the optimization modeling methods proposed in this paper. In addition, some of the optimization modeling methods proposed in this paper are used in scheme 2. The computational load of the simulation can be counted based on the number of equations in the script. The FRTDS compiler is used to schedule the equations in the simulation script and generate the calculation instructions, recording the number of data transfer operations during the scheduling process. FRTDS executes one instruction per clock, and the number of instructions determines the actual time taken by FRTDS to complete all operations within one time step. The compilation results of the three solutions are shown in Table 2. The actual calculation time of Solution 1 exceeds 50 μs, which cannot achieve real-time simulations. Solution 2 and Solution 3 can achieve real-time simulations.
In order to verify the correctness of the component-oriented modeling method, the instructions generated after compiling the script of scheme 3 are run in FRTDS. At the same time, a simulation system with the same structure and parameters is built in PSCAD, and the offline operation results are compared with the real-time calculation results of FRTDS. After the system runs stably, a short-circuit fault between phases B and C is set on the 220 kV I bus at t = 4 s, and the fault is cleared after 0.2 s. Figure 12 shows the simulation results of the 220 kV I bus voltage, 20 kV bus voltage, and 6 kV bus voltage waveform and 2251-line voltage, where the 2251-line voltage is the electrical quantity inside the component. The partial, enlarged picture of the waveform comparison shows that the real-time simulated waveform in FRTDS and the offline simulated waveform in PSCAD have a high degree of coincidence, with a maximum error not exceeding 2%. The real-time simulation results of FRTDS also have high accuracy.
In addition, for a power system containing many power-electronic devices, the simulation must be able to simulate the fast electromagnetic transient process (time scale of a few microseconds) of power-electronic equipment such as converters and static synchronous compensators. It is also necessary to be able to simulate the switching process of the converter valve of the DC power system and the electromagnetic transient process of the AC power system (time scale of tens of microseconds to hundreds of microseconds). The implementation of a multi-rate simulation has been considered in the design of FRTDS’ hardware and compiler. In future research, how to improve the computational efficiency of FRTDS in multi-rate simulation should be further considered in component-oriented modeling methods.

7. Conclusions

(1)
When users employ FRTDS for real-time simulations, the component-oriented modeling method makes the simulation modeling process more convenient, especially when the simulation example is replaced, or secondary development of the element model is performed.
(2)
The concept of subscripts and the hierarchical structure of scripts generated after component modeling enable the compiler to fully consider the compatibility between tasks and data when arranging computing tasks, thereby reducing the occurrence of data transfer and helping to reduce the simulation calculation time.
(3)
The proposed node elimination strategy using a combination of the minimum degree method and the minimum degree–maximum independent set method for different stages of simulation can reduce the computational workload and match the degree of algorithm parallelism with the actual parallel computing capacity of hardware, further reducing the simulation calculation time.

Author Contributions

Conceptualization, Z.J.; methodology, B.Z. and Z.J.; software, J.Z.; validation, S.W. and Z.J.; formal analysis, B.Z.; investigation, B.Z. and Z.J.; resources, B.Z.; data curation, J.Z. and S.W.; writing—original draft preparation, S.W.; writing—review and editing, B.Z. and S.W.; visualization, J.Z.; supervision, B.Z.; project administration, B.Z.; funding acquisition, B.Z. All authors have read and agreed to the published version of the manuscript.

Funding

This research was funded by the National Natural Science Foundation of China (No. 51477114).

Data Availability Statement

Not applicable.

Acknowledgments

We are grateful for the experimental site provided by the Key Laboratory of the Ministry of Education for Smart Grid of Tianjin University.

Conflicts of Interest

The authors declare no conflict of interest.

Abbreviations

Abbreviations used in the article and their corresponding meanings:
FPGAField-Programmable Gate Array
FRTDSFPGA-based Real Time Digital Simulator
CPUCentral Processing Unit
GOOSEGeneric Object-Oriented Substation Event
SVSampled Value
CTCurrent Transformer
PTPotential Transformer

References

  1. Subedi, S.; Rauniyar, M.; Ishaq, S.; Hansen, T.M.; Tonkoski, R.; Shirazi, M.; Wies, R.; Cicilio, P. Review of Methods to Accelerate Electromagnetic Transient Simulation of Power Systems. IEEE Access 2021, 9, 89714–89731. [Google Scholar] [CrossRef]
  2. Zhou, Z.; Dinavahi, V. Fine-Grained Network Decomposition for Massively Parallel Electromagnetic Transient Simulation of Large Power Systems. IEEE Power Energy Technol. Syst. J. 2017, 4, 51–64. [Google Scholar] [CrossRef]
  3. Strasser, T.I.; Rohjans, S.; Burt, G.M. Methods and Concepts for Designing and Validating Smart Grid Systems. Energies 2019, 12, 1861. [Google Scholar] [CrossRef] [Green Version]
  4. Yadav, G.; Liao, Y.; Burfield, A.D. Hardware-in-the-Loop Testing for Protective Relays Using Real Time Digital Simulator (RTDS). Energies 2023, 16, 1039. [Google Scholar] [CrossRef]
  5. Han, J.; Hong, Q.; Feng, Z.; Syed, M.H.; Burt, G.M.; Booth, C.D. Design and Implementation of a Real-Time Hardware-in-the-Loop Platform for Prototyping and Testing Digital Twins of Distributed Energy Resources. Energies 2022, 15, 6629. [Google Scholar] [CrossRef]
  6. Estrada, L.; Vázquez, N.; Vaquero, J.; de Castro, Á.; Arau, J. Real-Time Hardware in the Loop Simulation Methodology for Power Converters Using LabVIEW FPGA. Energies 2020, 13, 373. [Google Scholar] [CrossRef] [Green Version]
  7. Matar, M.; Karimi, H.; Etemadi, A.; Iravani, R. A High Performance Real-Time Simulator for Controllers Hardware-in-the-Loop Testing. Energies 2012, 5, 1713–1733. [Google Scholar] [CrossRef]
  8. Song, J.; Hur, K.; Lee, J.; Lee, H.; Lee, J.; Jung, S.; Shin, J.; Kim, H. Hardware-in-the-Loop Simulation Using Real-Time Hybrid-Simulator for Dynamic Performance Test of Power Electronics Equipment in Large Power System. Energies 2020, 13, 3955. [Google Scholar] [CrossRef]
  9. Sidwall, K.; Forsyth, P. Advancements in Real-Time Simulation for the Validation of Grid Modernization Technologies. Energies 2020, 13, 4036. [Google Scholar] [CrossRef]
  10. Gabbar, H.A.; Elsayed, Y.; Isham, M.; Elshora, A.; Siddique, A.B.; Esteves, O.L.A. Demonstration of Resilient Microgrid with Real-Time Co-Simulation and Programmable Loads. Technologies 2022, 10, 83. [Google Scholar] [CrossRef]
  11. Gupta, K.; Sahoo, S.; Panigrahi, B.K.; Blaabjerg, F.; Popovski, P. On the Assessment of Cyber Risks and Attack Surfaces in a Real-Time Co-Simulation Cybersecurity Testbed for Inverter-Based Microgrids. Energies 2021, 14, 4941. [Google Scholar] [CrossRef]
  12. Abusalah, A.; Saad, O.; Mahseredjian, J.; Karaagac, U.; Gerin-Lajoie, L.; Kocar, I. CPU based parallel computation of electromagnetic transients for large power grids. Electr. Power Syst. Res. 2018, 160, 57–63. [Google Scholar] [CrossRef]
  13. Omar Faruque, M.D.; Strasser, T.; Lauss, G. Real-time simulation technologies for power systems design, testing, and analysis. IEEE Power Energy Technol. Syst. J. 2015, 2, 63–73. [Google Scholar] [CrossRef]
  14. Tavana, N.R.; Dinavahi, V. A General Framework for FPGA-Based Real-Time Emulation of Electrical Machines for HIL Applications. IEEE Trans. Ind. Electron. 2015, 62, 2041–2053. [Google Scholar] [CrossRef]
  15. Bai, H.; Luo, H.; Liu, C.; Paire, D.; Gao, F. A Device-Level Transient Modeling Approach for the FPGA-Based Real-Time Simulation of Power Converters. IEEE Trans. Power Electron. 2020, 35, 1282–1292. [Google Scholar] [CrossRef]
  16. Matar, M.; Iravani, R. Massively Parallel Implementation of AC Machine Models for FPGA-Based Real-Time Simulation of Electromagnetic Transients. IEEE Trans. Power Del. 2011, 26, 830–840. [Google Scholar] [CrossRef]
  17. Zhang, B.; Fu, S.; Jin, Z.; Hu, R. A Novel FPGA-Based Real-Time Simulator for Micro-Grids. Energies 2017, 10, 1239. [Google Scholar] [CrossRef] [Green Version]
  18. Zhang, B.; Jin, X.; Tu, S.; Jin, Z.; Zhang, J. A New FPGA-Based Real-Time Digital Solver for Power System Simulation. Energies 2019, 12, 4666. [Google Scholar] [CrossRef] [Green Version]
  19. Zhang, B.; Wu, Y.; Jin, Z.; Wang, Y. A Real-Time Digital Solver for Smart Substation Based on Orders. Energies 2017, 10, 1795. [Google Scholar] [CrossRef] [Green Version]
  20. Guan, Y.; Zhang, B.; Jin, Z. An FRTDS Real-Time Simulation Optimized Task Scheduling Algorithm Based on Reinforcement Learning. IEEE Access 2020, 8, 155797. [Google Scholar] [CrossRef]
  21. Wang, L. Component-based performance-sensitive real-time embedded software. IEEE Aerosp. Electron. Syst. Mag. 2008, 23, 28–34. [Google Scholar] [CrossRef]
  22. Tibermacine, C.; Sadou, S.; That, M.T.; Dony, C. Software architecture constraint reuse-by-composition. Future Gener. Comput. Syst. 2016, 61, 37–53. [Google Scholar] [CrossRef] [Green Version]
  23. Lu, K.S.; Chang, C.K. ALTA: Automatic Load-Time Adaptation Technique for Refactoring-Based Evolution of Software Component. In Proceedings of the 2012 IEEE 36th Annual Computer Software and Applications Conference, Izmir, Turkey, 16–20 July 2012; pp. 203–212. [Google Scholar] [CrossRef]
  24. Alsac, O.; Stott, B.; Tinney, W. Sparsity-oriented compensation methods for modified network solutions. IEEE Trans. Power Appar. Syst. 1983, 102, 1050–1060. [Google Scholar] [CrossRef]
  25. Zhang, B.; Zhao, D.; Jin, Z.; Wu, Y. Multivalued Coefficient Prestorage and Block Parallel Method for Real-Time Simulation of Microgrid on FRTDS. Energies 2017, 10, 1248. [Google Scholar] [CrossRef] [Green Version]
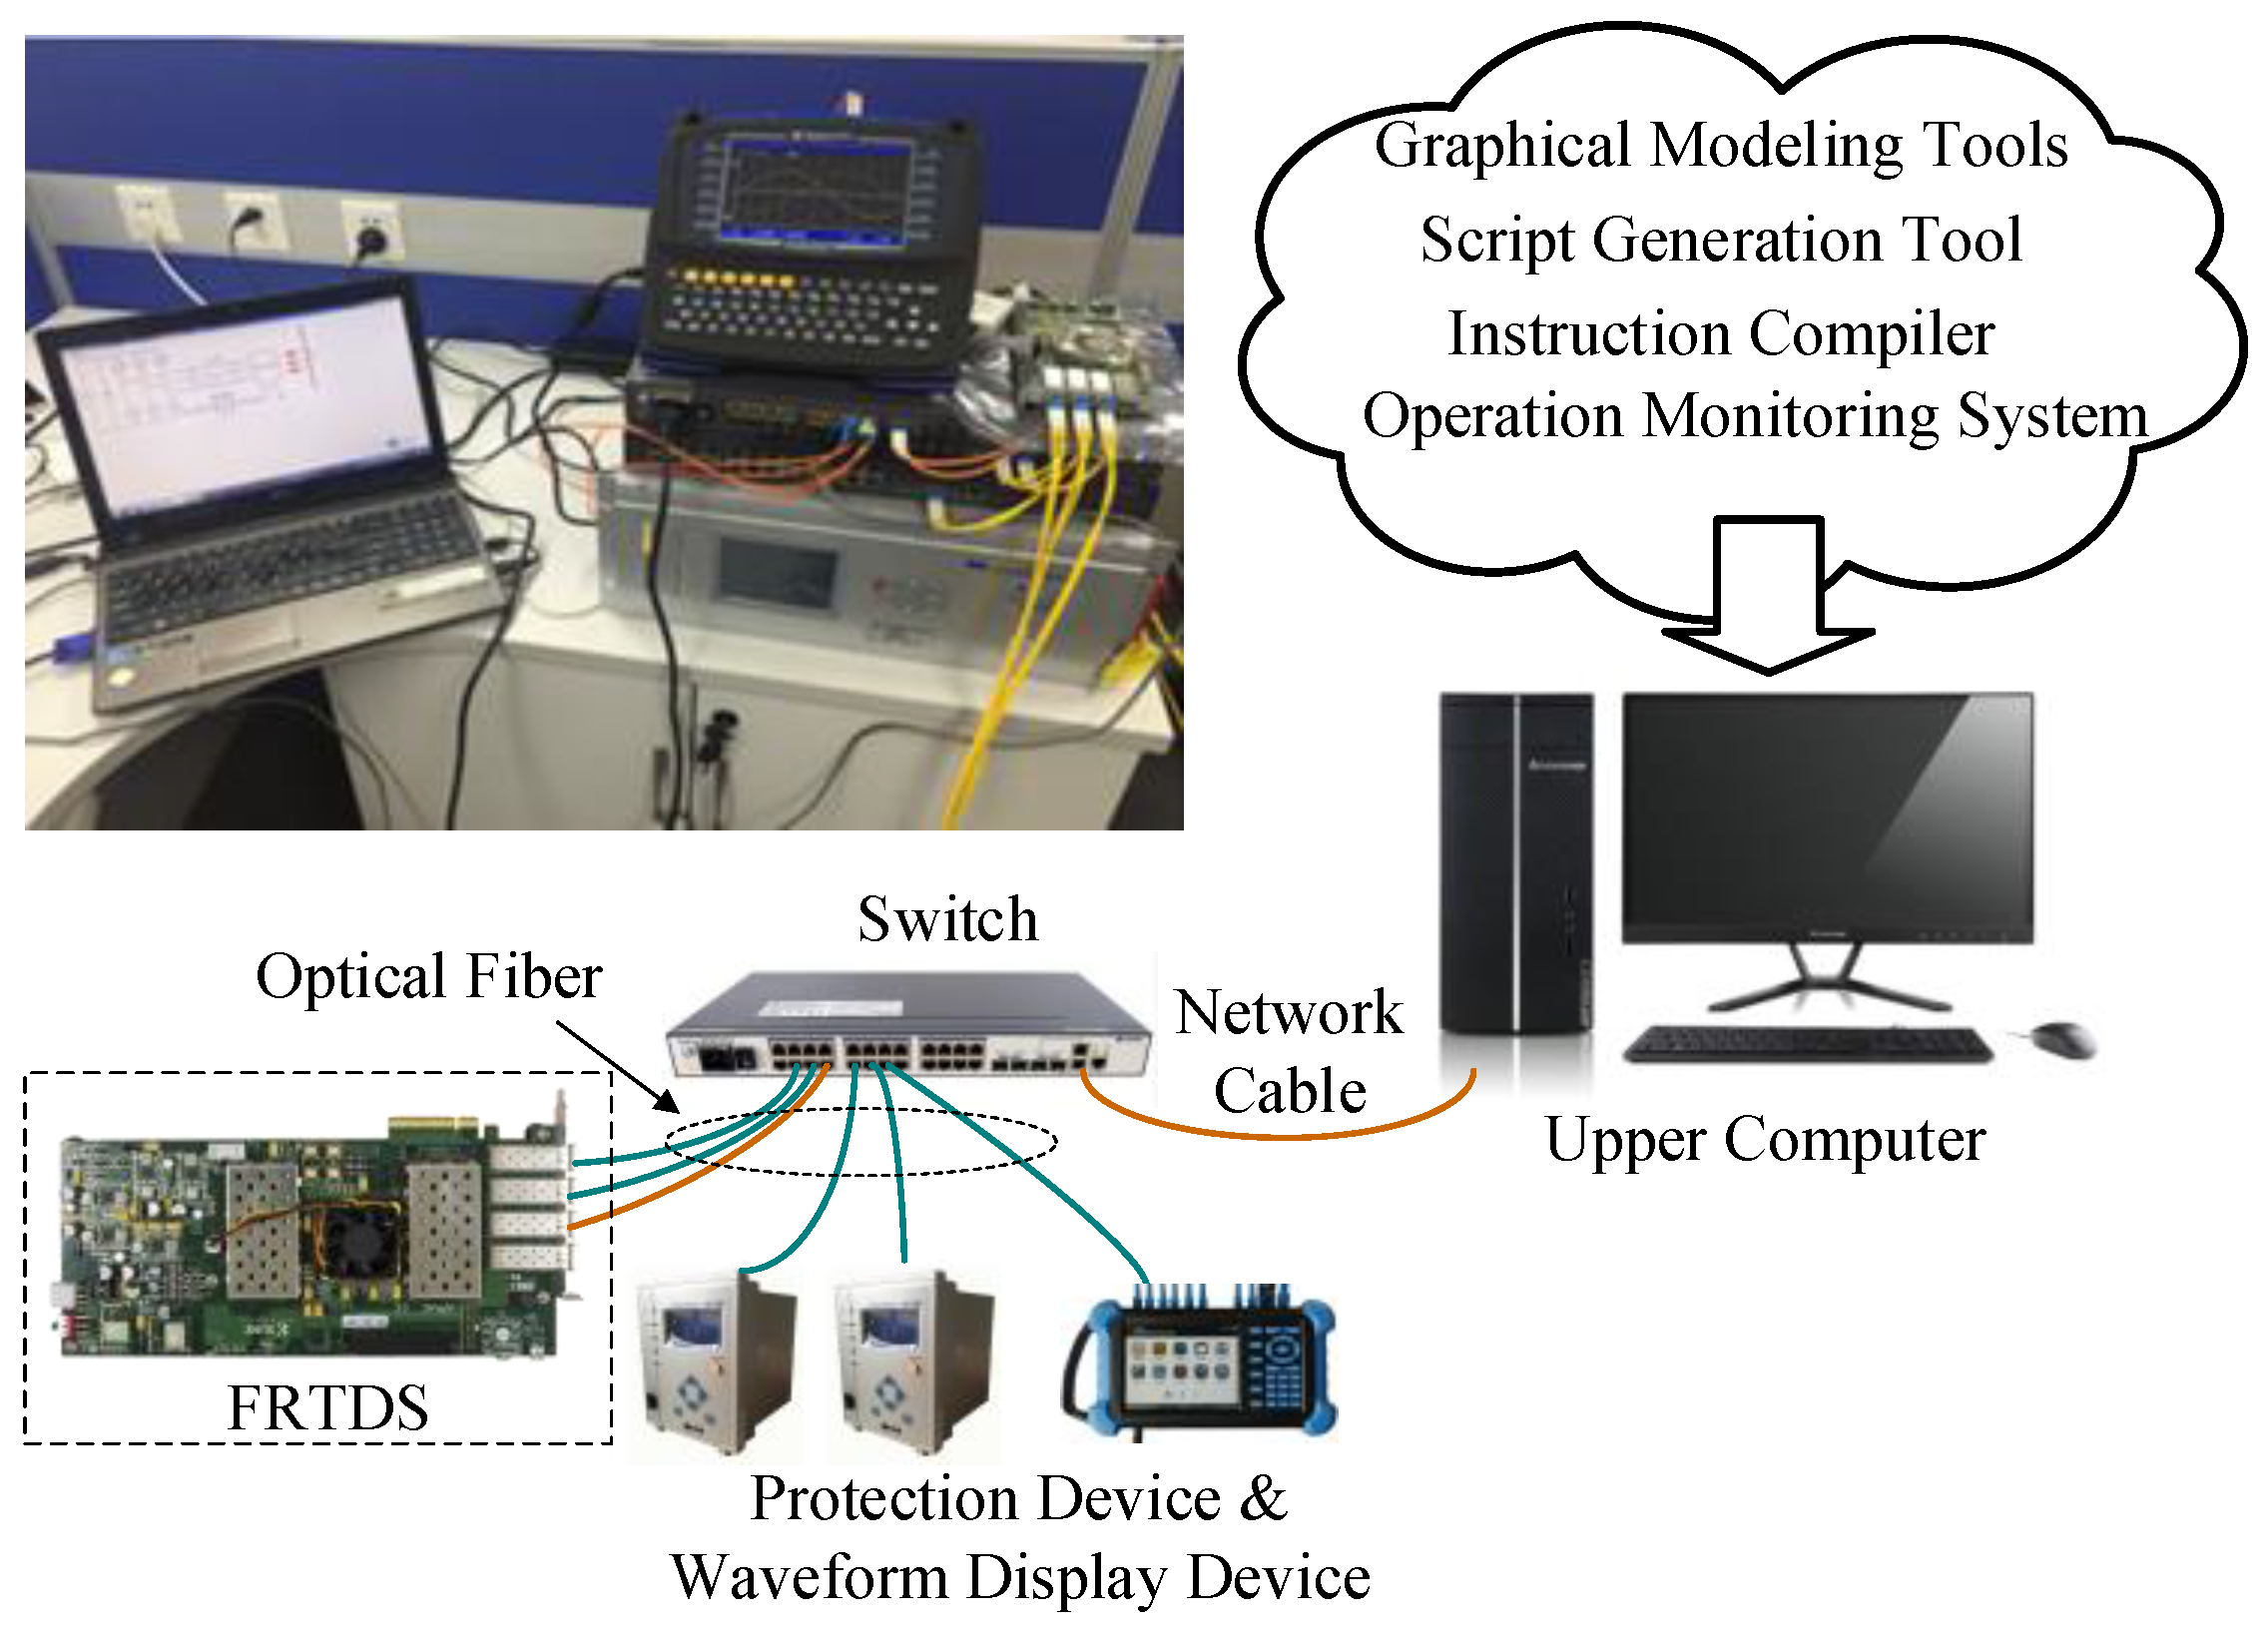
Figure 1. Schematic diagram and photo of hardware-in-the-loop system based on FRTDS.
Energies 16 02731 g001
Figure 2. Specific content of the simulation script.
Energies 16 02731 g002
Figure 3. Schematic diagram of electrical components.
Energies 16 02731 g003
Figure 4. Schematic diagram and equivalent circuit of three-phase resistive and inductive load circuits.
Energies 16 02731 g004
Figure 5. Topological change and equivalent circuit diagram after eliminating internal nodes.
Energies 16 02731 g005
Figure 6. Schematic diagram of the componentization of the control subsystem.
Energies 16 02731 g006
Figure 7. Composite units commonly used in power systems. (a) Interval unit; (b) transformer unit; (c) line unit with programmable faults.
Energies 16 02731 g007aEnergies 16 02731 g007b
Figure 8. Multilevel composite component.
Energies 16 02731 g008
Figure 9. Schematic diagram of component reconstruction.
Energies 16 02731 g009
Figure 10. (a) Schematic diagram of flooding phenomena; (b) schematic diagram of draining phenomena.
Energies 16 02731 g010
Figure 11. Schematic diagram of the generator–transformer group-boost station.
Energies 16 02731 g011
Figure 12. (a) The 220 kV I bus voltage waveform; (b) the 20 kV bus voltage waveform; (c) the 6 kV bus voltage waveform; and (d) the 2251-line voltage waveform.
Energies 16 02731 g012
Table 1. Three-phase resistive and inductive load user parameters.
Parameter NameParameter TypeUnitSetting Range
Rated voltage (UB)Floating point numberKV0~2000
Rated active power (P)Floating point numberMW0~100
Rated reactive power (Q)Floating point numberMVar0~100
Ground resistance (Rg)Floating point numberΩ0~106
Grounding inductance (Lg)Floating point numberH0~106
Associated nodePositive integer/0~100
Table 2. Comparison of the compilation results of different scripts.
SchemeComputational LoadNumber of Data TransfersNumber of InstructionsActual Time Used
Scheme 116,6272802626750.14 μs
Scheme 216,6271680590547.24 μs
Scheme 315,3011513542443.39 μs
Disclaimer/Publisher’s Note: The statements, opinions and data contained in all publications are solely those of the individual author(s) and contributor(s) and not of MDPI and/or the editor(s). MDPI and/or the editor(s) disclaim responsibility for any injury to people or property resulting from any ideas, methods, instructions or products referred to in the content.