1. Introduction
The transportation sector is a major source of global greenhouse gas (GHG) emissions, contributing around 20% of the world’s total carbon dioxide (CO
2) emissions [
1]. Adoption of electric vehicles (EVs) can reduce CO
2 emissions, if countries adapt low-emission electricity mixes [
2]. On the vehicle-manufacturer side, there is a tightening of regulatory conditions for achieving environmental, social, and governance (ESG) performance, with the former recommended monitoring and disclosure frameworks being replaced by community legal obligations. Accounting for carbon emissions can recognize the aggregate emissions of certain units of low-carbon products, which also encourages EV production [
3,
4].
Efforts to improve vehicle energy efficiency are a key aspect of the transition from fossil fuel-based transportation to electric mobility. The Shell Eco-Marathon (SEM) is a prestigious annual international competition for student teams that provides a platform for innovative solutions for fuel-efficient vehicles. The concept of the Mileage Challenge is to complete a race within the specified time while using the minimum amount of electricity or fuel. The vehicles must cover approximately 16 km in less than 40 min, and there are two different vehicle categories distinguished by architecture (Prototype and Urban Concept) and three subcategories based on energy source (internal combustion engine, electric battery, and hydrogen fuel-cell vehicles). Prototype vehicles have very low aerodynamic drag and mass to achieve ultimate energy efficiency, while urban-concept vehicles are more like conventional vehicles, and they must stop at each lap to simulate urban transportation. The Shell Eco-Marathon has been held in Europe since 1985 and has attracted over 200 teams from prominent European technical universities. Additionally, it has provided a site for several fuel economy world records [
5].
Energy efficient driving (or eco-driving) can be accomplished by using optimal driving strategies, which are determined by the appropriate velocity profile for a given track. The energy consumption can be decreased by modifying the vehicle operation; this technique is also very important for SEM events. In the literature, different methods are described for that process.
The velocity profile is obtained by solving an optimal control problem that aims to minimize energy consumption [
6]. General formulation of road vehicles and certain improvements in real-time calculation of the optimal speed profiles were presented in this article.
A model-based optimization was performed on an electric prototype vehicle by using experimental results for its formulation, as described in Ref. [
7]. The simulation model was based on powertrain efficiency maps and coast-down test results, with cornering losses neglected in the vehicle model, but incorporated into the velocity strategies through speed limitations during cornering. The optimization was conducted on segments of the track using a genetic algorithm (GA), thus resulting in a 30% improvement over a human driver’s strategy considering the driving errors.
Several mathematical optimization methods were compared for similar application in Ref. [
8]; the results showed the effectiveness of evolutionary optimization methods, such as particle swarm optimization (PSO) and the grey wolf optimizer (GWO). Moreover, the traditional gradient-based optimization strategies, such as sequential quadratic programming (SQP), were shown to be inefficient.
A sensitivity analysis of the energy consumption for an SEM vehicle on three different tracks was performed and described in Ref. [
9]. The results showed that reducing the vehicle’s mass results in the largest energy savings, with a 10% mass reduction leading to a 5.5% to 8% decrease in energy consumption depending on the track. The aggressiveness of the track was also considered in the simulation, with cornering losses found to be a significant factor contributing to a 5% to 12% power loss depending on the track.
A vehicle digital twin was validated and used to simulate energy management issues of an ultra-efficient electric vehicle for the Shell Eco-Marathon competition [
10]. For the dynamic driving simulator, VI-CarRealTime (VI-CRT) and Simulink were used. The heavy effect of road traffic on eco-driving strategies was shown, but the assistance systems could provide energy savings up to 24% for the vehicle of concern.
Terrain data were added and used to create algorithms that support the route search processes of an EV [
11]. The results indicate that selecting the route chosen by the proposed algorithm provides a more efficient operation. This also proves the extended effect of considering the vehicle track and using it in simulation and optimization environments.
In today’s urban transportation, EVs have a respected role and regenerative braking is an important factor for energy efficiency. The literature covers different aspects of regenerative braking from emergency braking to energy storage.
Emergency braking control strategy was investigated by hardware-in-the-loop experiments in Ref. [
12]. The simulations were carried out by using the characteristics of the NEDC driving cycle.
Systematic investigation related to electric braking systems (EBS) was carried out in Ref. [
13], where simulation results were presented for various braking conditions.
A detailed optimization model was used to determine the characteristics of power flow in the process of electric braking, where a combined efficiency model of the front axle (CVT–ISG) and rear axle (PMSM) was established. The double motor regenerative braking system model was created in the MATLAB/Simulink platform for simulation purposes. The simulation showed that the improved strategy was 1.18% higher than the typical braking under NYCC conditions [
14].
The main methods of applicable energy saving techniques were presented in detail in Ref. [
15], in which the importance of the braking control strategy in regenerative braking and driving strategy optimization was emphasized.
Regenerative braking-torque distribution strategy was designed for a vehicle equipped with four electric in-wheel motors using regenerative braking [
16]. An MPC controller was used to achieve better energy efficiency and braking performance. The AMESim platform was coupled with Simulink for simulation purposes. The regeneration efficiency and braking performance was improved due to the MPC controller compared to the rule-based regenerative braking strategy.
Energy storage is a crucial consideration when the recovered energy by the regenerative braking needs be stored. In Ref. [
17], the role of supercapacitors was explored based on the average charge current; the module’s overall capacitance had a far less effect on the regenerative braking profile because the main source of loss was the motor. The efficiency of the system was considered relatively high, peaking at around 68%, but was dependent on the braking rate and initial supercapacitor’s SoC (state of charge).
Application of regenerative braking contributes to minimize the energy consumption of EVs, where the braking process can be optimized to increase the recuperated energy. The aim of this study is to merge the results of regenerative braking using an optimized torque function and driving strategy optimization. The combination of these two fields is necessary to achieve improvements in overall energy efficiency of the investigated lightweight vehicle. This study also extends the proposed optimization framework for measurement-based vehicle model presented in Ref. [
18]. The sensitivity analysis and application limits of the acquired of braking-torque function are also discussed.
2. Shell Eco-Marathon Vehicle Design
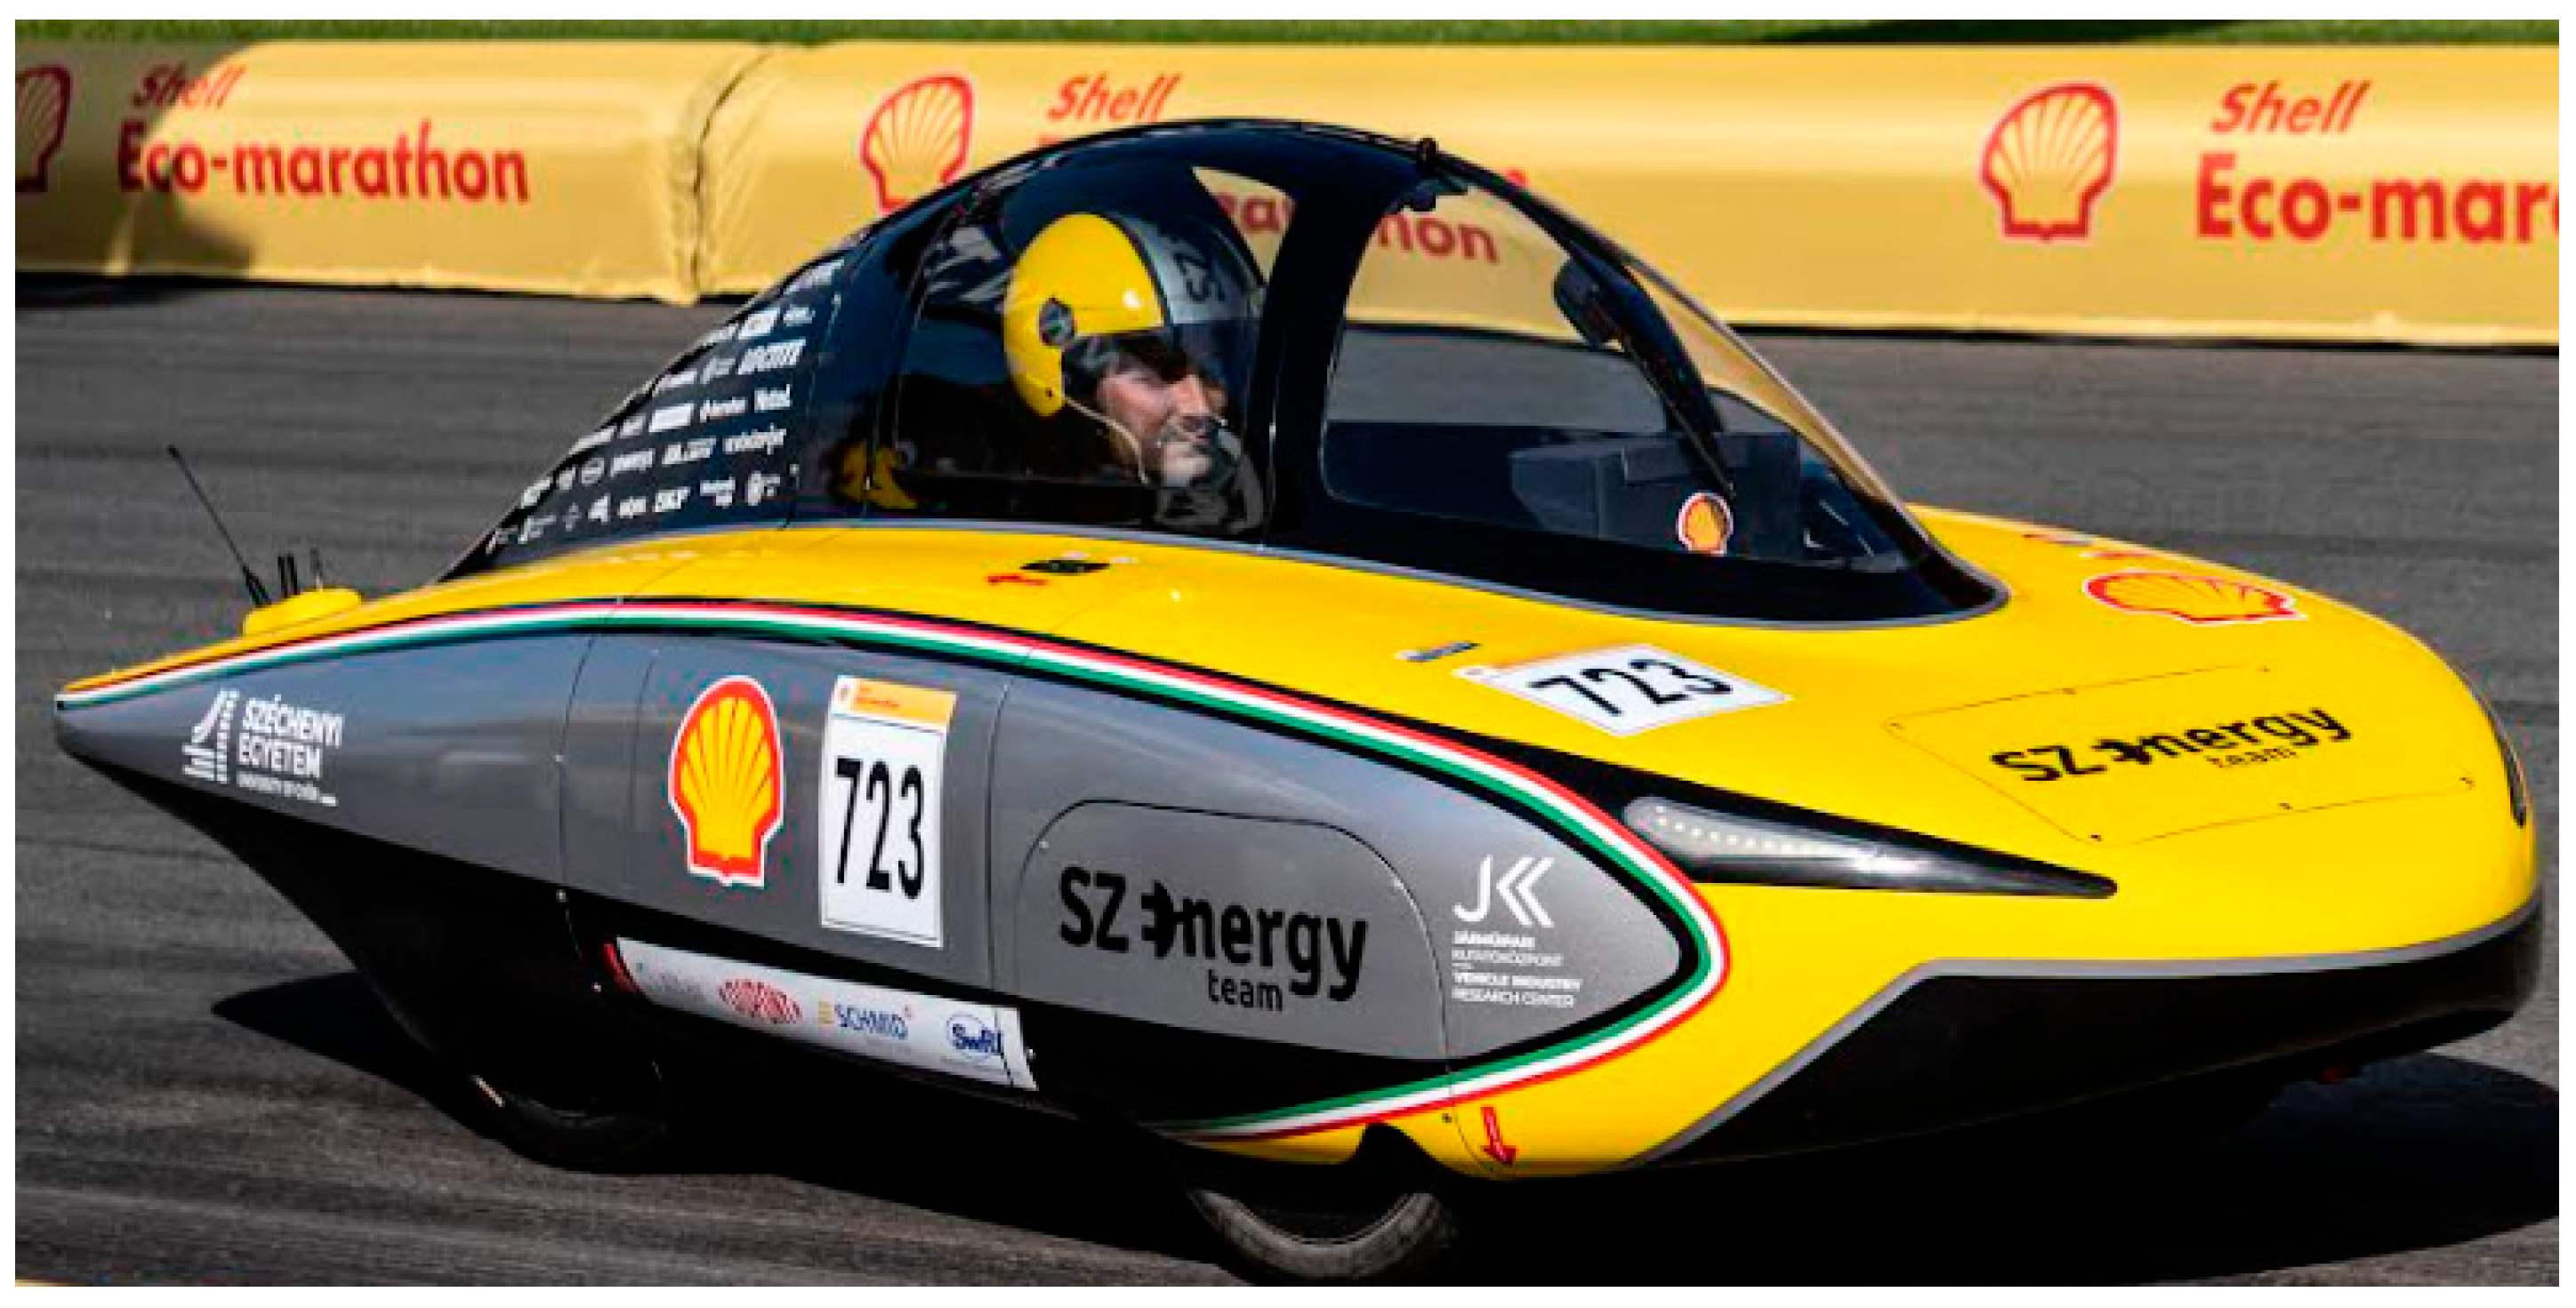
SZEnergy Team is a student vehicle-development team from Széchenyi István University located in Győr, Hungary. The team has been participating in the Shell Eco-Marathon competition since 2005, starting off with the construction of electric cars powered by solar cells, leading to multiple wins. In 2013, the team switched to developing battery electric vehicles and the first vehicle, called SZElectricity, placed third in two consecutive years (2015 and 2016). Their current racing vehicle, the SZEmission (
Figure 1), was revealed in 2019 and earned a sixth-place finish in 2019. The Shell Eco-Marathon 2022 was hosted in Assen after a pause of a few years due to COVID-19, and the team set a world record result in terms of the track and regulations, winning the battery electric category for the first time in the team’s history.
The factors contributing to the success of the SZEmission are diverse. The technical parameters of the vehicle are summarized
Table 1. The vehicle chassis is made from carbon fiber-reinforced polymer composite with paper honeycomb. This structure grants rigidity with considerably low mass and keeps the drag coefficient of the shape around 0.1, which is extremely low. The vehicle is driven by self-developed electric drives. Either a permanent magnet synchronous machine (PMSM) or a brushless DC powertrain is an option to drive the vehicle. This method enables the gear ratio to be adjusted, thus making the drive characteristics tunable to meet specific requirements. Driving strategy optimization was performed by using the proposed methodology described in Ref. [
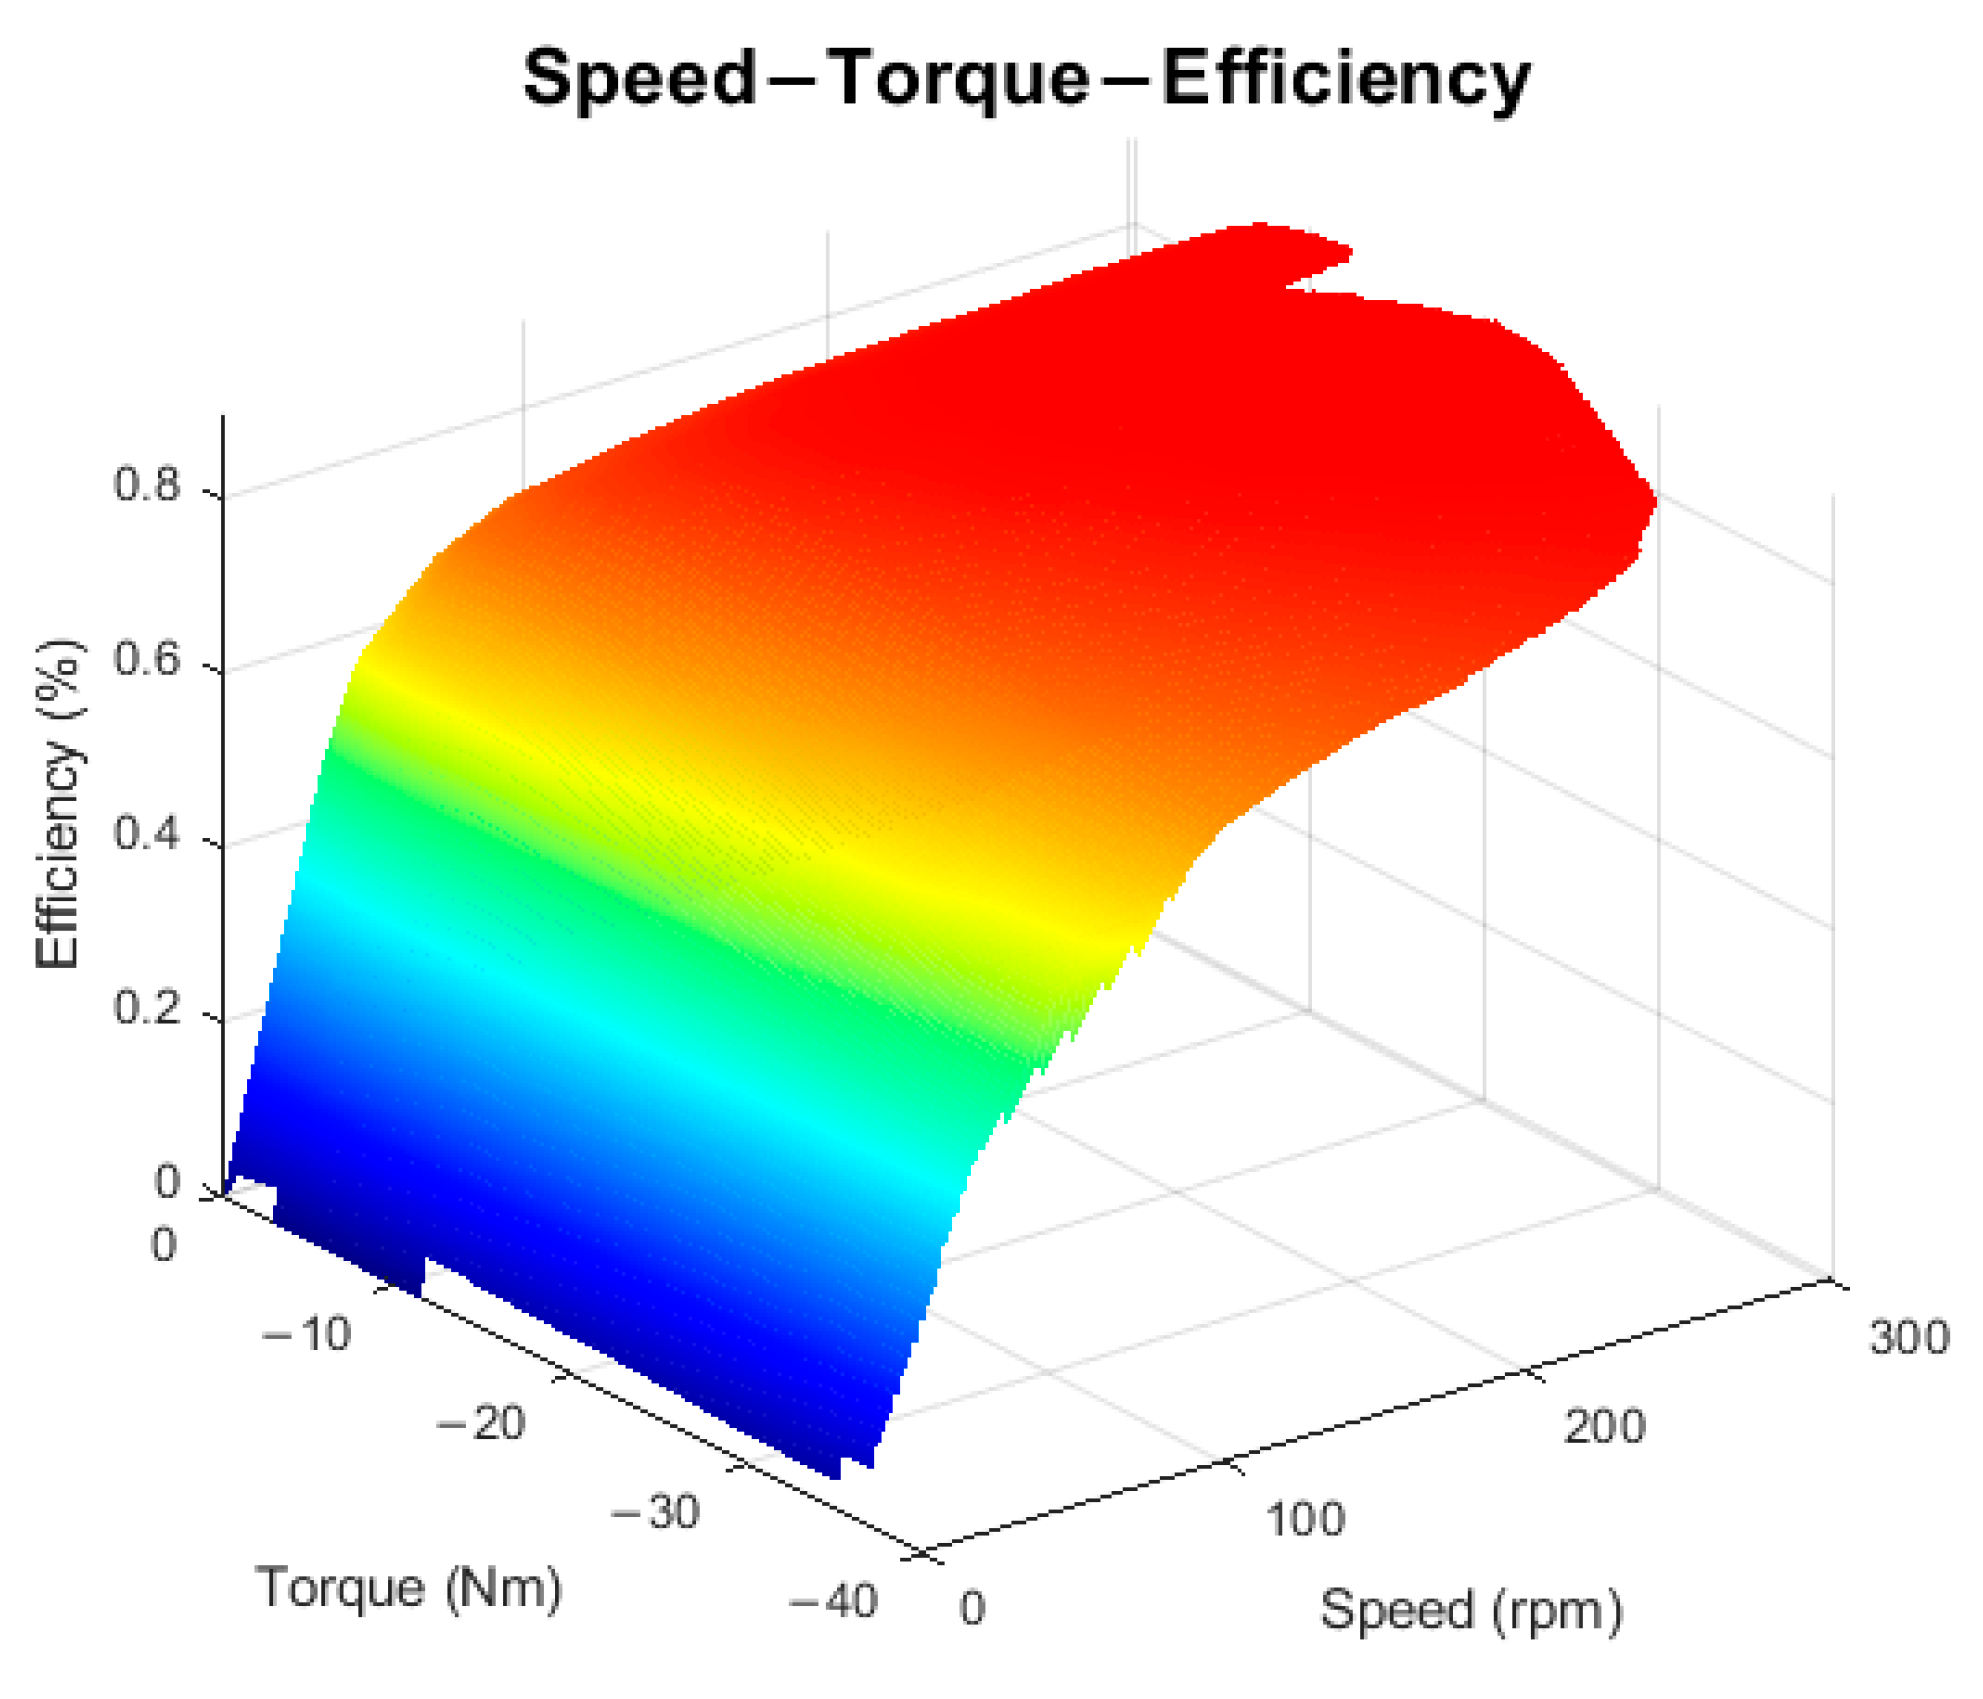
18], which enables to maximize the potential of the current vehicle setup. The optimization was performed with the powertrain version of SZEVOL2, which is a BLDC drive in mass optimized housing. A low-idle electric consumption motor controller is used for the drive. The drive was measured in a laboratory test bench environment, where extended measurements were made to define the efficiency (
Figure 2) and power-loss map. The measurements include the losses of controller, transmission, and the drive, creating a completely applicable model of the powertrain, which can be directly applied in the vehicle model.
3. Optimization Framework for Regenerative Braking
The basis of the optimization is provided by a measurement-based vehicle model. It is a grey-box modeling approach, where systematic measurements are used to describe the mathematical background of vehicle operation. The model can be employed to handle eco-driving problems of lightweight, energy-efficient vehicles. The suggested model incorporates the track properties, including the effects of corners, and describes the full powertrain, vehicle dynamics, and resistance. The basic structure of the optimization model was first proposed in Ref. [
19]; this model was suitable for preliminary powertrain evaluation, gear selection, and initial driving strategy optimization. The acceleration and free rolling are handled with high accuracy by the model, but the energy recovery of regenerative braking was not considered. The braking phase was just solved by a constant deceleration imitating the effect of hydraulic braking. Initial regenerative braking strategy optimization was proposed in Ref. [
20], where the results were compared to the best human driver attempts, and energy verification was carried out. It was applicable to simulate vehicle operation without regenerative braking. In Assen, freewheel bearing arrangement was applied in the vehicle, which did not allow the using of regenerative braking. A new SEM regulation was published, where more frequent stops on the track were proposed for the 2023 season. It renders the prior vehicle model ineffective and requires the use of regenerative braking. Vehicle model extension is needed, which is suitable for driving strategy optimization during the upcoming SEM competitions, where the role of regenerative braking is increased. In this paper, the following developments are elaborated:
Determination of optimal regenerative braking-torque function to achieve maximal energy recovery;
Parameter sensitivity analysis of optimized braking-torque function;
Implementation of regenerative braking in the measurement-based vehicle model;
Complete driving strategy optimization.
Firstly, adequate mathematical formulation of the physical system is described. The vehicle accelerates due to the powertrain’s effective traction force,
, which is obtained as the ratio of the generated torque
to the wheel radius R
wheel, as described in Equation (1).
The vehicle longitudinal dynamics, ma(t), are determined according to Equation (2), where the total traction force
generated by the powertrain accelerates the vehicle against the cumulative resistance forces
and the force component of grade resistance
arising from the elevation of the track.
The cumulative resistance force, F
res, signifies the aggregated force generated by air resistance
, rolling resistance
, cornering resistance
, and vehicle inertia
, as expressed by Equation (3). F
res can be determined from the combination of the coast-down test and speed-controller cornering test as a three-dimensional force model, which is fully applicable in the vehicle model.
During the braking process, the drive could generate a braking force similar to traction force, but acting in the opposite way, thereby slowing the vehicle according to Equation (4).
The braking force,
, is generated by the torque of the drivetrain when the operation mode switches from motor to generator. Thus,
is obtained as the ratio of the generated braking-torque M
brake to the wheel radius R
wheel, as indicated by Equation (5).
At the start of the braking, the vehicle is traveling with speed
from which the vehicle’s kinetic energy, E
kinetic, is computed according to Equation (6):
Energy can be recovered during the process of regenerative braking from the actual kinetic energy, while the available energy is reduced by the losses in braking (correlates with drive efficiency) and resistance and vertical forces. Thus, the energy recovered,
, can be defined as indicated by Equation (7).
Kinetic energy loss arises from the dissipative effect of acting resistance and grade forces. Equation (8) calculates the kinetic energy loss,
, as follows:
In the optimization process, the universal braking-torque function is not affected by the track so that the term
in the expression above reduces to
Inserting this equation into Equation (8) yields the kinetic energy loss,
, as
This means that the vehicle is traveling on a flat track without adding any additional vertical force component to the vehicle dynamics; the rolling resistance is still included in
. The recovered energy can be described with the braking force using Equation (11), the derivation of which is detailed in Ref. [
20].
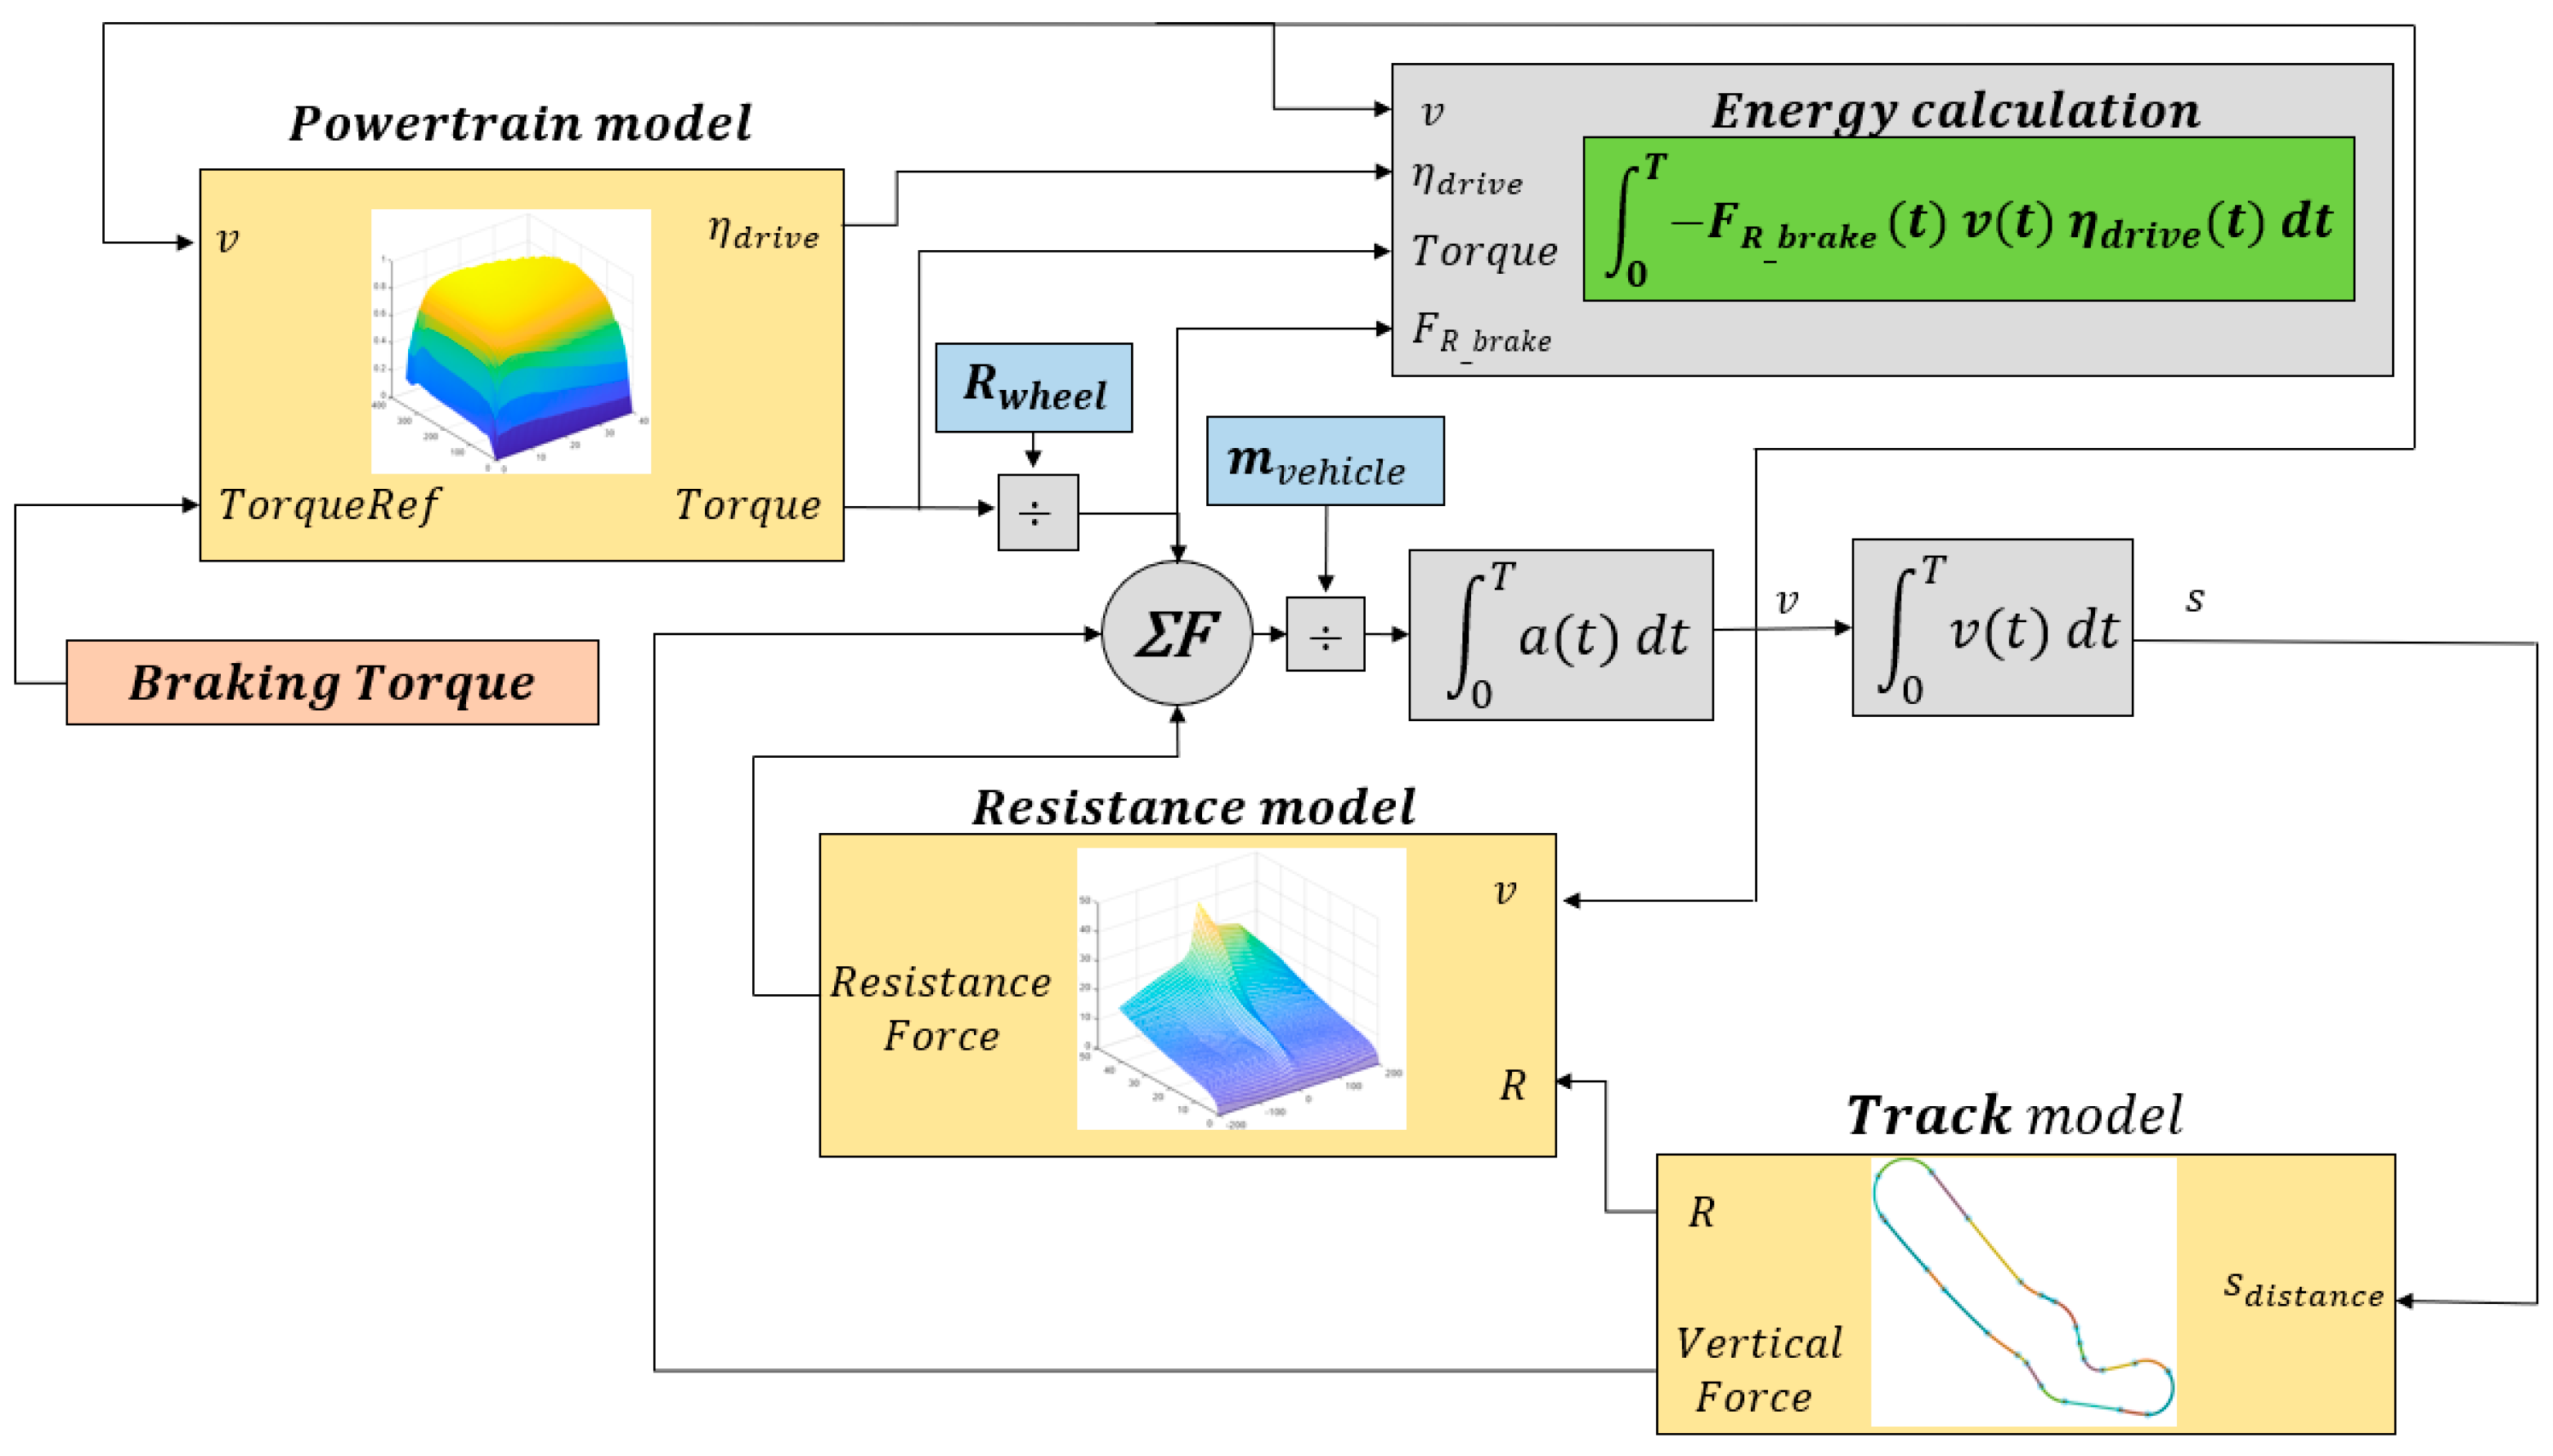
The optimization model was created in the MATLAB/Simulink environment based on the schematic structure depicted in
Figure 3. The main subassemblies are Powertrain model, Resistance model, and Track model.
The model was created to be suitable for further applications such as driving strategy optimization; thus, the track model is also included. The model version described in
Figure 3 operated with direct torque input, which is not applicable for driving strategy optimization, but ideal for determination of optimal regenerative braking-torque function. It is worth mentioning that in this work, the battery model is not handled as the SEM regulation is measuring the recuperated energy and not actual the battery SoC.
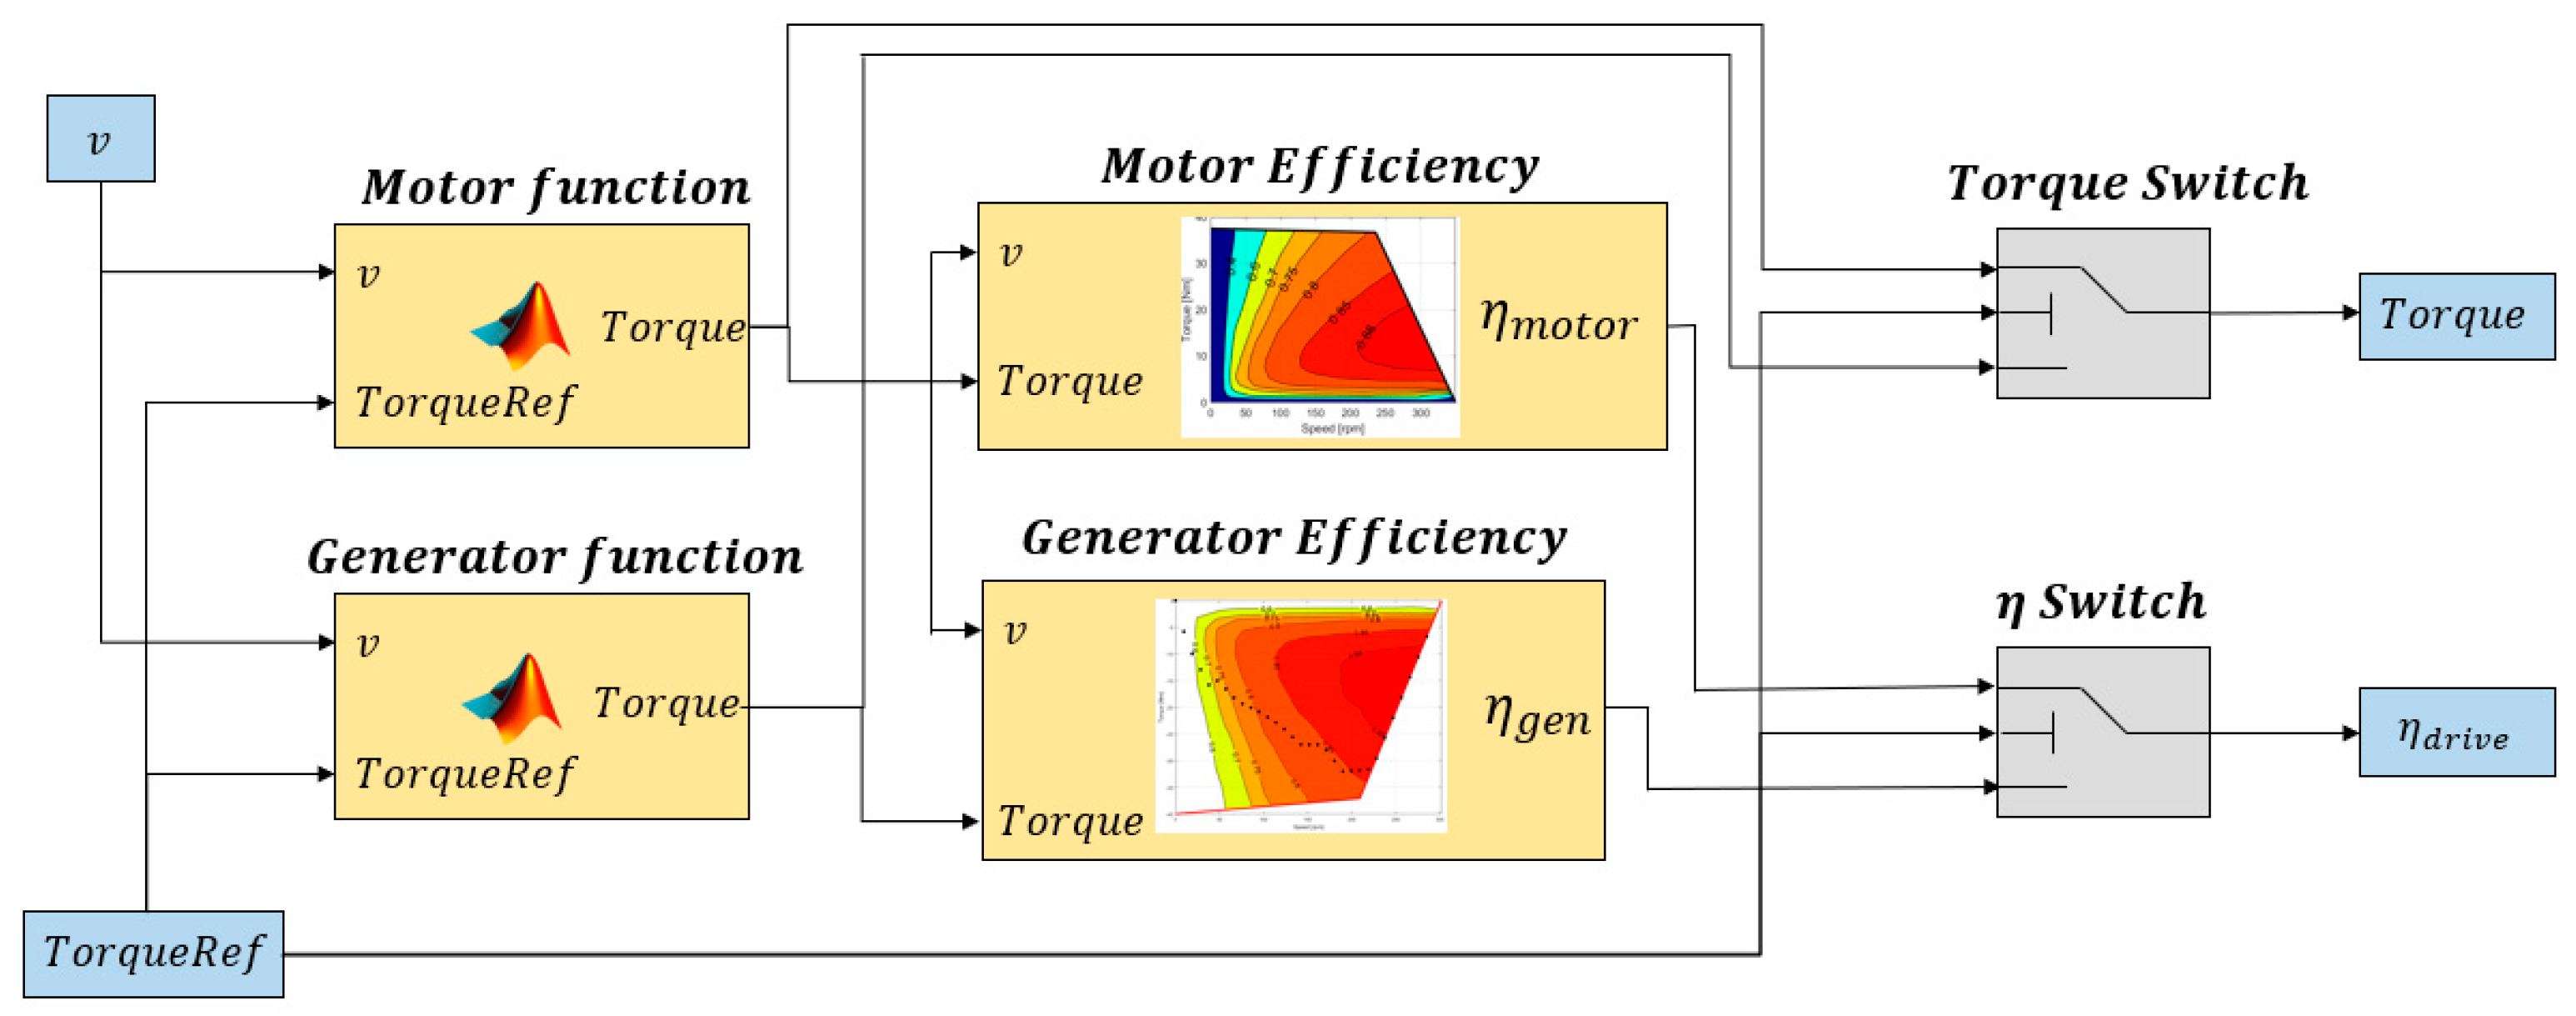
The operation mode of the electric powertrain is dual as both motor and generator operations are possible depending on the control method. The novelty of the model lies in the structure of the powertrain subassembly as it can operate in both motor and generator modes. The overview of powertrain subassembly is shown in
Figure 4. The vehicle’s desired torque reference decides the powertrain’s operation mode. The first step is the torque evaluation based on the motor or generator functions. In this step, the desired torque reference is checked and limited according to physical boundaries, and it forces the model to represent the real operation of the vehicle. The efficiency is determined based on the previously measured efficiency map of the drivetrain; in generator operation, a negative torque value is applied to the mathematical model. The last part of the subassembly is a block of logical operators, which matches the correct values based on the initial torque reference and provides the output of the subassembly.
4. Mathematical Formulation of the Optimization Problem
The aim of optimization is to define the optimal regenerative braking-torque function, which allows for converting the maximum available value of kinetic energy to recovered energy by the electric powertrain. Minimizing the negative value of recovered energy E
recovered, as given by Equation (11), is mathematically equivalent to maximizing its positive value in physical applications. Thus, the objective function can be expressed as the minimization problem given by Equation (12), which is computationally more convenient to implement in optimization software.
The track model does not impose any optimization constraint as it is assumed to be flat, and the vehicle path is straight. The optimized torque function describes discrete torque values to corresponding vehicle speeds, which maximize the recovered energy during regenerative braking. As part of the optimization process, 13 variables were defined (
) representing the braking-torque values to speed vector v. The speed vector v is given by Equation (13) and each element of v, i.e., v
i, is obtained as indicated by Equation (14)
The braking-torque vector,
, also contains 13 elements as indicated by Equation (15), where each of the elements, M
brake i, can take values according to Equation (16) within the bounds imposed by Equation (17).
During the optimization process, the initial speed condition,
, was set to 30 km/h (physical limit of the powertrain in flat track), and the vehicle properties in the model were defined according to the vehicle parameters listed in
Table 1. The optimization was performed by using a classical genetic algorithm (GA) in a MATLAB environment. The optimization model of regenerative braking was implemented in Simulink, and the GA used the model in every iteration while the fitness function evaluated its outputs. To find solutions, the GA employed nondeterministic processes such as selection, mutation, and crossover to generate a population of feasible solutions. The GA solution was largely influenced by the optimization settings and the initial population; thus, the result should not be considered the global optimum. To overcome the risk of becoming stuck in local minima, 10 attempts were made with different randomized initial populations. The size of initial population (
) was 260 individuals in each attempt. The GA is well suited for driving strategy-related tasks because it can effectively solve complex, nonlinear, and grey-box problems. The GA has been applied to minimize energy in various similar applications with great success [
7,
21,
22].
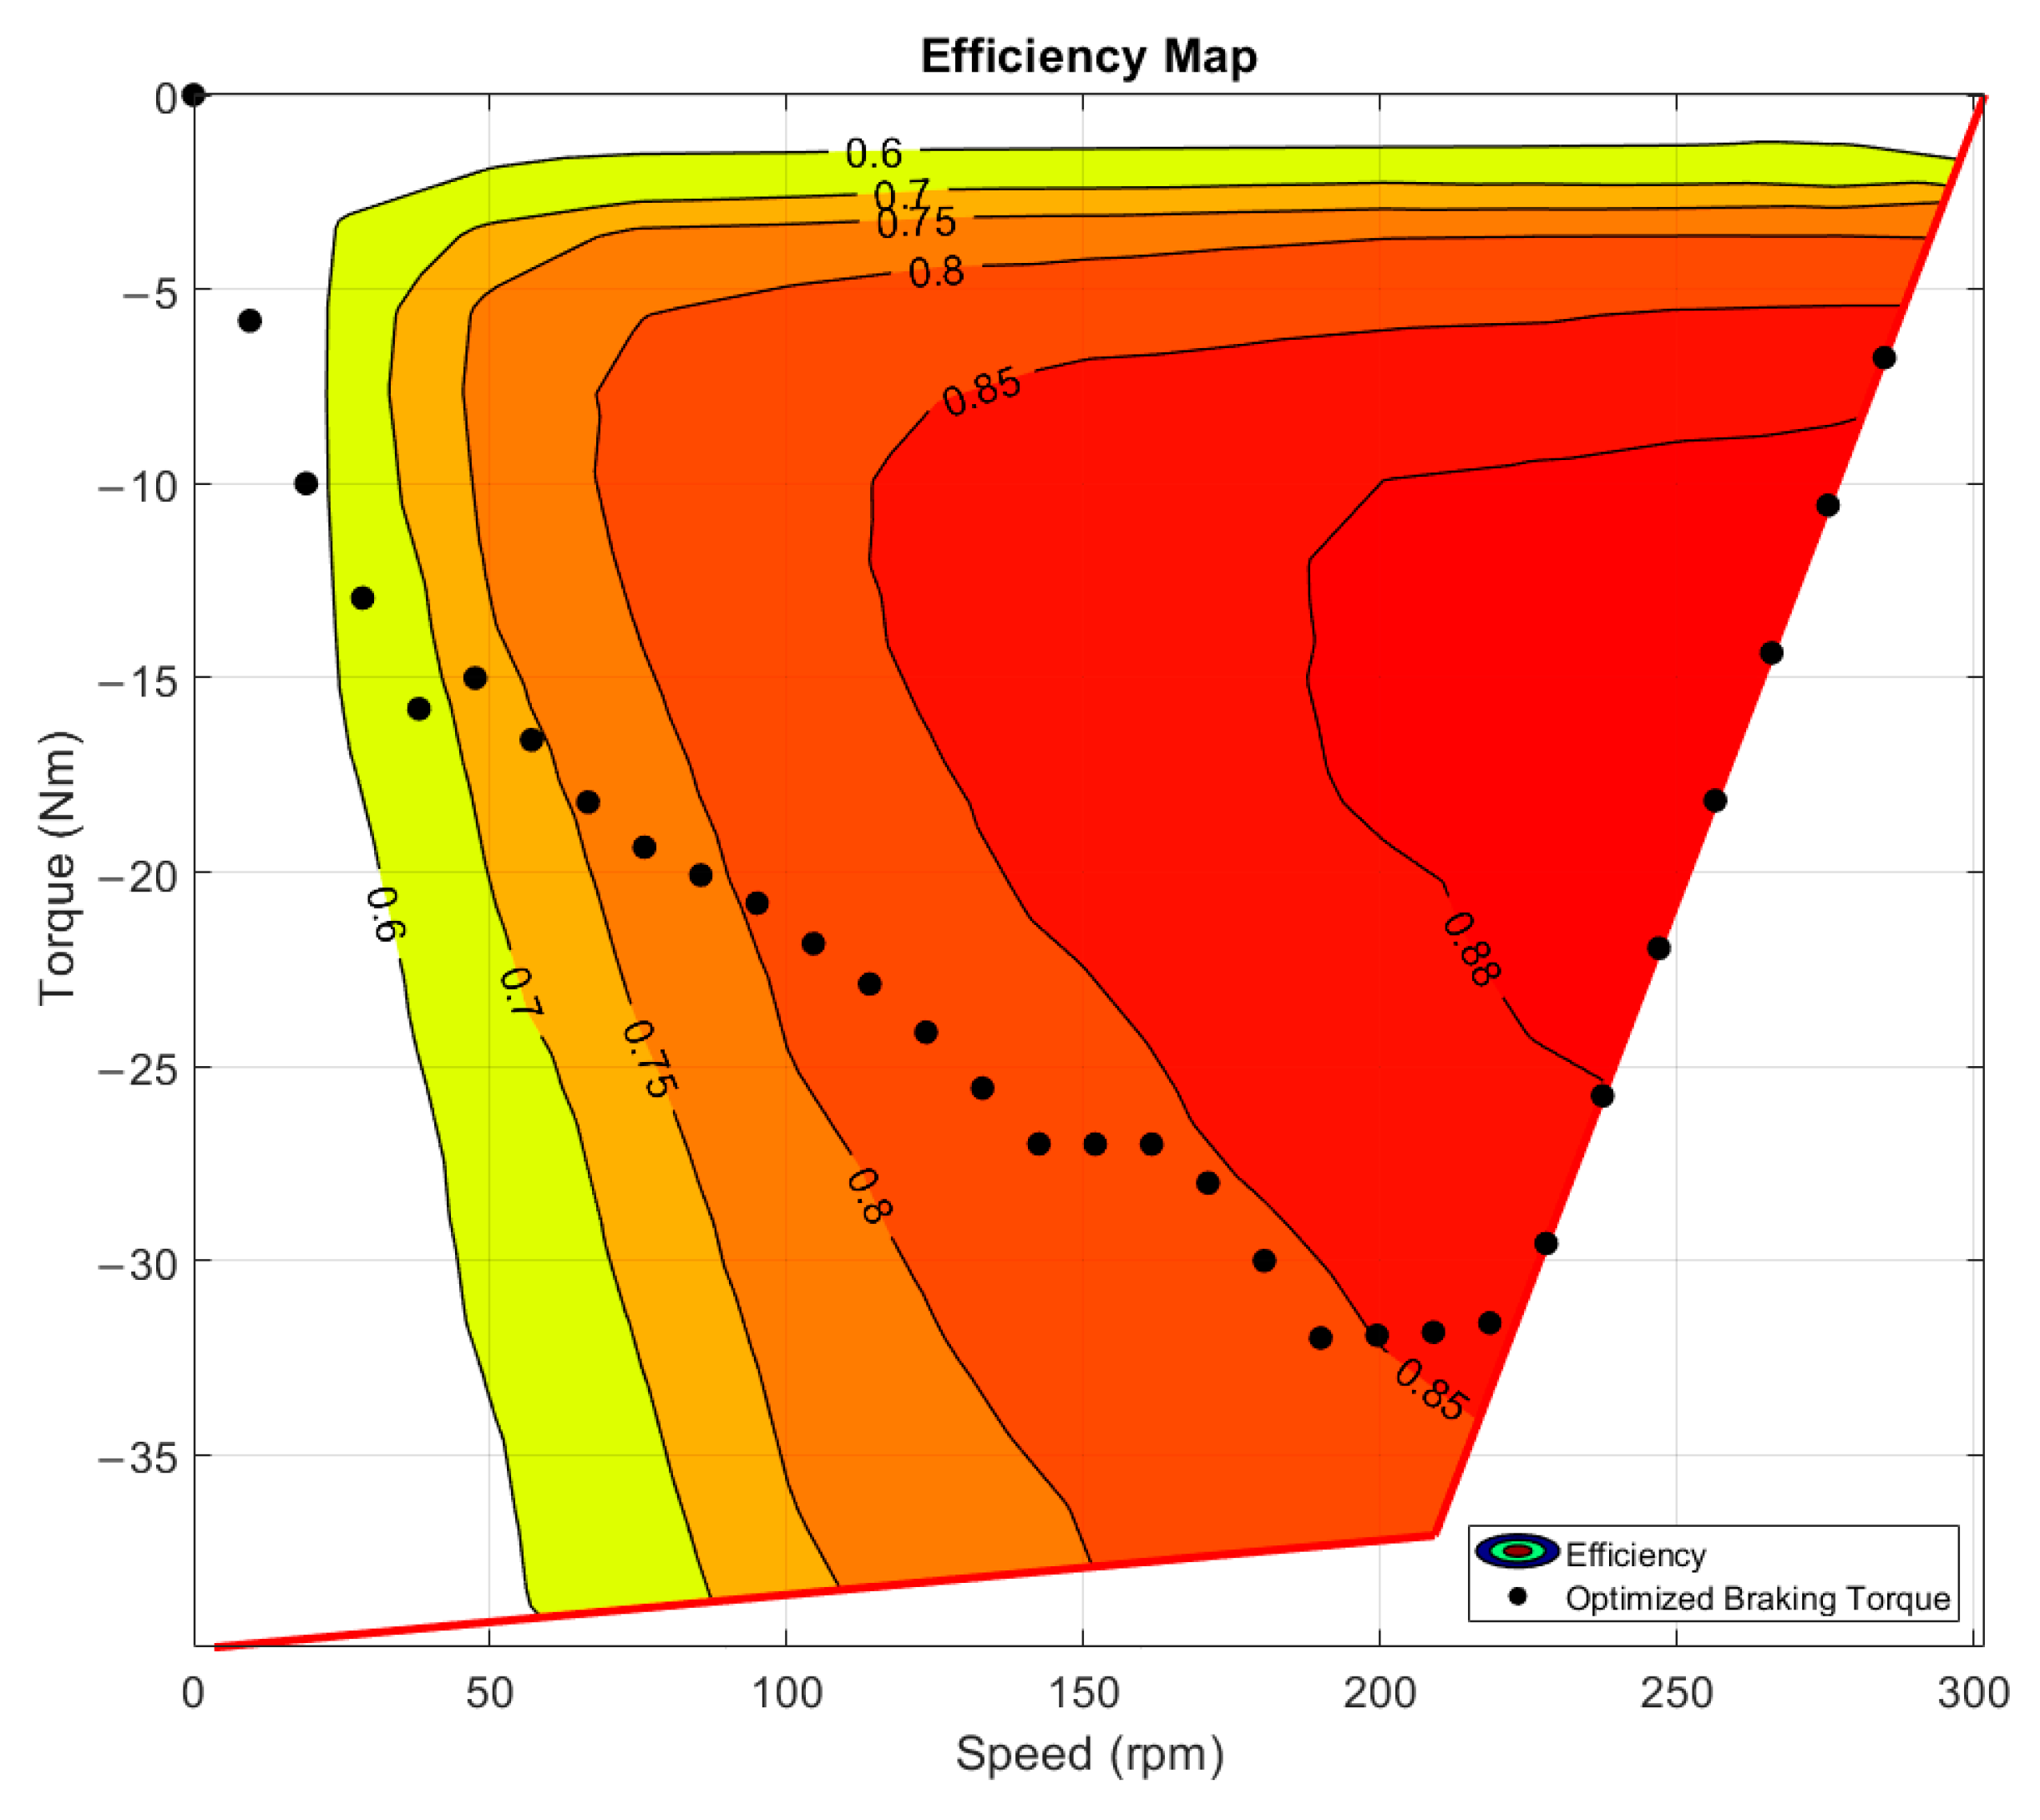
Figure 5 shows the resulting optimized braking-torque function displayed in the efficiency map of the powertrain in generator operation. In the figure, the resulting torque values are indicated with black dots. It is clearly visible that the resulting torque is maximized until it reaches the 220 rpm limit, where it starts trending horizontally to the left. It is not recommended to use the low-speed high braking-torque region of the powertrain because it could consume energy, depending on the motor control method. In the case presented, the optimization avoids using that area.
The detailed parameters of the optimization result are summarized in
Table 2. In total, 10 optimization attempts were made, and the best-performing attempt was selected as the solution. It is worth noting that the variance (
) of the optimization results in energy recovery was only 0.1777 J, which also confirms the usability of GA with the proposed optimization framework.
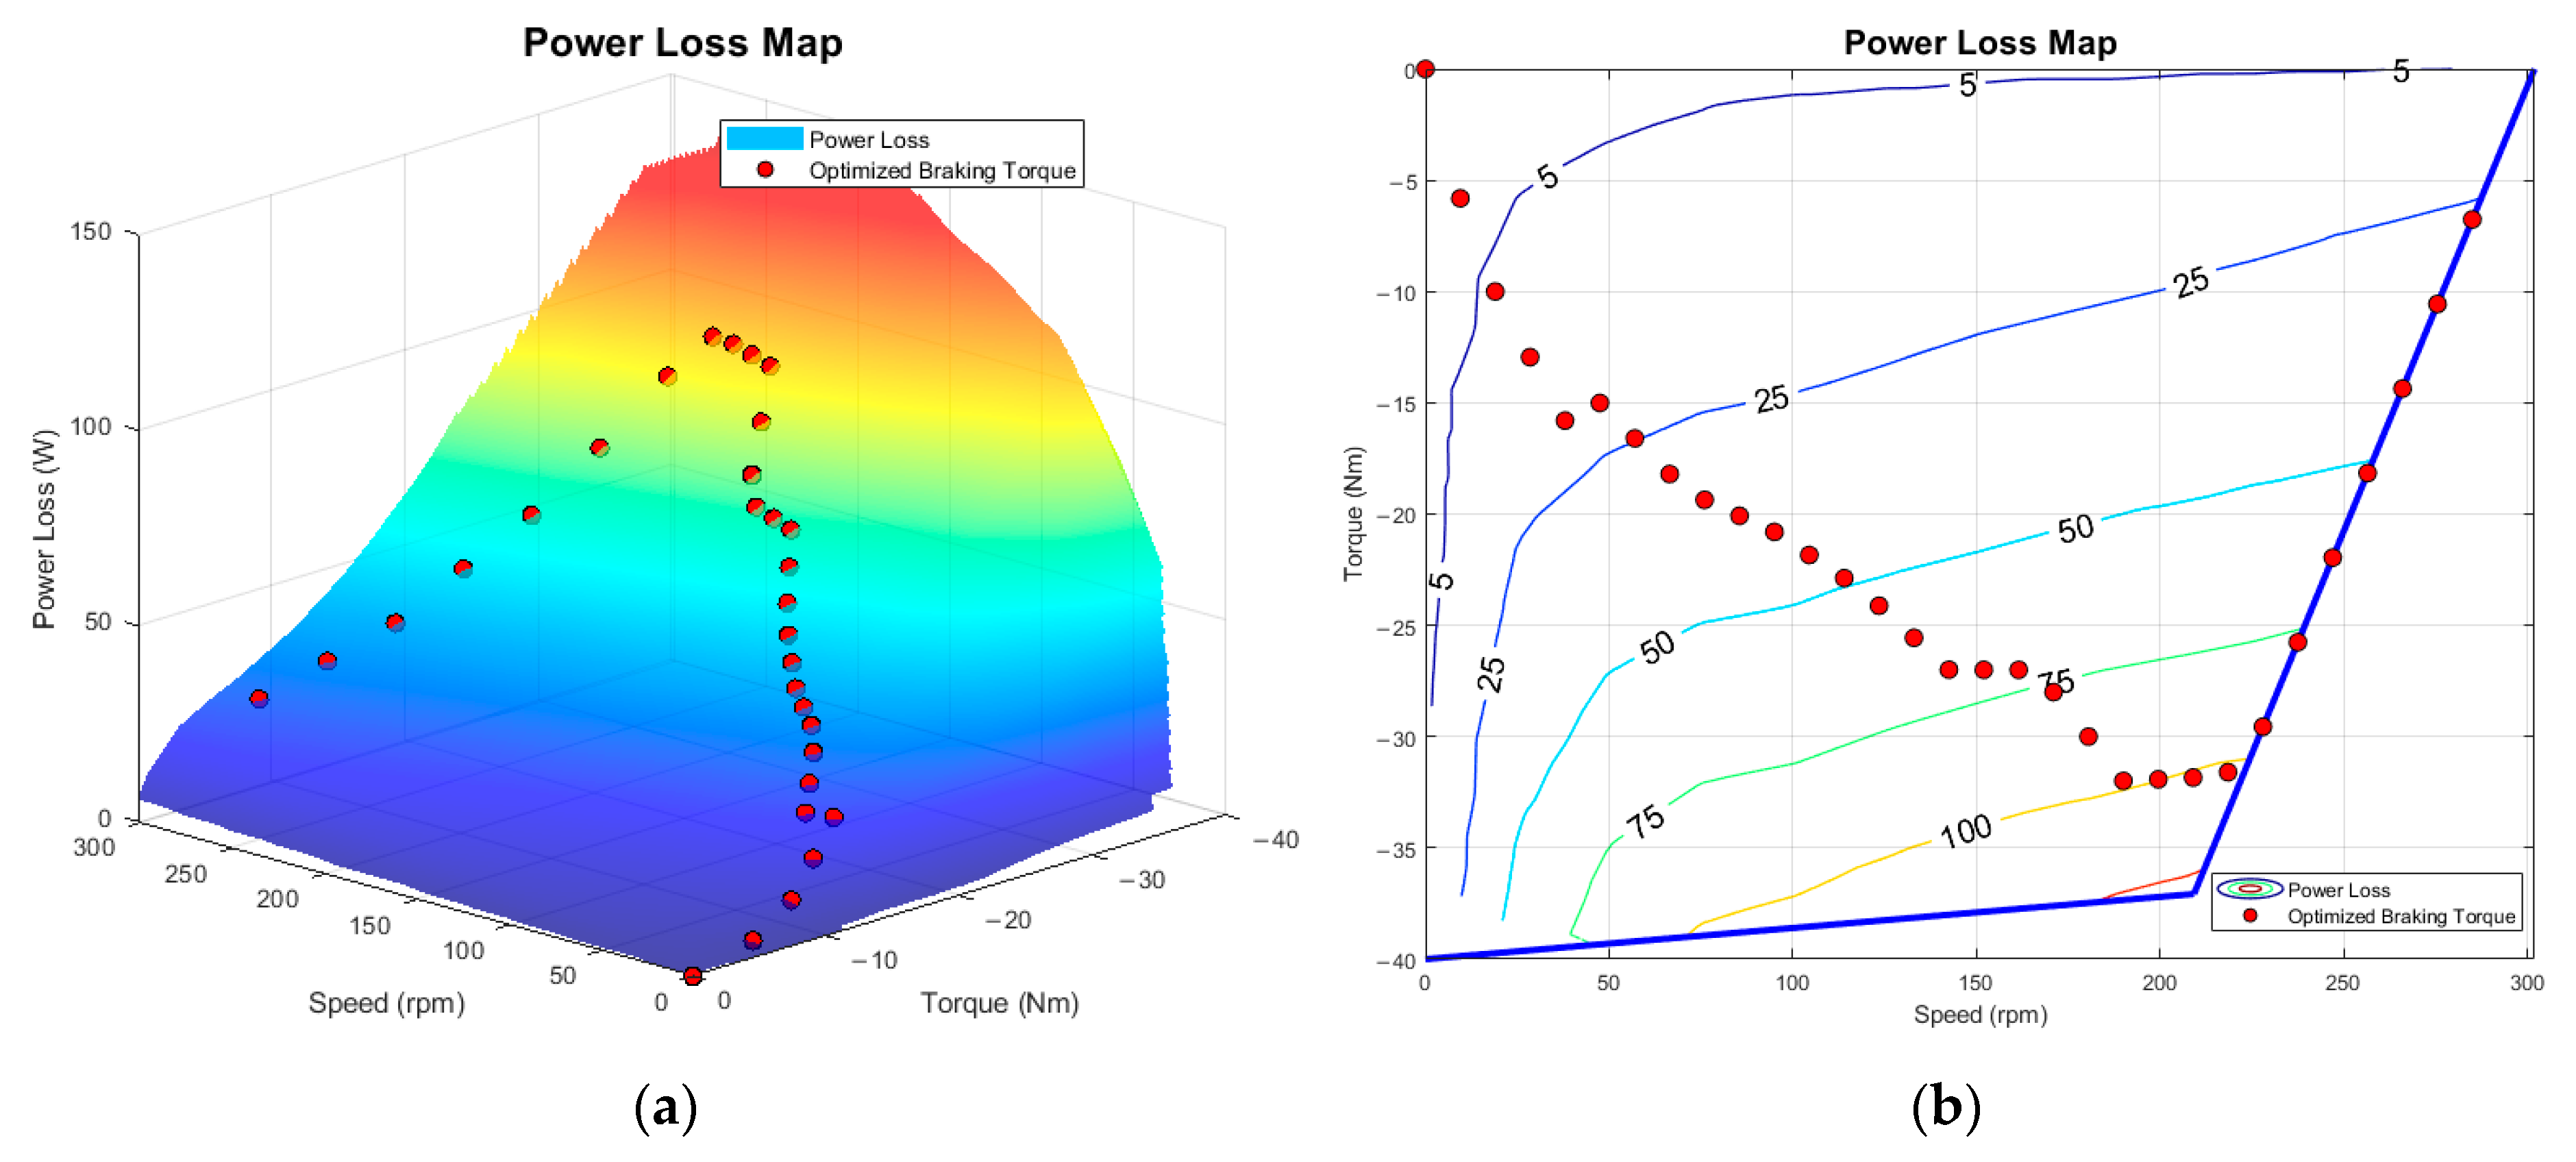
The overall efficiency of braking was calculated as the ratio of the performed mechanical work to recovered energy during regenerative braking. The actual mechanical work decreases the kinetic energy and the speed of the vehicle. It is remarkable that the recovery overall efficiency shown in
Table 2 denotes the efficiency of powertrain recovery ability during the entire process. The efficiency of the powertrain is changing depending on the vehicle operation, as expressed in Equation (12). The efficiency was calculated by considering the total mechanical and electric work of the powertrain during the entire braking process. The resulting optimized braking-torque function is demonstrated in the power-loss map (
Figure 6a) and in the contour plot (
Figure 6b) with the operation limits; the resulting torque values are indicated with red dots. It is worth noting that the horizontal trending of points follows the shape of contour levels, best visible around 100 W. It can be inferred that in this speed region, the torque changes to keep a constant lower amount of loss.
The observed trends in these results have prompted further investigation into the characteristics of the braking-torque function and the sensitivity of changes in the vehicle parameters.
5. Sensitivity Analysis of the Optimized Braking Torque
The goal in modeling with the proposed mathematical formulation was to determine the braking-torque function, which maximizes the recovered energy during regenerative braking. This function is track dependent as the time of braking and the position cannot be specified exactly. The resulting function is applicable only to the vehicle being investigated due to the vehicle parameters. If further developments are carried out on the vehicle, the determination of this function needs to be repeated, but owing to the simulation model, we can prepare for predicted changes. In this section, sensitivity analysis of the optimized braking-torque is presented with systematic changes in the vehicle parameters. In the mathematical vehicle model, the vehicle is defined by its subassemblies. The powertrain remains unchanged during the analysis, and only the surrounding vehicle components were changed virtually.
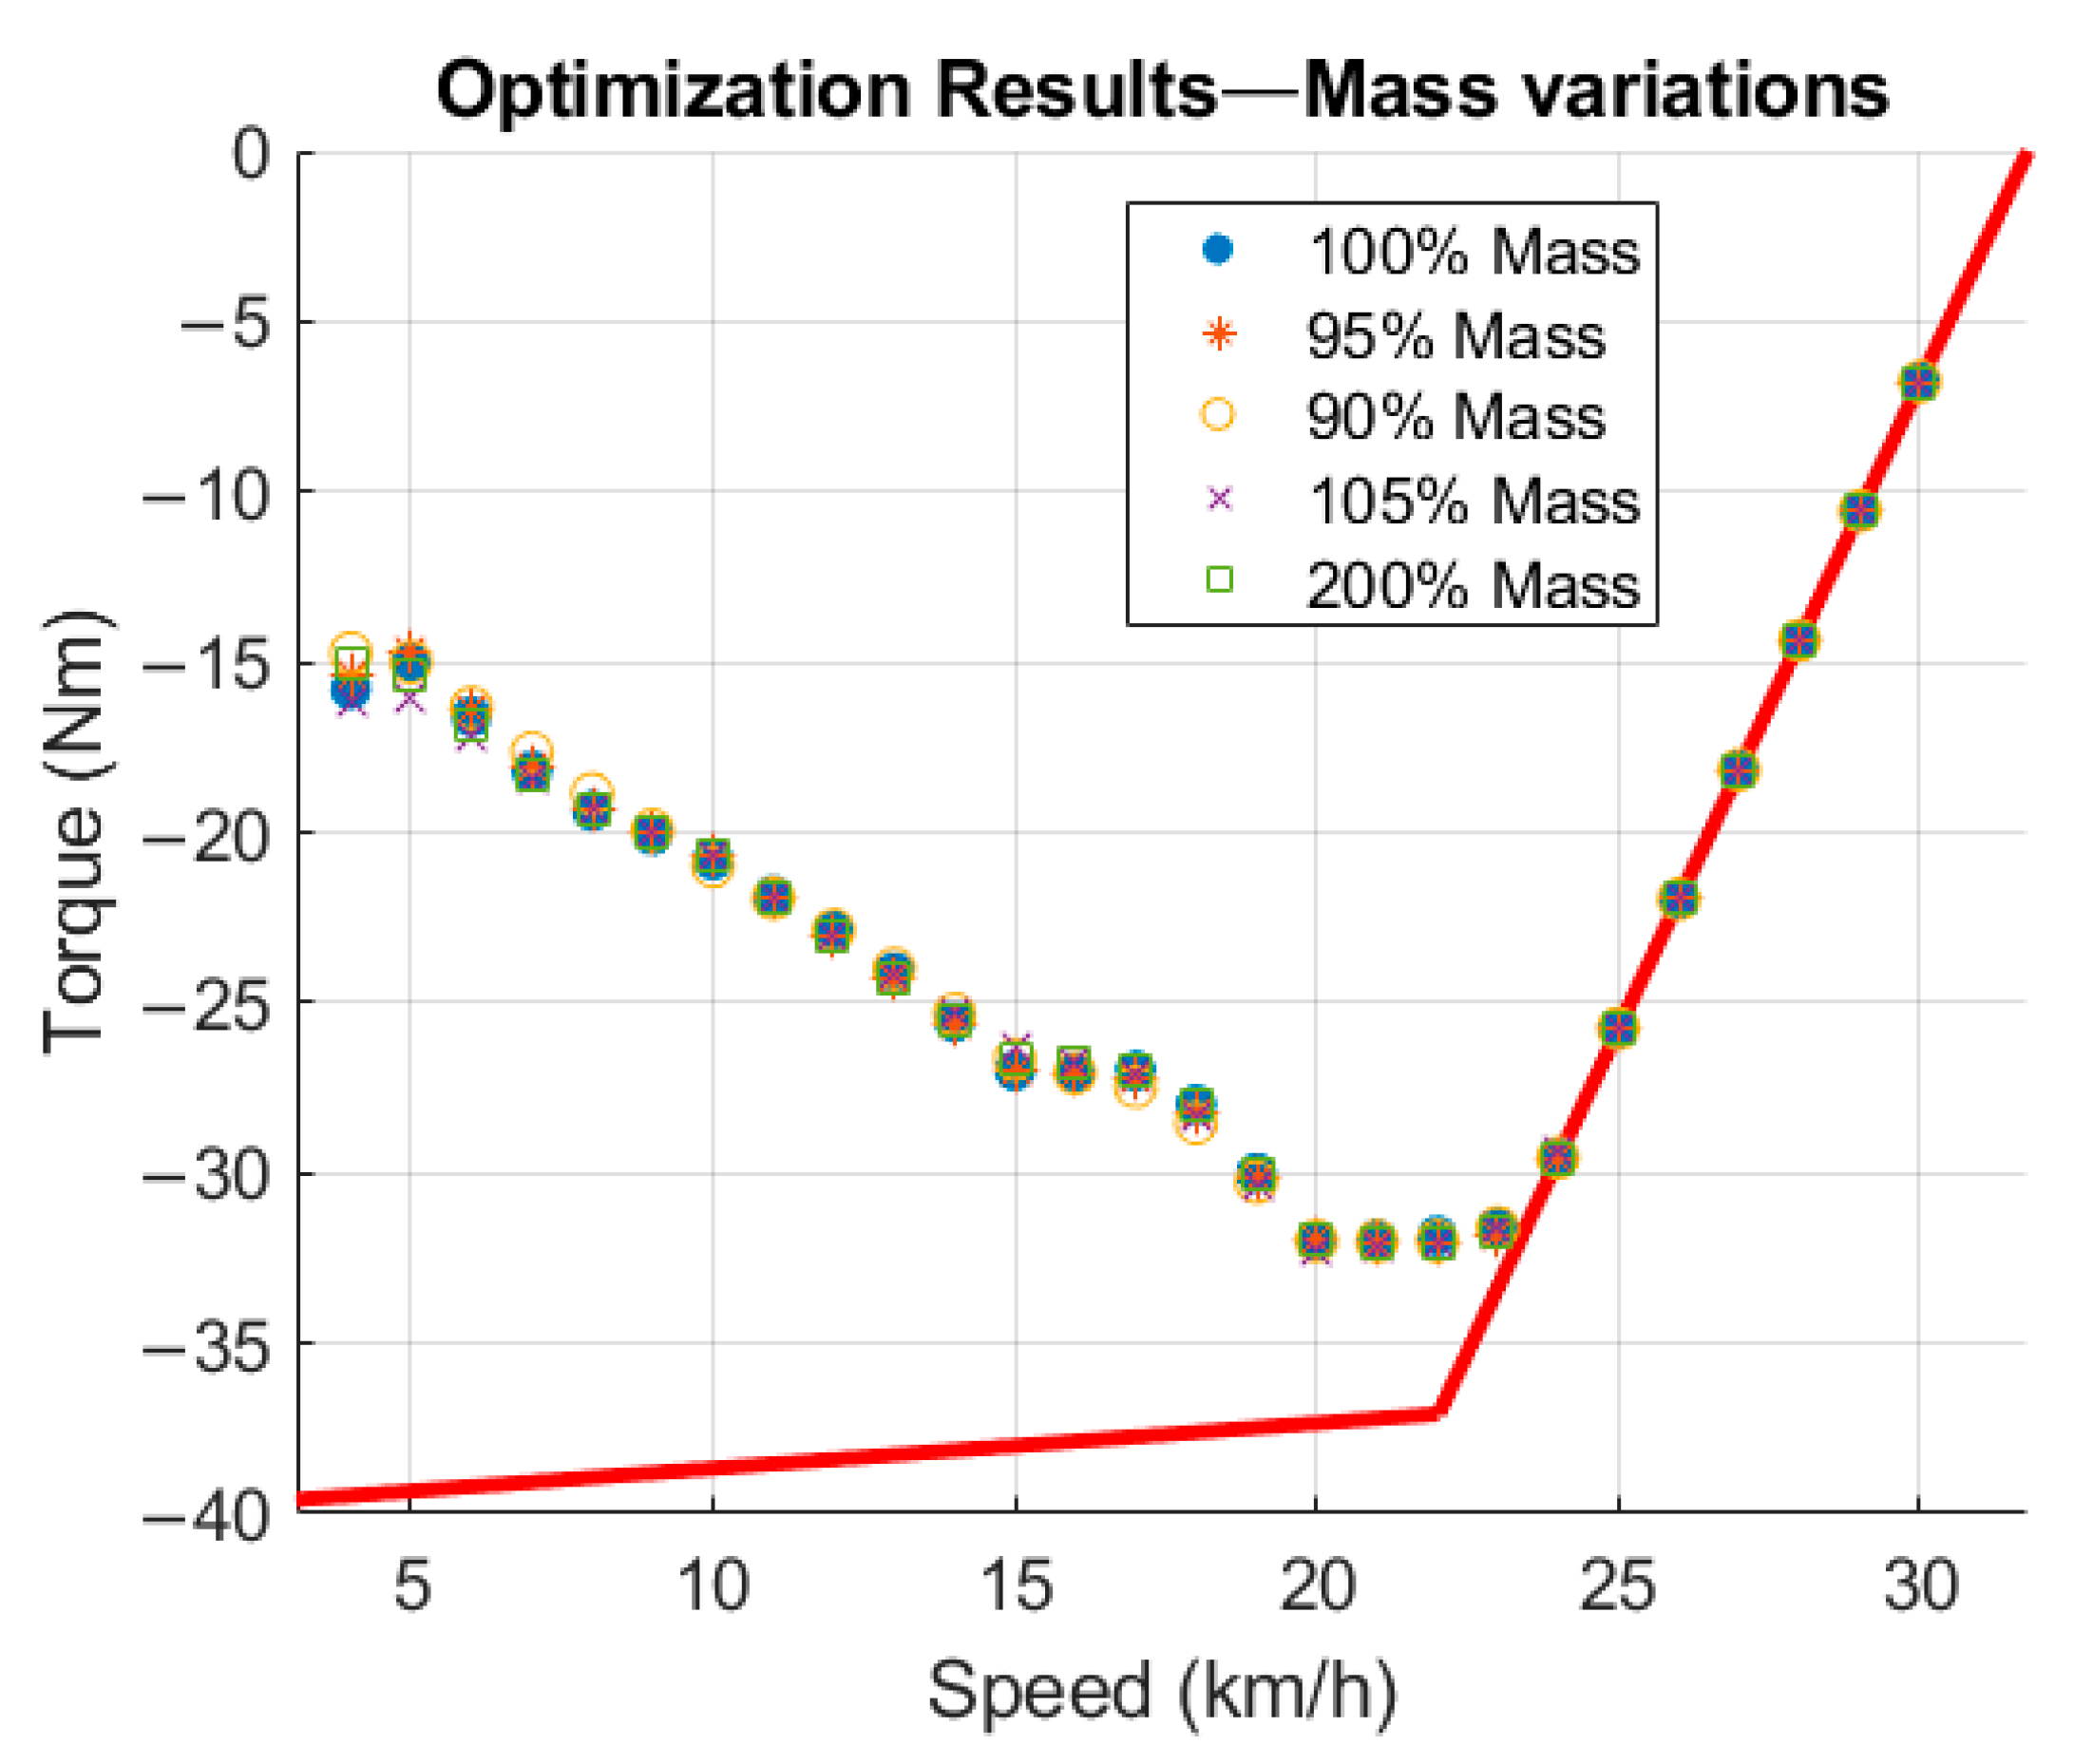
A fully different vehicle can be evaluated during optimization when these parameters are modified, as long as the drivetrain remains untouched. First, the mass parameter was changed in multiple cases. In every optimization case, three attempts were carried out with a randomized initial population, where the best attempt was chosen as the solution. The decrease in optimization attempts was reasonable due to the stability and low variance of the solution produced by the GA, which was demonstrated in the previous optimization. The optimization results of parameter variations in vehicle mass are shown in
Figure 7. The 100% mass denotes the originally created torque function.
In the case for mass variation, optimization attempts in the resulting torque values are identical to the reference optimization results. Detailed parameters are summarized in
Table 3. The recovered energy and braking distance are calculated until the vehicle reaches the threshold limit of 3 km/h, where the hydraulic brake needs to be applied. The powertrain operates with 84% efficiency in all cases considered. The GA needs at least 70 iterations to find a feasible solution. In case 5, the powertrain is clearly undersized, which can be seen from the braking distance value, but it is worth pointing out that the optimized torque function remains identical even with that significant change in mass.
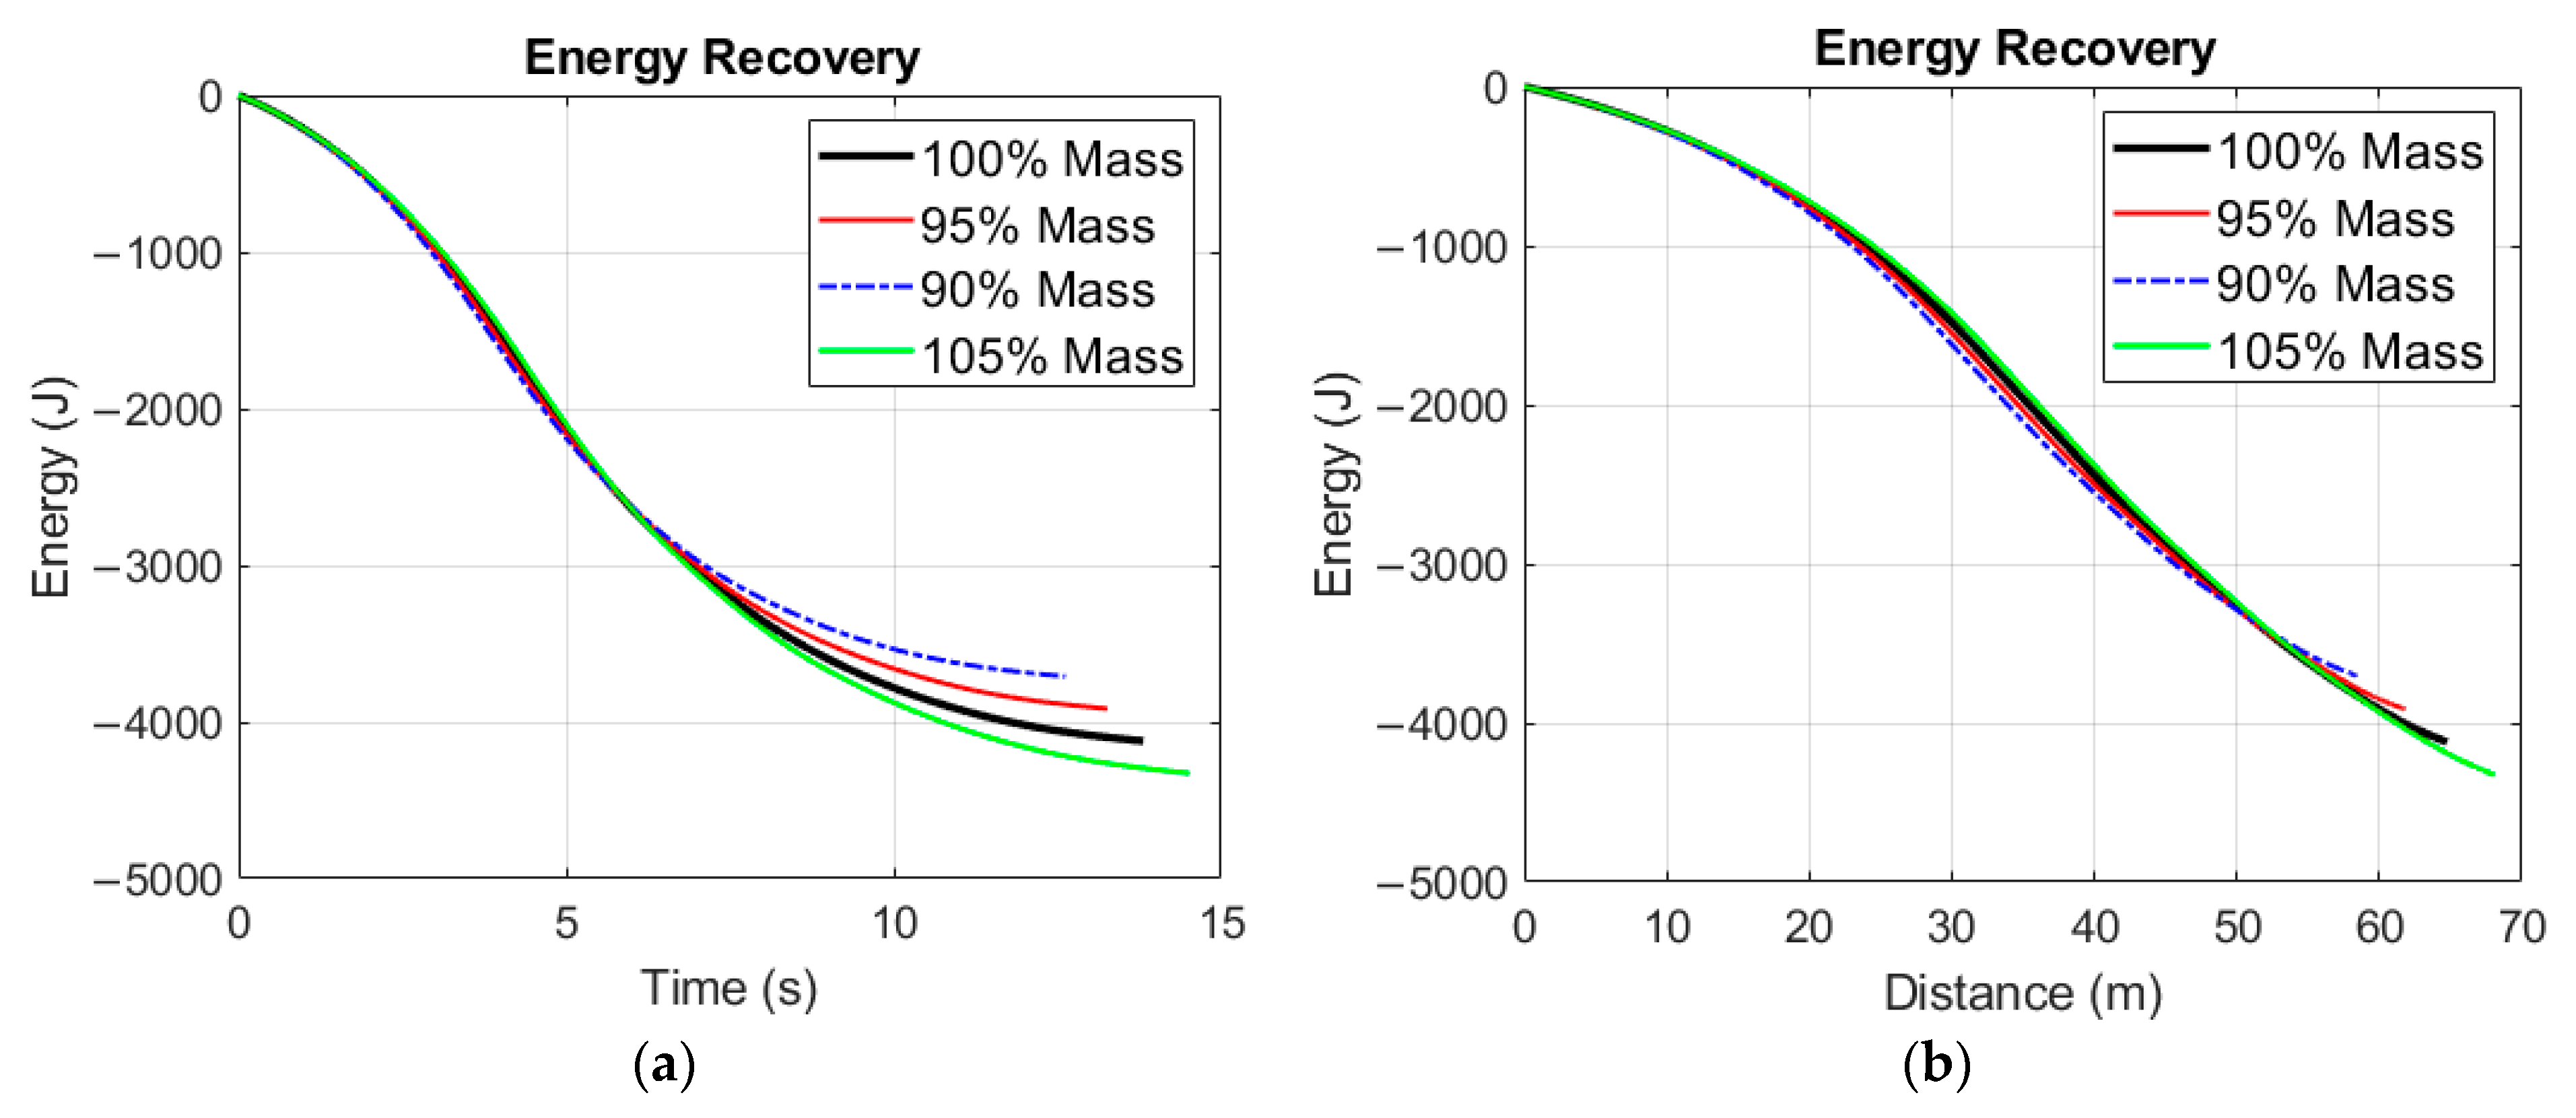
The recovered energy as a function of time is displayed in
Figure 8a, and as a function of traveled distance in
Figure 8b. Owing to the significant difference in recovered energy, case 5 of mass variation is not displayed in
Figure 8.
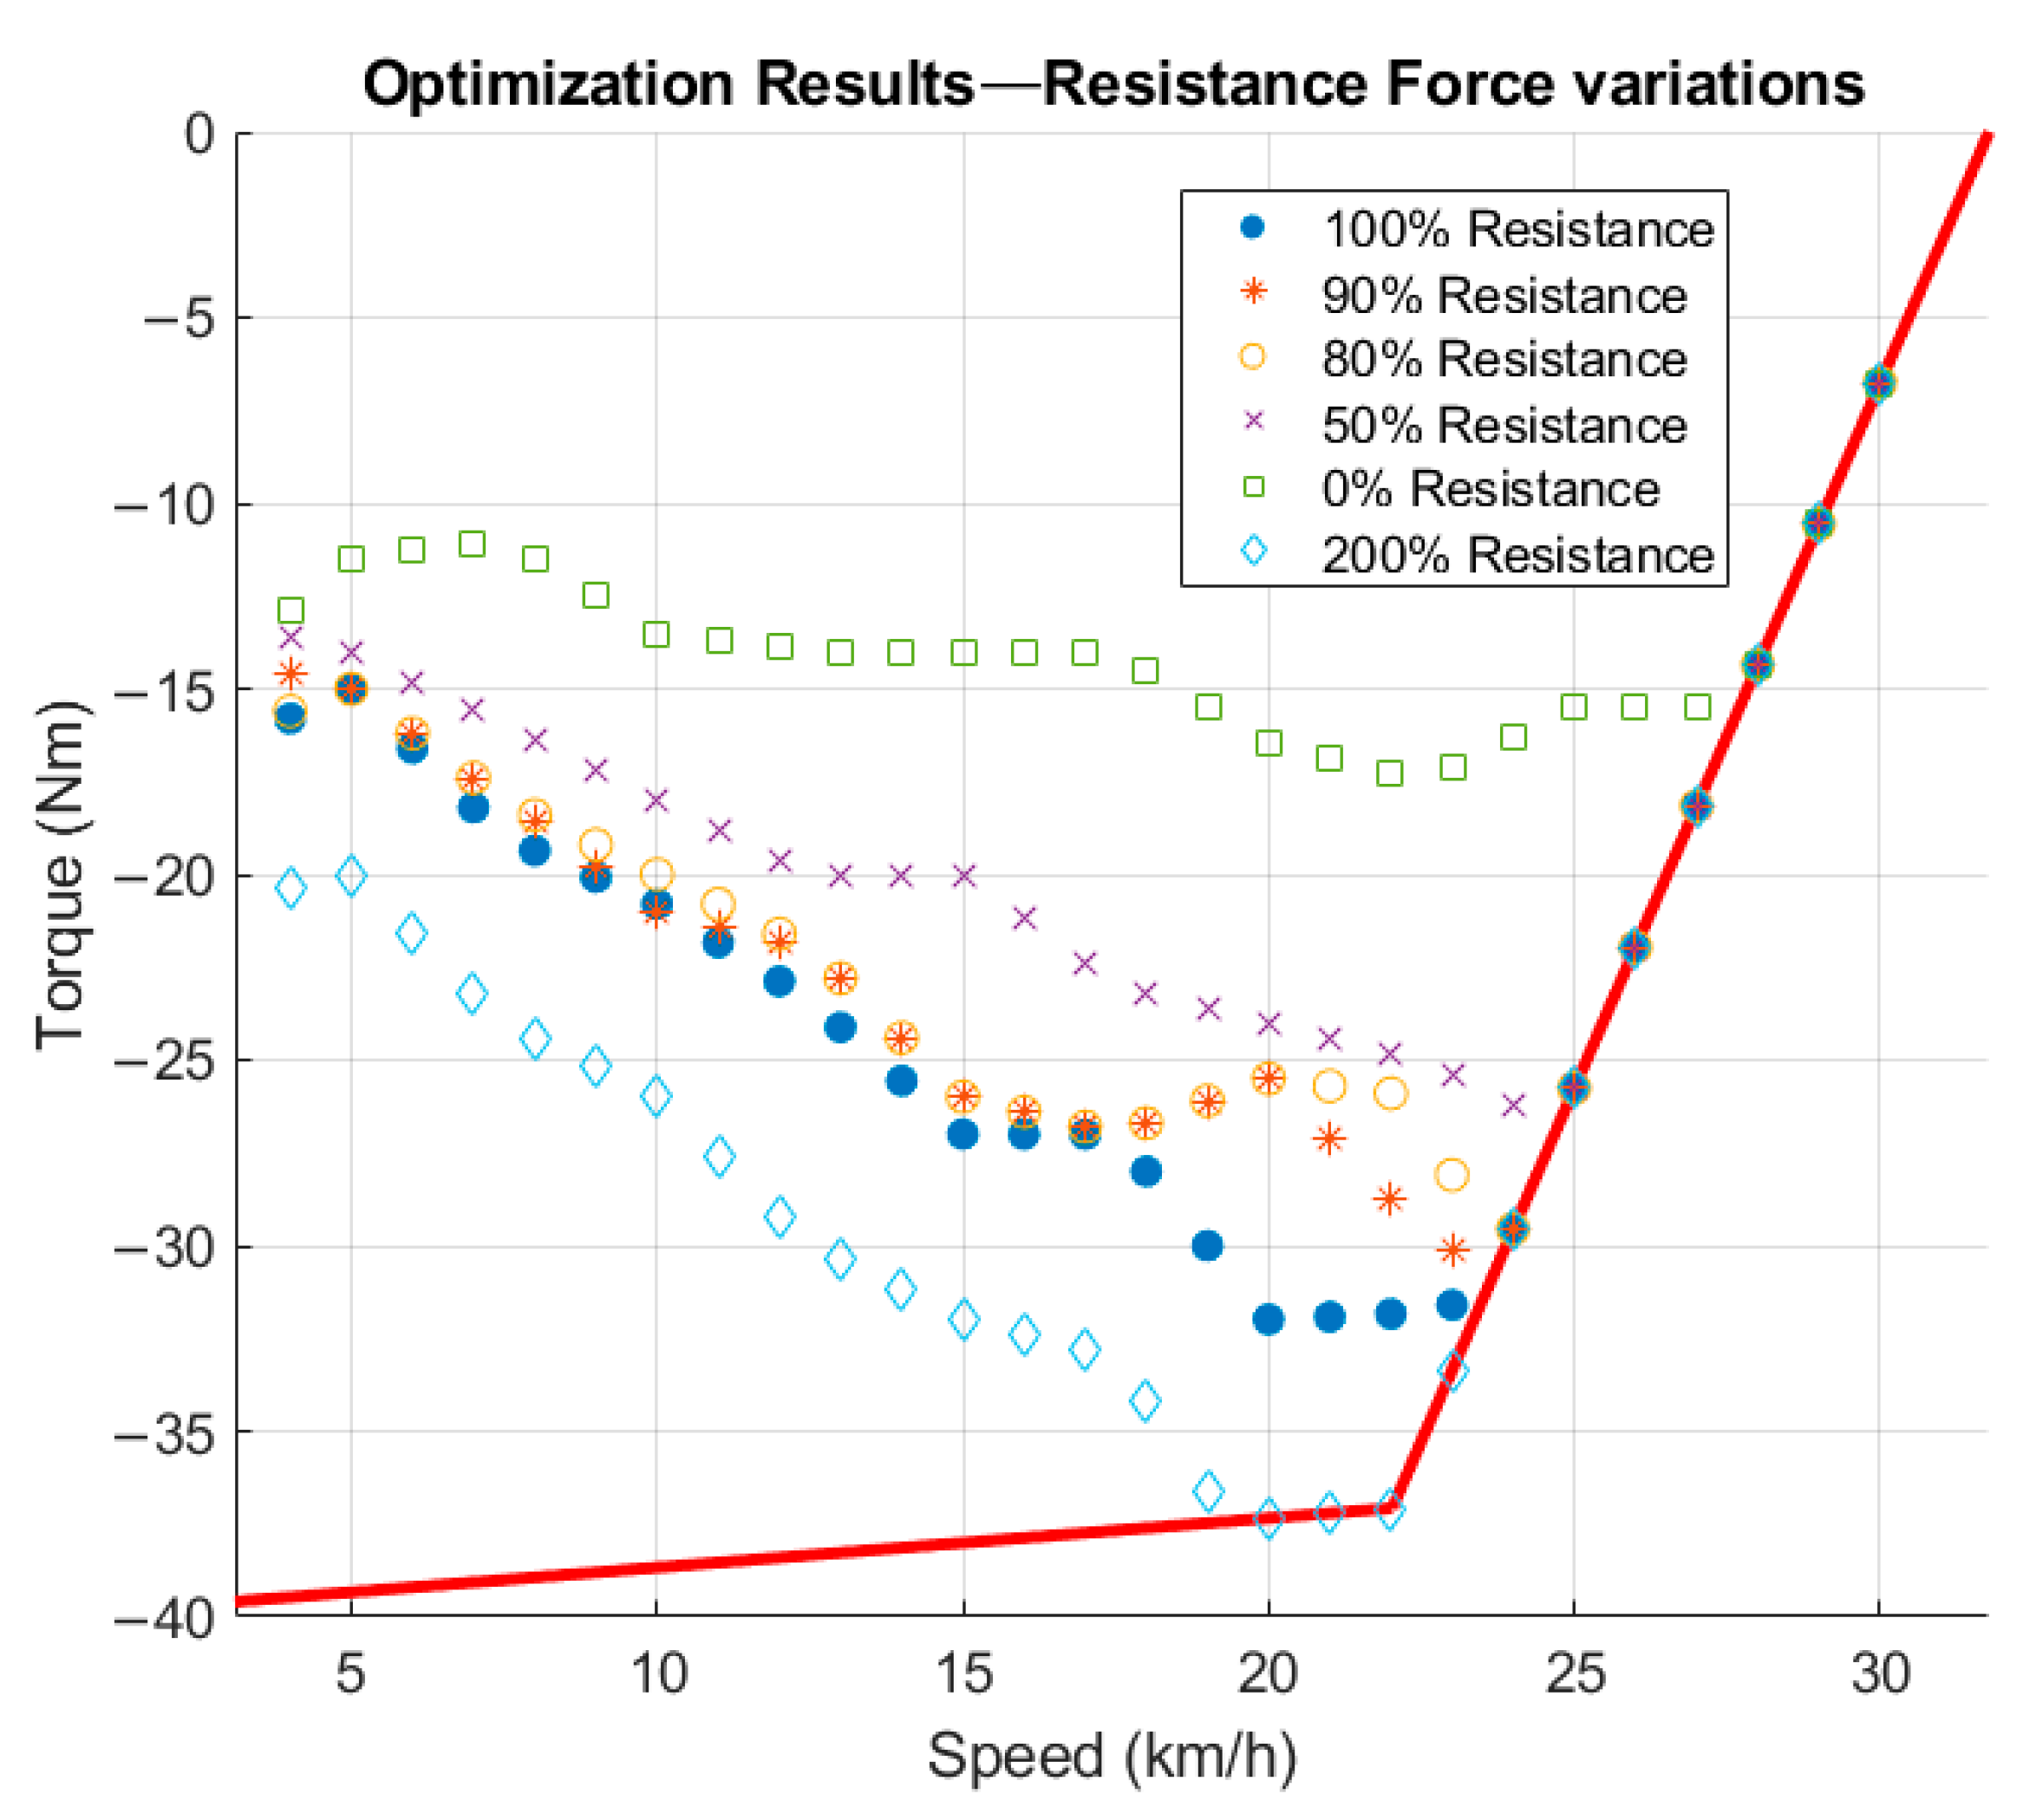
The results are significantly different in the case for resistance force modification. All optimization options remained the same as in the case for mass variation. In the first two attempts, the resistance force was constantly decreased, thus emulating the behavior of a more efficient vehicle. In case 5, the resistance force was eliminated to observe the trend in the resulting torque function; this scenario is only feasible in a simulation environment.
Figure 9 shows the optimization results for parameter variations in resistance force.
The changes in the braking-torque function and the trend are clearly visible in
Figure 9. Required braking force increases as the resistance force is set higher. In lower resistance force scenarios, recovered energy increases, and the optimization finds lower torque values with higher powertrain efficiency more beneficial than in reference case 1. The braking also takes more distance as the resistance force decreases. The theoretical maximum efficiency of the powertrain is 85.6% during the entire braking process according to case 5. Significantly higher resistance force (case 6) does not affect the recovered energy as drastically as in the case for mass changes.
Table 4 summarizes the results of the test.
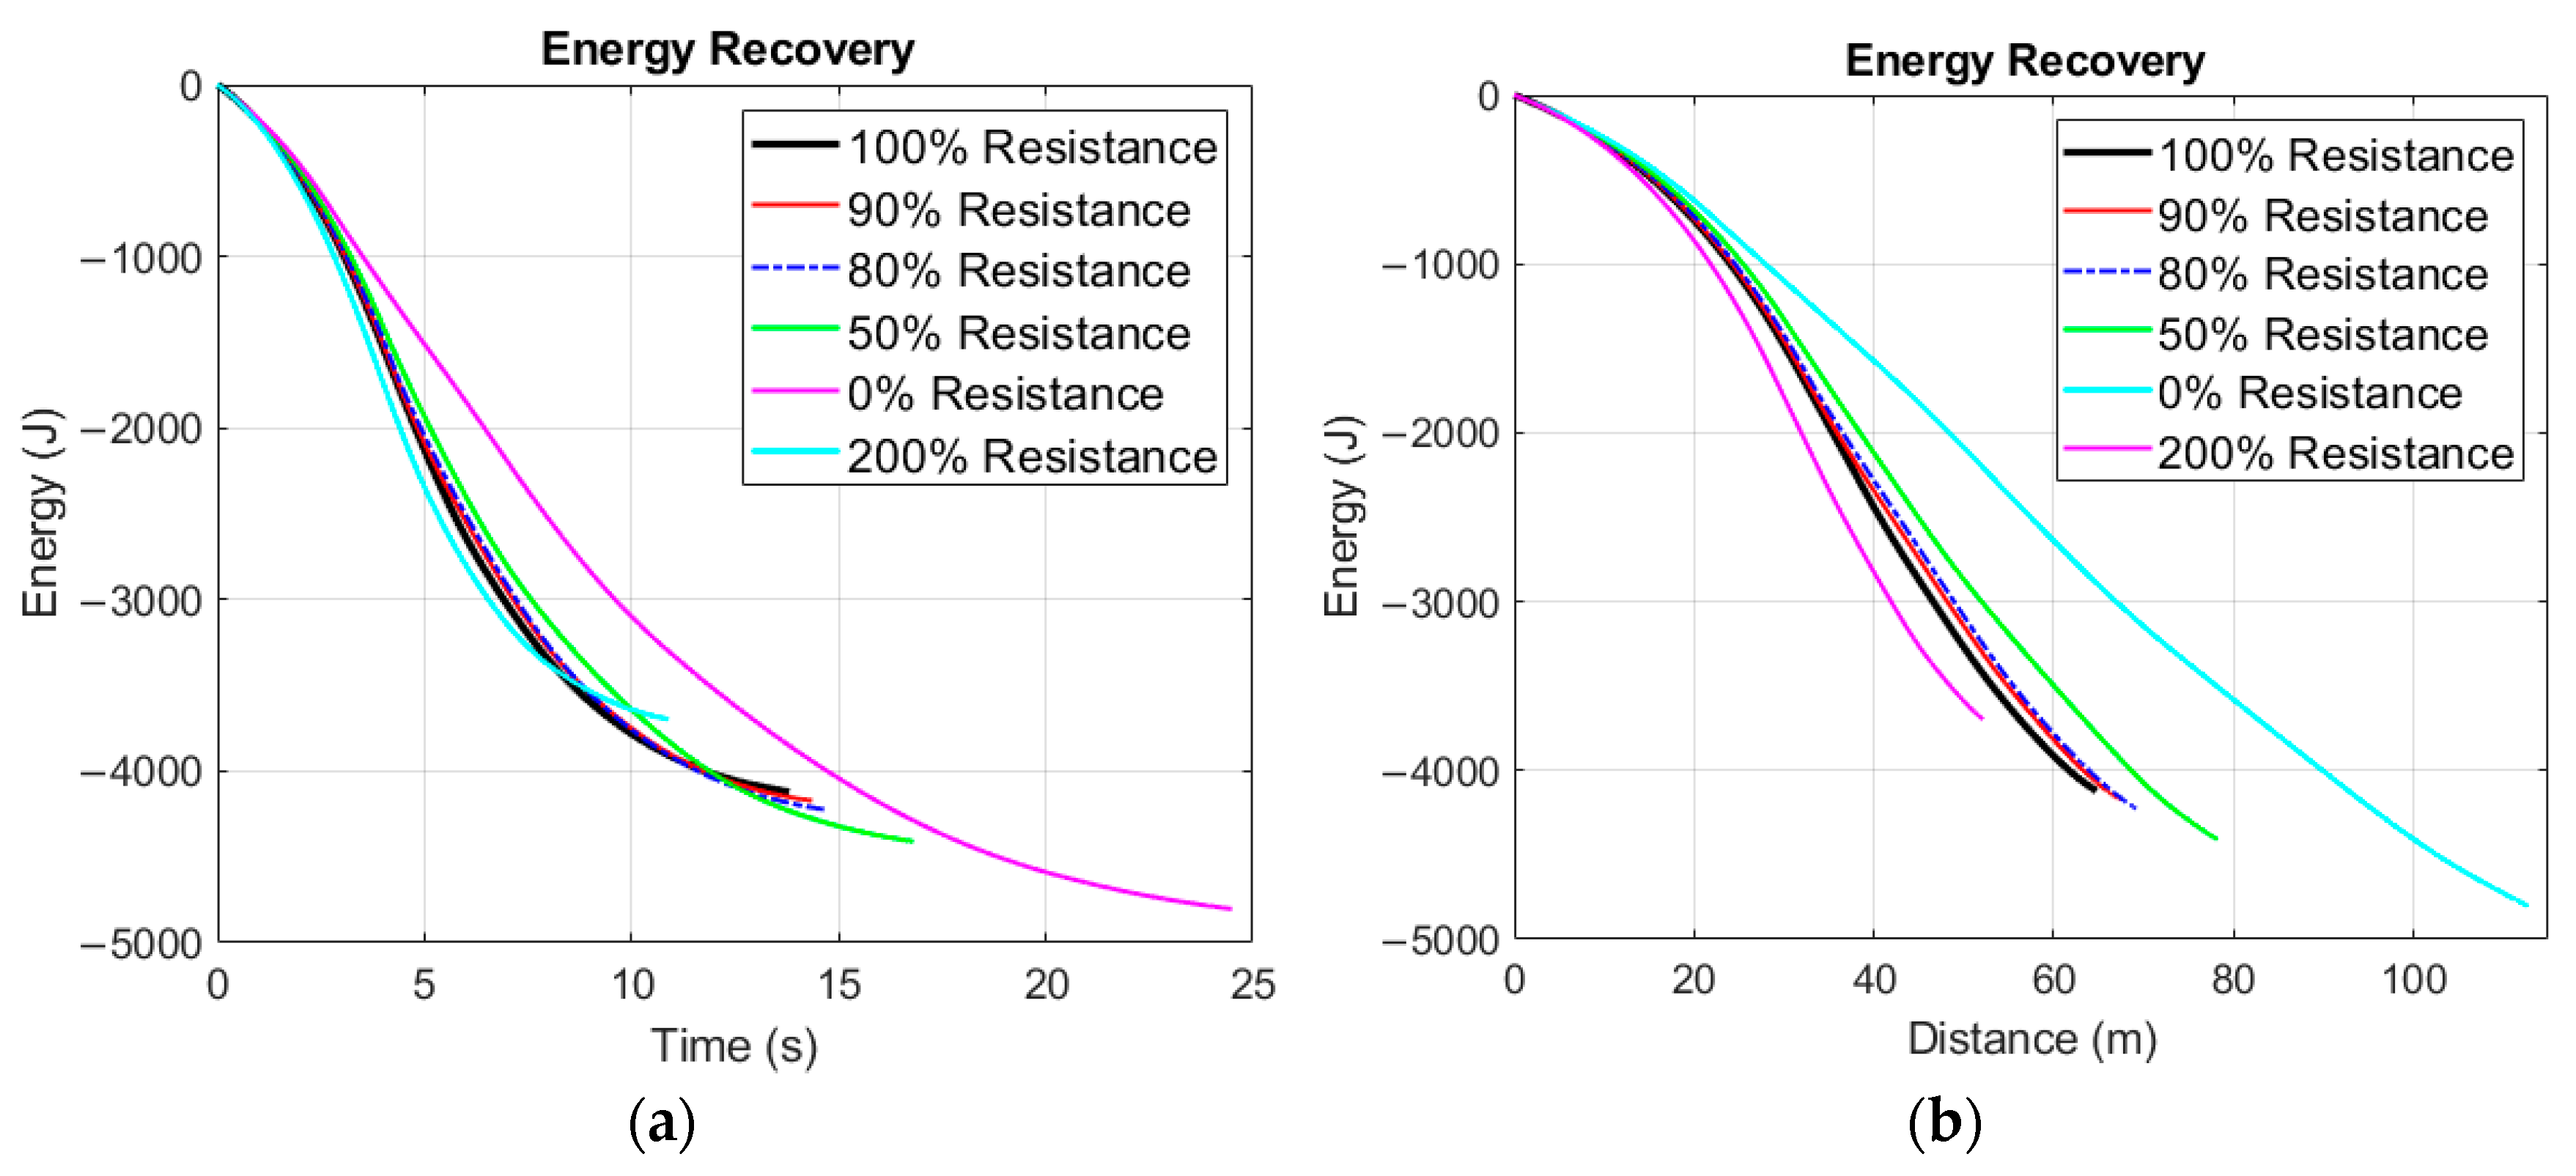
Energy recovery is presented as a function of time (
Figure 10a) and as a function of distance (
Figure 10b) in various optimization attempts. The decreasing resistance force leaves time to utilize more kinetic energy in the higher efficiency ranges of the powertrain. The combined effects of these are the increasing time and distance during regenerative braking.
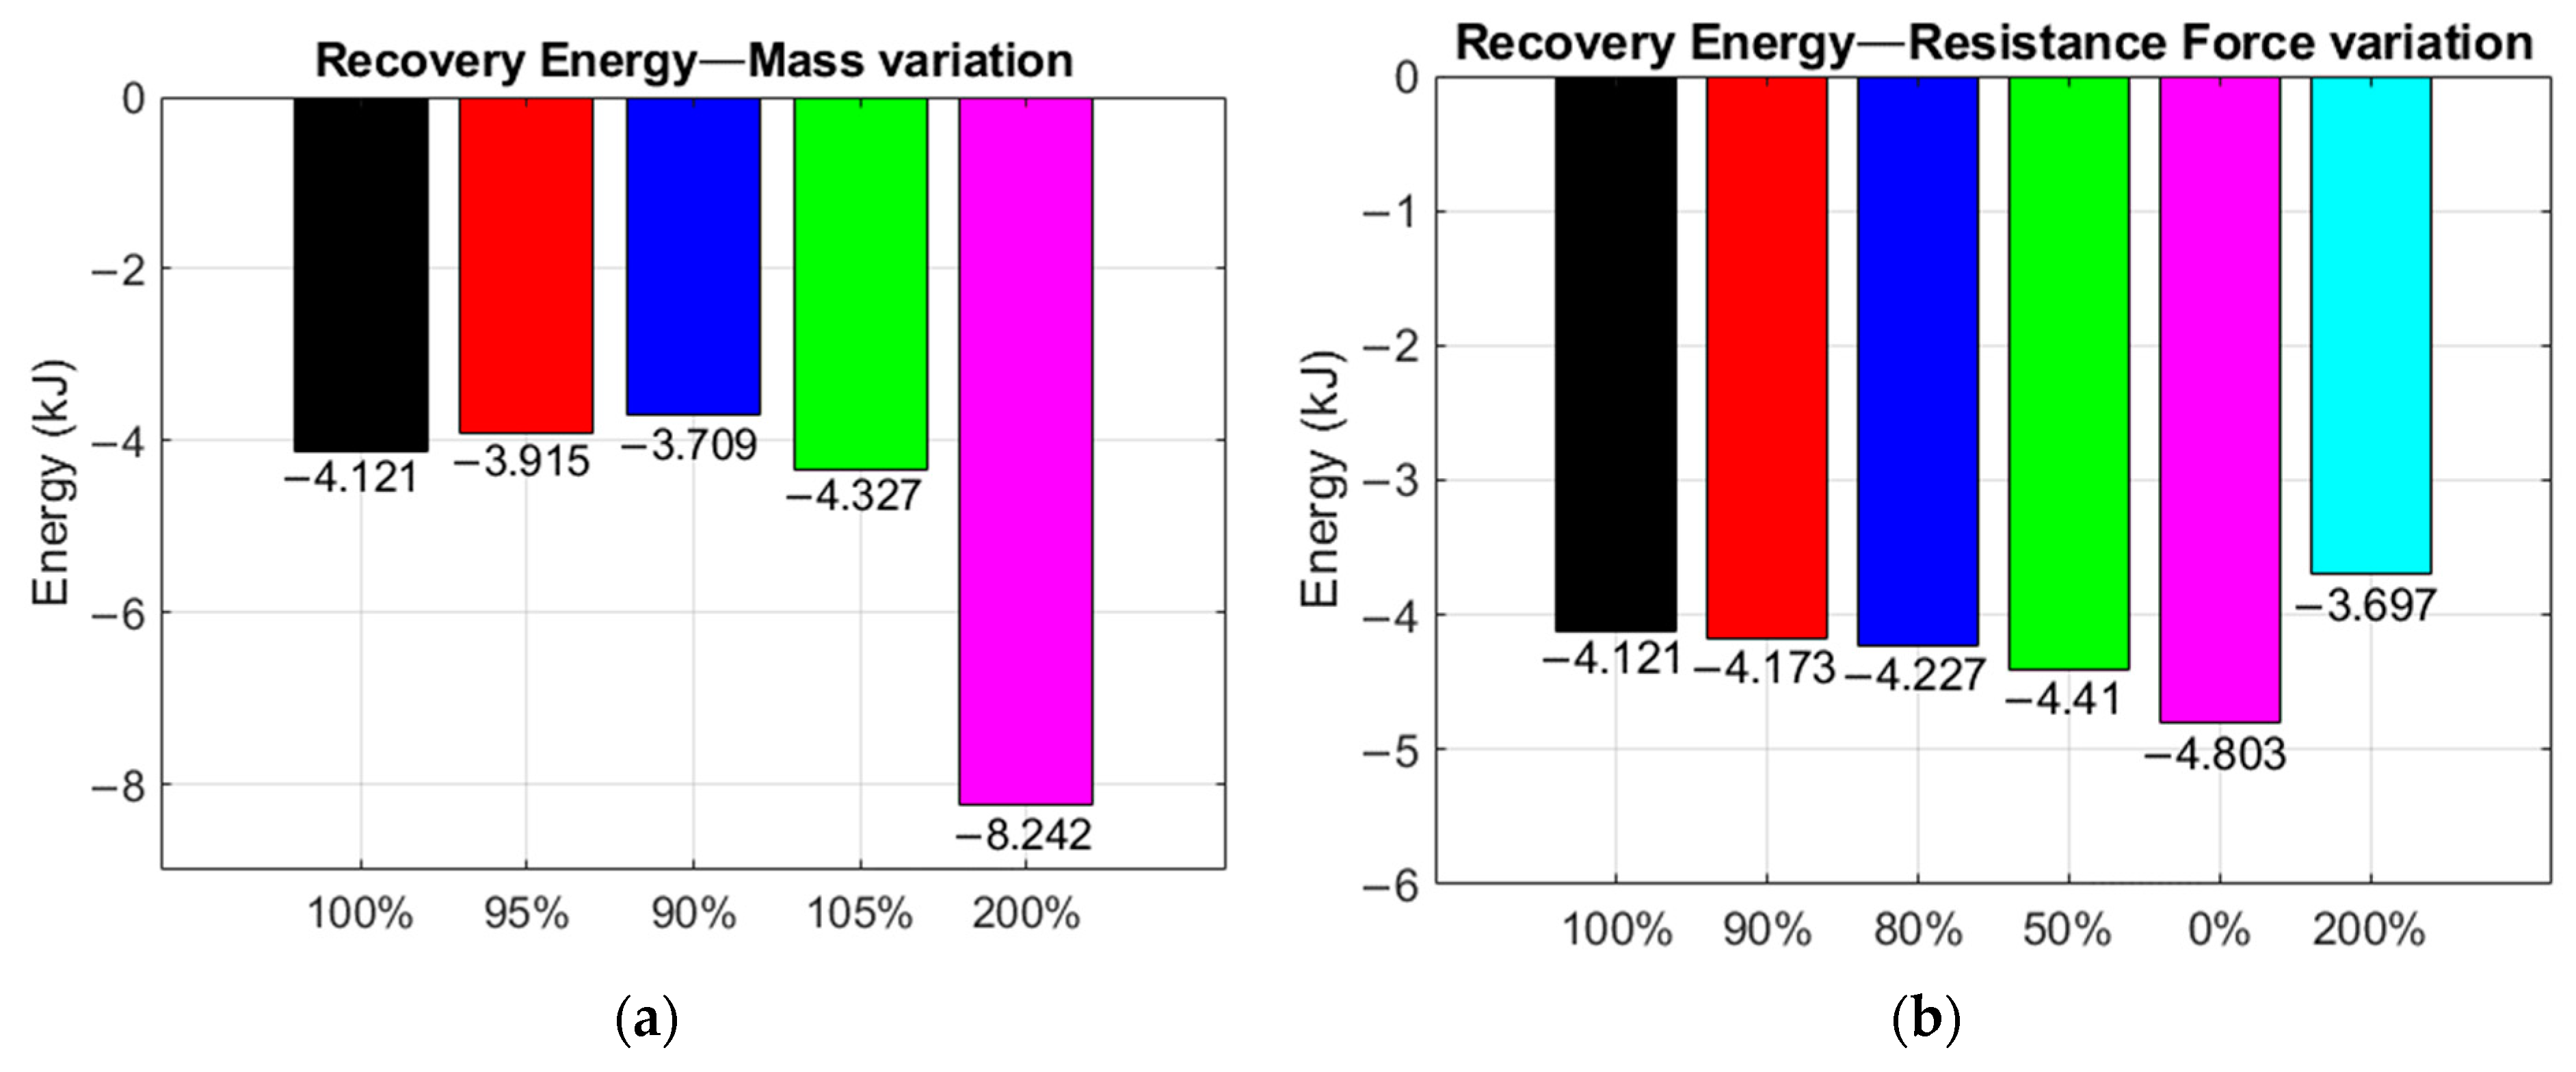
The summarized recovered energy values are displayed in a bar chart to illustrate the effect of changes in mass (
Figure 11a) and resistance force (
Figure 11b). The recovered kinetic energy increases with vehicle mass, but if the drivetrain is undersized, like in this case, braking takes a very long time even for an experimental race vehicle, such as the SZEmission.
6. Driving Strategy Optimization with Regenerative Braking
The derived braking-torque function can be directly used in complete driving strategy optimization based on the vehicle model presented. Since the motor controller can send any form of torque reference, only the modification of this reference is required. The starting block of the vehicle model is a simple logical switch, which decides whether the motor control command means tractive torque (
) or braking torque (
). In the case for traction, the maximum available torque is applied, which is decided in the powertrain model. During braking, the appropriate braking-torque value is provided based on the optimized function. According to the sensitivity analysis, the energy-optimal braking-torque function is not needed to be modified when the vehicle mass changes. The extended vehicle model can include the energy recovery from braking, which means that the total energy consumption of the vehicle can be calculated according to Equation (18). The driving strategy is divided into two parts, based on whether drive or braking is active. The detailed calculation of total energy is shown in Equation (19).
A genetic algorithm was also used for the complete driving strategy optimization. The goal of optimization to achieve the minimum energy consumption with the corresponding objective function and optimization constraints defined in Equation (20). The time needs to be handled separately and the optimization can also change the duration of each part. The only remaining issue is the timing of braking and the starting speed of it, as the torque function provides dedicated torque and speed values.
The number of optimization variables (
) is calculated from the track length according to Equation (21) and it decomposes the track distance into elements, thus forming the s distance vector, as shown in Equation (22). A vector interval of 10 m was chosen for practical reasons.
The optimization vector is described in Equation (23), which consists of the previously determined s distance vector and the z vector, which is the optimization. The distance vector remains constant during the optimization; only the corresponding z vector is searched.
The optimization variable, z can take three values according to Equation (24). The three possible driving states are braking, coasting, and acceleration.
This method is suitable to determine the timing of acceleration, coasting, and braking on the given track without any preliminary investigation. The acceleration part can be detailed further by determining exact torque values during acceleration, as it was done in Ref. [
18], but in this study the main emphasis is placed on the application of regenerative braking as a novelty compared to the existing model.
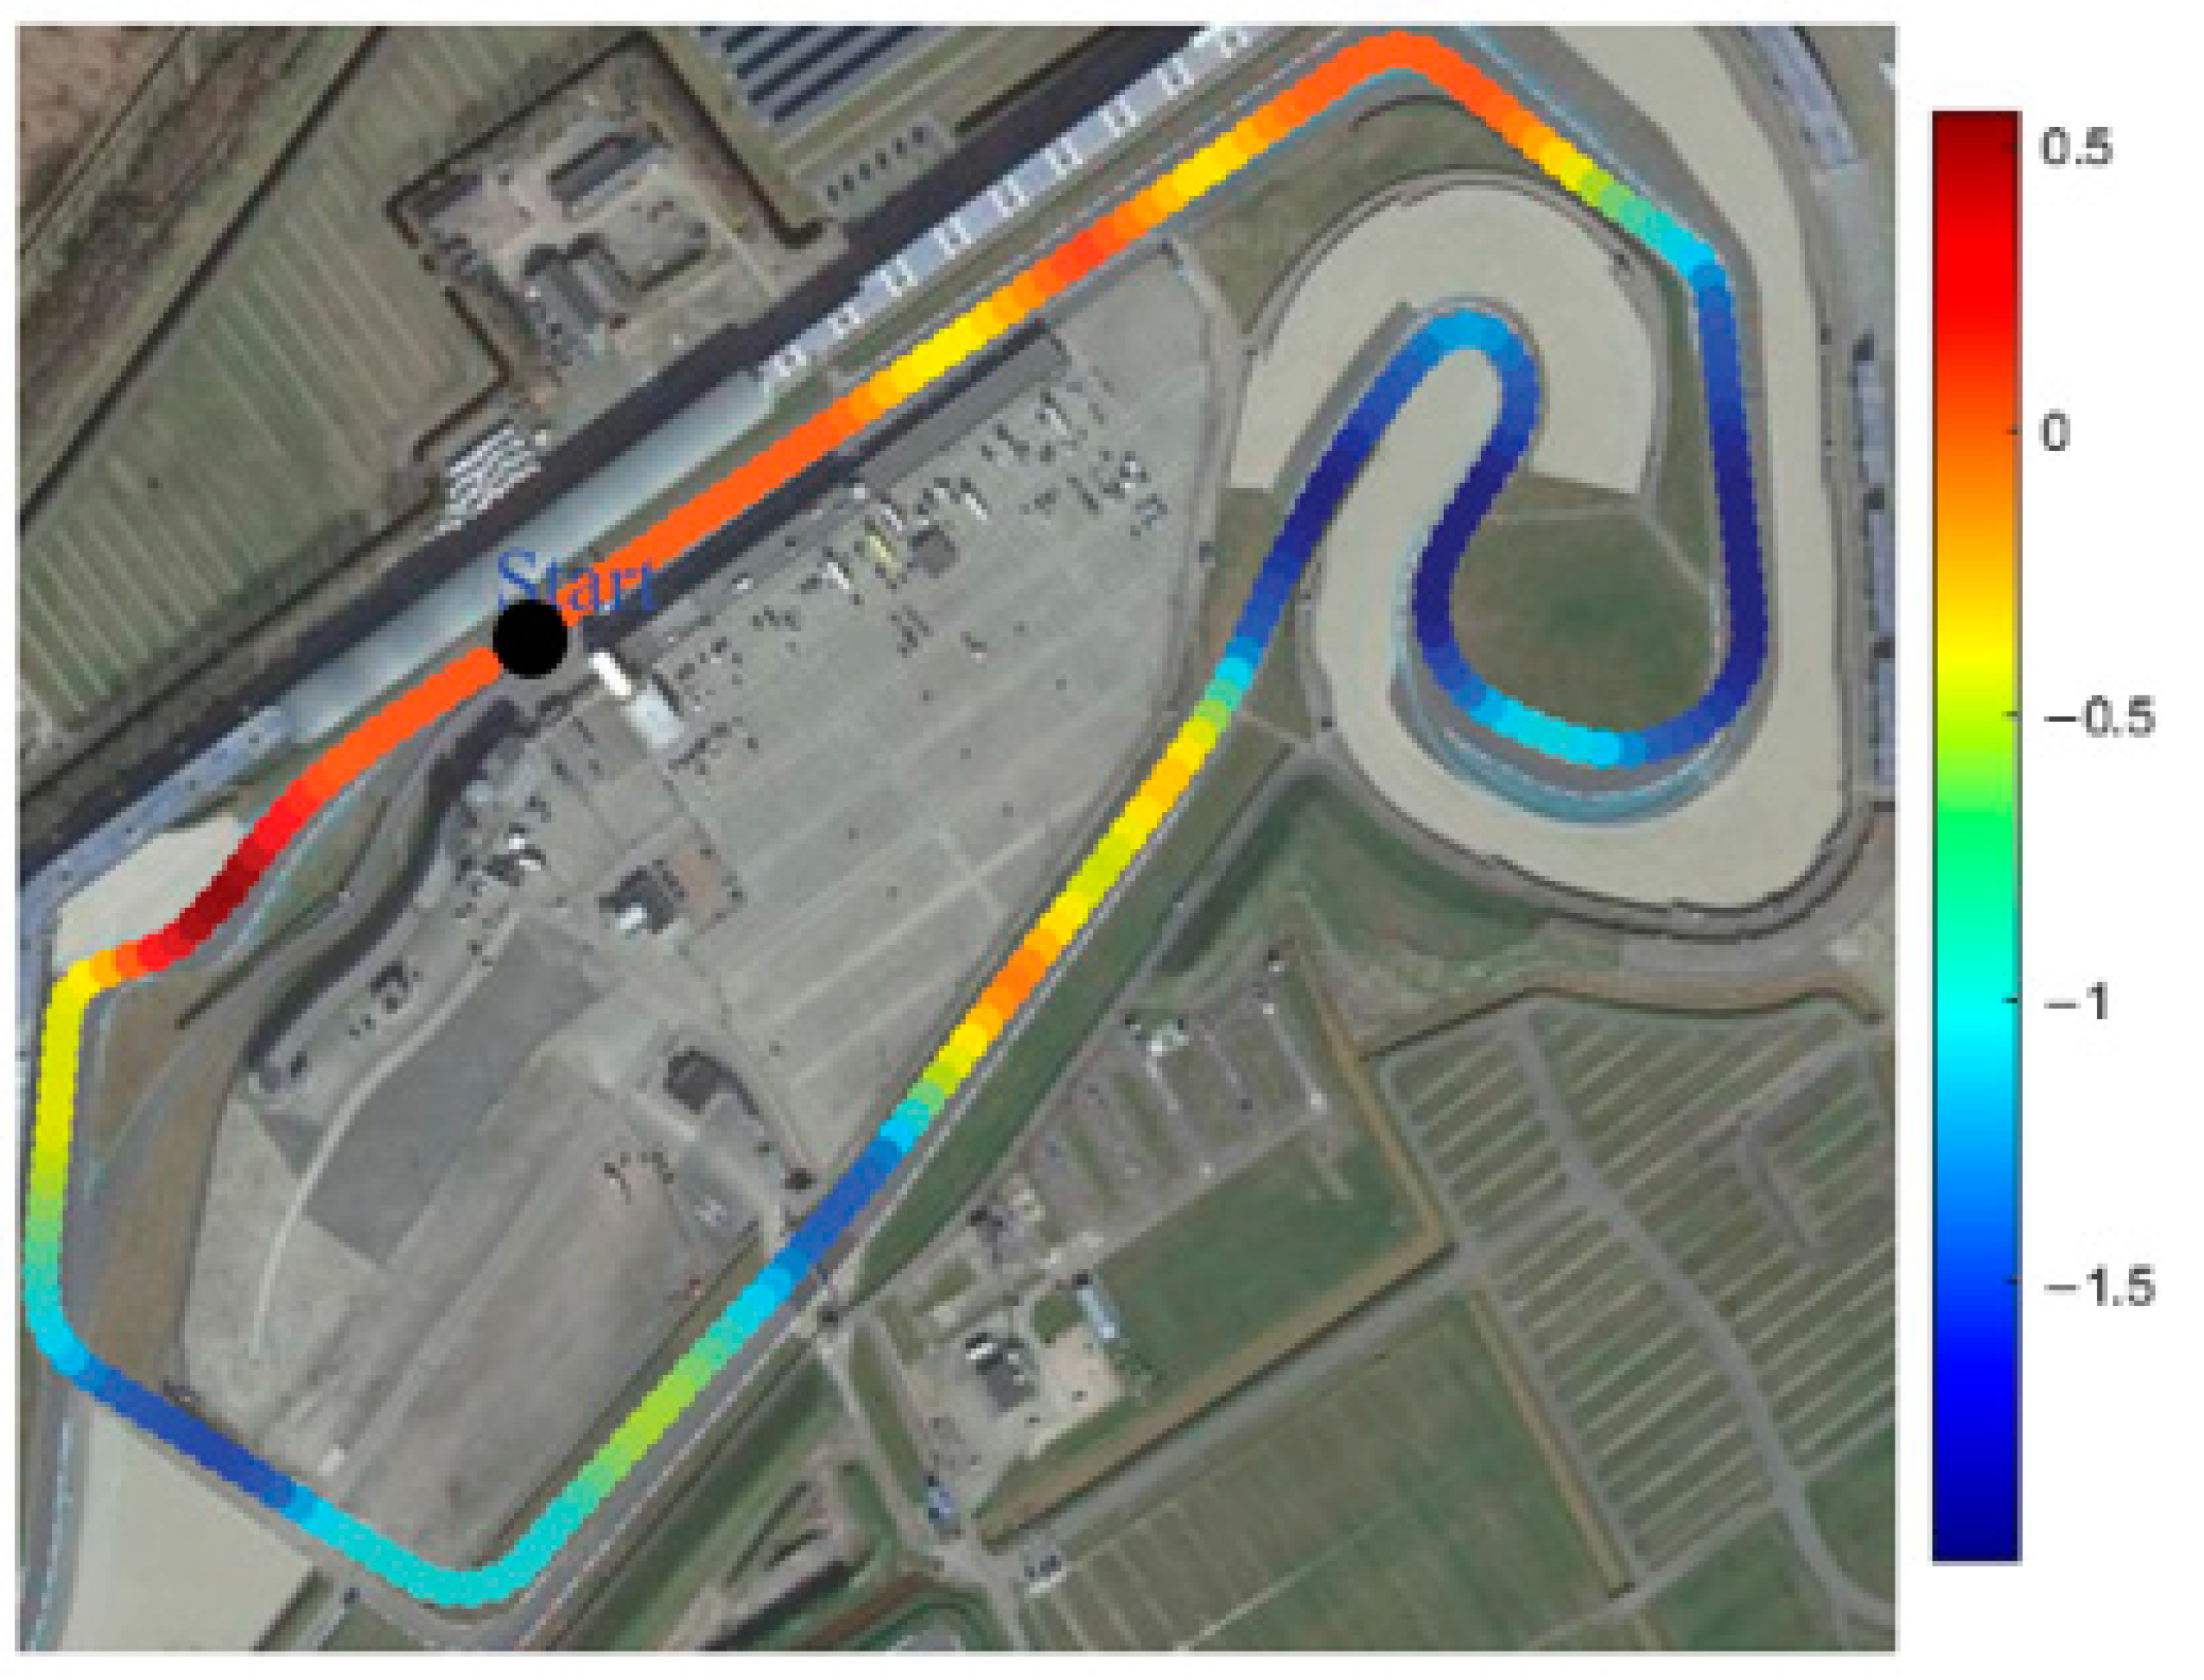
Driving strategy optimization was carried out on TT Circuit Assen, which hosted the 2022 SEM. This is the most recent SEM track, where the investigated vehicle set the track record and achieved first place in the category. Since supplementary charging when using solar cells has been prohibited, the results can also be regarded as a world record for this vehicle category. This achievement was supported by driving strategy optimization, but it was carried out without the practical or simulated use of regenerative braking. The track length in the optimization was 2312 m and one lap was assumed to be taken under 342 s. Track data were collected from publicly available online maps and were further improved by the physical experience of the track walk at SEM 2022. The elevation of the track is visualized on the topographical map (
Figure 12) image acquired from Ref. [
23]. The color bar at the side denotes the changes in elevation [m]. The topography of Assen was suitable for record breaking as it has a very low slope in full range.
Optimization attempts were performed according to Equations (20)–(24). The number of optimization variables (
) was 232, while the initial population of GA was 580, and at least 100 generations were created in each optimization case. Upper and lower boundaries were set, as indicated in Equation (25), to force the optimization to accelerate at the beginning and to stop at the end of the track. The timing of braking is fully determined by the optimization boundary, which is made to avoid braking in the middle of the track; as the individuals of GA are randomized, this can be an actual scenario.
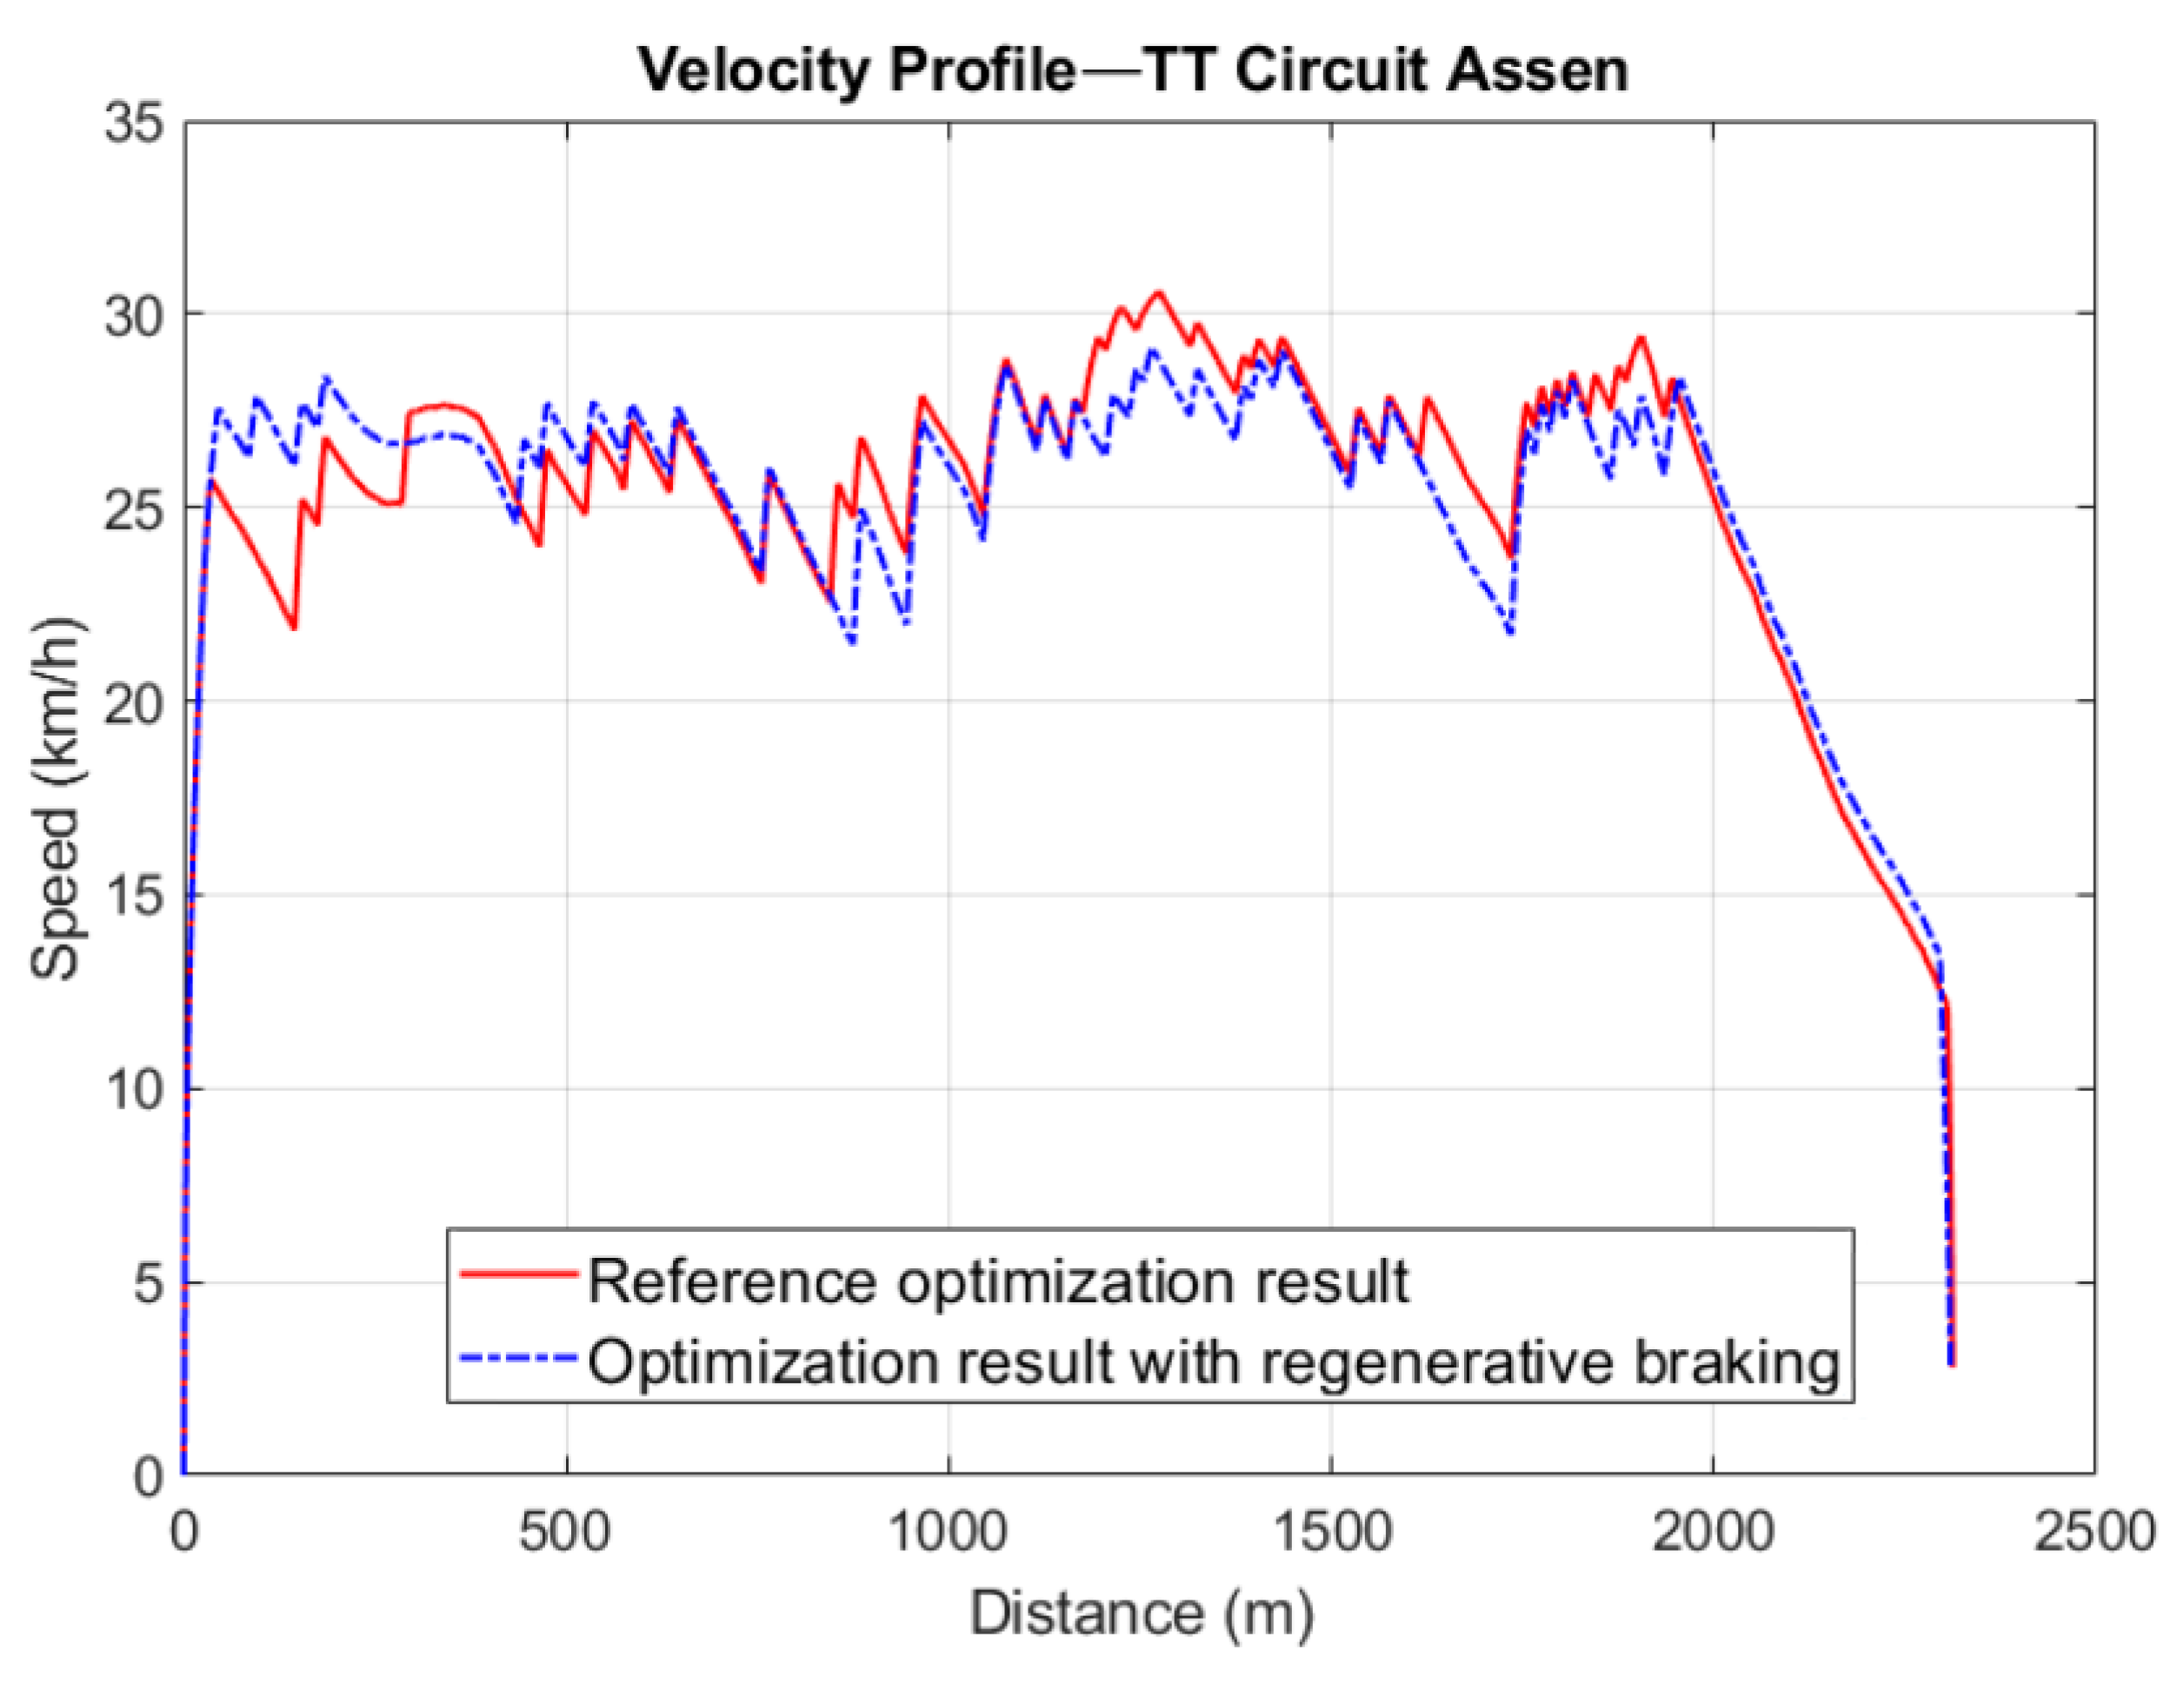
The braking distance of regenerative braking with the optimized torque function is 64.75 m for speeds from 30 to 3 km/h. The speed 3 km/h is also the threshold limit in this optimization case, while the vehicle top speed is 30 km/h on a flat track. The regenerative braking boundary could be limited to the last 70 m of the track, if we assume deviation in the track elevation. The optimization could decide the starting speed and timing of braking, it can be anywhere within the defined boundary. The velocity profile of the optimization results is illustrated in
Figure 13, where three minor differences can be observed. After the start, the vehicle speed drops back in the red line until 145 m; however, there is major acceleration at 285 m and the energy consumption is equaled at 300 m, according to
Figure 14. It also proves that there can be several local minima found in the driving strategy problems, at which the velocity could differ, but due to the resistance changes the consumed energy is almost the same. Another difference is observed around 1170 m, where the red line overshoots, but the energy is equaled by reaching 1430 m on the track. The last mentionable spot is around 1820 m, where the red overshoots again, but the energy is on the same level prior to the last coast-down period. Regenerative braking starts just 20 m before the finish line around the speed of 14 km/h. Both curves operate with a long coast-down phase from 1960 to 2280 m before the braking phase comes. The full range of regenerative braking is not used because it would mean more intense speed loss, as the vehicle needs to cover more track distance. If the full range were used, there would be more acceleration phase earlier, which summarized would mean more consumption. The ratio of coast-down and regenerative braking is determined according to the track and vehicle characteristics.
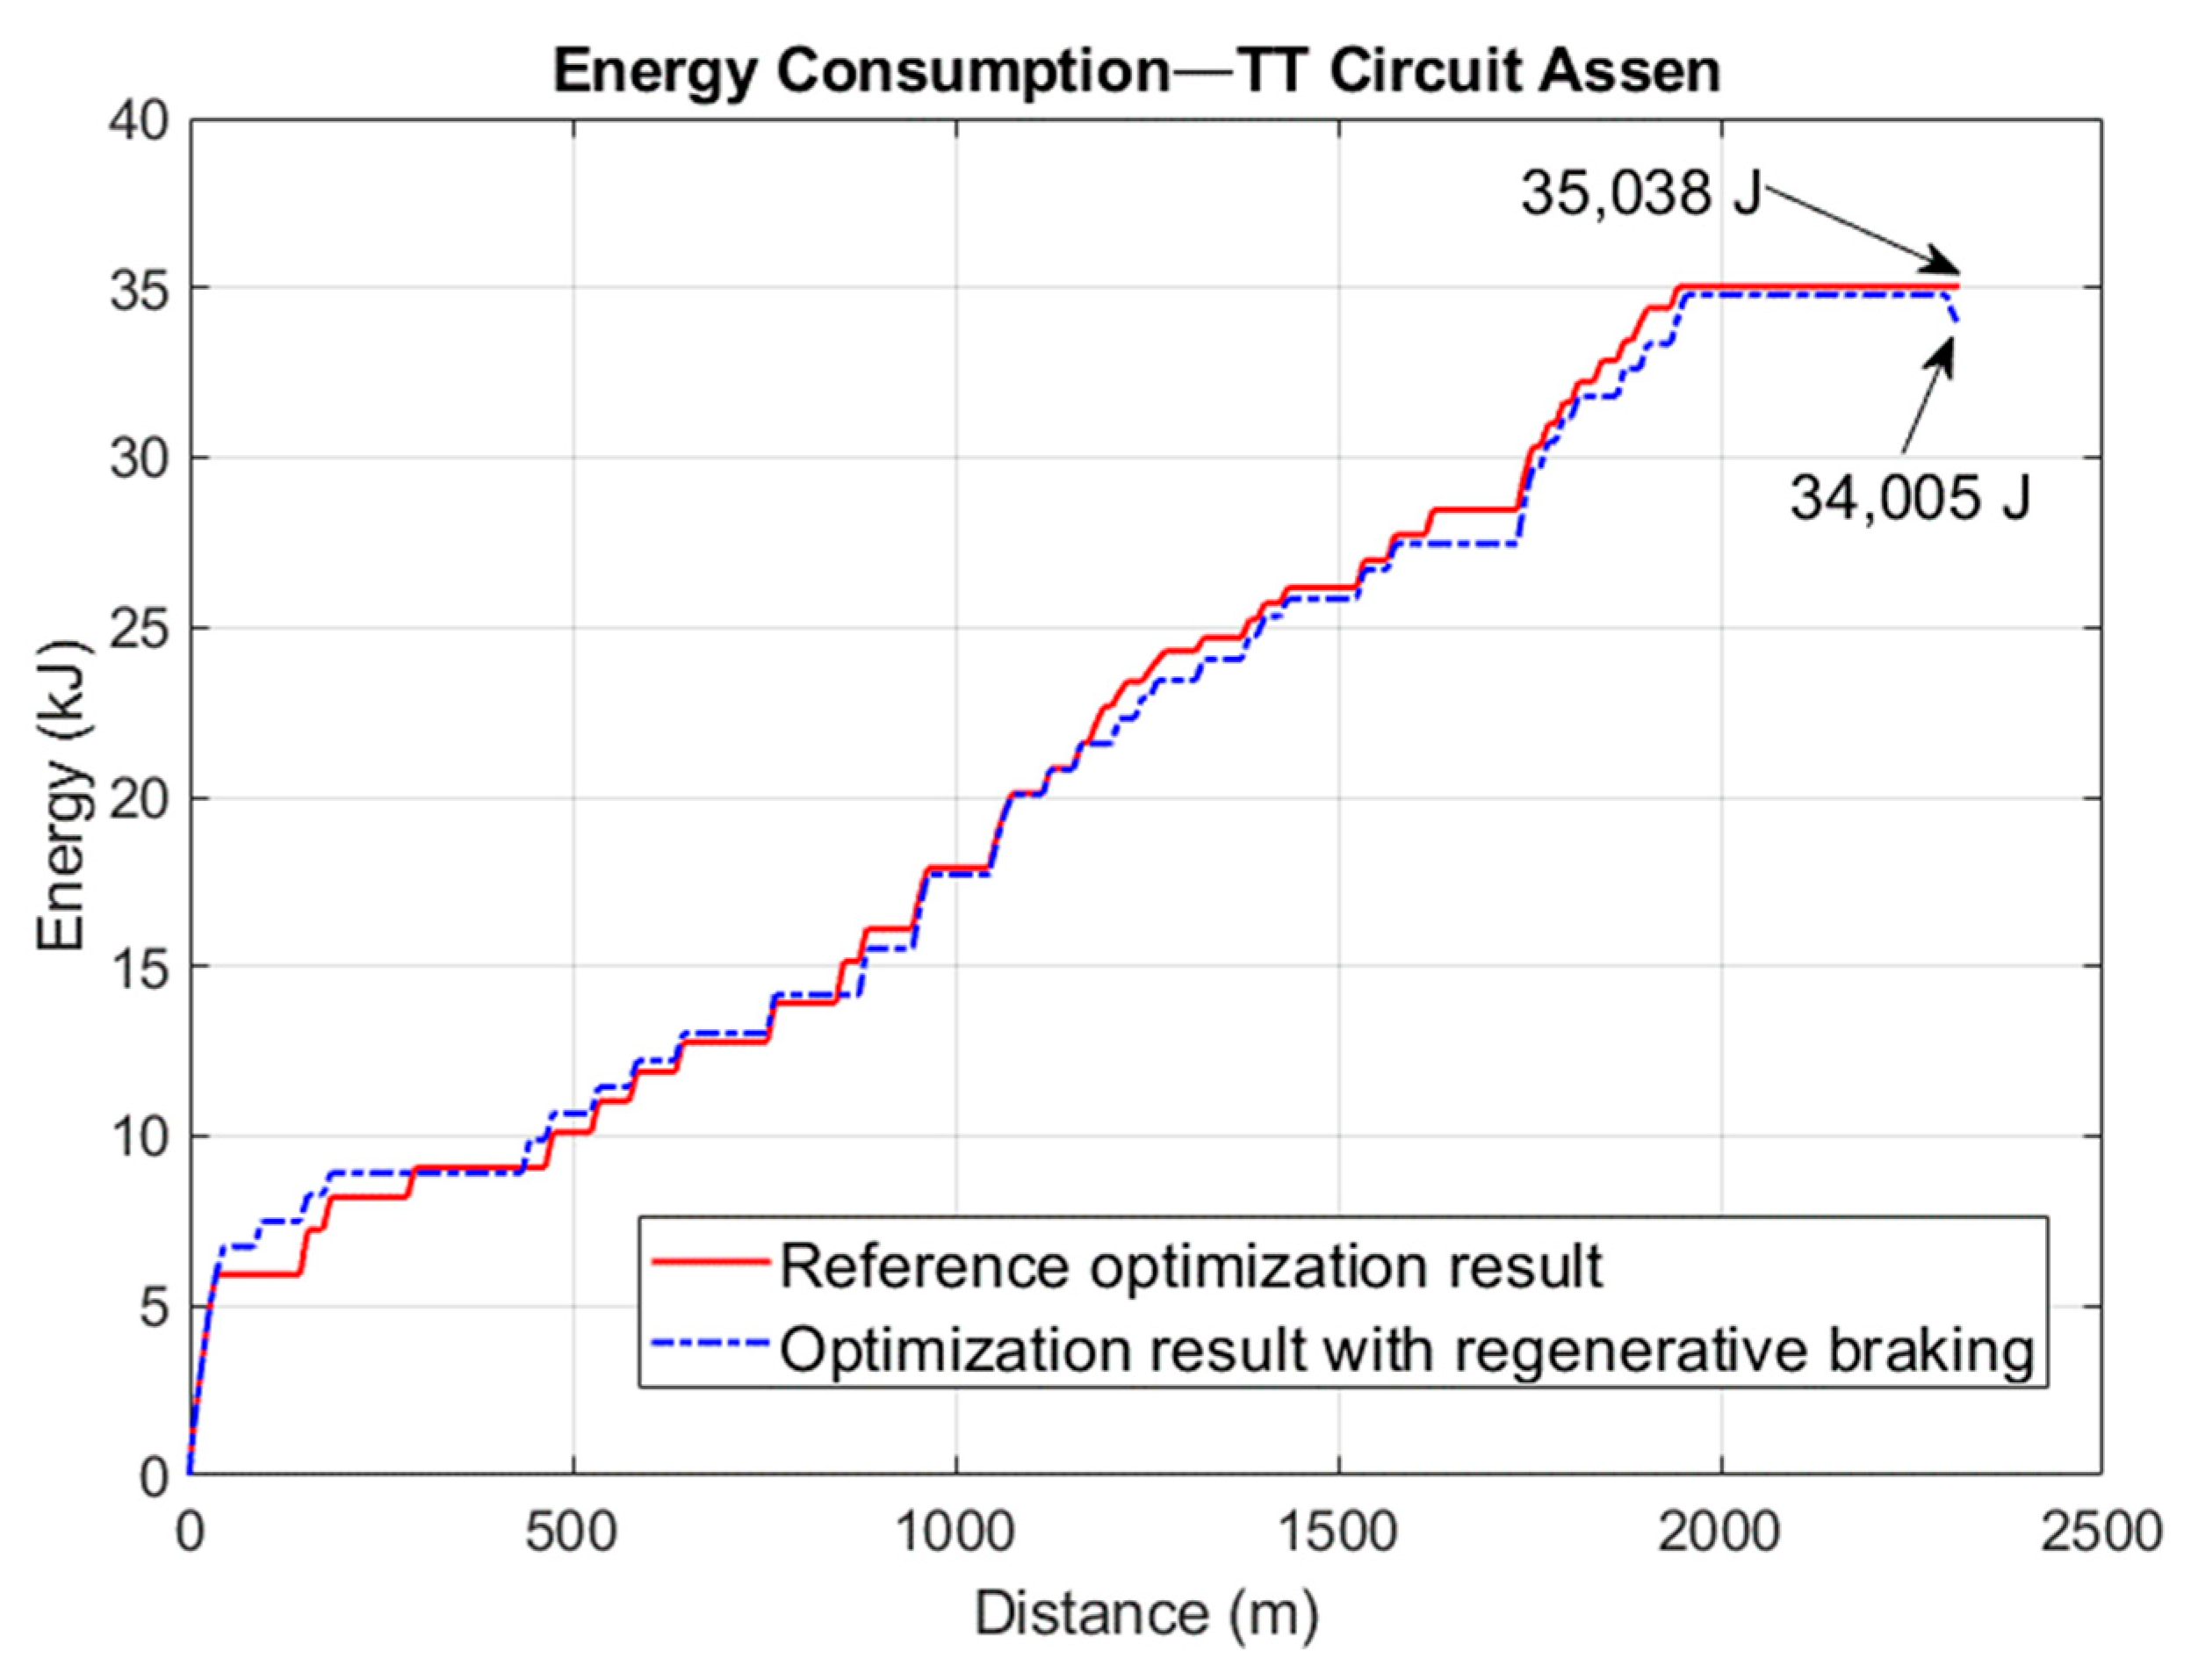
Energy consumption is shown in
Figure 14 and, despite the variations mentioned above, the energy consumption curve remains constant until the moment of regenerative braking, when around 1 kJ of energy is recovered. The results suggest that the recovered energy may be greater than 4 kJ across the entire braking range, but only a proportion of it was utilized in the optimized solution.
7. Results and Discussion
The main goal was to set up the optimized braking torque function, which uses determined torque values during regenerative braking to maximize recovered energy. An improved optimization framework was created based on the current model to accomplish the optimization. Regenerative braking calculations, braking torque optimization, and overall driving strategy optimization may all be handled by the modified powertrain model. The powertrain model was set up based on test bench measurements where the motor and generator operation are managed separately. The mathematical formulation of the optimization problem was performed and solved by using a genetic algorithm (GA) in a MATLAB environment. Several optimization attempts were carried out and the best was selected as the solution, since the GA does not provide a global solution. There was a very low variation between the different attempts, which proves the robustness and applicability of the GA for solving similar problems. The analyzed powertrain operates at a very high efficiency because it was designed specifically for SEM application. However, less efficient powertrains could benefit the most from the optimization presented. The emergency braking is clearly an exception from the application territory of the optimization, where the available maximal torque is needed.
A sensitivity analysis was performed after the optimized torque function was obtained from the optimization to the specified settings of the vehicle model. The sensitivity analysis examined the variations in the resistive force and mass parameters. The investigation revealed that only recoverable energy and braking distance are affected by mass, but values in the optimized braking-torque function remained the same. As the resistance force is increased, more braking-torque becomes necessary. The recoverable energy increases in lower resistance force scenarios, and the optimization determines that lower torque values with higher powertrain efficiency are more advantageous than in the reference scenario. The highest achieved overall efficiency of the powertrain was 85.6% in an ideal case where there is not any resistive force acting on the vehicle; this can be considered as the theoretical maximum efficiency of the powertrain. Based on the sensitivity analysis, the powertrain characteristics have more effect on the regenerative braking than the vehicle parameters and the shape of the power-loss map affecting the horizontal changes in the shape of the function. There is no need for modification of the optimized braking-torque function when the vehicle mass is changed or there is less than 10% difference in the resistance force value. The analyzed powertrain operates with a very high efficiency because it was designed specifically for this SEM application. However, the described optimization could produce a greater improvement in powertrains with less favorable drive characteristics.
The implementation of the optimized braking-torque function was achieved by further modification of the vehicle model by adding a state machine block at the model input. It was utilized to enable the model to respond to the motor controller’s tractive and braking commands. Driving and braking times were separated, and the combined consumption was used to determine the objective function and the optimization constraints. The track optimization was carried out on TT Circuit Assen, where an optimized driving strategy was compared to the race winning strategy for SEM 22. The velocity profile showed some modest variations; however, this does not necessarily indicate different energy usage because the optimized driving strategy has more local minima. The recovered energy of the regenerative braking meant an actual difference in energy consumption, which resulted in 2.97% improvement in overall consumption during one lap. It was interesting to observe that the optimization did not fully utilize regenerative braking because the final stage of vehicle operation was mixed with the coast-down strategy. It is important to note that this comparison is only valid when the resistance force model of the vehicle remains the same in both optimization cases. In practice, it means that the use of a clutch mechanism in the vehicle has the same resistance in coast-down phases and still has regenerative braking.
8. Conclusions
This paper describes regenerative braking optimization of lightweight electric vehicles in terms of vehicle model and objective function determination. The measurement-based vehicle model was modified to render the braking-torque optimization possible. The modification of the powertrain model was presented, which can be directly applied in complete driving strategy applications. The schematic model arrangement was illustrated, which makes the implementation in Simulink easily accessible. The braking-torque function was optimized by using a genetic algorithm in a MATLAB environment. The fact that there was minimal variation among the solutions demonstrates the robustness and practicality of the GA for the presented optimization problem.
Braking-torque function sensitivity analysis was performed, where the effect of mass and resistance force changes were evaluated. The results of the experiments showed that only the braking distance and recoverable energy are impacted by mass, while the values in the braking-torque function did not change. More braking-torque is required as the resistance force increases and lower torque values with better powertrain efficiency are more favorable than in the reference case. It can be concluded that the optimized regenerative braking-torque is heavily dependent on the powertrain and moderately sensitive to the resistance force changes. It was determined that the regenerative braking could achieve a maximum theoretical efficiency of 85.6% in case of the investigated powertrain, when the resistance forces are neglected.
It is important to mention that the battery model is not handled in the optimization framework, because the SEM regulation measures the recovered energy and not the actual battery SoC. The energy optimized braking-torque function means less load to the batteries as well. The mass parameter and resistance force were handled independently in the simulation model during the sensitivity analysis.
Implementation of the optimized braking-torque was demonstrated besides determining the corresponding optimization constraints and objective function. On the TT Circuit Assen, a complete optimization of the driving strategy was accomplished; results were compared with those from a prior optimization that did not consider regenerative braking. Overall consumption during one lap was improved by 2.97%. It is worth pointing out that the optimization only made partial use of regenerative braking, as the coast-down technique was also applied in the last stage of the vehicle’s operation to achieve an energy minimum. This result demonstrates the thesis of regenerative braking optimization and driving strategy optimization should not be managed separately when the minimization of energy consumption is the goal.
The presented methodology is directly designed for a lightweight, experimental vehicle. In the future, the main goals are to apply the achieved results in the control of the studied vehicle and further enhance the suitability of the results in conventional road transportation.


