Abstract
In the context of energy transformation, the importance of energy storage devices in regional integrated energy systems (RIESs) is becoming increasingly prominent. To explore the impact of energy storage devices on the design and operation of RIESs, this paper first establishes a bi-level dynamic optimization model with the total system cost as the optimization objective. The optimization model is used to optimize the design of three RIESs with different energy storage devices, including System 1 without an energy storage device, System 2 with a thermal energy storage (TES) device, and System 3 with TES and electrical energy storage (EES) devices. According to the design and operation results, the impact of energy storage devices on the operational performance of RIESs is analyzed. The results show that under the design conditions, energy storage devices can significantly increase the capacity of the combined heating and power units and absorption chillers in System 2 and System 3 and reduce the capacity of the ground source heat pumps and gas boilers; the impact of the TES device on System 3 is more significant. Affected by systems’ configuration, the operating cost, carbon tax, and total cost of System 2 are reduced by 2.9%, 5.5%, and 1.5% compared with System 1, respectively. The EES device can more significantly reduce the operating cost of System 3, with a reduced rate of 5.7% compared with that in System 1. However, the higher equipment cost makes the total cost reduction rate of System 3 less than that of System 1, which is 1.75%. Similar to the design conditions, under the operation conditions, the TES device can effectively reduce the carbon tax, operating cost, and total cost of System 2, while System 3 with an EES device can significantly reduce its operating cost regardless of whether the energy price changes or not. To some extent, this study systematically elucidated the impact of TES and EES devices on the optimal design and operation performance of RIESs and provided a certain reference for the configuration of energy storage devices.
1. Introduction
In recent years, the sustainable development of energy has received extensive attention. Regional integrated energy systems (RIESs) are expected to become an important way to improve the energy structure and achieve sustainable energy development [1]. However, the intermittency and volatility of renewable energy have brought certain challenges to the stable operation of RIESs [2,3]. With the rapid development of energy storage technology, the development of RIESs with hybrid energy storage has become the main way to solve the volatility of renewable energy and alleviate the contradiction between supply and demand [4,5].
To explore the performance of the integrated energy system with hybrid energy storage, the studies shown in Table 1 have conducted in-depth research on RIESs from aspects of system structure, operation strategy, and optimization model. Different from the traditional energy system, the RIES involves the deep coupling of multiple heterogeneous energy sources. The modeling idea of the Energy Hub (EH) proposed by Geidl et al. [6] was used to describe the relationship between energy conversion and conservation. However, this modeling idea is not conducive to the RIES’s extension and matrix representation in the model. To improve the model portability, an EH modeling method based on graph theory was proposed [7]. Based on this modeling idea, Ma et al. [8] adopted the static equipment model to establish the coupling system optimization model with the total system cost as the optimization objective. User-side energy saving and load management are also one of the main ways to reduce the total cost of RIESs [9,10,11]. To make full use of the flexibility of loads, Liu et al. [12] established a coupling system optimization model considering the comprehensive demand response. At the same time, this model is also used to explore the impact of energy storage devices on the design and operation of a RIES [13]. The static system optimization model cannot reflect the off-design characteristics of the equipment. To address the issue, a dynamic system optimization model, considering the off-design characteristics of the equipment, was established [14]. On this basis, Mansouri et al. [15] established a dynamic multi-objective optimization model and used it to optimize the design of a RIES with power-gas (P-G) technology. The results showed that the gas storage device could effectively improve the utilization of renewable energy. Unfortunately, none of the above optimization models realizes the decoupling of design and operation.
To achieve the decoupling of design and operation, Mago et al. proposed the following electric load (FEL), following thermal load (FTL), and following hybrid electric-heating load (FHL) strategies according to the role of the combined heating and power (CHP) unit in RIESs [16,17]. Based on the above strategies, Kang et al. [18] explored the operational performance of a RIES under different loads. Wang et al. [19] investigated the impact of energy storage characteristics on the system optimization results based on the system optimization model with the total system cost as the optimization objective. To take the economic, energy-saving, and environmental performance of systems into account, a weighted multi-objective optimization model was established for the optimal design of RIESs [20]. Based on the weighted multi-objective optimization model, Zeng et al. [21,22] used the static and dynamic equipment models to optimize the coupling systems of CCHP and ground source heat pump(GSHP), respectively. However, the value of weight is often subjective. Thus, a multi-objective optimization model with the optimization objectives of cost-saving rate, primary energy saving rate, and CO2 emission reduction rate was proposed for the optimal design of a RIES [23]. Zhai et al. [24,25] used this model to explore the impact of building types on the operational performance of RIESs. Different types of building loads have certain complementary characteristics. For this reason, Li et al. [26] explored the impact of loads’ complementary characteristics on optimization results and operational performance of a RIES. The research showed that the complementary characteristics of loads could reduce the capacity of energy storage devices to a certain extent. In addition, the equipment model and operation strategy also have a certain impact on the optimization results of RIESs. Therefore, Deng et al. [27] established a dynamic multi-objective optimization model based on the dynamic equipment model. Han et al. [28] used a dynamic multi-objective optimization model to optimize the design of a RIES with hybrid, compressed air energy storage. To improve the operational performance of RIESs, an improved FEL strategy was used in the optimal design of a RIES [29]. Compared with the traditional FEL strategy, the improved operation strategy could effectively reduce the energy consumption, operating cost, and CO2 emission of the RIES. At the same time, the adaptive operation strategy, based on user load, was proposed successively to improve the operational performance of RIESs [30]. However, the relatively fixed operation strategy could not realize the flexible scheduling of RIESs. Hence, Luo et al. [31] adopted the decision tree method to formulate the operation strategy of RIESs. Nonetheless, machine learning greatly relies on building historical load data. To avoid this problem and achieve the flexible scheduling of RIESs, a bi-level optimization model was proposed where the upper-level optimization model is used to determine the optimal configuration of systems, and the lower-level optimization model is used to realize the flexible scheduling of systems [32]. Based on the bi-level optimization model, Luo et al. [33] optimized the standalone renewable energy system with the total system cost as the optimization objective. Energy storage devices can improve the penetration rate of renewable energy. Li et al. [34] used the bi-level optimization model to optimize the design of an electricity-hydrogen RIES. Ma et al. [35] used this model to explore the impact of shared energy storage on the renewable energy utilization rate and operating cost of RIESs. Although the bi-level optimization model has been widely used in the optimization design and operation analysis of the integrated energy system with energy storage devices, few studies have systematically explored the effects of different energy storage devices on the optimal design and operational performance of the system by the bi-level dynamic optimization model.


Table 1.
Literature review of the integrated energy system with energy storage.
Table 1.
Literature review of the integrated energy system with energy storage.
| Ref. | Renewable Energy | Energy Storage Device | Operation Strategy | Equipment Model | System Optimization Model |
|---|---|---|---|---|---|
| [8] | Solar and wind energy | EES, TES | / | Static model | Coupled single objective optimization |
| [13] | Wind energy | EES, TES | / | Static model | Coupled single objective optimization |
| [14] | Solar and wind energy | EES, TES, Fuel cell | / | Dynamic model | Coupled single objective optimization |
| [15] | Wind energy | EES, HES | / | Dynamic model | Coupled multi-objective optimization |
| [18] | Geothermal energy | / | FEL FTL | Static model | Weak decoupling single objective optimization |
| [21] | Geothermal energy | TES | FEL FTL | Static model | Weak decoupling weighted multi-objective optimization |
| [22] | Geothermal energy | TES | FEL FTL | Dynamic model | Weak decoupling weighted multi-objective optimization |
| [24] | Solar energy | TES | FEL FTL | Static model | Weakly decoupled multi-objective optimization |
| [25] | Solar energy Geothermal energy | EES TES | FEL FTL FHL | Static model | Weakly decoupled multi-objective optimization |
| [27] | Geothermal energy | TES | FEL FTL | Dynamic model | Weakly decoupled multi-objective optimization |
| [30] | Solar, wind and geothermal energy | EES TES | FSF | Dynamic model | Weakly decoupled multi-objective optimization |
| [31] | Solar energy | EES TES | Dynamic strategy | Dynamic model | Weakly decoupled multi-objective optimization |
| [34] | Solar, wind and geothermal energy | EES, hydrogen storage | FOF | Static model | Bi-level optimization model |
| [35] | Solar and wind energy | SES | FOF | Static model | Bi-level optimization model |
Different energy storage devices can realize the time-series transfer of different energies. To explore the impact of energy storage devices on the design and operation of RIESs, this paper optimizes three RIESs with different energy storage devices and compares their operational performance according to a public building load in Changsha. The main contributions of this paper are as follows: (1) A bi-level dynamic optimization model is established based on the dynamic equipment model; (2) Three RIESs with different energy storage devices are optimally designed; (3) According to the optimization results, the operational performance of three RIESs with different energy storage devices is compared. The remainder of this study is organized as follows: Part Ⅱ is the introduction and equipment modeling of RIESs with different energy storage devices; Part Ⅲ is the establishment of the bi-level system optimization model; Part Ⅳ presents the impact of different energy storage devices on the optimal design and operational performance of the integrated energy system based on the case results; and the conclusions of this work are drawn in Part Ⅴ.
2. Modeling of RIESs
2.1. Basic structure of RIESs
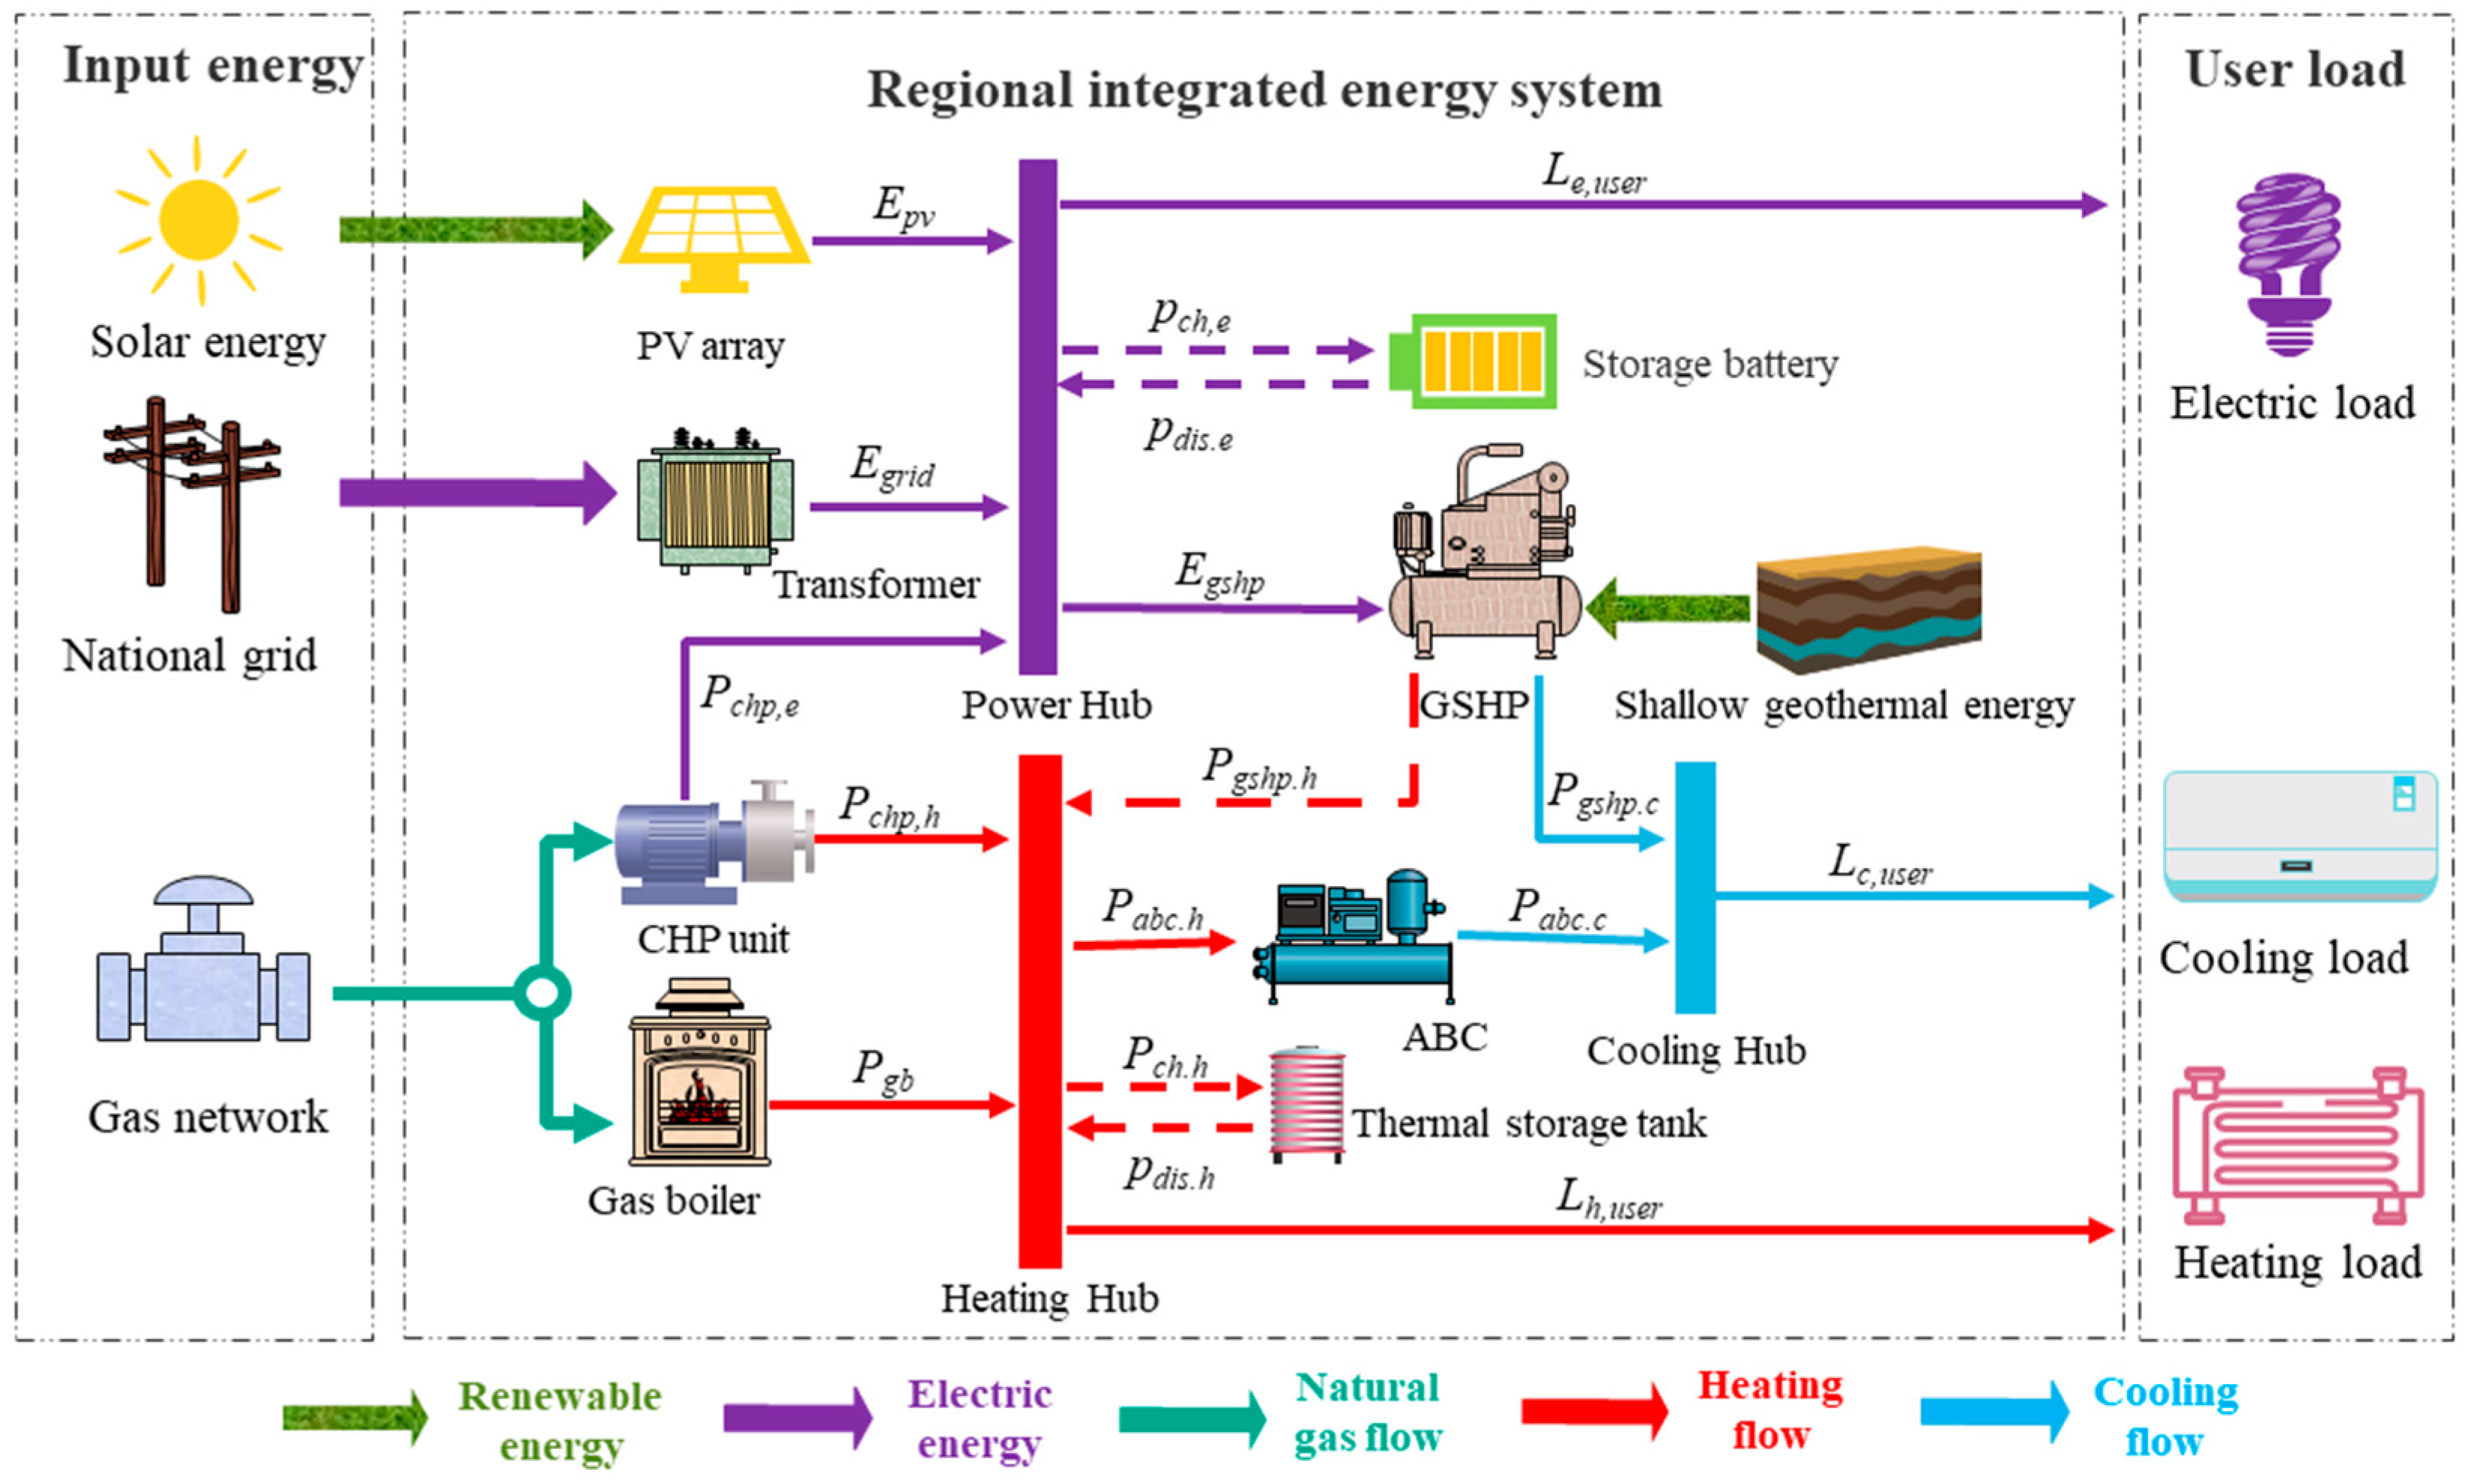
RIESs can not only realize efficient energy conversion but also gratify the cooling, heating, and electricity needs of users simultaneously. In the RIES shown in Figure 1, the input energy mainly comes from grid electricity, municipal gas, and regional renewable energy (such as solar and geothermal energy). Energy conversion equipment is used to realize the conversion of input energy to output energy, mainly including the transformer, photovoltaic (PV) arrays, CHP unit, gas boiler, GSHP, and absorption chiller (ABC). Therefore, the power, heating, and cooling hubs are introduced in the modeling idea of EH to realize the collection and distribution of different energies and ensure the balance of the supply and demand for energy. In addition, to explore the influence of energy storage devices on the optimal design and operational performance of RIESs, three RIESs with different energy storage devices are considered, and their energy storage configurations are shown in Table 2.
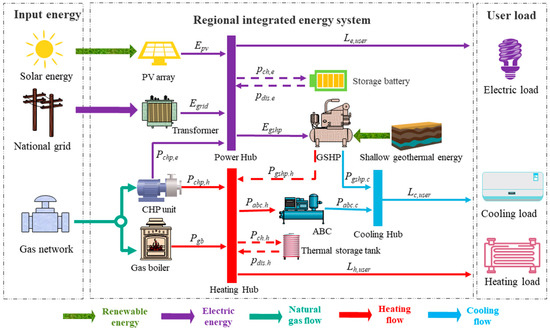
Figure 1.
The basic structure of RIESs.

Table 2.
Three RIESs with different energy storage devices.
2.2. Equipment Mathematical Model
2.2.1. Energy Conversion Device
The equipment model is the basis of system design and operation optimization. In the RIES shown in Figure 1, the PV arrays are one of the effective ways to utilize solar energy, and its power generation is usually affected by the ambient temperature, solar irradiation intensity, and power generation efficiency. Compared with PV arrays, the CHP unit can not only generate electricity, but also the waste heat can be used to meet the cooling and heating needs of buildings. Other than that, the rest of the building’s cooling and heating loads are met by the GSHP and gas boiler. When constructing mathematical models for the CHP unit and cooling and heating equipment, relevant studies generally adopt the black-box model based on energy efficiency. The model is usually divided into two types: the static equipment model and the dynamic equipment model. The static model assumes that the operating efficiency of the equipment is constant. The dynamic equipment model considers the influence of equipment partial load rate on its efficiency. To accurately describe the operation performance of the equipment, the dynamic equipment model will be established in this paper, and the specific expressions for different equipment dynamic models are shown in Table 3.

Table 3.
Equipment dynamic model.
2.2.2. Energy Storage Devices
On the basis of System 1, this paper investigates the impact of energy storage devices on the optimization and operation of RIESs by sequentially configuring TES and EES devices in System 2 and System 3. Different from the energy conversion equipment, the source-load duality of energy storage devices allows it to achieve the time-series transfer of energy to meet the supply-demand balance of RIESs. Therefore, the mathematical model of energy storage devices can be expressed by the charging and discharging state and power, and its specific expression is shown as follows [40]:
where and are the energies stored in energy storage device k at time t + 1 and t, respectively; and are the charging and discharging efficiency of energy storage device k; and and are the charging and discharging powers of energy storage device k at time t.
3. Bi-Level Optimization Model
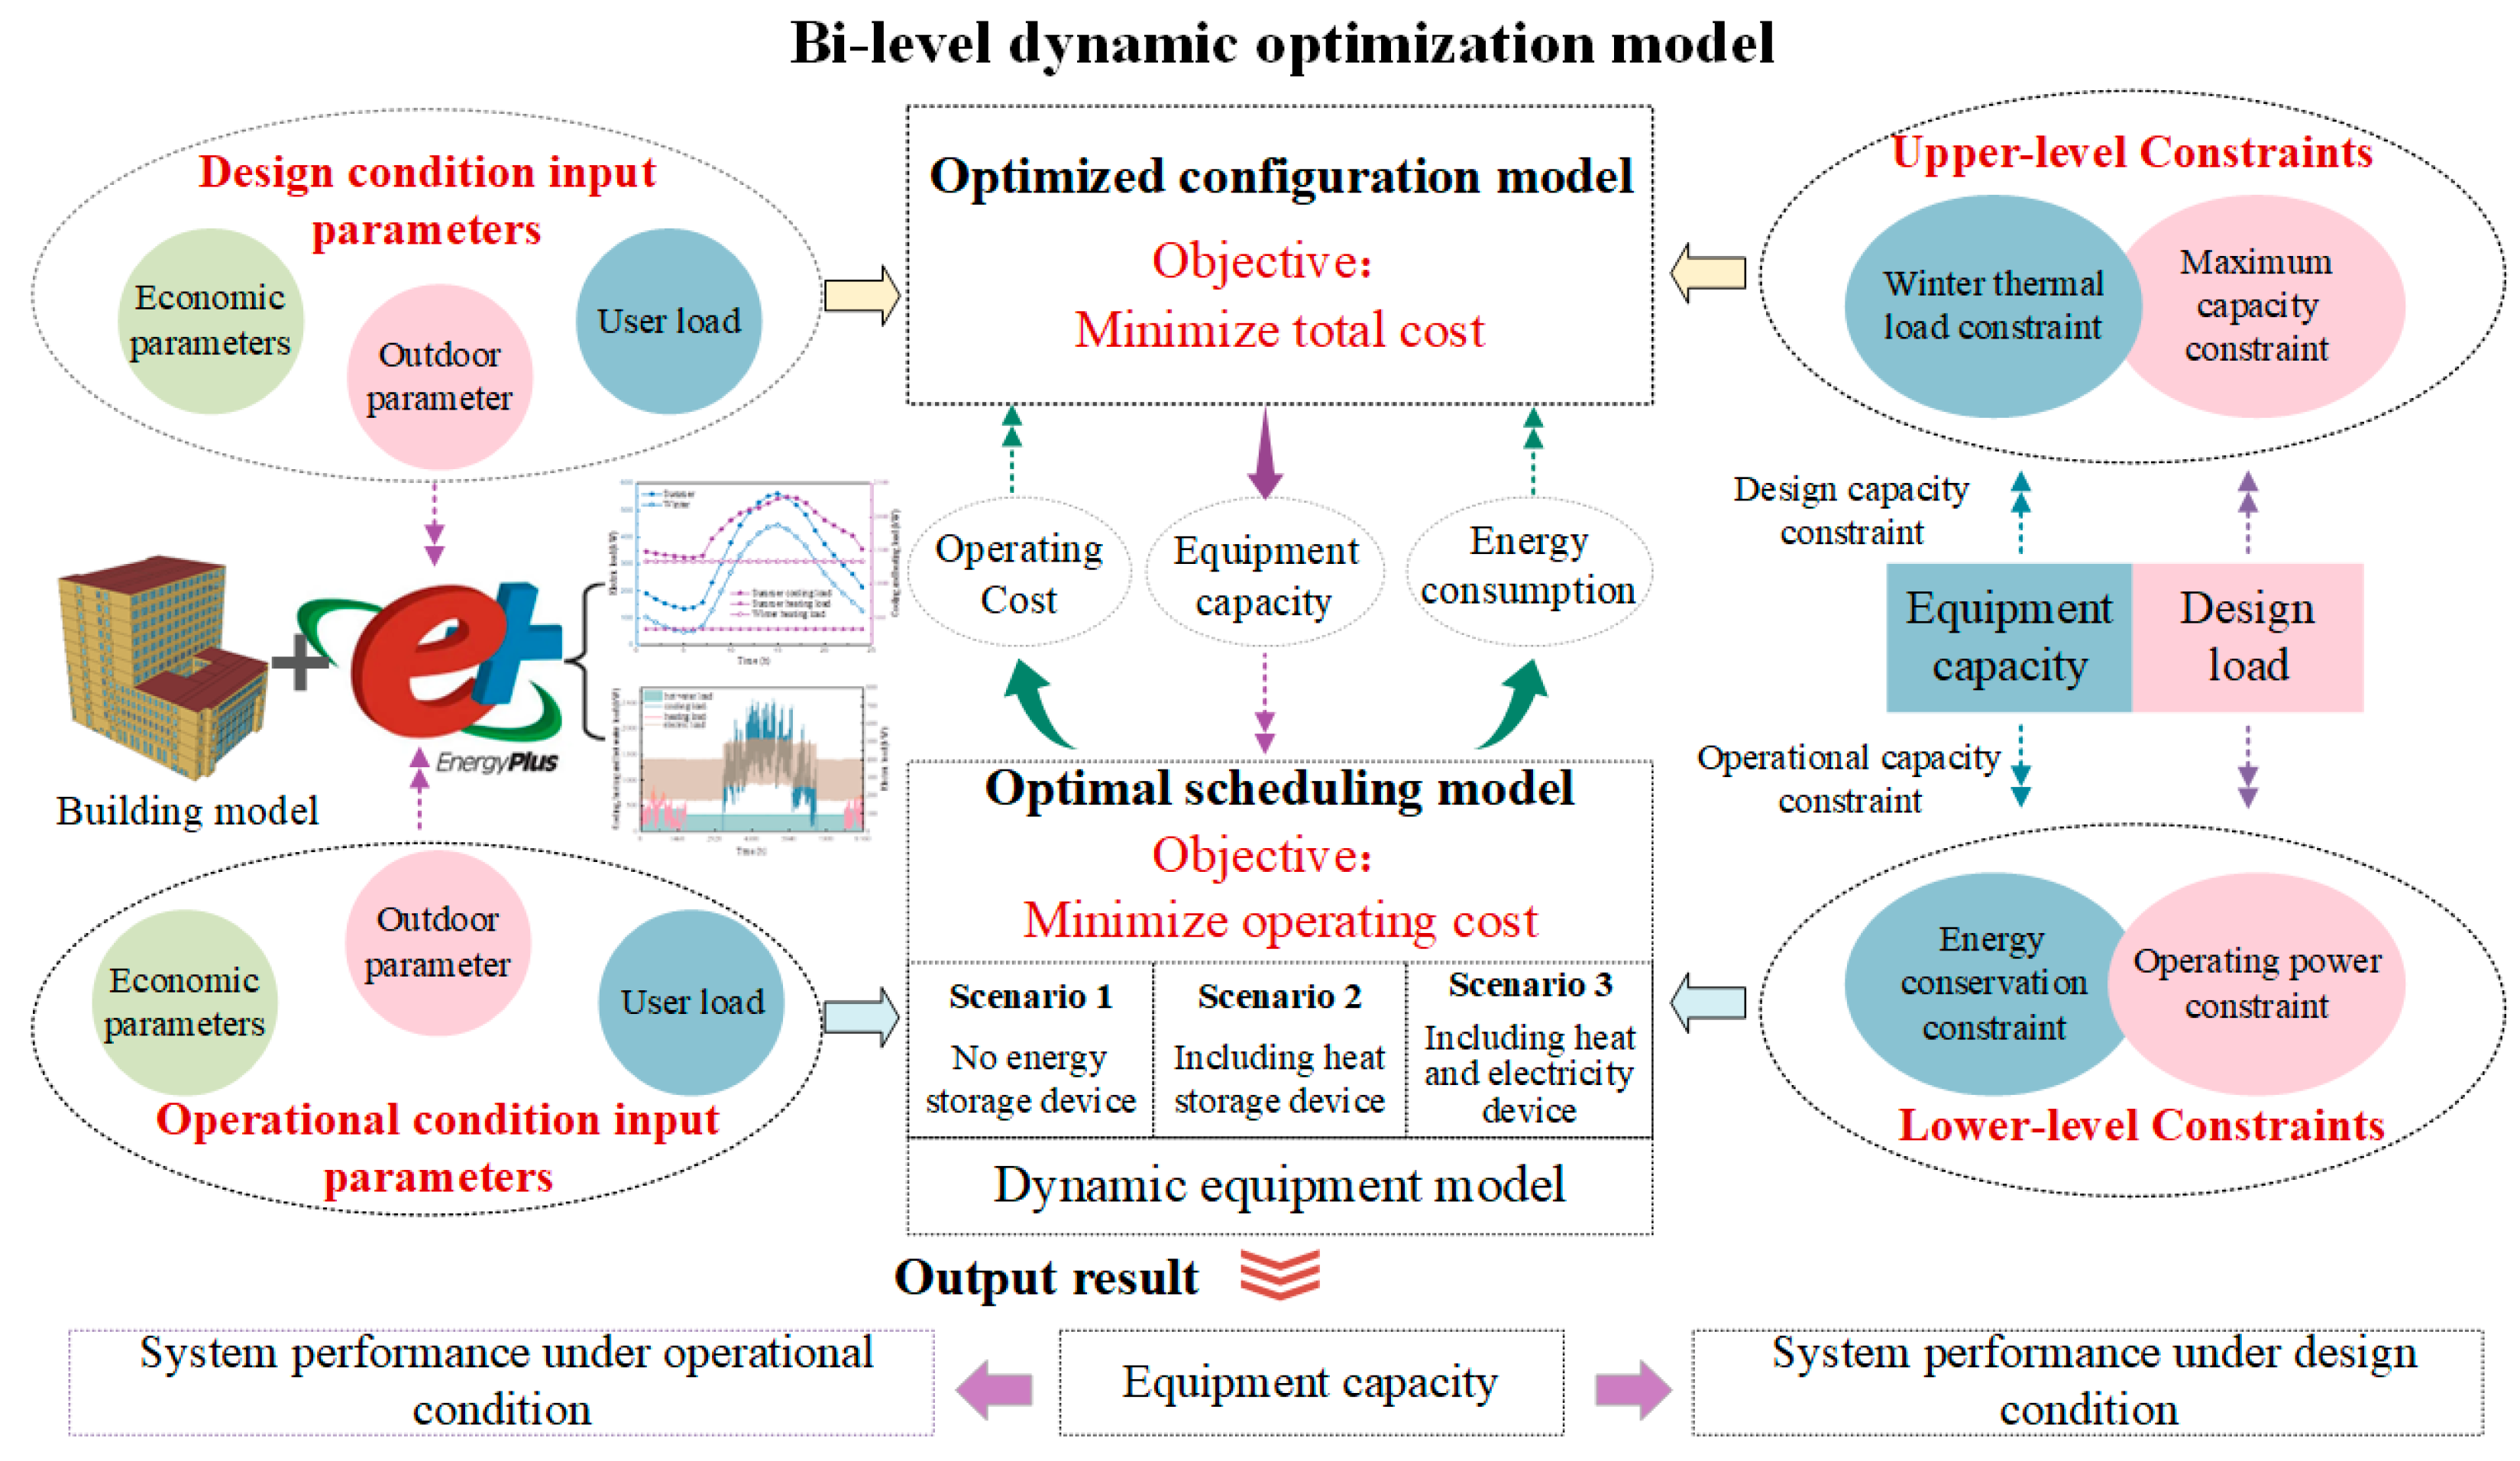
Energy storage devices not only affect the optimal design of RIESs but also affect their operational performance. To explore the impact of energy storage devices on the optimal design and operation of RIESs, a bi-level dynamic optimization model is established in this paper. In this model, the upper-level optimized configuration model takes the system’s total cost as the optimization objective to determine the equipment capacity of RIESs. The lower-level optimal scheduling model takes the operating cost as the optimization objective to determine the reasonable scheduling scheme. To facilitate the understanding of the solution process of this model, the optimization process is drawn in Figure 2. Firstly, based on the outdoor design parameters, the design and operating loads of the building are calculated by Energy Plus. Secondly, the constraints of the upper-level and lower-level optimization models are established according to the design loads and the EH model. Among them, the main constraints of the upper-level optimized configuration model include the maximum equipment capacity and the design load in winter. And the constraints of the lower-level scheduling model include energy conservation and equipment operating power. Finally, the design load, outdoor parameters, and economic parameters are imported into the bi-level optimization model for solving to obtain the equipment capacity of three RIESs. With the equipment capacity known, this paper uses the lower-level scheduling model to optimize the operation of three RIESs and analyzes the impact of energy storage devices on their operational performance.
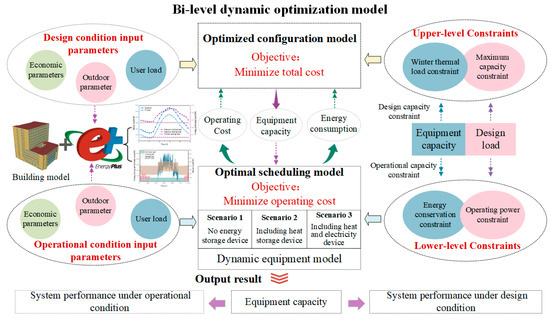
Figure 2.
Flow chart of system optimization configuration and operation analysis.
3.1. Upper-Level Optimal Configuration Model
3.1.1. Optimization Objective
To determine the equipment capacity of the three RIESs, this paper optimizes them with the minimum total cost as the optimization objective. In this study, the total cost mainly includes the system equipment cost, operating cost, and carbon tax. The specific calculation expressions are shown below:
where is the total cost; is the equipment cost; is the carbon tax; and is the operating cost, the values can be obtained from the lower-level scheduling model.
The system equipment cost mainly includes the initial investment and equipment maintenance cost. The initial investment in equipment depends on its capacity and the initial unit investment. The initial unit investment in the RIESs, showed Figure 1, is listed in Table 4. Under the condition that the initial unit investment of equipment is known, the initial investment of RIESs on the design day can be determined by the following formula [41].
where is the annual interest rate, which is 0.08 in this paper; n is the planning period, which is 20 years; is the design capacity of the equipment k; and is the initial unit investment in the equipment k. As the initial investment in the system’s equipment is known, the maintenance cost of the system’s equipment can be estimated at 2% of its initial investment [42].

Table 4.
The initial unit investment in equipment Reproduced from [43,44].
In the context of peak carbon dioxide emissions and carbon neutrality, carbon tax compensation has become an effective means to limit greenhouse gas emissions. In the RIESs shown in Figure 1, CO2 emissions mainly come from grid power and gas, so the carbon tax cost can be calculated by the following formula.
where is the carbon tax price; and are the equivalent emissions of coal power and gas, which are 0.968 kg/kWh and 0.220 kg/kWh, respectively [45]; and and are the consumption of grid power and gas at time t, which can be obtained from the lower-level scheduling model.
3.1.2. Optimization Variables and Constraints
In the upper-level optimization model, the optimization variable is the capacity of the candidate equipment. Considering the equipment installation conditions and building loads, its optimization variables must satisfy the following constraints.
where is the maximum design capacity of equipment k, whose value is usually the maximum value of the corresponding load.
In addition, this study uses the design-daily load in summer as the design parameter. To gratify the load demand in winter, the maximum heat production capacity of the system must be greater than the maximal heating load.
where is the maximum heat production of the GSHP; is the maximum heat production of the CHP unit; is the maximum heat production of the gas boiler; and is the maximum heating load in winter.
3.2. Lower-Level Optimal Scheduling Model
3.2.1. Optimization Objective
To achieve flexible scheduling, the minimum operating cost is used as the optimization objective to optimize the operation of three RIESs. The operating cost mainly comes from the electricity and gas costs, whose values can be determined by the following formula:
where is the time-of-use (TOU) electricity price; and is the gas price.
3.2.2. Optimization Variables and Constraints
In the lower-level optimization model, the main optimization variable is the operating power of the equipment. The operating power should not only gratify the capacity constraints of the upper-level equipment but also meet the supply-demand balance constraints of the EH.
- Equipment operating power constraints
- (1)
- Energy conversion equipment
The operating power of the energy conversion equipment is both restricted by the capacity of the upper-level equipment and affected by the start-up and shutdown of the equipment. Therefore, the operating power is a semi-continuous variable whose range is shown in the following formula:
where is the part-load ratio of equipment k; is the minimum part-load ratio for the start-up of equipment k; and and are the minimum and maximum output power of equipment k in the operating state.
- (2)
- Energy storage equipment
Different from energy conversion equipment, energy storage devices should not only gratify the charging and discharging power constraints but also the charging and discharging state constraints, which are specifically expressed as follows:
where is a variable of 0 or 1, which is introduced to ensure that the charging process and discharging process will not happen simultaneously; and are the maximum charging and discharging ratios of energy storage device k; and are the minimum and the maximum energy storage ratios of energy storage device k, respectively; and is the capacity of energy storage device k.
- 2.
- Energy balance constraint
During the operation of RIESs, the EH is only used for energy collection and distribution. Therefore, the three energy hubs must maintain a balance between supply and demand, with the balance constraint shown below.
where is the electricity consumption of GSHP; is the cooling power of GSHP; is the cooling power of ABC; is the heat consumption of ABC; and is the heat production of the gas boiler.
3.3. Model Solving
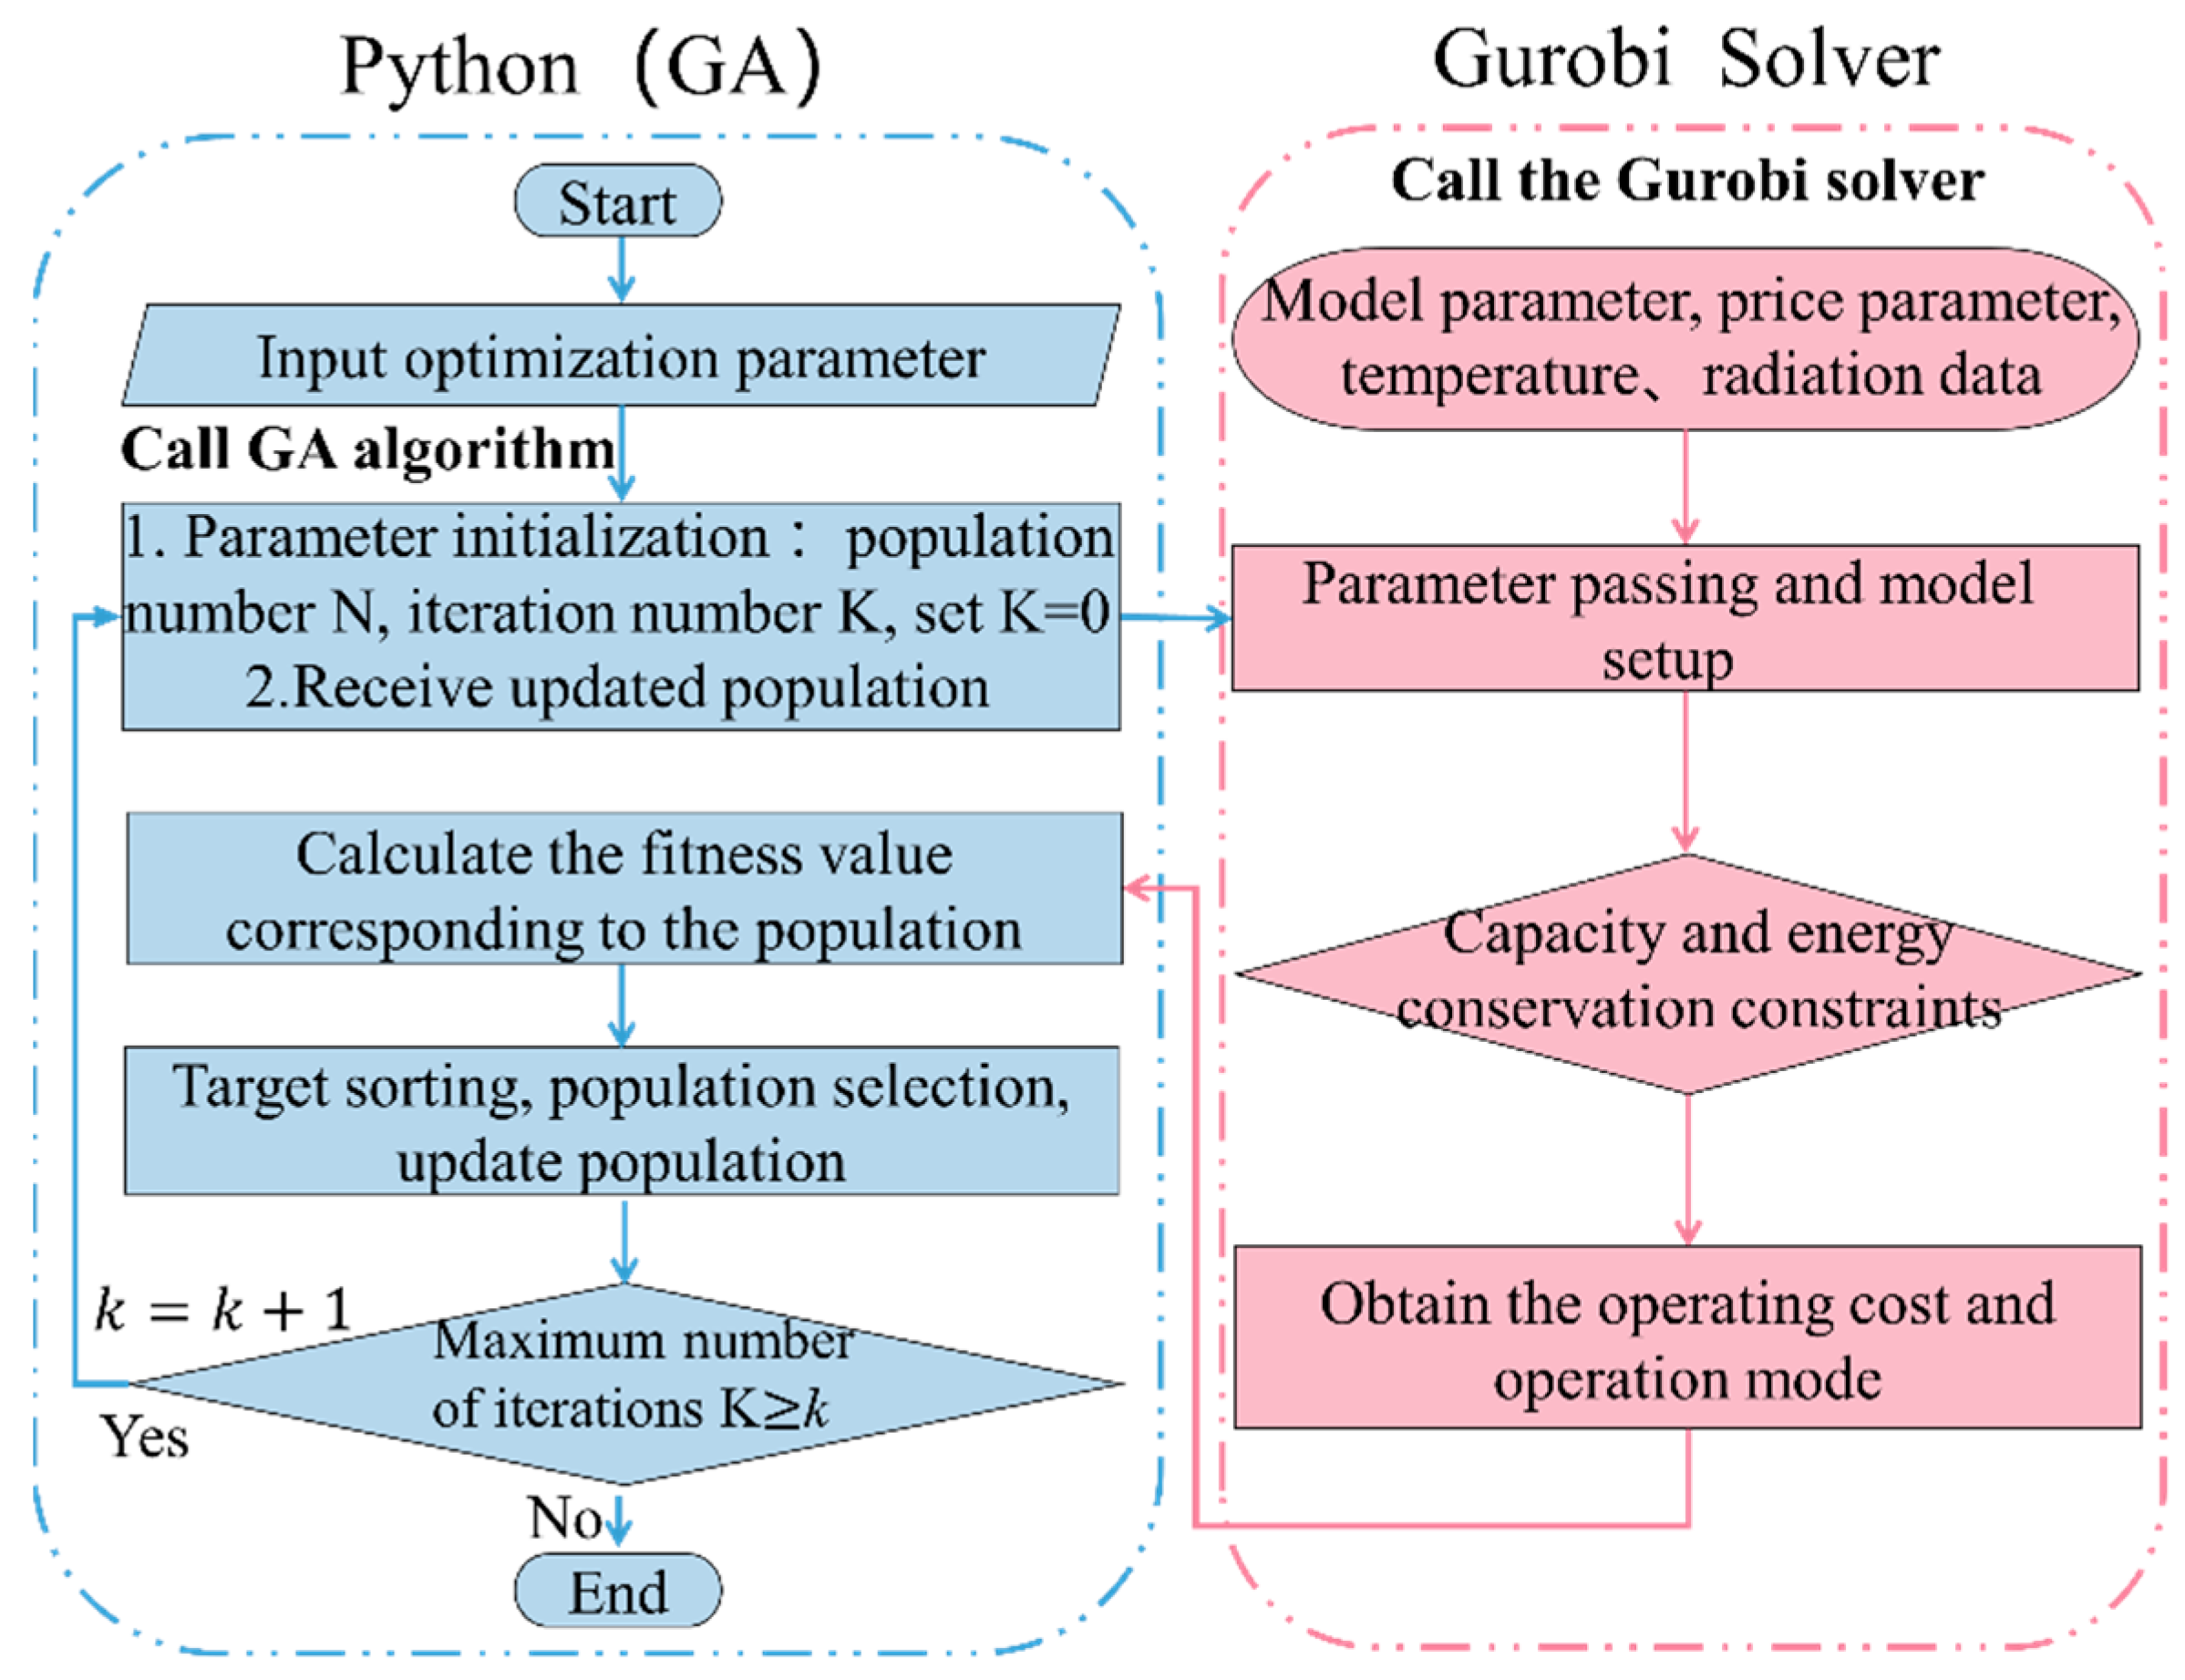
The solution methods of the bi-level optimization model usually include classical mathematical programming theory and the combination of intelligent optimization algorithms and classical mathematical programming theory [46,47]. In this study, the lower-level scheduling model takes into account the off-design characteristics of the equipment, which makes the lower-level scheduling model non-convex and nonlinear, and thus makes it difficult for classical mathematical programming theory to solve the bi-level dynamic optimization model. Therefore, this study will adopt the method of combining an intelligent optimization algorithm and classical mathematical programming theory to solve it, in which the upper-level optimization model is solved by a genetic algorithm. However, the calculation of the upper-level optimization objective often depends on the solution of the lower-level model. To realize the fast and accurate solution of the lower-level optimization model, this paper performs piecewise linearization on the performance curve of the equipment and calls Gurobi’s non-convex solver to solve it to obtain the minimum operating cost and operating energy consumption. The lower-level optimization model transfers the optimization results to the upper-level optimization model to calculate the total cost of the system, while the upper-level optimization model transfers the optimized equipment capacity to the lower optimization model to constrain its scheduling. After repeated iterations, the optimal configuration and scheduling schemes of three RIESs can be obtained. Figure 3 shows the flow chart of the bi-level dynamic optimization model.
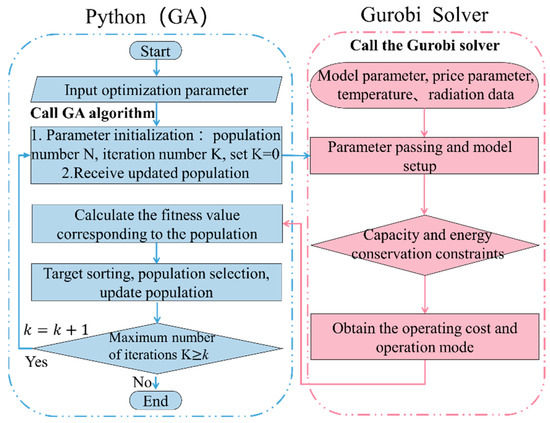
Figure 3.
Solution flow chart of the bi-level optimization model.
4. Case Study
This paper takes a public building in Changsha as an example to explore the impact of energy storage equipment on the optimal design and operation results of RIESs. The building consists of two parts, the main building and the podium building, of which the main building has twelve floors, and the podium building has five floors, covering a total area of 2500 . Considering the energy-saving requirements of the building, its envelope adopts the standard building envelope structure in hot-summer and cold-winter climates.
4.1. System Design Parameters
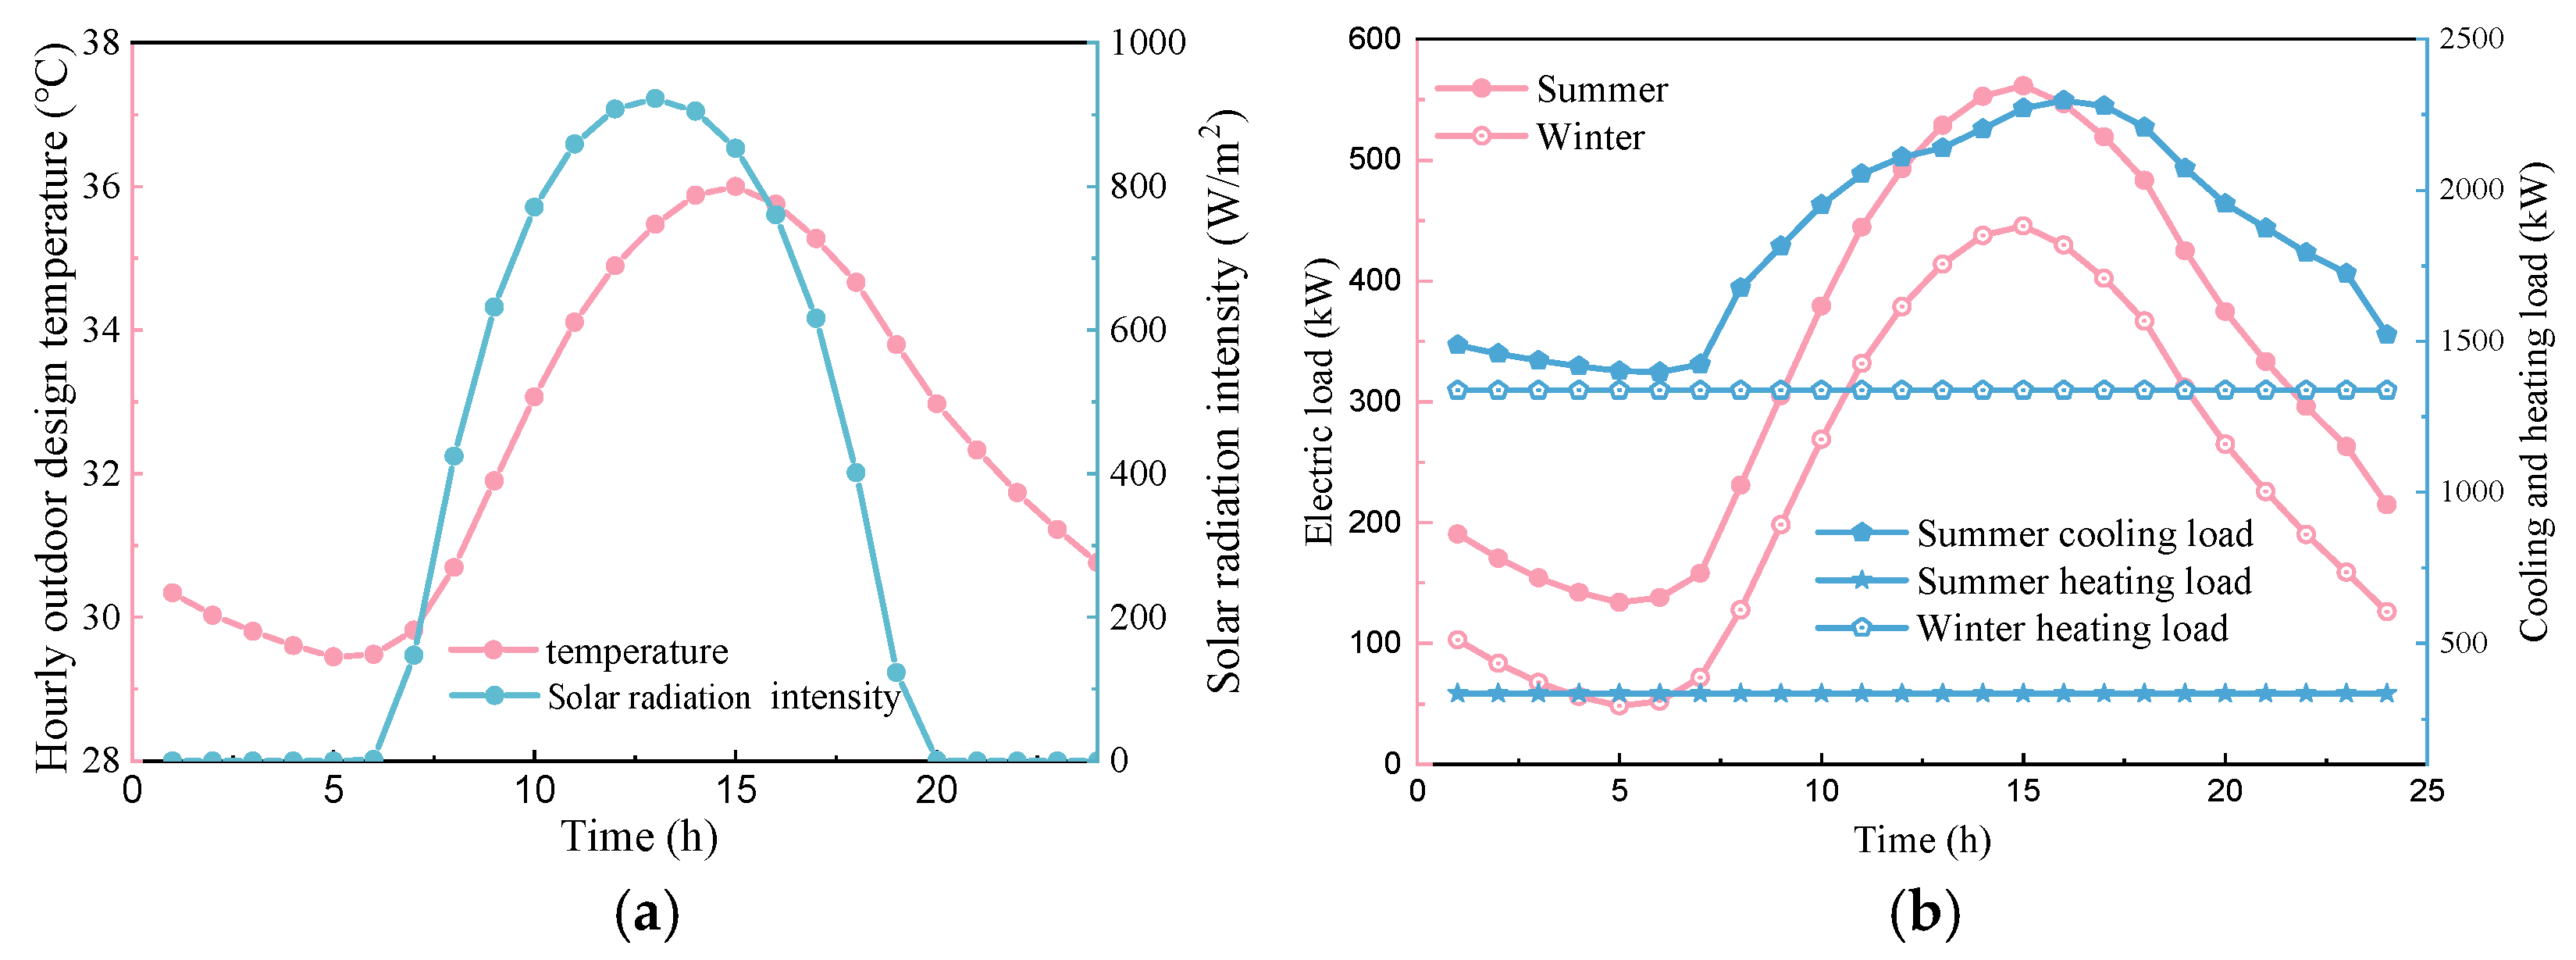
In the process of the optimization of RIESs, outdoor meteorological parameters and design load are the basis of system optimization design. Therefore, through relevant literature, this paper determines the outdoor design temperature of air conditioning in Changsha and the average water temperature of the Xiangjiang River, whose values are shown in Table 5. Unlike the heat load in winter, the cooling load calculation in summer is usually transient. For this reason, this paper corrects the outdoor design temperature of air conditioning in summer, and the hourly outdoor design temperatures and solar radiation intensities obtained from the correction are shown in Figure 4a. Based on the above design parameters, this paper uses Energy Plus to calculate the design load of the building, and the result is shown in Figure 4b. On summer design days, the heating load is mainly domestic hot water load, while the winter heating load includes air conditioning heating load and domestic hot water load. When the design load is known, this paper determines the equipment capacity optimization range, shown in Table 6, according to the design load and equipment installation requirements.

Table 5.
Air conditioning outdoor design temperature and groundwater temperature Reproduced from [48,49].
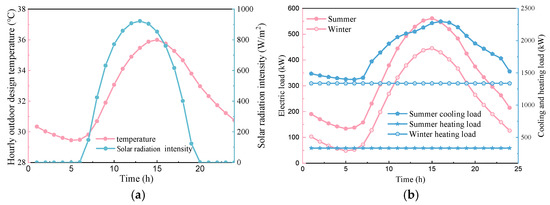
Figure 4.
Outdoor parameters and building load under design conditions: (a) Hourly outdoor design temperature and solar radiation intensity in summer; (b) Cooling, heating, and electric load on the design day.

Table 6.
Optimization range of equipment capacity.
In addition, the energy price and carbon tax price are also indispensable input parameters for calculating the optimization objectives. For this reason, this paper determines the energy and carbon tax prices shown in Table 7 according to relevant literature.

Table 7.
Energy price and carbon tax Reproduced from [50,51,52].
4.2. System Optimization Results and Analysis
4.2.1. Optimization Results
Based on the above inputs, this paper takes the total cost as the optimization objective and adopts the bi-level dynamic optimization model to optimize the design of three RIESs. The equipment capacity obtained by optimization is shown in Table 8. Compared with System 1, the TES device can significantly increase the capacity of the CHP unit and ABC in System 2 and reduce the capacity of the GSHP and boiler. Identically to the TES device, the EES device can also increase the capacity of the CHP unit and ABC in System 3. However, the EES device has less impact on the capacity of energy conversion equipment than the TES device.

Table 8.
System equipment capacity.
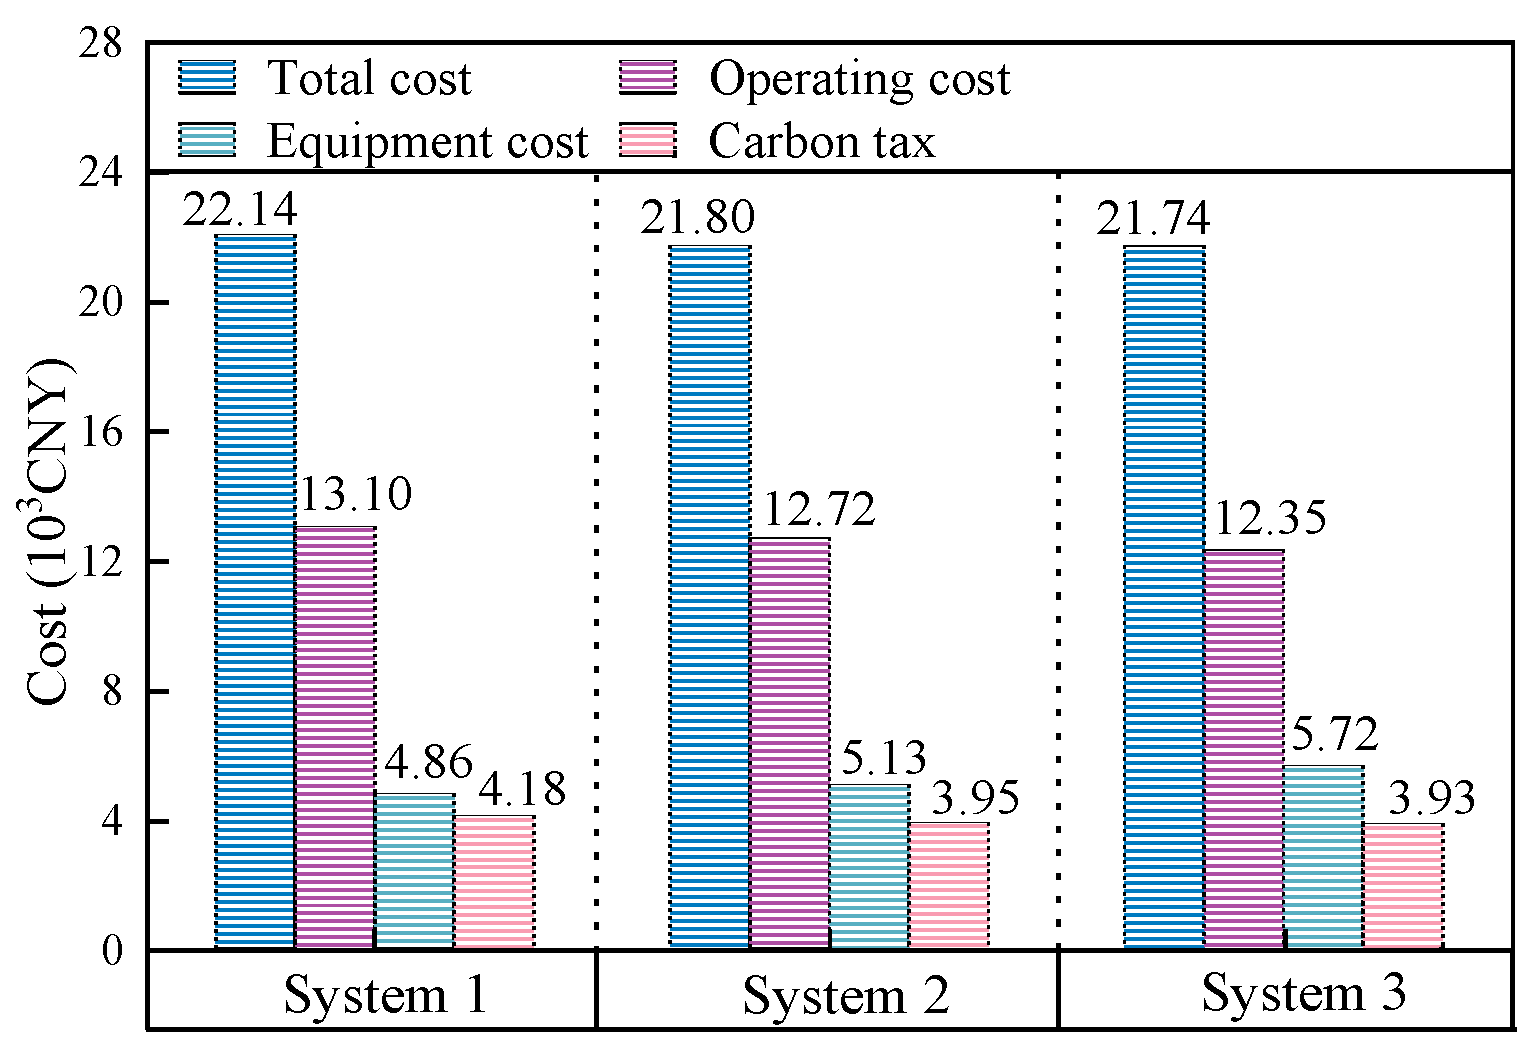
The difference in equipment capacity affects the equipment cost and operational performance of RIESs. Figure 5 shows the equipment costs, carbon taxes, operating costs, and total costs of the three systems under the design conditions. The difference in equipment capacity makes the equipment cost of System 2 and System 3 larger than that of System 1, with increasing rates of 5.7% and 17.8%, respectively. In comparison to the TES device, the EES device will significantly increase the equipment cost of System 3. Different from the equipment cost, the carbon tax, operating cost, and total cost of System 2 and System 3 are all less than that of System 1. Compared with System 1, the carbon tax, operating cost, and total cost of System 2 decreased by 5.5%, 2.9%, and 1.5%, respectively.The EES device can significantly reduce the operating cost of System 3, with a reduction of 5.7% compared with System 1. However, affected by the equipment cost, the total cost reduction rate of System 3 compared with System 1 is only 1.75%. It can be seen that under the design conditions, the TES and EES devices can reduce the operating cost, carbon tax, and total cost of the RIES to different degrees. However, the EES device has less impact on the carbon tax and total cost of RIESs.
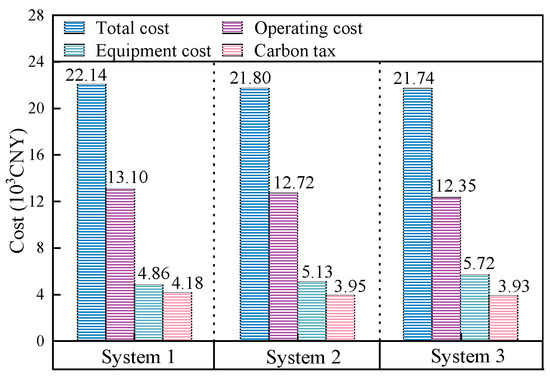
Figure 5.
Cost differences between the three systems.
4.2.2. Analysis of Results
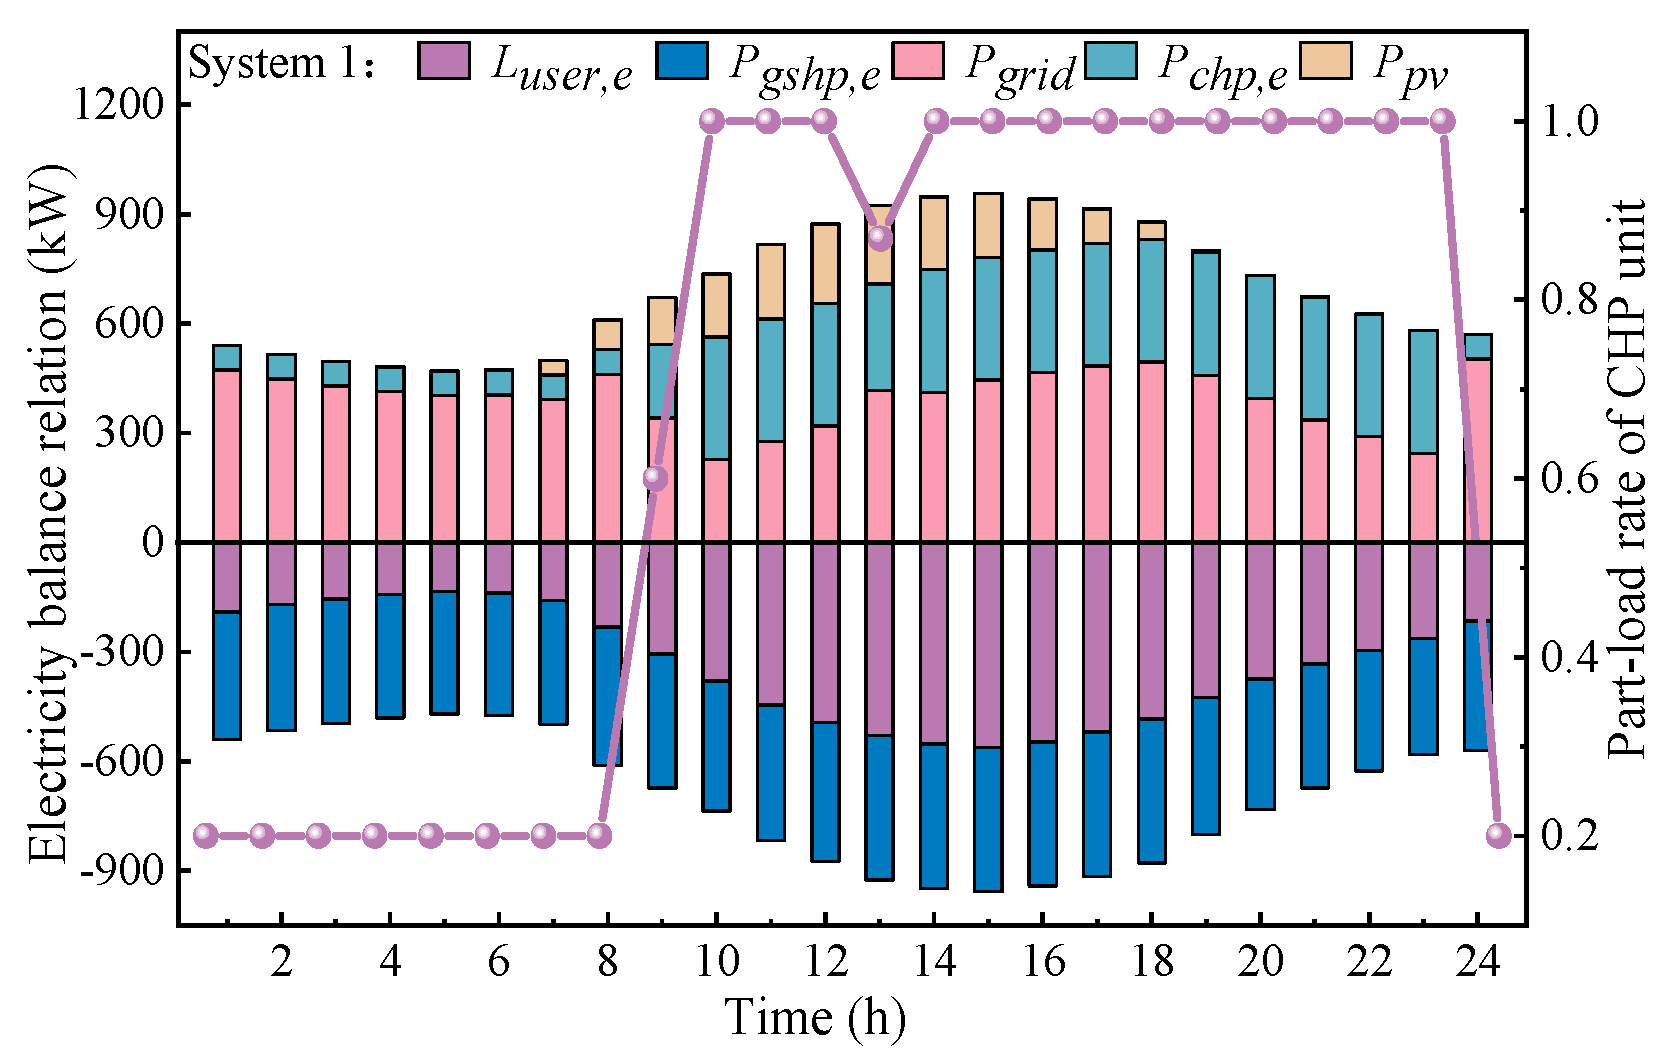
The energy utilization cost directly affects the operational performance of RIESs. To analyze the influence of energy storage devices on the operating cost, this paper first calculates the electric load supply-demand relationship and the part-load ratio of the CHP unit in System 1 under design operating conditions. As seen from Figure 6, during the low tariff hours, the grid power consumption is larger than gas-fired generation, and the CHP unit is at the minimum part-load ratio. However, the CHP unit is operating at full load during other hours. This shows that the electricity cost from the grid is less than the utilization cost of gas during the low tariff hours, while during other hours, the electricity cost from the grid is greater than the utilization cost of gas.
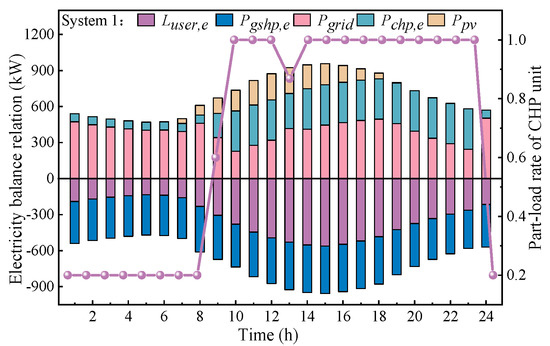
Figure 6.
Electric load supply−demand relationship and part-load rate of CHP unit in System 1.
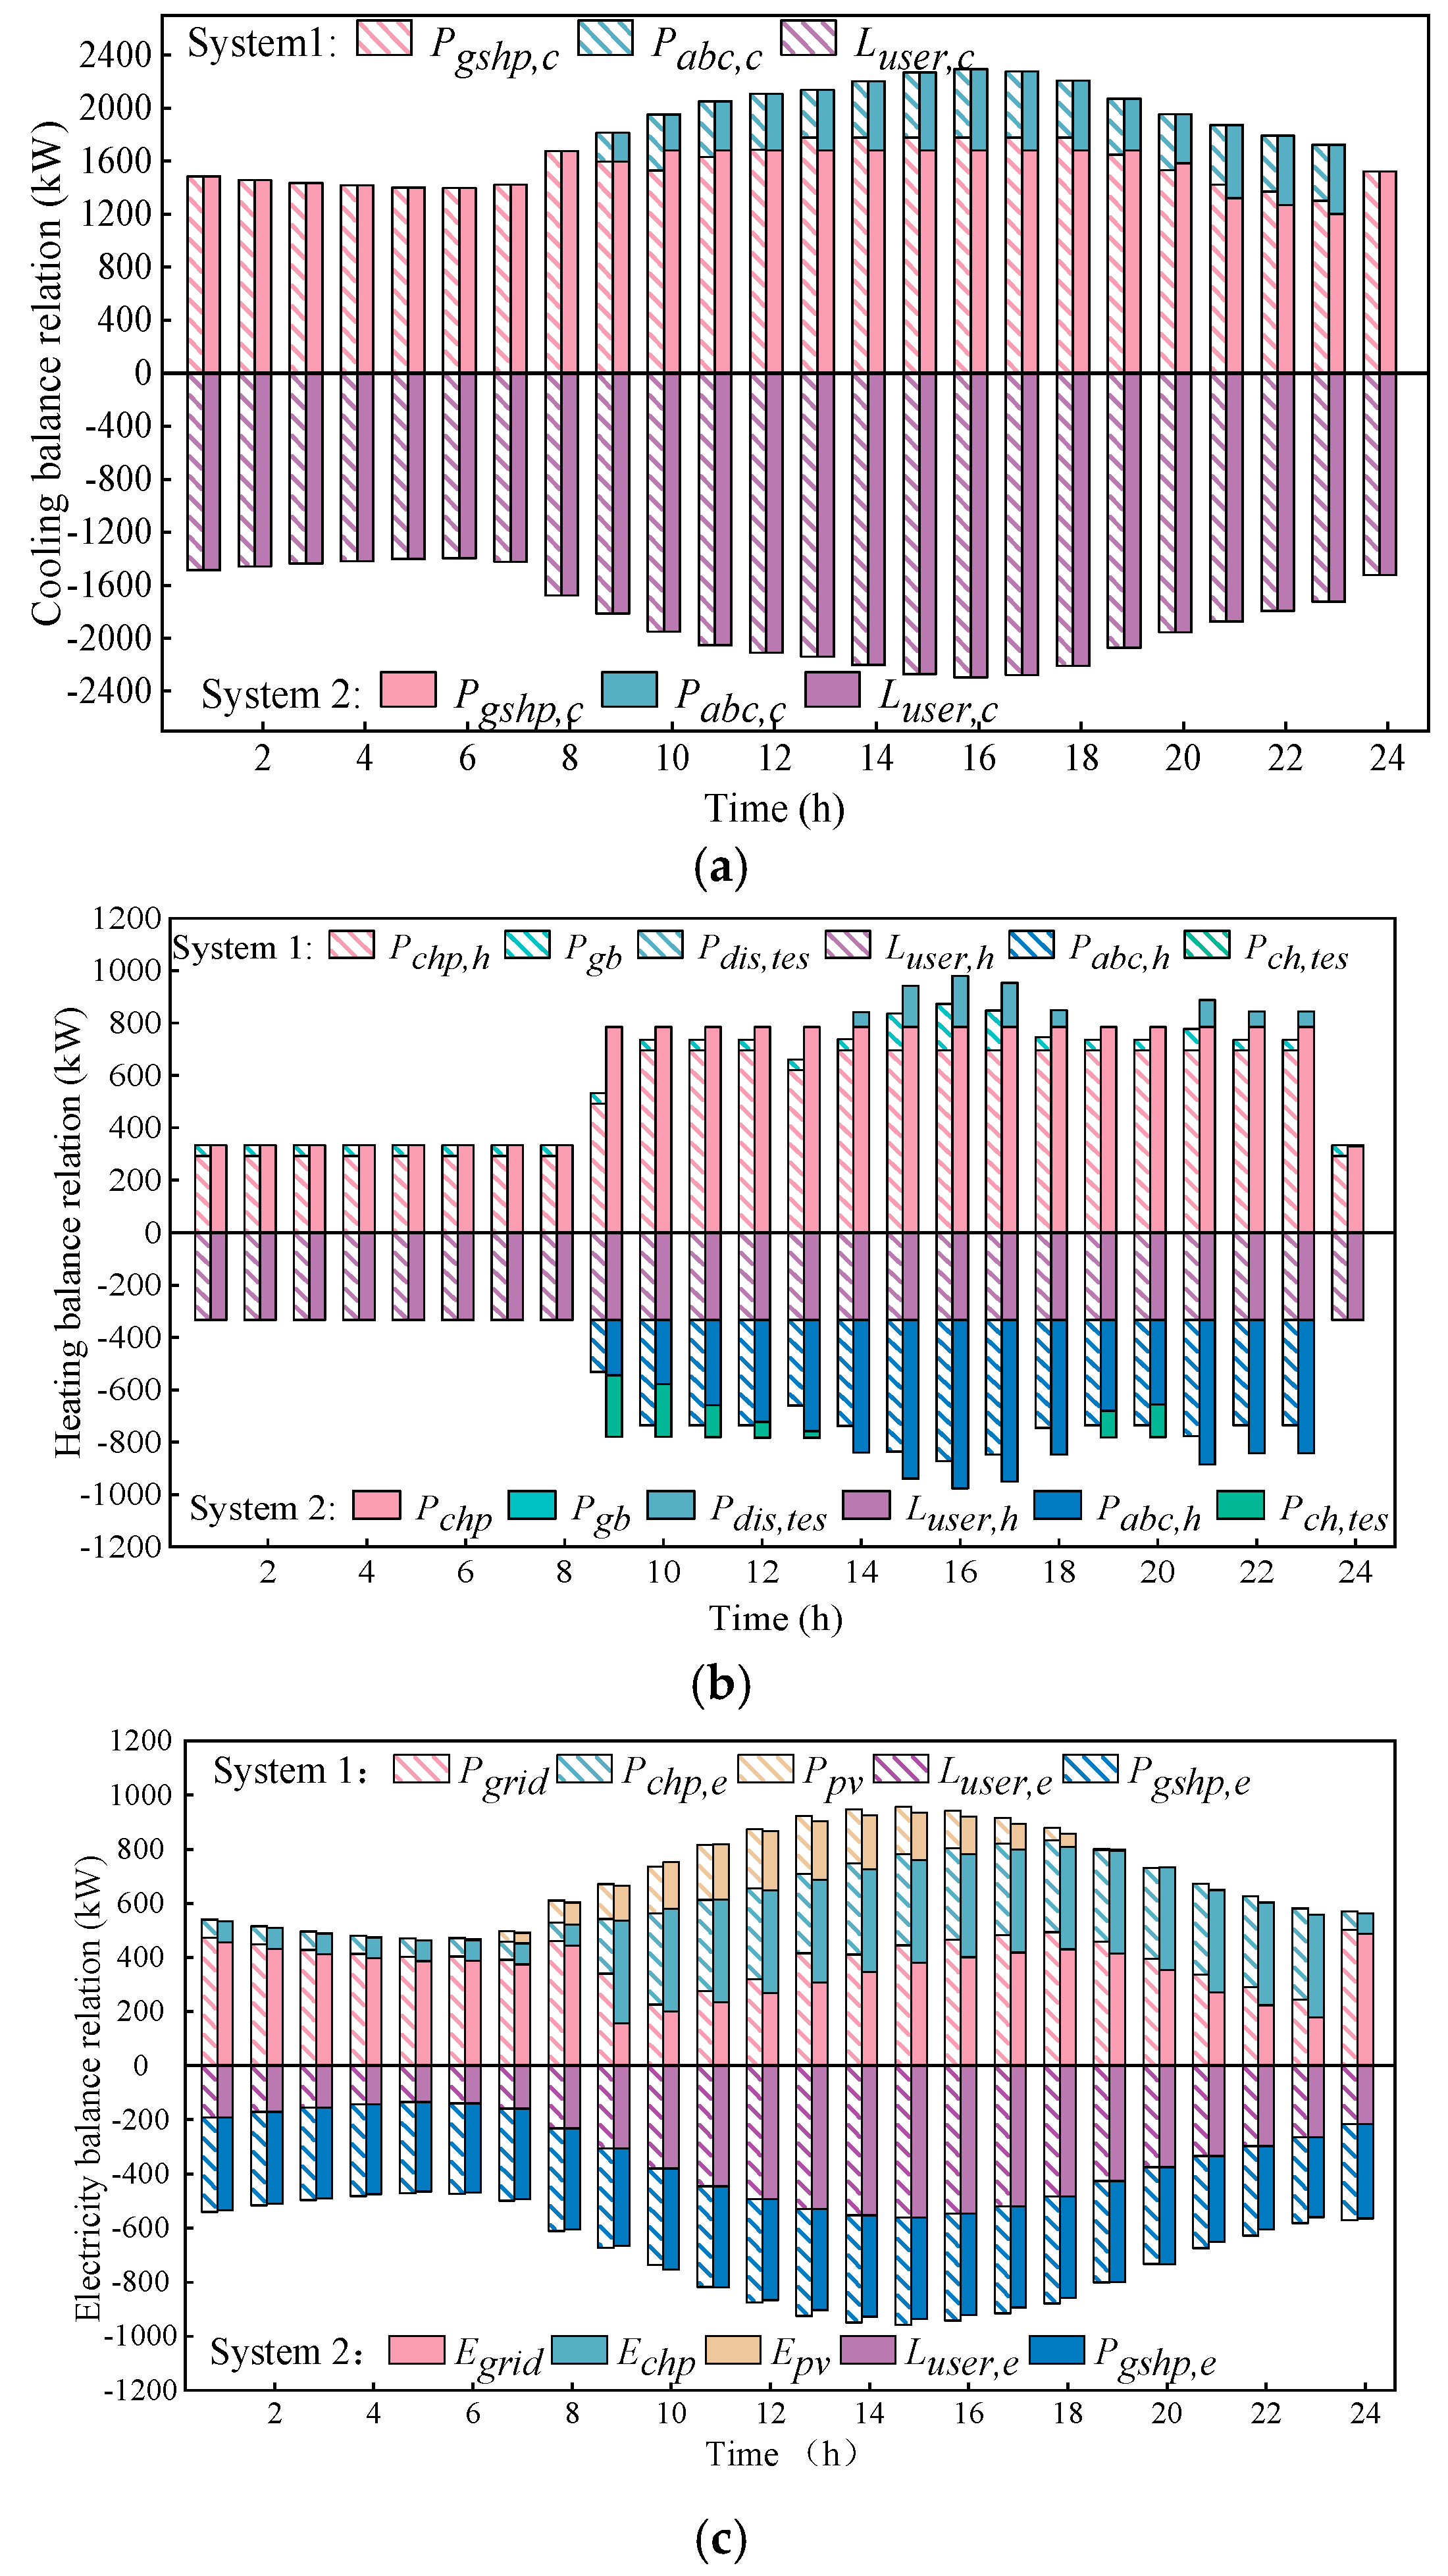
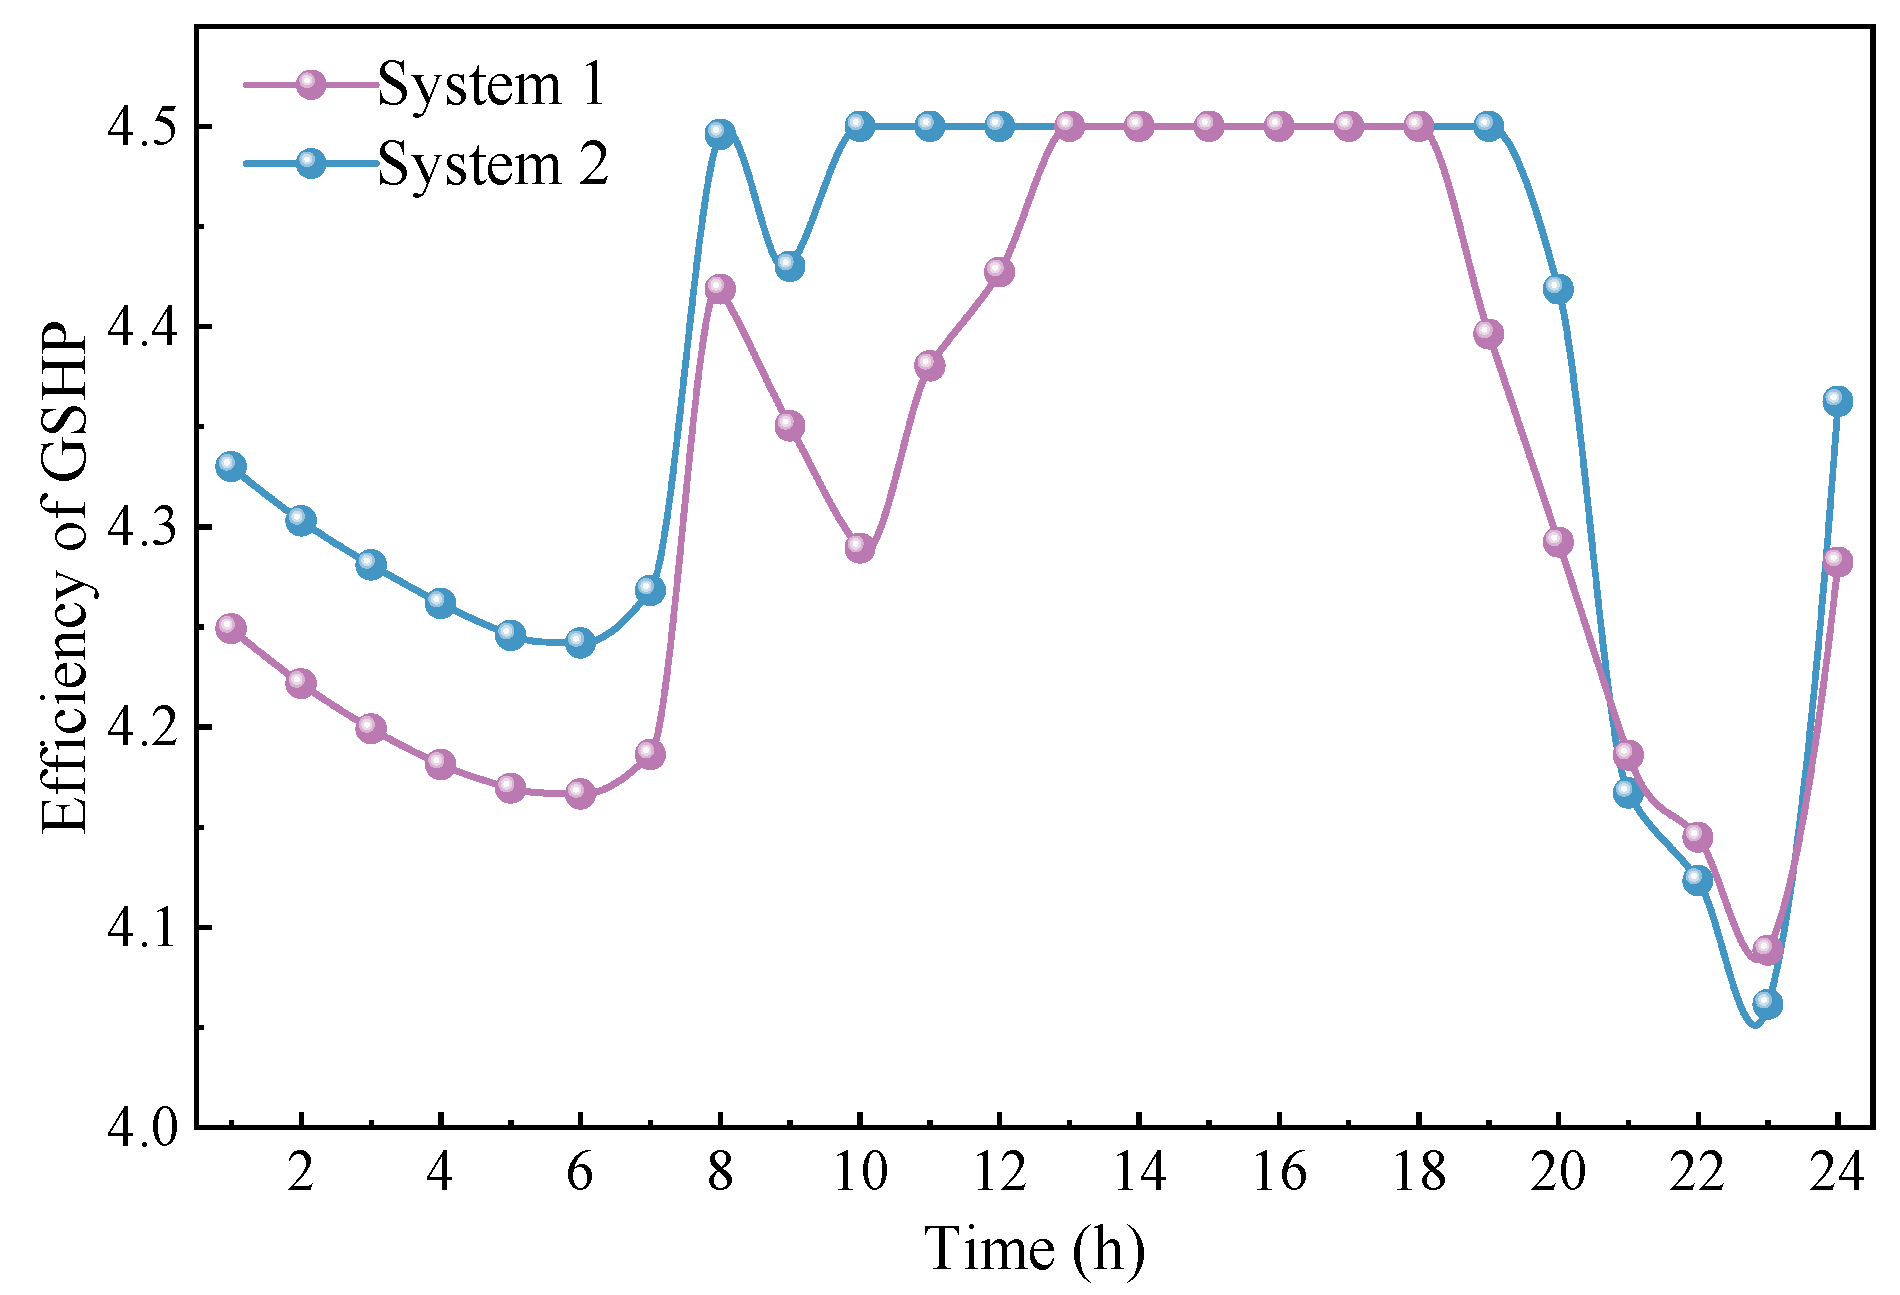
On the premise that the difference in energy utilization cost is known, this paper compares the scheduling process of System 1 and System 2 under the design conditions, as displayed in Figure 7. Figure 7a depicts the cooling load supply-demand relationship of the two systems. First, during the low tariff hours, the cooling load of the two systems is gratified by the GSHP. During other hours, the cooling load is met by the GSHP and ABC. However, the difference in equipment capacity makes the cooling power of the GSHP in System 2 less than that in System 1. Secondly, as seen in Figure 8, the operating efficiency of the GSHP in System 2 is greater than in System 1. The electric load of System 2 is less than System 1 due to the higher operating efficiency and lower cooling power. As shown in Figure 7b, the heating load of System 1 is gratified by the CHP unit and the gas boiler, while the heating load of System 2 is gratified by the CHP unit under the action of the TES device. This ensures the efficient use of gas while avoiding the use of the gas boiler in System 2. When combined with the relationship between supply-demand of electric load shown in Figure 7c, the larger capacity of the CHP unit can effectively reduce the power purchased from the grid during other hours for System 2. Based on the above analysis, the TES device can improve the overall energy efficiency of System 2 and reduce the electric load. Moreover, it increases the power generation of the CHP unit and reduces the grid power consumption, especially during other hours. Therefore, the carbon tax and operating costs of System 2 are less than System 1.
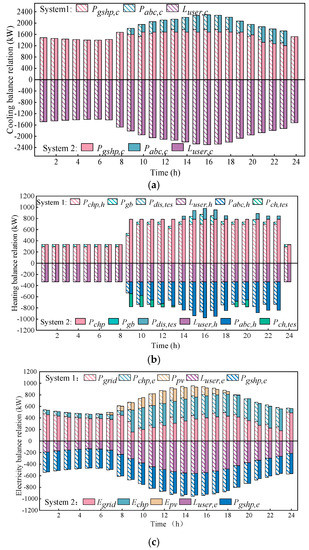
Figure 7.
Scheduling process of System 1 and System 2 in design conditions: (a) Cooling load; (b) Heating load; (c) Electric load.
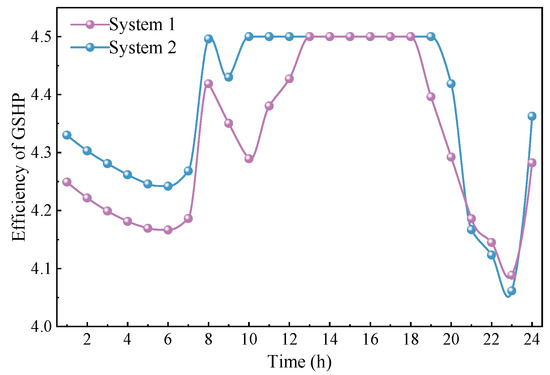
Figure 8.
The efficiency of GSHP in System 1 and System 2.
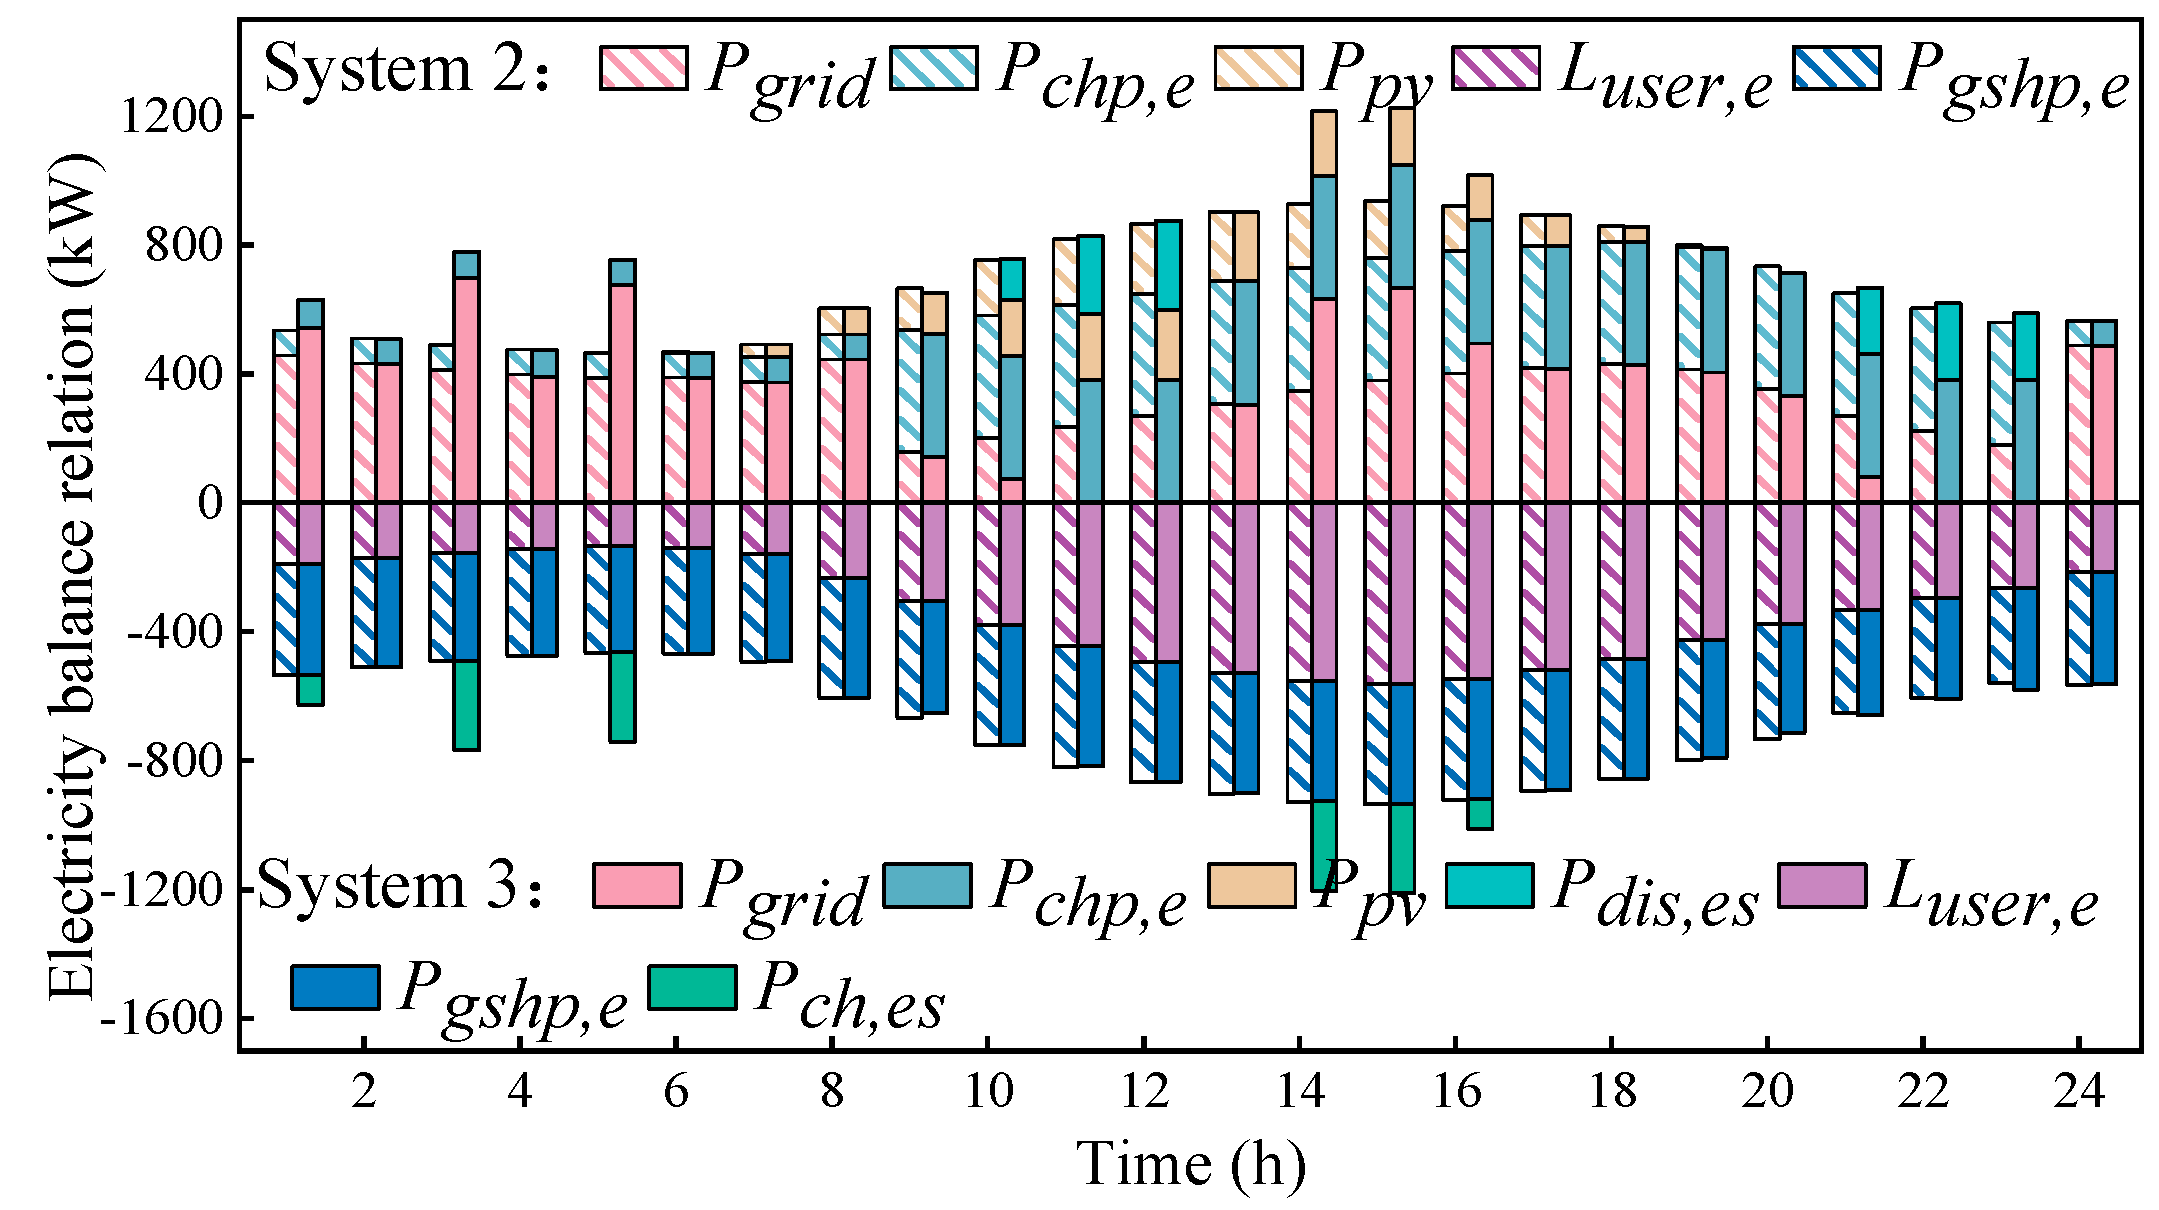
To analyze the difference between the impact of the TES and EES devices on RIESs, this paper compares the electric load supply-demand relationship in System 2 and System 3 under the design conditions, as illustrated in Figure 9. First, the smaller capacity of the GSHP makes the electric load of System 3 less than that of System 2, while the larger CHP unit increases the power generation of the CHP unit in System 3. However, the carbon tax of System 3 is slightly less than that of System 2 due to the slight capacity difference between the GSHP and CHP units between System 2 and System 3. Secondly, the EES device can increase the grid power consumption during flat and valley hours and reduce the grid power consumption during high and peak hours. The difference in grid power consumption during different hours makes the operating cost of System 3 less than that of System 2.
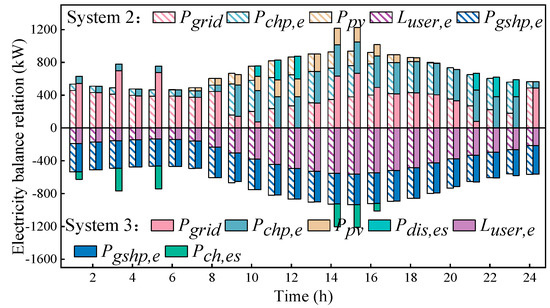
Figure 9.
Electricity scheduling process of system 2 and system 3.
4.3. System Operation Result and Analysis
4.3.1. Calculation of Operating Load
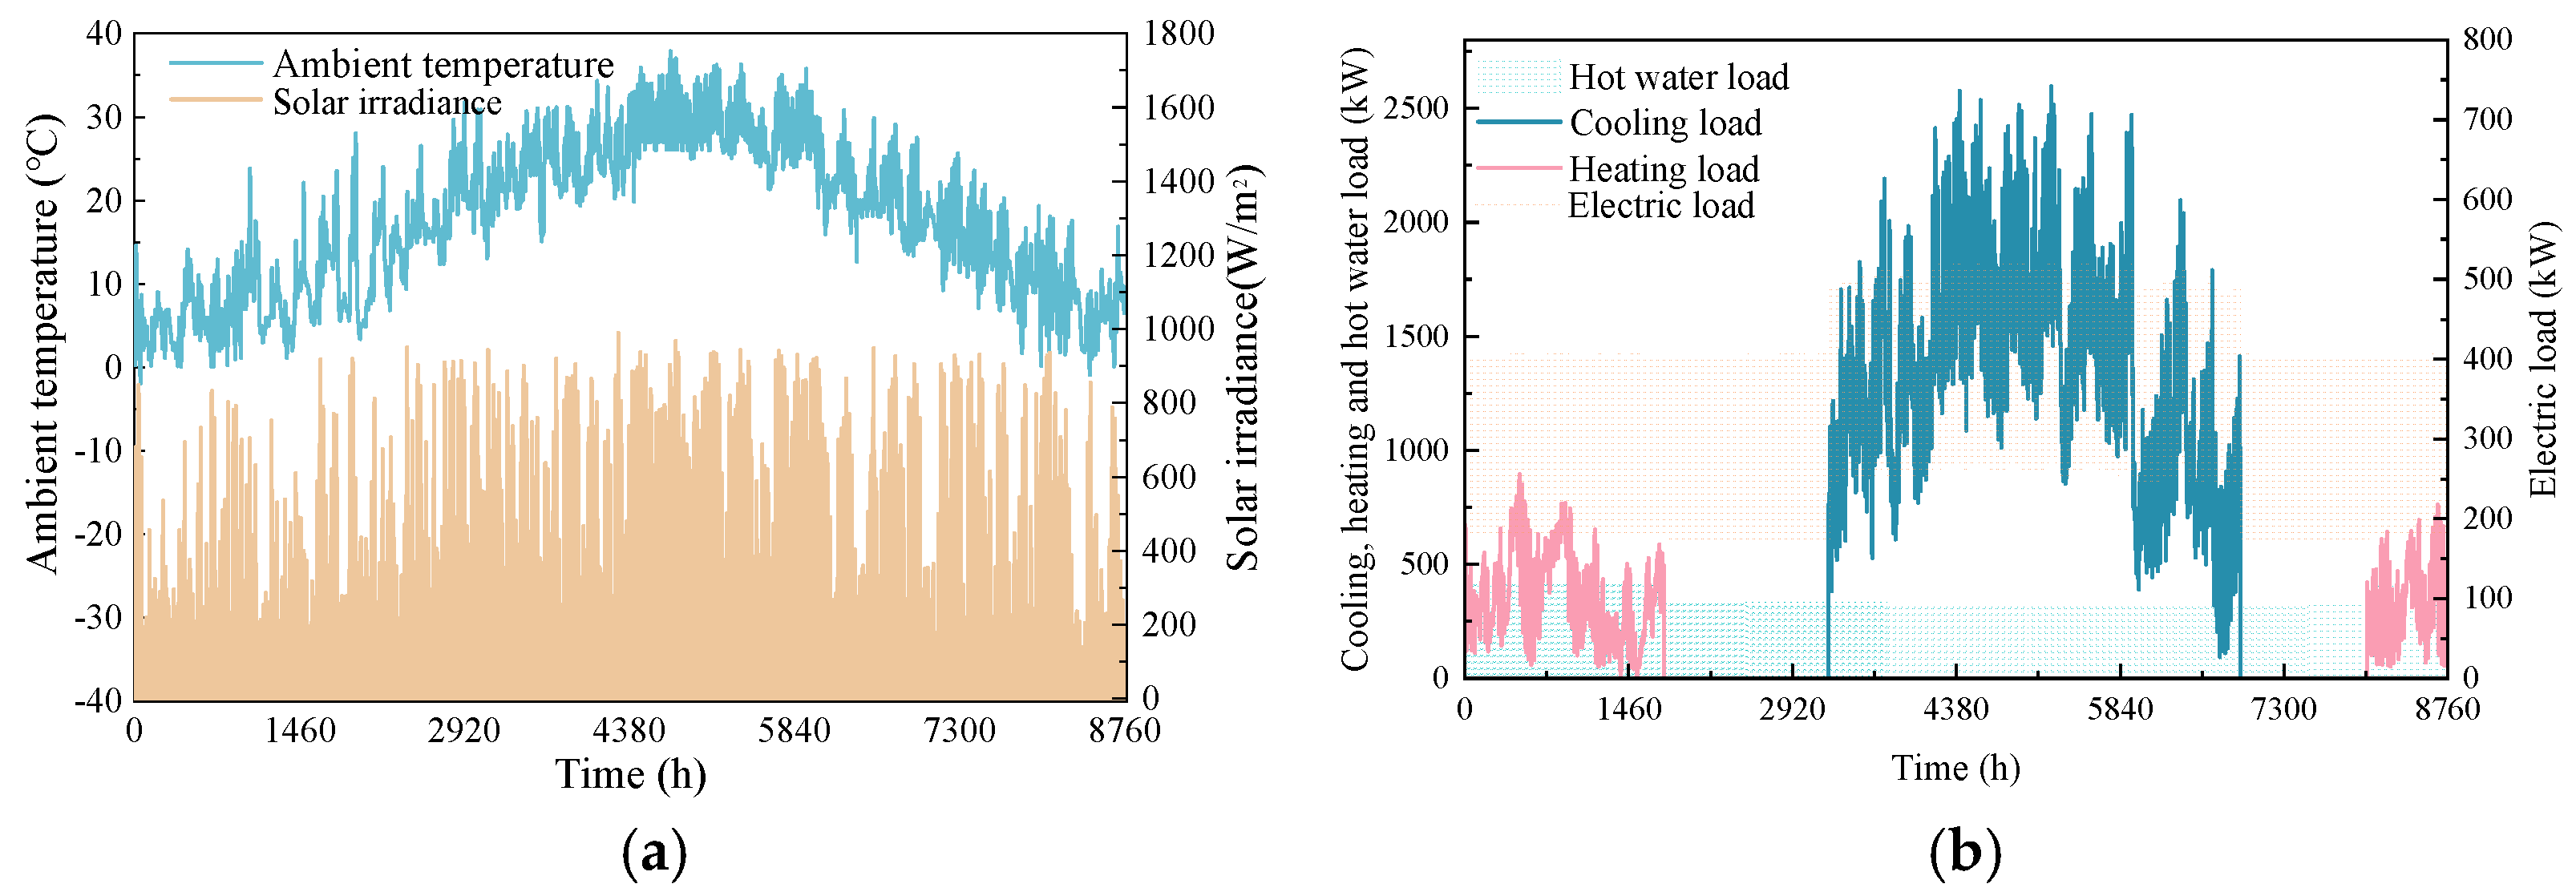
The purpose of optimization design is to improve the operational performance of RIESs. To compare the operational performance of the three systems, the annual operating load was calculated by Energy Plus based on the typical annual outdoor meteorological parameters shown in Figure 10a, as shown in Figure 10b. In Changsha, which is hot in summer and cold in winter, the cooling load of the building is much greater than the heating load. Under summer operating conditions, the system cooling load is the building cooling load, and the heating load is the domestic hot water load. However, under winter operating conditions, the system heating load includes the building heating load and domestic hot water load. In addition, since the design parameters are determined by the method of non-guarantee days, the operating load may be greater than the design load most of the time. However, to ensure the feasibility of operation optimization, this study only considers days when the operating load is less than or equal to the design load.
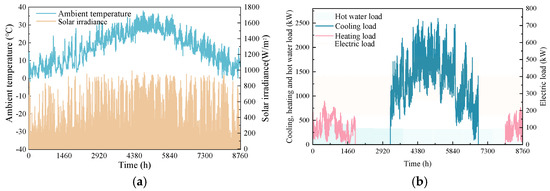
Figure 10.
Outdoor parameters and building load under the operating conditions: (a) Annual outdoor meteorological parameters; (b) Building load under operating conditions.
4.3.2. Operation Results
Based on the above operating loads, the carbon taxes, operating costs, and total costs of the three systems are calculated under winter and summer operating conditions, and the results are shown in Table 9. Under the summer operating conditions, the carbon tax, operating cost, and total costs of System 2 and System 3 are less than those of System 1. Compared with the carbon tax, operating cost, and total cost of System 1, the corresponding costs in System 2 are reduced by 3.2%, 1.5%, and 0.3%, respectively. Different from System 2, since the carbon tax of System 3 is larger than that of System 2, the carbon tax reduction rate of System 3 compared with System 1 is smaller, only 2.7%. However, the EES device can significantly reduce the operating cost of System 3, which results in a 6.2% reduction in the operating cost of System 3 compared to System 1. Affected by the difference in building loads between winter and summer, the carbon taxes, operating costs, and total costs of the three systems under winter operating conditions are less than those under summer operating conditions. Under winter operating conditions, the carbon tax, operating cost, and total cost reduction rates of System 2 compared with System 1 are greater, whose values are 5.5%, 7.3%, and 2.8%, respectively. Similar to the summer operating conditions, System 3 can significantly reduce operating costs compared to System 2 but can also increase its carbon tax. Therefore, under operating conditions, compared with System 1, the TES device can significantly reduce the carbon tax, operating cost, and total cost of System 2, while the EES device can reduce the operating cost of System 3 even more significantly.

Table 9.
Costs of three systems under winter and summer operating conditions.
4.3.3. Operation Result Analysis
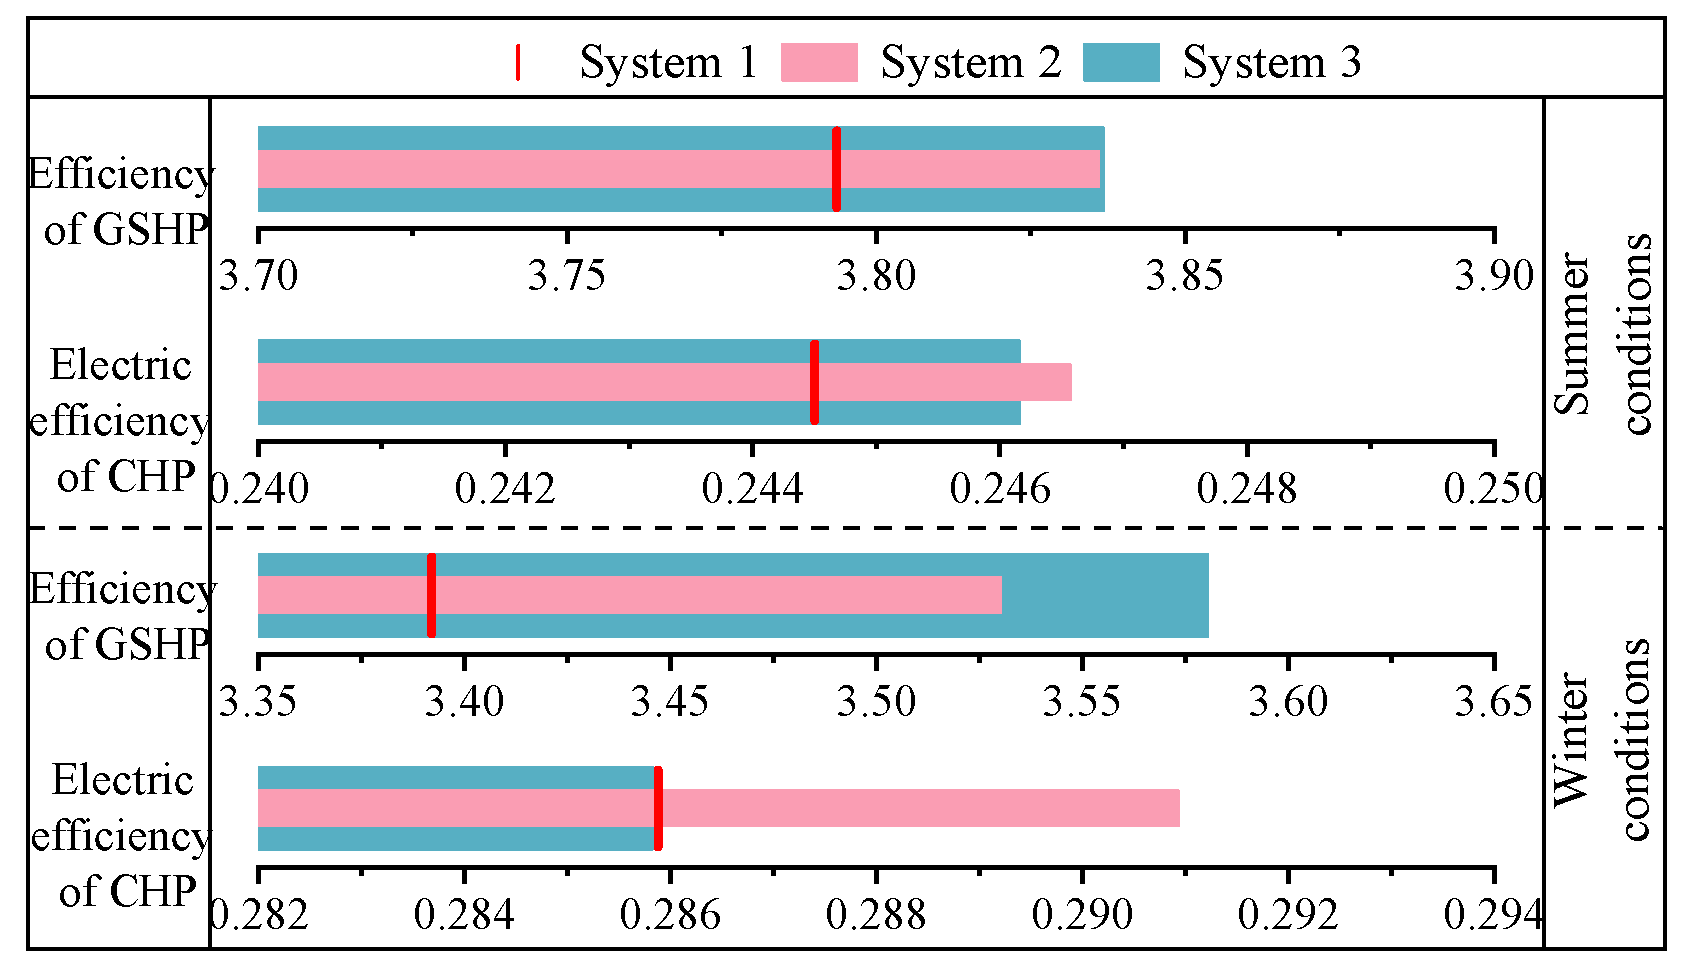
According to the analysis of the design condition results, the performance difference of RIESs is mainly affected by energy consumption and the consumption of different types of energy. To analyze the energy consumption of the three systems, this paper compares the average operation efficiency of the GSHPs and CHP units under the operating conditions, as shown in Figure 11. Firstly, under winter and summer operating conditions, the average operation efficiency of the GSHP in System 1, System 2, and System 3 increases sequentially due to the influence of energy storage devices. However, there is little difference between the average operation efficiency of the GSHP in System 2 and System 3. Secondly, the average operation efficiency of the CHP unit in System 2 is greater than in System 1 and System 3, especially in winter operating conditions. This shows that the TES device can significantly improve the operation efficiency of the GSHP and the CHP unit. In addition, the average operation efficiency of the CHP unit in System 3 is greater than that in System 1 under summer operating conditions, while under winter operating conditions, the average operating efficiency of the CHP unit in System 3 is approximately the same as that in System 1. The higher the average operation efficiency of the GSHP and the CHP units, the lower the energy consumption. Therefore, under the operating conditions, the energy consumption of System 2 and System 3 is less than that of System 1.
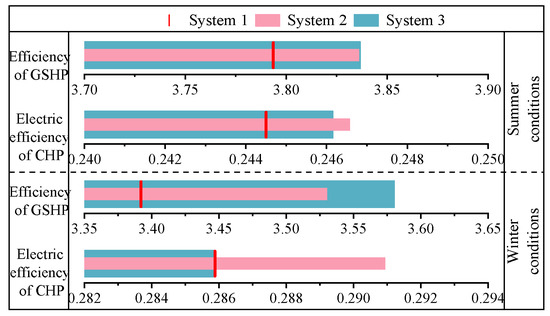
Figure 11.
The average efficiency of GSHPs and CHP units under two operating conditions.
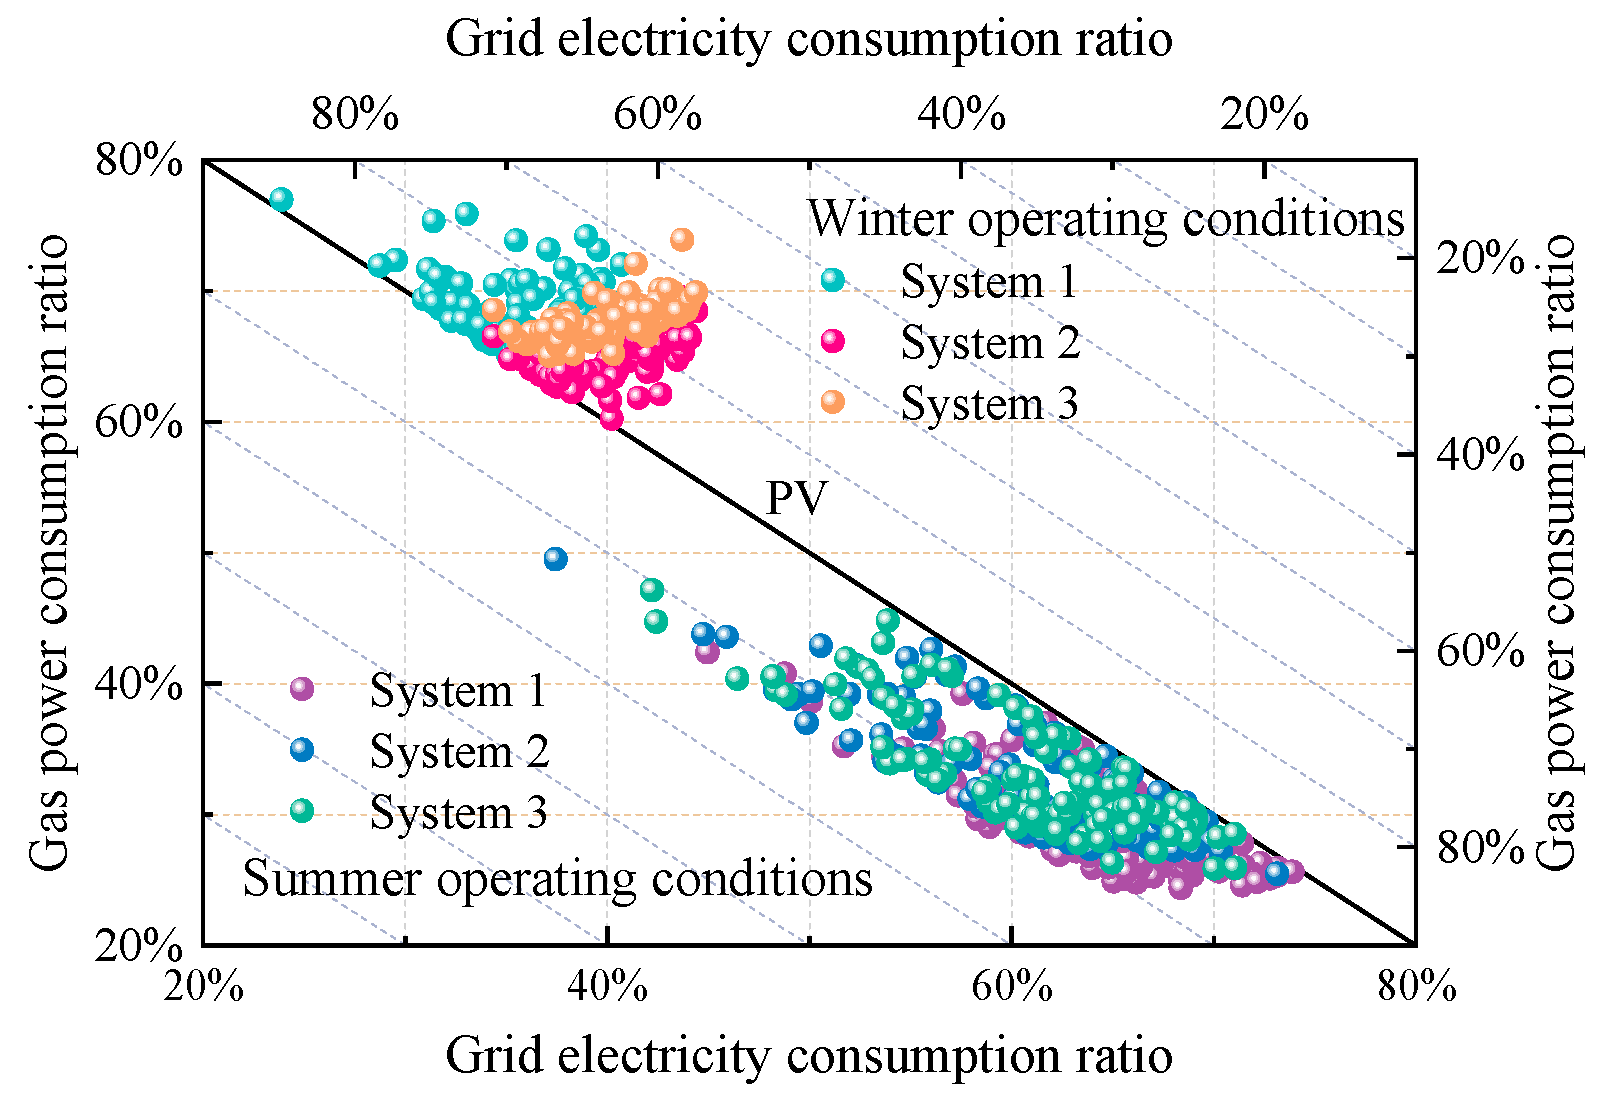
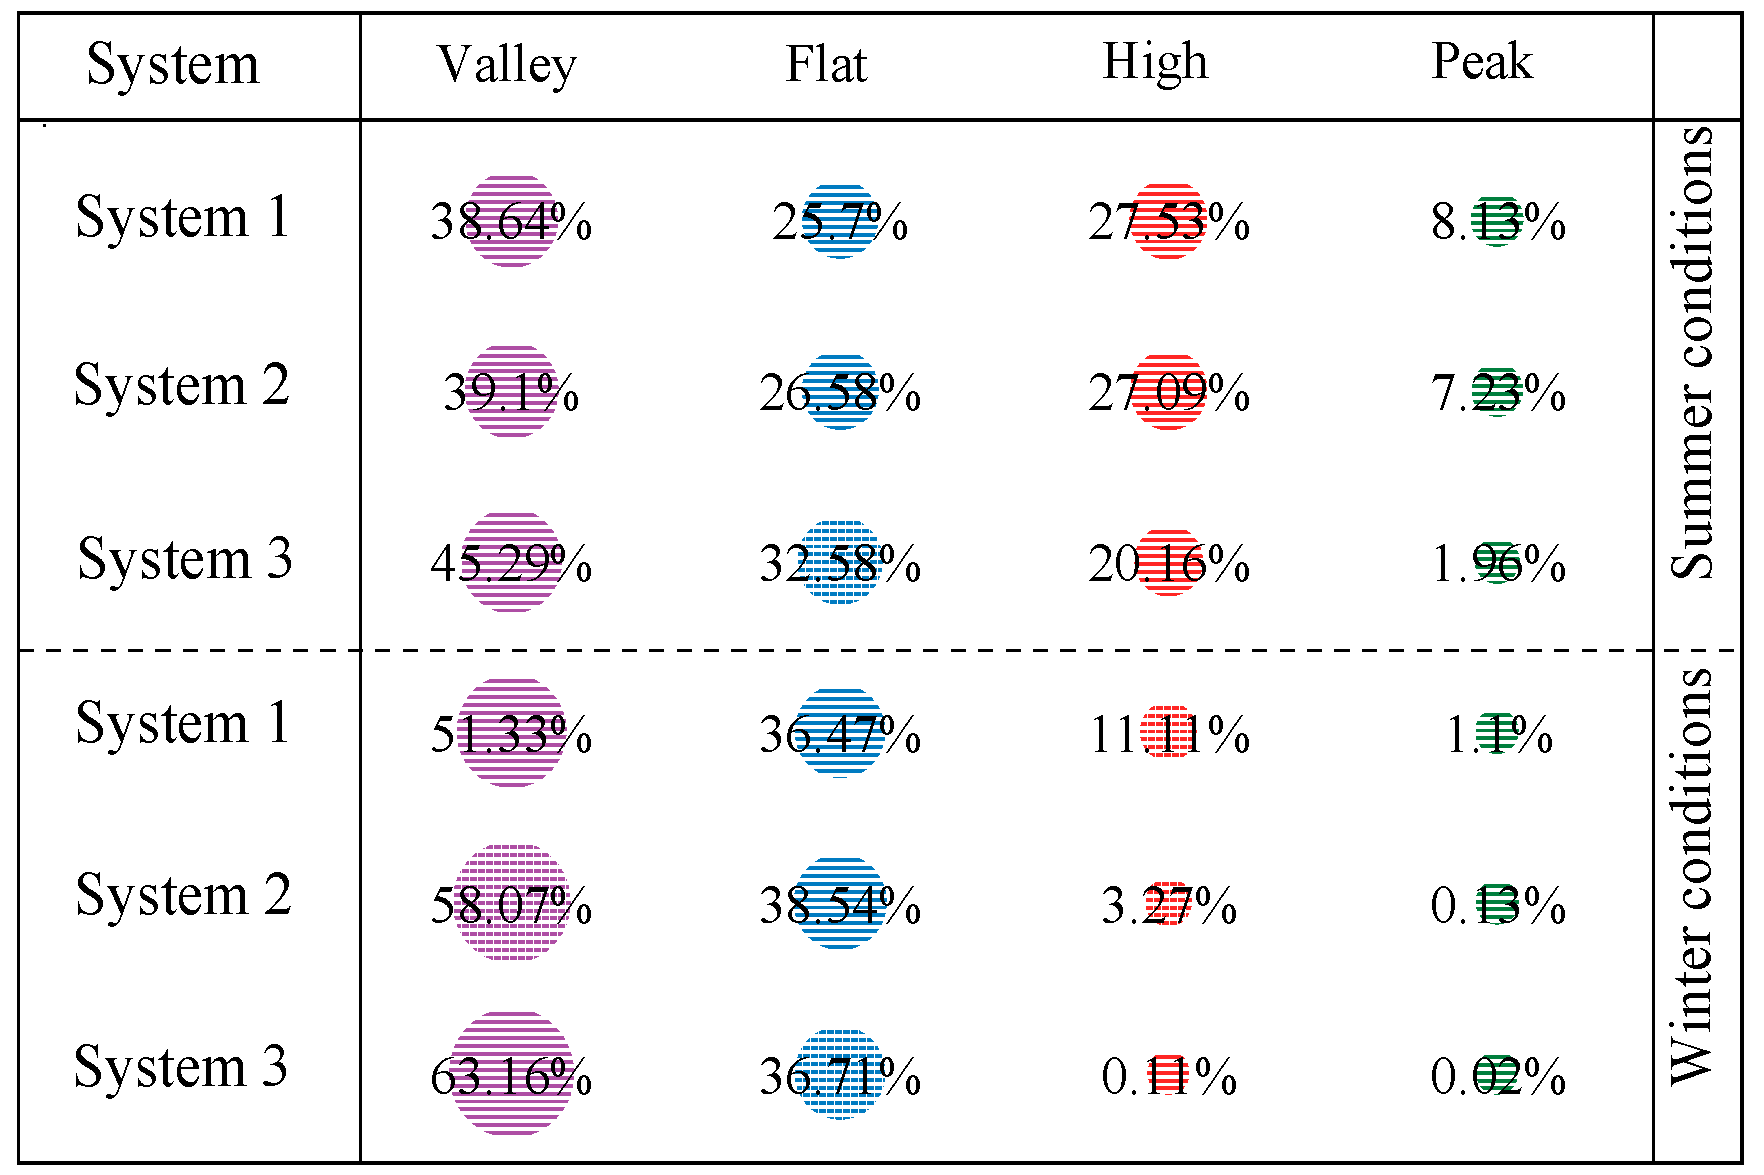
In the RIESs, carbon tax not only depends on the energy consumption of systems but is also affected by the ratio of different energy consumptions. To this end, different power consumption ratios of the three systems under winter and summer operating conditions are counted in this paper, and the results are shown in Figure 12. Under summer and winter operating conditions, the ratio of grid power consumption in System 1 is greater than that of System 2 and System 3; hence the carbon tax of System 2 and System 3 is less than that of System 1. Although there is a slight difference in the ratio of grid power consumption between System 2 and System 3 under summer operating conditions, the average operation efficiency of the CHP unit in System 3 is lower than that in System 2. Therefore, under summer operating conditions, the carbon tax of System 3 is slightly larger than System 2. Different from the summer operating conditions, the grid power consumption ratio of System 2 is significantly smaller than for System 3 under the winter operating conditions. As a result, the carbon taxes of System 2 and System 3 are greater than that of System 1, especially System 2.
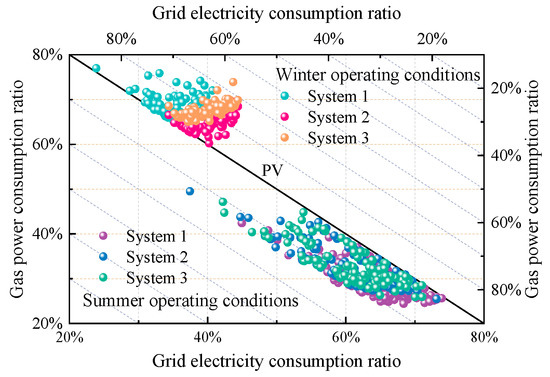
Figure 12.
Different power consumption ratios under two operating conditions.
The system’s operating cost is closely related to the TOU power price. To analyze the operating cost difference between the three systems, this paper draws the power consumption ratio of the three systems under TOU price hours, as shown in Figure 13. Under the summer operating conditions, the grid power consumption ratios of System 2 and System 3 during high and peak hours are less than that of System 1, especially for System 3, which accounts for only 22.12% during high and peak hours. Similar to the summer operating conditions, the power consumption ratios of System 2 and System 3 during high and peak hours are less than that of System 1 under winter operating conditions. However, under winter operating conditions, the difference in the grid power consumption ratio between System 1 and System 2 is greater than that between System 2 and System 3 during high and peak hours. Therefore, under winter and summer operating conditions, the operating costs of System 2 and System 3 are greater than that of System 1, and the operating cost of System 3 is the lowest, especially under winter operating conditions.
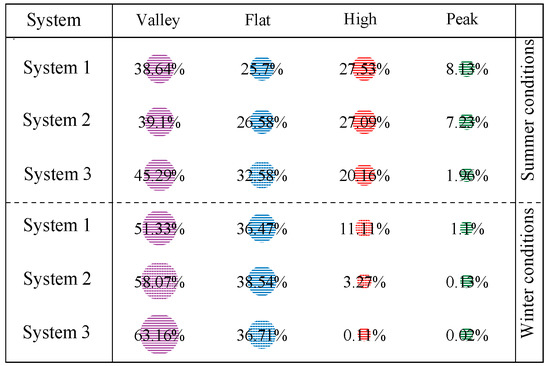
Figure 13.
The ratio of grid power consumption under the TOU power price.
The above analysis shows that the carbon taxes and operating costs of System 2 and System 3 are less than those of System 1 under winter and summer operating conditions due to the impact of the average efficiency of the equipment, the ratio of different energy consumptions, and the grid power consumption ratio under the TOU power price. The smaller carbon tax and operating cost make the total cost of Systems 2 and System 3 less than that of System 1. However, affected by the equipment cost, the total cost reduction rate difference between System 2 and System 3 compared with System 1 is not so obvious. In addition, under winter operating conditions, the total cost of System 3 is greater than that of System 2 due to the lower operating cost difference between System 2 and System 3.
4.4. Uncertainty Analysis of Energy Price
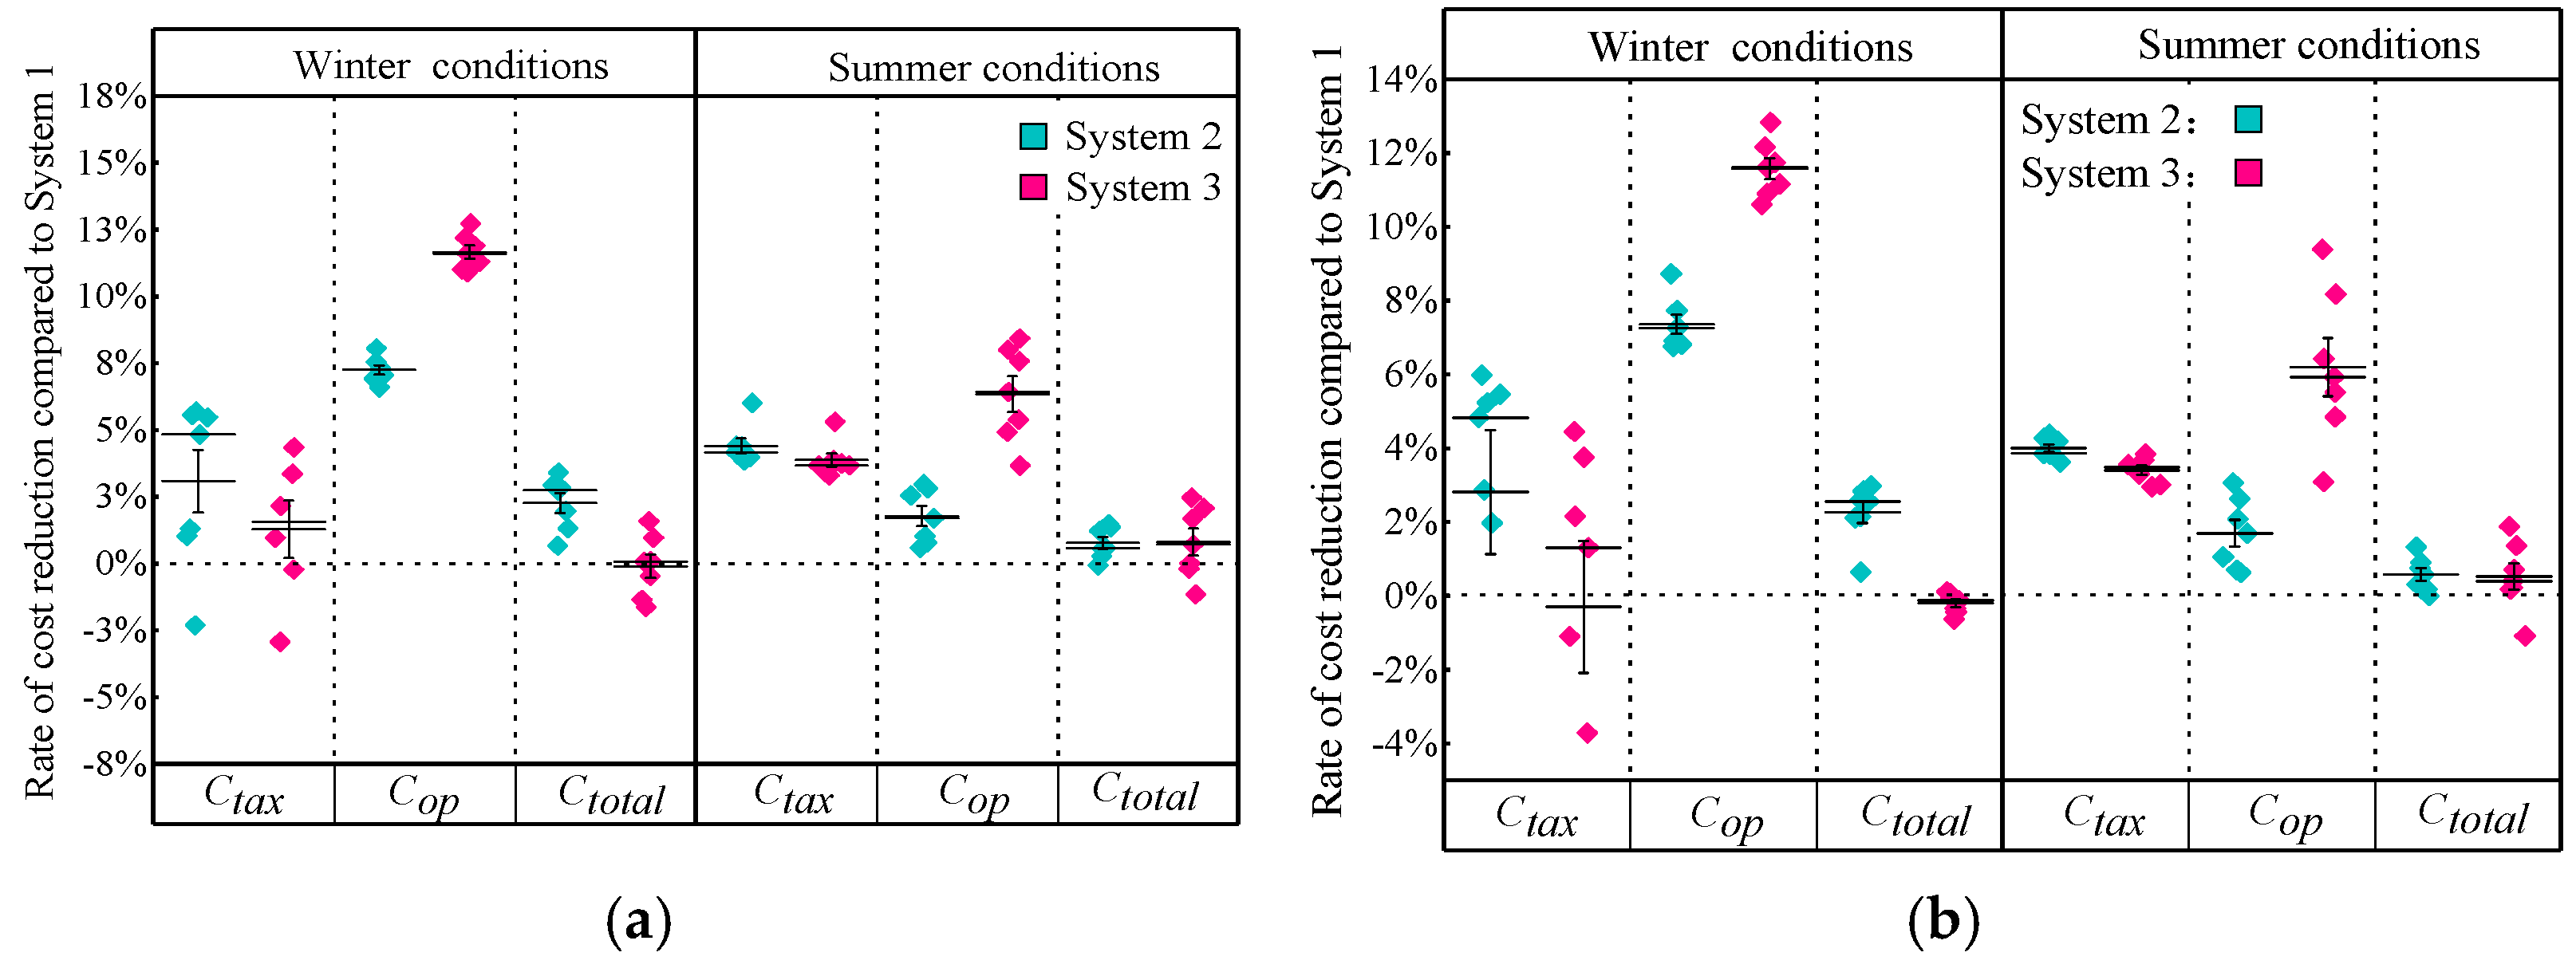
In the actual operation process, the price of grid power and gas directly affected the operation result of the system. To explore the impact of energy price uncertainty on system operation results, this study increases or decreases the energy prices to ±30% in a 10% step, based on the energy prices in the design conditions. The three systems are optimized for operation according to different energy prices. Based on optimization results, the cost reduction rates of System 2 and System 3 compared with System 1 are calculated, as shown in Figure 14. In the case of changes in energy prices, the reduction rates of the carbon tax, operating cost, and total cost of System 2 compared with System 1 are greater than zero. Different from System 2, the operating cost reduction rate of System 3 compared with System 1 is larger, while the carbon tax and total cost reduction rates are lower. Even under partial energy prices, the carbon tax and total cost of System 3 are greater than they are for System 1. Under different energy prices, the TES device can effectively reduce the operating cost, carbon tax, and total cost of the RIES, while the EES device can significantly reduce the system operating cost.
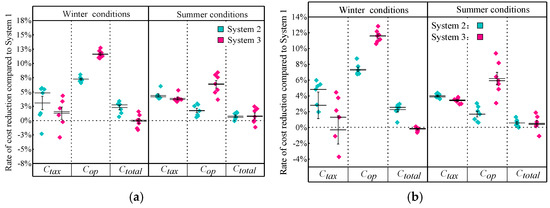
Figure 14.
Cost reduction rates of system 2 and system 3 compared with system 1 under changes in electricity and gas prices: (a) Affected by changes in electricity prices; (b) Affected by changes in gas prices.
5. Conclusions
The purpose of this study is to explore the impact of energy storage devices on the optimal design and operation of RIESs. For this purpose, a bi-level dynamic optimization model was first established based on the dynamic equipment model. Then, the bi-level dynamic optimization model was used to optimize the design of RIESs with different energy storage devices, and the optimization results are System 1, System 2, and System 3, respectively. According to the optimization results, the impact of energy storage devices on system performance is compared and analyzed. The main conclusions of this study include the following three points:
- Compared with System 1 without energy storage devices, energy storage devices can increase the capacity of CHP units and ABCs in System 2 and System 3 and reduce the capacity of GSHPs and gas boilers, especially the TES device. Affected by the equipment capacity, the equipment cost increase rates of System 2 and System 3 compared with System 1 are 5.7% and 17.8%, respectively. This shows that the EES device will significantly increase the equipment cost of System 3.
- The difference in equipment capacity affects not only the equipment cost but also the operation performance of the system. Under the design conditions, higher equipment operation efficiency and lower grid power consumption make the operation cost, carbon tax, and total cost of System 2 lower than that of System 1, with reductions of 2.9%, 5.5%, and 1.5%, respectively. Under the influence of TOU electricity price, the EES device can significantly reduce the operating cost of System 3, which is 5.7% lower than that of System 1.
- Under the operating conditions, the operating cost, carbon tax, and total cost of System 2 and System 3 remain lower than that of System 1, even if the energy price changes. Therefore, in the design of future RIESs, energy storage devices, especially TES devices, can be used to improve the energy efficiency of RIESs and reduce the operation cost and total cost.
Author Contributions
Conceptualization, B.J.; methodology, B.J.; software, B.J. and Z.L.; validation, B.J. and Z.L.; formal analysis, B.J. and Z.L.; investigation, B.J.; data curation, B.J. and Z.L.; writing—original draft preparation, B.J. and Z.L.; writing—review and editing, B.J. and Y.L.; visualization, B.J.; supervision, B.J.; project administration, B.J. All authors have read and agreed to the published version of the manuscript.
Funding
This research received no external funding.
Institutional Review Board Statement
Not applicable.
Informed Consent Statement
Not applicable.
Data Availability Statement
Not applicable.
Conflicts of Interest
The authors declare no conflict of interest.
Nomenclature
| Nomenclature | Greek symbols | ||
| Abbreviation | η | Charging and discharging efficiency | |
| A | Area | ϑ | Energy price/ carbon tax price |
| ABC | Absorption chiller | α | Energy storage ratios |
| Cap | Capacity | λ | Carbon dioxide emissions factor |
| CCHP | Combined cooling heating and power | γ | Charging and discharging ratios |
| CHP | Combined heating and power | Subscript | |
| COP | Coefficient of performance | a | Ambient |
| EES | Electrical energy storage | abc | Absorption chiller |
| EH | Energy hub | c | Cooling |
| FEL | Following electric load | ch | Charge |
| FHL | Following hybrid electric-heating load | chp | Combined heating and power |
| FOF | Following objective function | carbon dioxide | |
| FSF | Following system flexibility | dis | Discharge |
| FTL | Following thermal load | e | Electricity |
| GA | Genetic algorithm | equ | Equipment |
| GB | Gas boiler | ees | Electrical energy storage |
| GSHP | Ground source heat pump | gas | Natural gas |
| HES | Hydrogen energy storage | gb | Gas boiler |
| L | Load | gshp | Ground source heat pump |
| P | Power | grid | Grid power |
| P-G | Power-gas | h | Heating |
| PLF | Part-load ratio | inv | Initial investment |
| PLR | Part-load factor | k | Device type |
| PV | Photovoltaic | op | Operating |
| RIES | Regional integrated energy system | pv | Photovoltaic |
| S | Energy storage device status | r | Rated |
| SES | Share energy storage | tes | Thermal energy storage |
| t | Temperature/Time | Superscript | |
| TES | Thermal energy storage | max | Maximum |
| TOU | Time-of-use | min | Minimum |
References
- Zhang, Q.; Ren, Z.; Ma, R.; Tang, M.; He, Z. Research on Double-Layer Optimized Configuration of Multi-Energy Storage in Regional Integrated Energy System with Connected Distributed Wind Power. Energies 2019, 12, 3964. [Google Scholar] [CrossRef]
- Al-Najjar, H.M.T.; Mahdi, J.M.; Bokov, D.O.; Khedher, N.B.; Alshammari, N.K.; Opulencia, M.J.C.; Fagiry, M.A.; Yaïci, W.; Talebizadehsardari, P. Improving the Melting Duration of a PV/PCM System Integrated with Different Metal Foam Configurations for Thermal Energy Management. Nanomaterials 2022, 12, 423. [Google Scholar] [CrossRef] [PubMed]
- Guo, J.; Liu, Z.; Wu, X.; Wu, D.; Zhang, S.; Yang, X.; Ge, H.; Zhang, P. Two-Layer Co-Optimization Method for a Distributed Energy System Combining Multiple Energy Storages. Appl. Energy 2022, 322, 119486. [Google Scholar] [CrossRef]
- Wei, W.; Guo, Y.; Hou, K.; Yuan, K.; Song, Y.; Jia, H.; Sun, C. Distributed Thermal Energy Storage Configuration of an Urban Electric and Heat Integrated Energy System Considering Medium Temperature Characteristics. Energies 2021, 14, 2924. [Google Scholar] [CrossRef]
- Ben Khedher, N.; Bantan, R.A.; Kolsi, L.; Omri, M. Performance Investigation of a Vertically Configured LHTES via the Combination of Nano-Enhanced PCM and Fins: Experimental and Numerical Approaches. Int. Commun. Heat Mass Transf. 2022, 137, 106246. [Google Scholar] [CrossRef]
- Geidl, M.; Koeppel, G.; Favre-Perrod, P.; Klockl, B. Energy Hubs for the Future. IEEE Power Energy Mag. 2007, 5, 24–30. [Google Scholar] [CrossRef]
- Ma, T.; Wu, J.; Hao, L.; Li, D. Energy Flow Matrix Modeling and Optimal Operation Analysis of Multi Energy Systems Based on Graph Theory. Appl. Therm. Eng. 2019, 146, 648–663. [Google Scholar] [CrossRef]
- Ma, T.; Wu, J.; Hao, L.; Lee, W.J.; Yan, H.; Li, D. The Optimal Structure Planning and Energy Management Strategies of Smart Multi Energy Systems. Energy 2018, 160, 122–141. [Google Scholar] [CrossRef]
- Ben Salah, S.; Ben Hamida, M.B. Alternate PCM with Air Cavities in LED Heat Sink for Transient Thermal Management. Int. J. Numer. Methods Heat Fluid Flow 2019, 29, 4377–4393. [Google Scholar] [CrossRef]
- Ben Hamida, M.B.; Hajlaoui, K.; Almeshaal, M.A. A 3D Numerical Analysis Using Phase Change Material for Cooling Circular Light Emitting Diode. Case Stud. Therm. Eng. 2023, 43, 102792. [Google Scholar] [CrossRef]
- Waseem, M.; Lin, Z.; Liu, S.; Sajjad, I.A.; Aziz, T. Optimal GWCSO-Based Home Appliances Scheduling for Demand Response Considering End-Users Comfort. Electr. Power Syst. Res. 2020, 187, 106477. [Google Scholar] [CrossRef]
- Liu, C.; Li, Y.; Wang, Q.; Wang, X.; Chen, C.; Lin, Z.; Yang, L. Optimal Configuration of Park-Level Integrated Energy System Considering Integrated Demand Response and Construction Time Sequence. Energy Rep. 2022, 8, 1174–1180. [Google Scholar] [CrossRef]
- Ding, Y.; Xu, Q.; Yang, B. Optimal Configuration of Hybrid Energy Storage in Integrated Energy System. Energy Rep. 2020, 6, 739–744. [Google Scholar] [CrossRef]
- Deng, Z.G.; Yang, J.H.; Dong, C.L.; Xiang, M.Q.; Qin, Y.; Sun, Y.S. Research on Economic Dispatch of Integrated Energy System Based on Improved Krill Swarm Algorithm. Energy Rep. 2022, 8, 77–86. [Google Scholar] [CrossRef]
- Mansouri, S.A.; Nematbakhsh, E.; Ahmarinejad, A.; Jordehi, A.R.; Javadi, M.S.; Matin, S.A.A. A Multi-Objective Dynamic Framework for Design of Energy Hub by Considering Energy Storage System, Power-to-Gas Technology and Integrated Demand Response Program. J. Energy Storage 2022, 50, 104206. [Google Scholar] [CrossRef]
- Mago, P.; Chamra, L. Analysis and optimization of CCHP systems based on energy, economical, and environmental considerations. Energy Build. 2009, 41, 1099–1106. [Google Scholar] [CrossRef]
- Mago, P.J.; Chamra, L.M.; Ramsay, J. Micro-combined cooling, heating and power systems hybrid electric-thermal load following operation. Appl. Therm. Eng. 2010, 30, 800–806. [Google Scholar] [CrossRef]
- Kang, S.; Li, H.; Liu, L.; Zeng, R.; Zhang, G. Evaluation of a Novel Coupling System for Various Load Conditions under Different Operating Strategies. Energy Convers Manag 2016, 109, 40–50. [Google Scholar] [CrossRef]
- Wang, Y.; Zhang, Y.; Xue, L.; Liu, C.; Song, F.; Sun, Y.; Liu, Y.; Che, B. Research on Planning Optimization of Integrated Energy System Based on the Differential Features of Hybrid Energy Storage System. J. Energy Storage 2022, 55, 105368. [Google Scholar] [CrossRef]
- Duan, Z.; Yan, Y.; Yan, X.; Liao, Q.; Zhang, W.; Liang, Y.; Xia, T. An MILP Method for Design of Distributed Energy Resource System Considering Stochastic Energy Supply and Demand. Energies 2018, 11, 22. [Google Scholar] [CrossRef]
- Zeng, R.; Li, H.; Jiang, R.; Liu, L.; Zhang, G. A Novel Multi-Objective Optimization Method for CCHP-GSHP Coupling Systems. Energy Build. 2016, 112, 149–158. [Google Scholar] [CrossRef]
- Zeng, R.; Zhang, X.; Deng, Y.; Li, H.; Zhang, G. An Off-Design Model to Optimize CCHP-GSHP System Considering Carbon Tax. Energy Convers. Manag. 2019, 189, 105–117. [Google Scholar] [CrossRef]
- Yang, G.; Zhai, X. Optimization and Performance Analysis of Solar Hybrid CCHP Systems under Different Operation Strategies. Appl. Therm. Eng. 2018, 133, 327–340. [Google Scholar] [CrossRef]
- Yang, G.; Zhai, X.Q. Optimal Design and Performance Analysis of Solar Hybrid CCHP System Considering Influence of Building Type and Climate Condition. Energy 2019, 174, 647–663. [Google Scholar] [CrossRef]
- Ren, F.; Wei, Z.; Zhai, X. Multi-Objective Optimization and Evaluation of Hybrid CCHP Systems for Different Building Types. Energy 2021, 215, 119096. [Google Scholar] [CrossRef]
- Li, Y.; Tian, R.; Wei, M. Operation Strategy for Interactive CCHP System Based on Energy Complementary Characteristics of Diverse Operation Strategies. Appl. Energy 2022, 310, 118415. [Google Scholar] [CrossRef]
- Deng, Y.; Zeng, R.; Liu, Y. A Novel Off-Design Model to Optimize Combined Cooling, Heating and Power System with Hybrid Chillers for Different Operation Strategies. Energy 2022, 239, 122085. [Google Scholar] [CrossRef]
- Han, Z.; Ma, F.; Wu, D.; Zhang, H.; Dong, F.; Li, P.; Xiao, L. Collaborative Optimization Method and Operation Performances for a Novel Integrated Energy System Containing Adiabatic Compressed Air Energy Storage and Organic Rankine Cycle. J. Energy Storage 2021, 41, 102942. [Google Scholar] [CrossRef]
- Ghersi, D.E.; Amoura, M.; Loubar, K.; Desideri, U.; Tazerout, M. Multi-Objective Optimization of CCHP System with Hybrid Chiller under New Electric Load Following Operation Strategy. Energy 2021, 219, 119574. [Google Scholar] [CrossRef]
- Zhou, Y.; Wang, J.; Dong, F.; Qin, Y.; Ma, Z.; Ma, Y.; Li, J. Novel Flexibility Evaluation of Hybrid Combined Cooling, Heating and Power System with an Improved Operation Strategy. Appl. Energy 2021, 300, 117358. [Google Scholar] [CrossRef]
- Luo, X.; Xia, J.; Liu, Y. Extraction of Dynamic Operation Strategy for Standalone Solar-Based Multi-Energy Systems: A Method Based on Decision Tree Algorithm. Sustain. Cities Soc. 2021, 70, 102917. [Google Scholar] [CrossRef]
- Lu, S.; Li, Y.; Xia, H. Study on the Configuration and Operation Optimization of CCHP Coupling Multiple Energy System. Energy Convers. Manag. 2018, 177, 773–791. [Google Scholar] [CrossRef]
- Luo, X.; Zhu, Y.; Liu, J.; Liu, Y. Design and Analysis of a Combined Desalination and Standalone CCHP (Combined Cooling Heating and Power) System Integrating Solar Energy Based on a Bi-Level Optimization Model. Sustain. Cities Soc. 2018, 43, 166–175. [Google Scholar] [CrossRef]
- Li, K.; Wei, X.; Yan, Y.; Zhang, C. Bi-Level Optimization Design Strategy for Compressed Air Energy Storage of a Combined Cooling, Heating, and Power System. J. Energy Storage 2020, 31, 101642. [Google Scholar] [CrossRef]
- Ma, M.; Huang, H.; Song, X.; Peña-Mora, F.; Zhang, Z.; Chen, J. Optimal Sizing and Operations of Shared Energy Storage Systems in Distribution Networks: A Bi-Level Programming Approach. Appl. Energy 2022, 307, 118170. [Google Scholar] [CrossRef]
- Song, Z.; Liu, T.; Lin, Q. Multi-Objective Optimization of a Solar Hybrid CCHP System Based on Different Operation Modes. Energy 2020, 206, 118125. [Google Scholar] [CrossRef]
- Guan, T.; Lin, H.; Sun, Q.; Wennersten, R. Optimal Configuration and Operation of Multi-Energy Complementary Distributed Energy Systems. Energy Procedia 2018, 152, 77–82. [Google Scholar] [CrossRef]
- Biglia, A.; Caredda, F.V.; Fabrizio, E.; Filippi, M.; Mandas, N. Technical-Economic Feasibility of CHP Systems in Large Hospitals through the Energy Hub Method: The Case of Cagliari AOB. Energy Build. 2017, 147, 101–112. [Google Scholar] [CrossRef]
- Jian, W.; Yuan, R. Design and Optimization on Building Distributed Energy System; Tong Ji University Press: Shanghai, China, 2016; pp. 37–56. [Google Scholar]
- Waseem, M.; Lin, Z.; Liu, S.; Zhang, Z.; Aziz, T.; Khan, D. Fuzzy Compromised Solution-Based Novel Home Appliances Scheduling and Demand Response with Optimal Dispatch of Distributed Energy Resources. Appl. Energy 2021, 290, 116761. [Google Scholar] [CrossRef]
- Liu, Y.; Wang, Y.; Luo, X. Design and Operation Optimization of Distributed Solar Energy System Based on Dynamic Operation Strategy. Energies 2021, 14, 69. [Google Scholar] [CrossRef]
- Ma, W.; Fang, S.; Liu, G. Hybrid Optimization Method and Seasonal Operation Strategy for Distributed Energy System Integrating CCHP, Photovoltaic and Ground Source Heat Pump. Energy 2017, 141, 1439–1455. [Google Scholar] [CrossRef]
- Luo, Z.; Yang, S.; Xie, N.; Xie, W.; Liu, J.; Souley Agbodjan, Y.; Liu, Z. Multi-Objective Capacity Optimization of a Distributed Energy System Considering Economy, Environment and Energy. Energy Convers. Manag. 2019, 200, 112081. [Google Scholar] [CrossRef]
- Ren, F.; Wang, J.; Zhu, S.; Chen, Y. Multi-Objective Optimization of Combined Cooling, Heating and Power System Integrated with Solar and Geothermal Energies. Energy Convers. Manag. 2019, 197, 111866. [Google Scholar] [CrossRef]
- Zhang, T.; Wang, M.; Wang, P.; Liang, J. Optimal Design of a Combined Cooling, Heating, and Power System and Its Ability to Adapt to Uncertainty. Energies 2020, 13, 3588. [Google Scholar] [CrossRef]
- Guo, S.; Song, G.; Li, M.; Zhao, X.; He, Y.; Kurban, A.; Ji, W.; Wang, J. Multi-Objective Bi-Level Quantity Regulation Scheduling Method for Electric-Thermal Integrated Energy System Considering Thermal and Hydraulic Transient Characteristics. Energy Convers. Manag. 2022, 253, 115147. [Google Scholar] [CrossRef]
- Ju, L.; Yin, Z.; Yang, S.; Zhou, Q.; Lu, X.; Tan, Z. Bi-Level Electricity–Carbon Collaborative Transaction Optimal Model for the Rural Electricity Retailers Integrating Distributed Energy Resources by Virtual Power Plant. Energy Rep. 2022, 8, 9871–9888. [Google Scholar] [CrossRef]
- Air Conditioning Outdoor Design Parameters, Energy Plus Is Available Online. 2022. Available online: https://energyplus.net/weather-location/asia_wmo_region_2/CHN/CHN_Hunan.Changde.576620_CSWD (accessed on 15 June 2022).
- Zou, X. Study on Optimization and Control Strategies of Solar-Assisted Ground-Coupled Heat Pump Domestic Hot Water System. Master’s Thesis, Hunan University, Changsha, China, 2016. [Google Scholar]
- Changsha ENN Gas Co., Ltd. Natural Gas Price. 2022. Available online: http://www.cs95158.cn/contents/68/1594.html (accessed on 15 June 2022).
- Zou, B.; Peng, J.; Li, S.; Li, Y.; Yan, J.; Yang, H. Comparative Study of the Dynamic Programming-Based and Rule-Based Operation Strategies for Grid-Connected PV-Battery Systems of Office Buildings. Appl. Energy 2022, 305, 117875. [Google Scholar] [CrossRef]
- Chen, Y.; Xu, J.; Wang, J.; Lund, P.D.; Wang, D. Configuration Optimization and Selection of a Photovoltaic-Gas Integrated Energy System Considering Renewable Energy Penetration in Power Grid. Energy Convers. Manag. 2022, 254, 115260. [Google Scholar] [CrossRef]
Disclaimer/Publisher’s Note: The statements, opinions and data contained in all publications are solely those of the individual author(s) and contributor(s) and not of MDPI and/or the editor(s). MDPI and/or the editor(s) disclaim responsibility for any injury to people or property resulting from any ideas, methods, instructions or products referred to in the content. |
© 2023 by the authors. Licensee MDPI, Basel, Switzerland. This article is an open access article distributed under the terms and conditions of the Creative Commons Attribution (CC BY) license (https://creativecommons.org/licenses/by/4.0/).

