Article

Parameter Identification of DFIG Converter Control System Based on WOA

Faculty of Metallurgical and Energy Engineering, Kunming University of Science and Technology, Kunming 650093, China
*
Author to whom correspondence should be addressed.
Energies 2023, 16(6), 2618; https://doi.org/10.3390/en16062618
Submission received: 19 February 2023 / Revised: 7 March 2023 / Accepted: 8 March 2023 / Published: 10 March 2023

Abstract

:
The converter is an important component of a wind turbine, and its control system has a significant impact on the dynamic output characteristics of the wind turbine. For the double-fed induction generator (DFIG) converter, the control parameter identification method is proposed. In this paper, a detailed dynamic model of DFIG with the converter is built, and the trajectory sensitivity method is used to study the observation points that are sensitive to the change of control parameters as the observation quantity for control parameter identification; the Whale Optimization Algorithm (WOA) is used to study the converter control system parameters that dominate the output characteristics of DFIG in the dynamic full-process simulation. To validate the proposed method, four classical test functions are used to verify the effectiveness of the algorithm, and the control parameters are identified by setting a three-phase grounded short-circuit fault under maximum power point tracking (MPPT), and the identification results are compared with particle swarm optimization (PSO) and chaotic particle swarm optimization (CPSO) to show the superiority of the proposed method. The final results show that the proposed WOA can identify the control system parameters faster and more accurately.

1. Introduction

With the development of the economy and the times, the global energy demand is increasing while being affected by the non-renewable properties of fossil fuels and environmental pollution. Therefore, renewable energy development has become the first choice for future energy development plans of various countries around the world. Global wind energy resources are abundant, and the problem of the high-efficiency operation of wind turbines has become an important solution to the above problems [1,2,3]. Doubly fed wind turbines have become a widely used type of wind turbine due to their advantages, such as controllability and high efficiency [4,5,6,7,8,9,10,11,12]. However, the controller parameters in the actual engineering are generally adjusted by engineering experience and trial-and-error method, which is difficult to achieve optimal control, and the values of converter control system parameters may change with the random unit operation, which in turn leads to large errors between the wind turbine simulation process and the actual operating conditions, and it is very easy to cause unit control oscillations [13,14,15,16] and characterization errors due to misunderstanding of system parameters during grid simulation [17,18,19,20,21,22]. Therefore, it is important to consider the actual operating conditions of the turbine and to identify the parameters of the control system of the DFIG converter for the stable operation control of the turbine.
For the study of parameter identification of doubly fed wind turbines, more research scholars in the field have carried out studies on the identification of DFIG, mainly in several aspects. Trilla L and Lei T et al. studied a detailed mathematical model of DFIG under grid fault, modeling the wind turbine, drive chain, generator, grid-side converter (GSC), rotor-side converter (RSC), crowbar circuit, chopper circuit, and controller module, and studied their operational characteristics [23,24]. These are the key controls that dominate the output characteristics of DFIG in dynamic full-process simulations [25]; for such nonlinear optimization problems, there is no mature mathematical solution method except for a few problems with specific properties. Therefore, the choice of intelligent optimization methods, such as the genetic algorithm [26], simulated annealing algorithm, particle swarm optimization algorithm (PSO), ant colony algorithm, etc., seems to have become an obvious choice in solving such problems. Some research scholars have solved various problems of wind turbines in engineering fields, such as state estimation [27] and parameter identification [21,28,29]. However, there are some problems with these methods, such as the “data saturation” phenomenon of the least squares method, which makes the newly collected data less useful for updating the parameter estimates, and when the parameters change, the recursive least squares method will not be able to track the changes, which leads to the failure of online parameter identification. computationally complex, slow convergence, and has the problems of local convergence, difficulty in multi-parameter identification, and weak global merit-seeking ability. To address these problems, the Whale Optimization Algorithm (WOA) is introduced in this paper. WOA has also made some achievements in the fields of power prediction [30,31], multi-objective merit-seeking [32,33,34], and fault diagnosis [35], A comprehensive comparison of the current state of research is shown in Table 1.
However, the research on the parameter identification method of the converter control system of a doubly fed wind turbine is still insufficient, and as the key control parameter of DFIG, its control strategy and parameters have a direct impact on the external characteristics of the wind turbine [36,37]. Therefore, it is important to construct a detailed dynamic simulation model of a doubly fed wind turbine converter for research significance. Xeping Pan et al. used the frequency domain method and the Levenberg-Marquardt algorithm to decouple and identify the parameters of the machine-side converter and the doubly fed wind turbine converter control system, respectively [38,39]. Li Jingwei et al. [40] used a method to identify the unknown parameters in the controller by applying perturbations to the measurement signals of the latter controller while masking the changes in the measurement signals of the former controller. I Erlich et al. carried out the identification of converter control parameters based on the DFIG simplified model of voltage perturbations [41], but the model was limited to electromechanical transient simulations. However, these methods are more dependent on the measurement of specific disturbance signals in the process of converter control parameter identification, which increases the complexity of this process and also increases the difficulty of carrying out control parameter identification based on actual operating conditions. However, it does not address the multi-parameter online identification of the doubly fed wind turbine drive train in power system simulation.
To address these problems, this study proposes a multi-parameter online identification method for a converter control system based on WOA, which solves the disadvantage of the narrow optimization region of the basic algorithm. It has the advantages of fast convergence, fewer adjustment parameters, strong active searchability, etc. It identifies the converter control parameters under stable operation and fault conditions and improves the ability of stable operation of the unit. Based on the WOA algorithm, the parameters of the converter control system are identified as follows: build a dynamic, detailed model of the DFIG converter, observe its output power, and analyze the identifiability of the control parameters with trajectory sensitivity; simulate the WOA algorithm by using four classical test functions, such as Schaffer and Rastrigin, and two different operating conditions; and construct an adaptation function based on the influence degree of the control parameters to improve the parameters. Recognition accuracy is improved by constructing an adaptation function based on the influence degree of control parameters, and the parameter recognition results of the WOA algorithm are compared with some intelligent optimization algorithms.

2. DFIG Converter Control System Dynamic Model

2.1. Mathematical Model of Rotor-Side Converter (RSC) Control System

The rotor-side converter, also called machine-side converter, realizes the control of DFIG active and reactive power by vector control strategy, and when the dq-axis of the synchronous rotation reference coordinate system is oriented to the stator magnetic chain, the equation of the stator magnetic chain can be expressed by Equation (1).
{ ψ s d = L s i s d + L m i r d = ψ s ψ s q = L s i s q + L m i r q = 0 ψ r d = L r i r d + L m i s d ψ r q = L r i r q + L m i s q
L, i and   ψ  denote inductance, current, and magnetic chain, respectively; the subscripts d and q of the parameters denote the components of the parameter in the d-axis and q, respectively; the subscripts r and s represent two different variables of the rotor and stator, respectively; and Lm is the excitation mutual inductance.
The rotor voltage equation is shown in Equation (2).
{ u s d = R s i s d + d ψ s d d t ω 1 ψ s q u s q = R s i s q + d ψ s q d t + ω 1 ψ s d u r d = R r i r d + d ψ r d d t ( ω 1 ω r ) ψ r q u r q = R r i r q + d ψ r q d t + ( ω 1 ω r ) ψ r d
Rs denotes the stator resistance, and  ω 1  denotes the rotational angular velocity.
To eliminate the tracking error of the rotor current, the closed-loop rotor current controller can be expressed by Equation (3) after introducing the proportional integrator shown in Figure 1.
{ u r d * = k p _ i r ( i r d * i r d ) + k i _ i r ( i r d * i r d ) d t + σ L m d ( i r d ) d t σ ω s L r i r q u r q * = k p _ i r ( i r q * i r q ) + k i _ i r ( i r q * i r q ) d t + σ L m d ( i r q ) d t + L m L s ω s ψ s + σ ω s L r i r d
ω s  and  σ  can be calculated from Equation (4).
{ ω s = ( ω 1 ω r ) σ = 1 L m 2 L r L s
kp_ir, and ki_ir are the proportional and integral coefficients of the current controller, respectively.

2.2. Mathematical Model of Grid-Side Converter (GSC) Control System

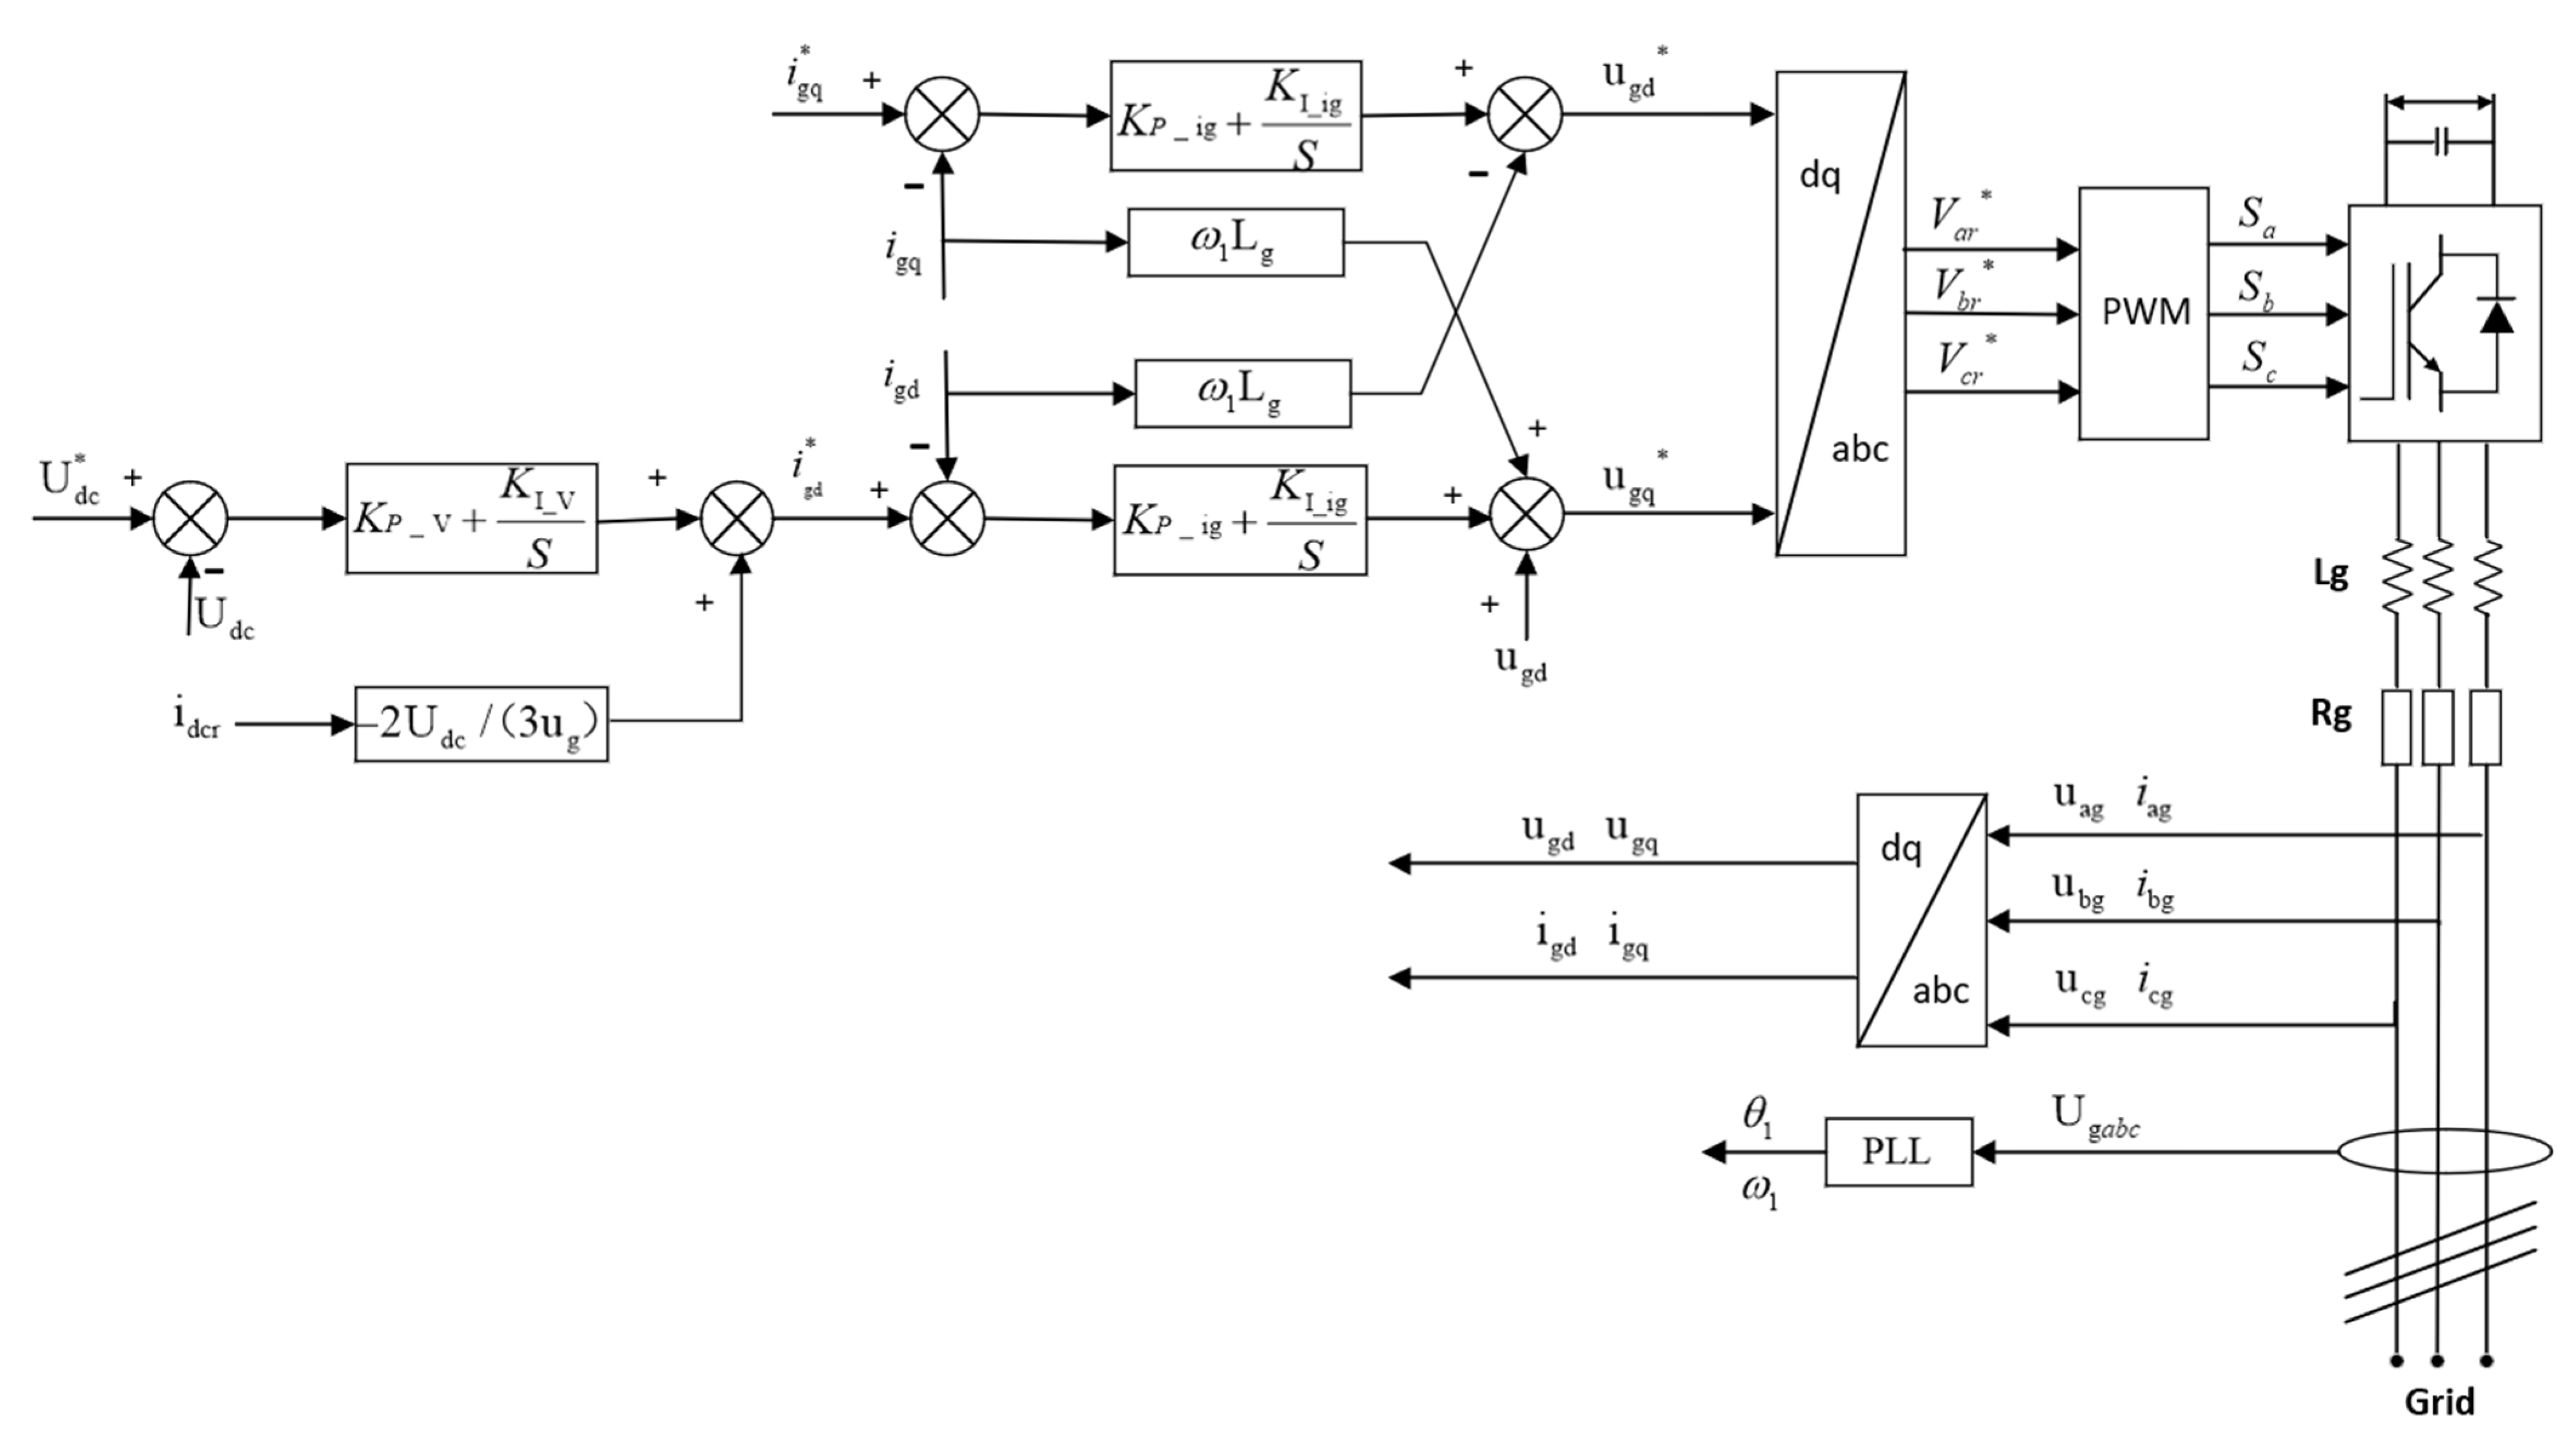
The controller of the grid-side converter of a doubly fed wind turbine is mainly used to keep the DC bus voltage stable, to ensure the sinusoidal of the input current, and to control the input power factor. Assuming that the impedance of the filter of the grid-side converter coupled to the grid in Figure 2 is  R g + j ω 1 L g , the grid voltage equation can be expressed by Equation (5).
{ u g d = R g i g d + L g d ( i g d ) d t w 1 L g i g q + V g d u g q = R g i g q + L g d ( i g q ) d t + w 1 L g i d + V g q
Vgd and Vgq denote the d-axis and q-axis components of the AC measured voltage of the grid-side converter, respectively; ugd, ugq, igd, and igq denote the d-axis and q-axis components of the grid voltage and current, respectively.
When grid voltage-directed vector control is used, the d-axis component of the AC-side current of the net-side converter is only related to active power, while the q-axis component is only related to reactive power, and the active and reactive power are completely decoupled. When the converter losses are neglected, the current flowing into the DC bus capacitor between the net-side converter and the rotor-side converter can be expressed as
i c = C × d U d c d t = i d c g i d c r P g U d c i d c r = 1.5 u g i g d U d c i d c r
where C denotes the DC bus capacitor; ic denotes the current flowing into the DC bus capacitor; and idcg and idcr denote the currents on the DC side of the net-side converter and the rotor-side converter, respectively.
Then, the d-axis component of the AC-side current of the grid-side converter can be calculated from Equation (7).
i g d = U d c 1.5 u g i g d ( i c + i d c r ) = U d c 1.5 u g i g d ( C × d U d c d t + i d c r )
Similarly, the tracking error of the DC capacitance–voltage (Udc) can be eliminated by introducing a PI controller.
i g d * = k p _ V ( U d c * U d c ) + k i _ V ( U d c * U d c ) d t 2 U d c 3 u g × i d c r
Kp_V, and Ki_V denote the proportional and integral coefficients of the net-side converter DC voltage loop, respectively.
The DC voltage control loop of the grid-side converter is shown in Figure 2. Then, the GSC AC-side voltage can be deduced as
{ V g d = R g i g d L g d ( i g d ) d t + ω 1 L g i g q + u g d V g q = R g i g q L g d ( i g q ) d t ω 1 L g i d + u g q
The PI controller is introduced to eliminate the tracking error of the AC-side current of the network-side converter, and the reference value of the AC-side voltage can be derived as
{ u g d * = k p _ i g ( i r d * i g d ) + k i _ i g ( i r d * i g d ) d t + w 1 L g i g q + u g u g q * = k p _ i g ( i g q * i g q ) + k i _ i g ( i g q * i g q ) d t w 1 L g i d
where kp_ig, and ki_ig are the proportional and integral coefficients of the grid-side converter current controller, respectively.
The controller for constructing the grid-side converter of the doubly fed wind turbine includes the dc voltage outer-loop controller and the current inner-loop controller. The input of the control loop of the d-axis current is associated with the dc bus voltage control loop, and the input of the q-axis current control loop can be given directly or calculated from the preset power factor.
Based on the above analysis, the rectifier control system of the doubly fed wind turbine is mainly divided into the rotor-side PI controller and machine-side PI controller. The rotor-side PI control parameters are divided into kp_ir and ki_ir, which are recorded as k1 and k2, respectively; the GSC PI control parameters are divided into Kp_V, KI_V, Kp_ig, and KI_ig, which are recorded as k3, k4, k5, and k6, respectively.

3. Control System Parameter Identification Feasibility and Identification Process

3.1. Track Sensitivity Standard Value

To optimize the selection of the above-unknown parameters, the WOA algorithm was used. The purpose of this algorithm is to minimize the relative incremental error values between the optimized model observations and the actual observations extracted from the experimental data. To measure the difficulty of parameter identification, this paper uses trajectory sensitivity as the discriminant criterion, which reflects the degree of trajectory fluctuation of the observed quantities under small parameter changes. When the trajectory sensitivity is large, it means that the observed quantity has a large fluctuation under the small change of the parameter. That is, the observed quantity is more sensitive to the parameter; on the contrary, when the trajectory sensitivity is small, it means that the change of the parameter has less influence on the observed quantity at this time, and the larger the value of the parameter sensitivity under the same observation indicates that the parameter change has more influence on the observed quantity, so the selection of the appropriate observation helps to improve the accuracy of the identified parameter. To improve the accuracy of trajectory sensitivity in the calculation of the median method is mostly used. Specifically, the motion state before and after disturbance is analyzed twice; the difference between the two results is used to analyze the trajectory sensitivity.
S = ( y i ( θ , k ) y i 0 ) ( θ i θ i 0 ) S = y i ( t , θ 1 , , θ i + θ i , , θ m , k ) y i ( t , θ 1 , , θ i θ i , , θ m , k ) 2 ( θ i θ i 0 )
  y i  is the observed quantity containing the parameter to be identified;  y i 0  is the practical amount with actual identification parameters;  θ  is the parameter to be determined;  θ i 0  is the real value of the parameter to be determined;  θ  is the incremental change of the parameter to be determined; and i is the number of parameters to be specified.
Because the selection criteria are different, it is not easy to conclude simply by observing the trajectory sensitivity. Therefore, to obtain more accurate trajectory sensitivity, the average value of its absolute value is taken as the standard to determine the sensitivity.
S θ = 1 K i = 1 K | ( y i ( θ , k ) y i 0 ) ( θ i θ i 0 ) |
Notably, k is the total number of track sensitivity points, the time length divided by the time step.

3.2. Trajectory Sensitivity Analysis

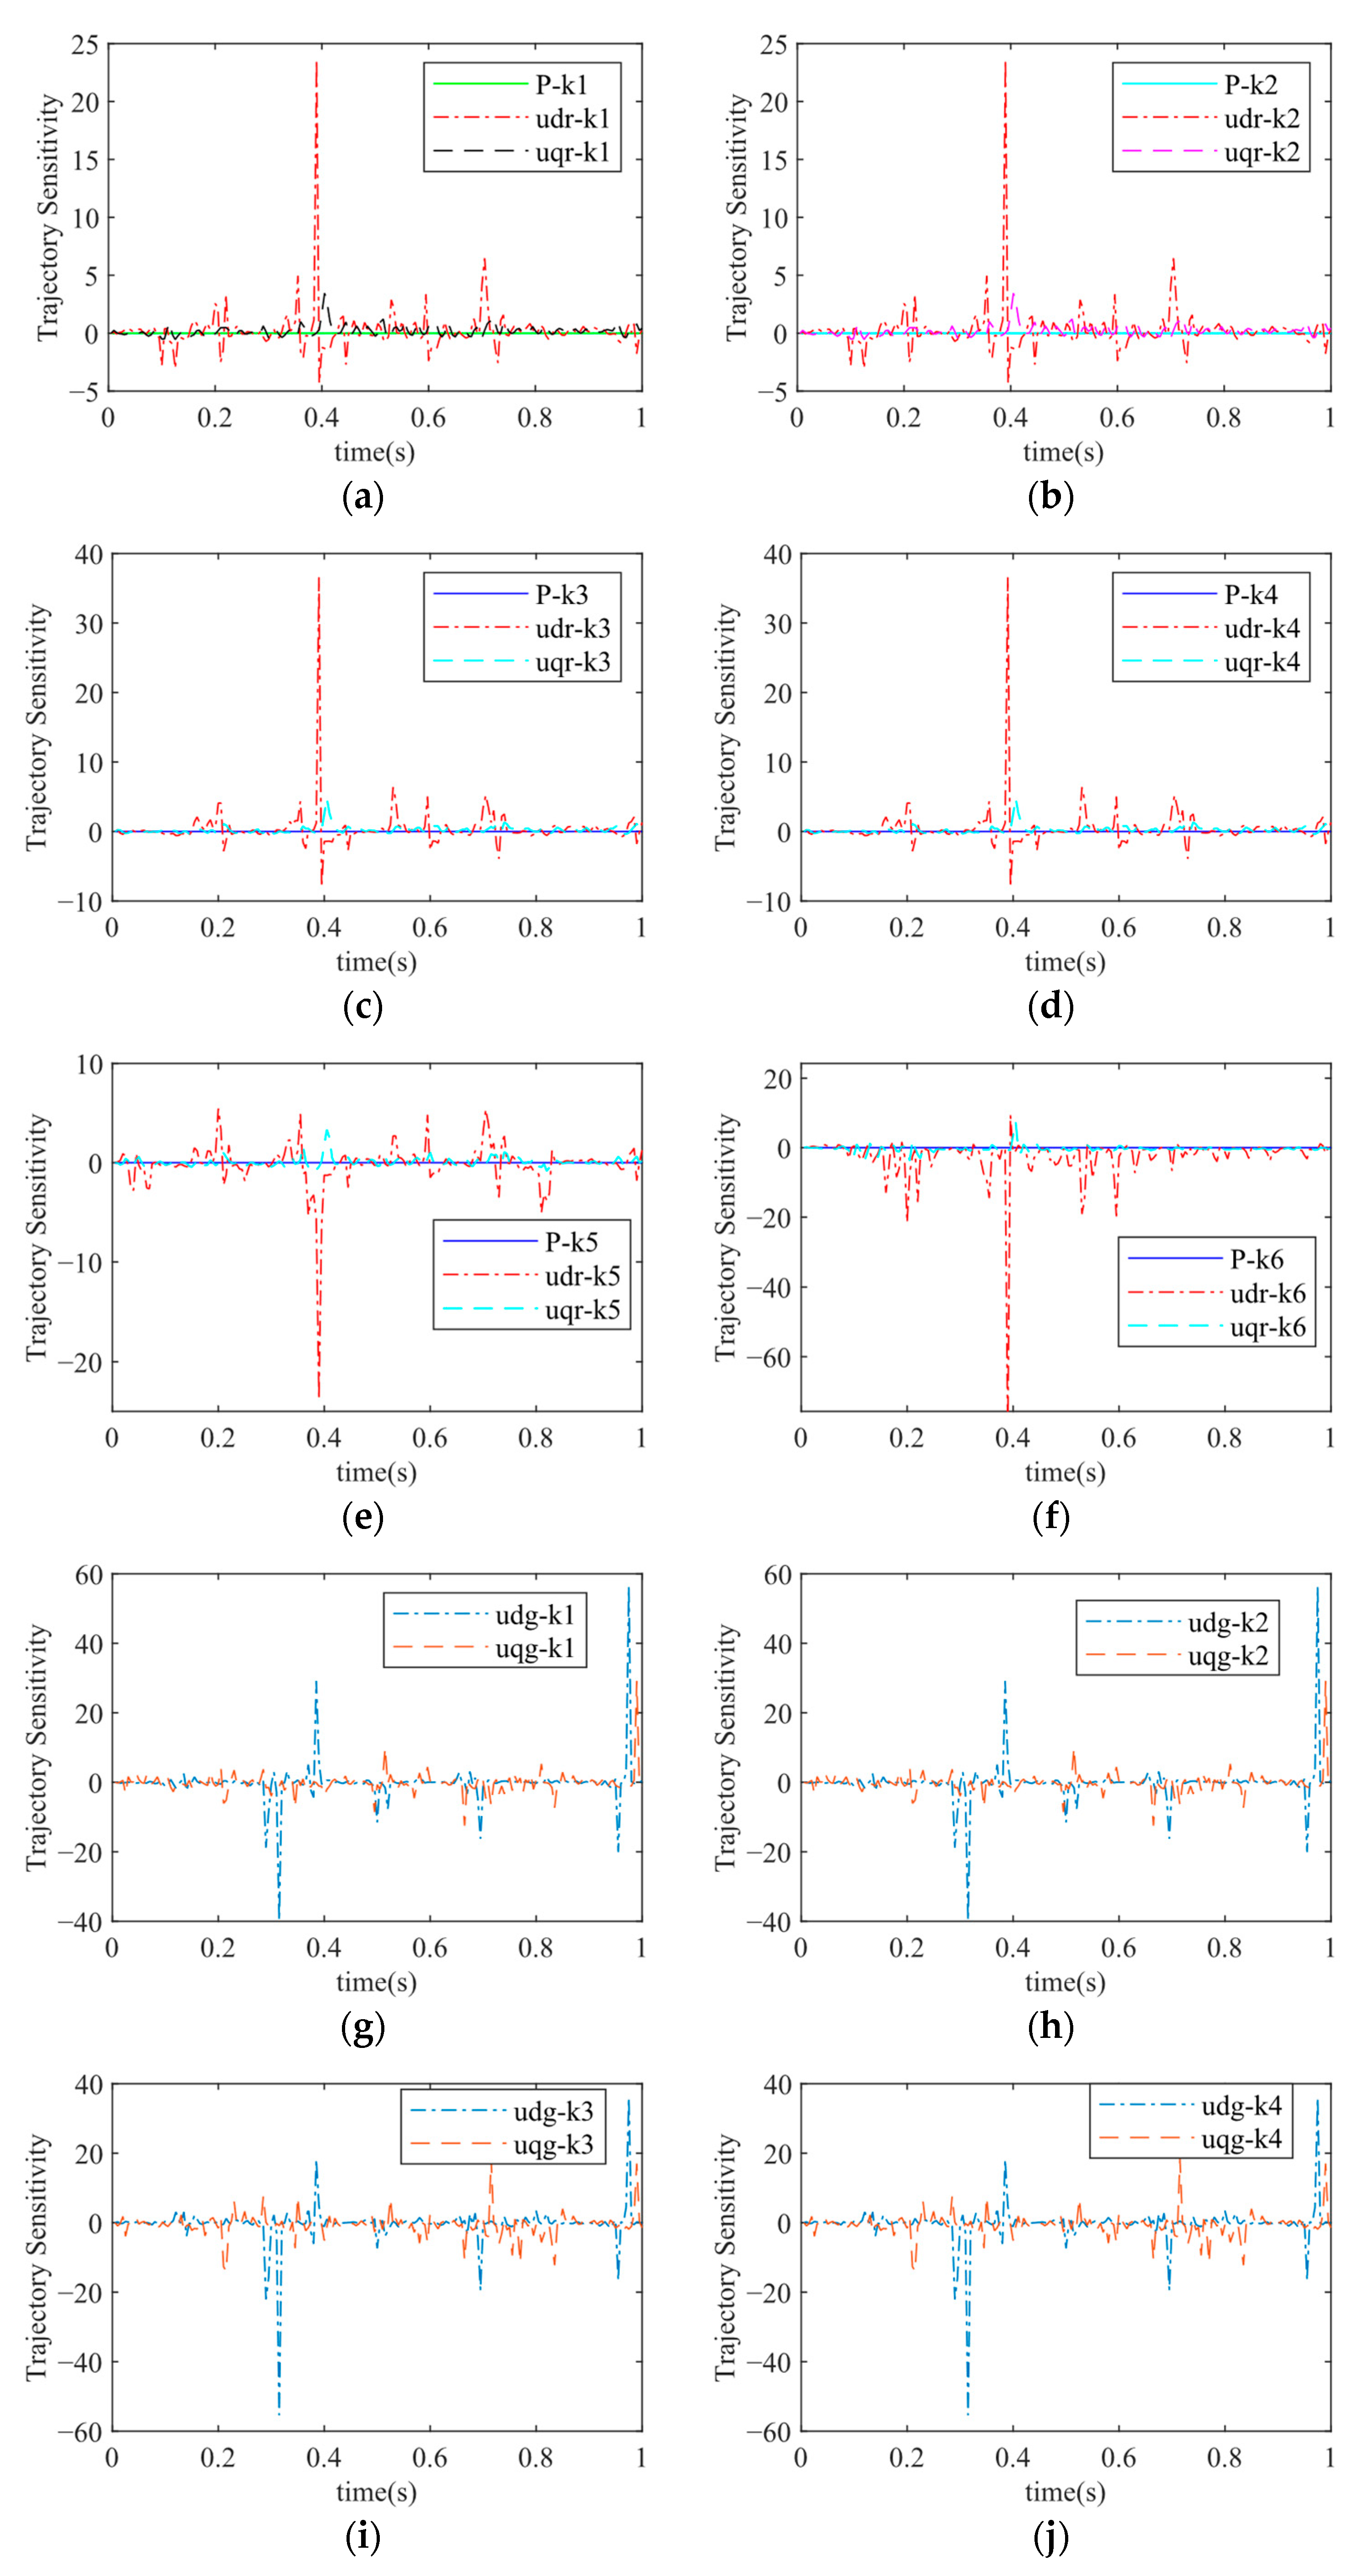
In the example simulation, the wind speed is kept at 11 m/s, the initial reactive power is set to 0, the sampling time is 0.0005 s, and the incremental change of the parameters to be identified is given by 30%. Through the model simulation and the actual output response, five different observations of active power, rotor-side d-axis voltage, rotor-side q-axis voltage, net-side d-axis voltage, and net-side q-axis voltage are selected to calculate the trajectory of each parameter using the trajectory sensitivity equation. The sensitivity is compared, and the calculation results is shown in Figure 3.
As shown above, the parameters of the rectifier control system are most influenced by the d-axis voltage components on the machine side and the RSC of the rectifier, but the q-axis voltage components have a non-negligible influence on the parameter identification, and only the active power trajectory sensitivity is the smallest, which is almost 0 relative to the rotor-side and machine-side voltage components, so the selection of active power as the observation is not conducive to the parameter identification, and to improve the parameter identification accuracy, the dq-axis voltage components on the machine side and the RSC are selected as the observation, and the rectifier parameter identification adaptation function is constructed by combining the trajectory sensitivity type.

3.3. Whale Optimization Algorithm

The WOA used in this paper is a Swarm Intelligence (SI) algorithm [42], which simulates whales’ typical bubble net attack behavior in rounding up prey to solve the identification optimization problem. Compared with other optimization algorithms, WOA has the advantages of a simple process, fast convergence speed, fewer adjustment parameters, and robust and active searchability. Its principle is to simulate the behavior of whales preying on prey for optimization, divided into three stages: encircling game, spiral hunting, and searching for food.
Surround prey:
D = | C X q ( t ) X ( t ) |
X ( t + 1 ) = X q ( t ) A D
where Xq represents the current optimal whale position, t represents the current iteration number, X represents the current whale individual position, and D denotes the location measurement parameter.
A and C represent random variables, and their expression is
A = 2 a r a
C = 2 r
a = 2 2 t / T
where A represents a constant linearly decreasing trend from 2 to 0, R means a random number with a range of [0, 1], and T represents the maximum number of iterations.
Spiral hunting:
X ( t + 1 ) = D e b l cos ( 2 π l ) + X q ( t )
D = | X q ( t ) X ( t ) |
where b represents the spiral shape parameter, and its value is usually 1, which represents a random number with a value range of [−1, 1].
In the whale feeding process will randomly choose the above two paths with a probability of 50%, taking the form of spiral encirclement or reduced distance, as shown in the following representation:
X ( t + 1 ) = { X q ( t ) A D p > 50 % D e b l cos ( 2 π l ) + X q ( t ) p 50 %
where p represents a random number with a range of [0, 1].
Search for food:
While approaching known prey, the whale will constantly search for new prey with a position update equation of
X ( t + 1 ) = X r a n d ( t ) A × D
D = | C X r a n d ( t ) X ( t ) |
The formula Xrand represents the position of whale individuals randomly selected from the current whale population.
The absolute value of the vector A is used to select the update position method: when A ≥ 1, an alternative position Wrand is randomly generated, and the positions of all whales are continuously changed by updating until the best prey is found to find the global optimal solution; when A < 1, the locally optimal solution is performed.
For the parameter identification of the DFIG converter control system, considering the mutual influence between the machine-side converter and the RSC converter, the adaptation calculation function shown below is used.
L = 1 4 ( i = 1 N ( u d r r e a l u d r s i m ( q m ) ) N * u d r r e a l + i = 1 N ( u q r r e a l u q r s i m ( q m ) ) N * u q r r e a l + i = 1 N ( u d g r e a l u d g s i m ( q m ) ) N * u d g r e a l + i = 1 N ( u q g r e a l u q g s i m ( q m ) ) N * u q g r e a l )
K denotes the total number of samples; the subscript real denotes the actual value of observations corresponding to the parameters containing the actual identification; the subscript sim denotes the value of observations corresponding to the parameters containing the algorithm identification; and  θ m  denotes the parameters to be identified.
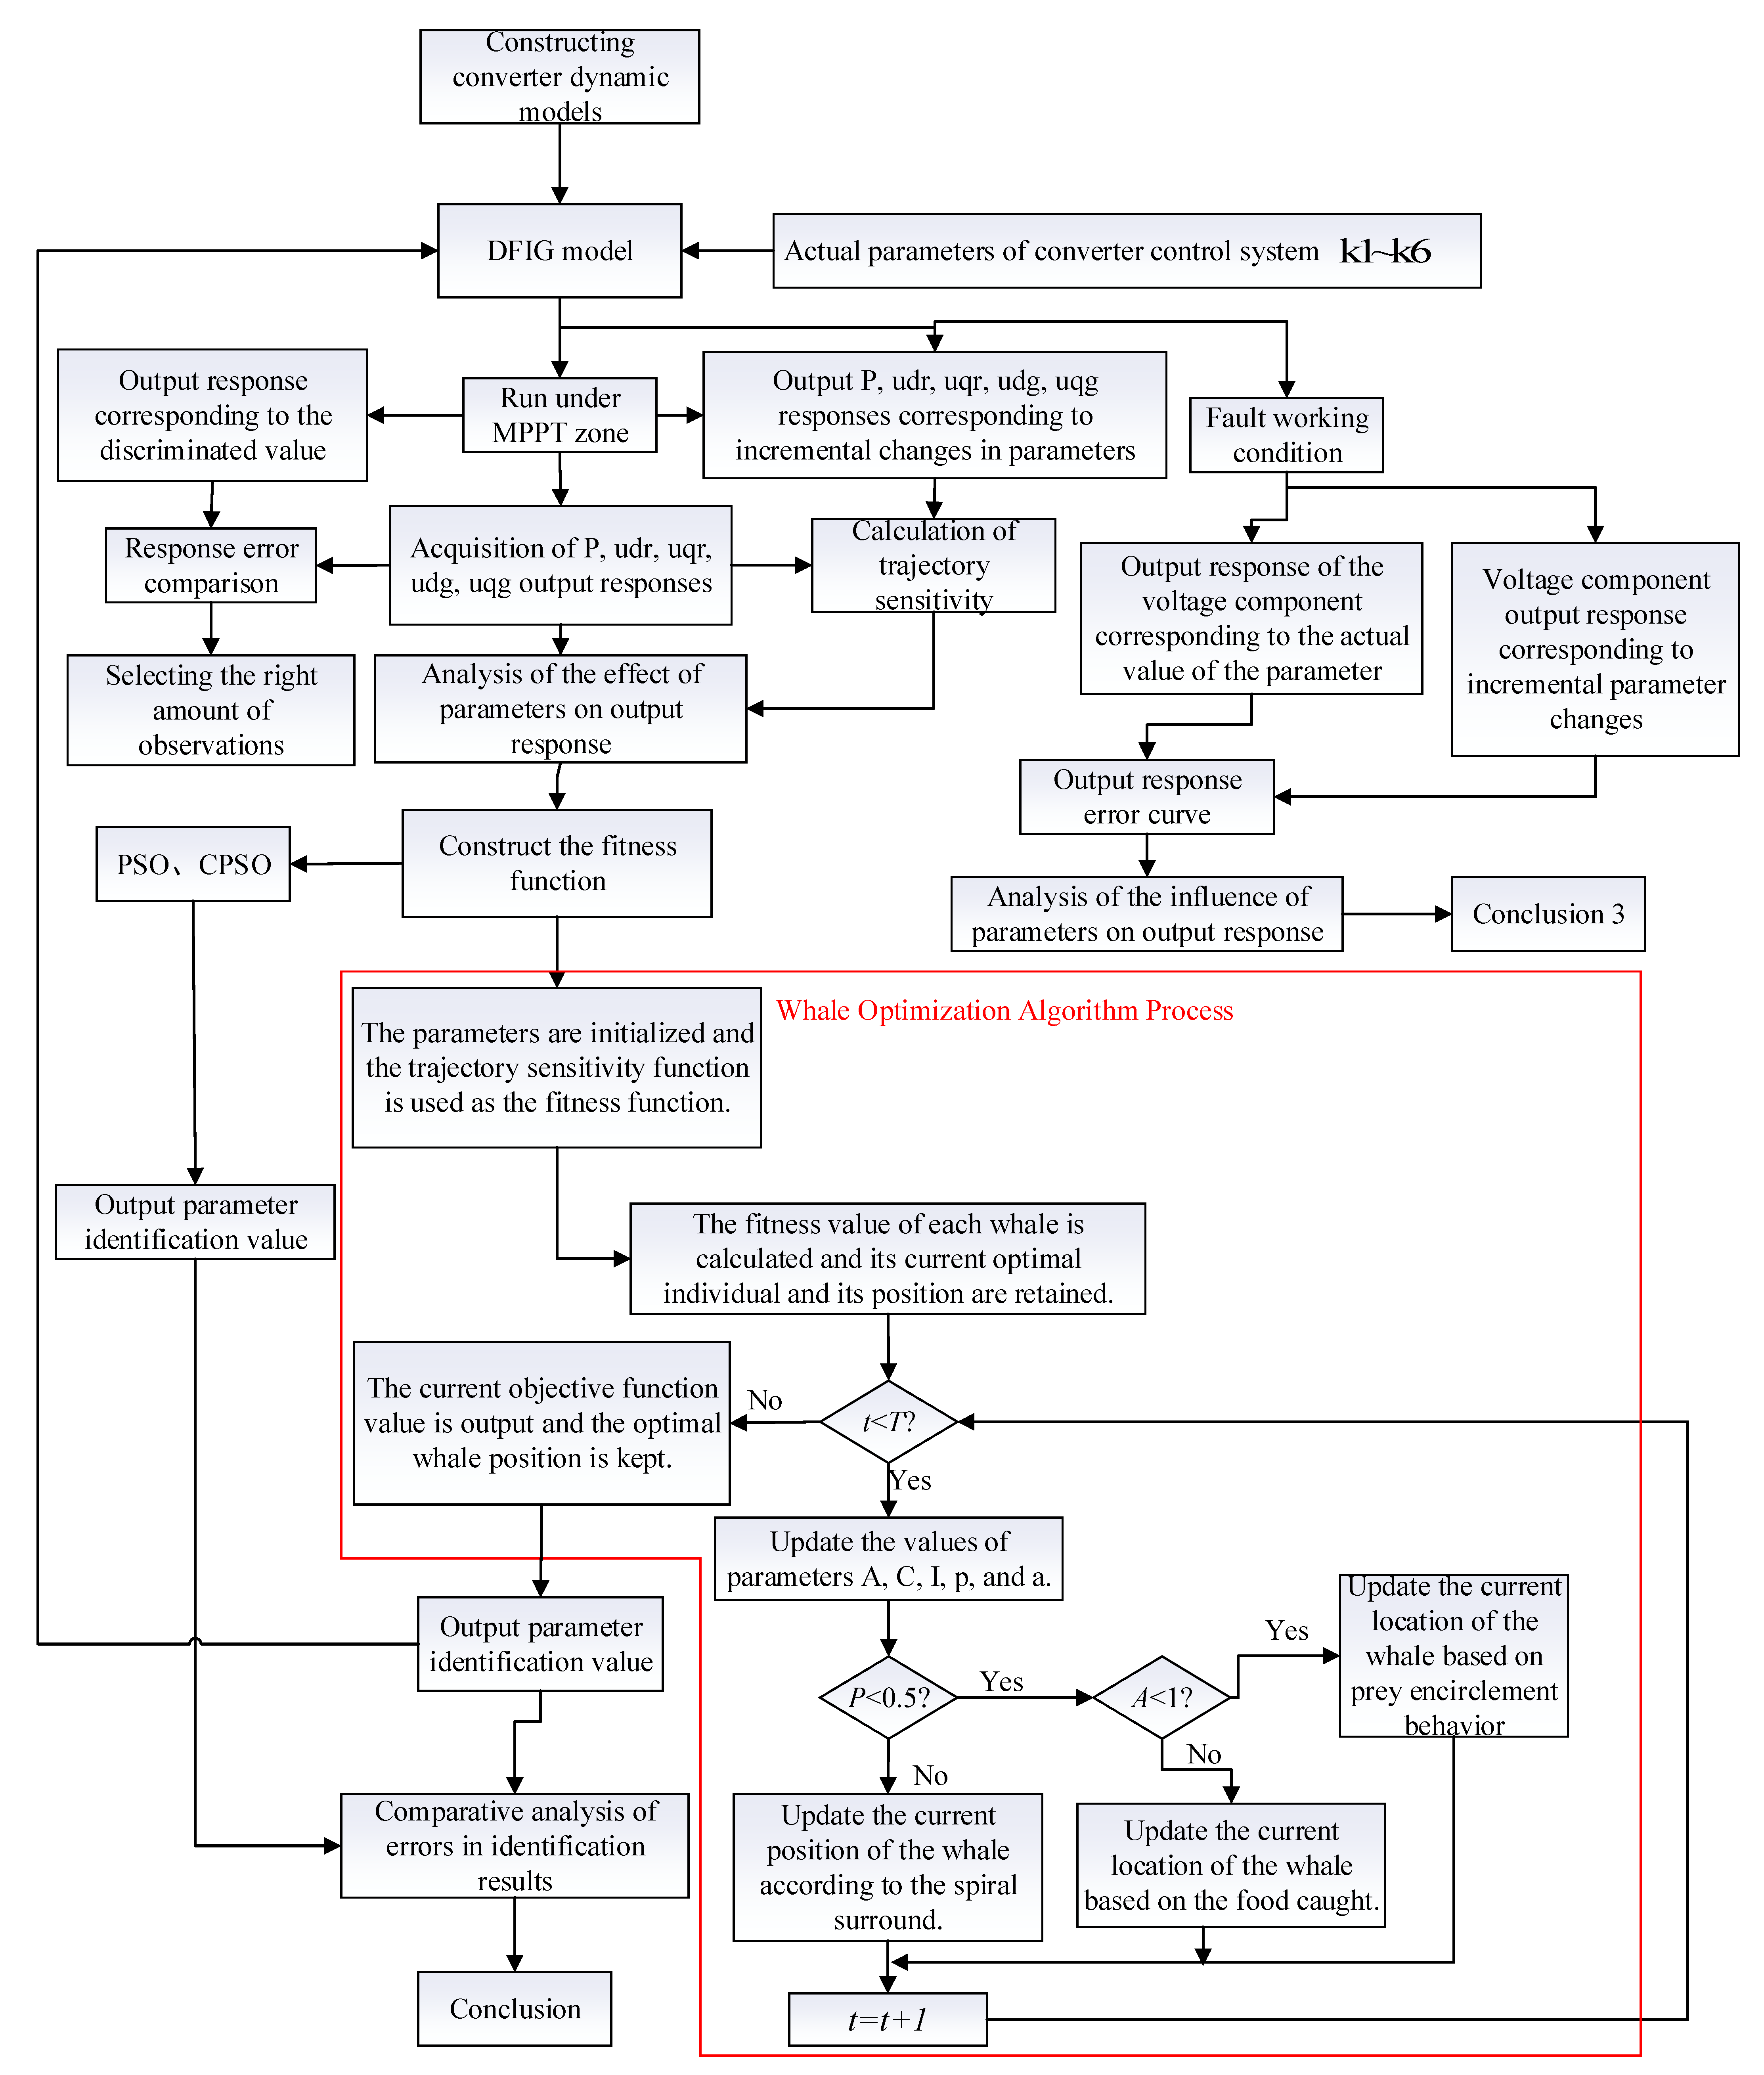
The DFIG converter control system parameter identification process is shown in Figure 4. First, the detailed dynamic model of the doubly fed wind turbine rectifier is constructed, and the control system parameters are input to the wind turbine model, and the active power, rotor-side d-axis voltage component, rotor-side q-axis voltage component, net-side d-axis voltage component, and net-side q-axis voltage component are sampled and processed. Then, each of the five output variables is used as the observed quantity using the trajectory sensitivity and as the comparison object, which is the main parameter of each output variable. Finally, the output curves identified by the algorithm are compared and analyzed with the actual output curves to observe the degree of fit between the output using the identification results and the actual output, to judge whether the parameters identified by the algorithm can replace the actual parameters.
The specific optimization steps are as follows:
Step 1: Establish a dynamic model of a doubly fed wind turbine with dual rectifiers.
Step 2: Select five output responses as observations and incremental changes of six parameters, respectively, calculate and analyze the output responses by trajectory sensitivity, initially determine the influence of parameters on the output results, and select the appropriate observations.
Step 3: Initialize the WOA parameters uniformly, set the population number, dimension, and iteration number, and select the appropriate fitness function.
Step 4: Calculate the fitness value of each whale and keep its current optimal individual and its position.
Step 5: When t < T, update the values of parameters A, C, I, p, and a.
Step 6: When p < 0.5, update the current position of the whale according to the encircling prey behavior if A < 1, and update the current position according to the capturing food behavior if A ≥ 1.
Step 7: When p ≥ 0.5, update the current position according to the spiral encircling behavior.
Step 8: Calculate the value of the current objective function and keep the current optimal whale position. Judge whether t < T and if not, go to step 7) but if yes, make t = t + 1 and go back to step 3).
Step 9: Output the current adaptation value and keep the optimal whale position. The optimal whale position is the parameter identification value L.
Step 10: The error analysis of the identified values of WOA compared with the identified values of PSO and CPSO under three-phase short-circuit fault conditions of the unit was concluded.

4. Results and Discussions

4.1. Algorithm Performance Test

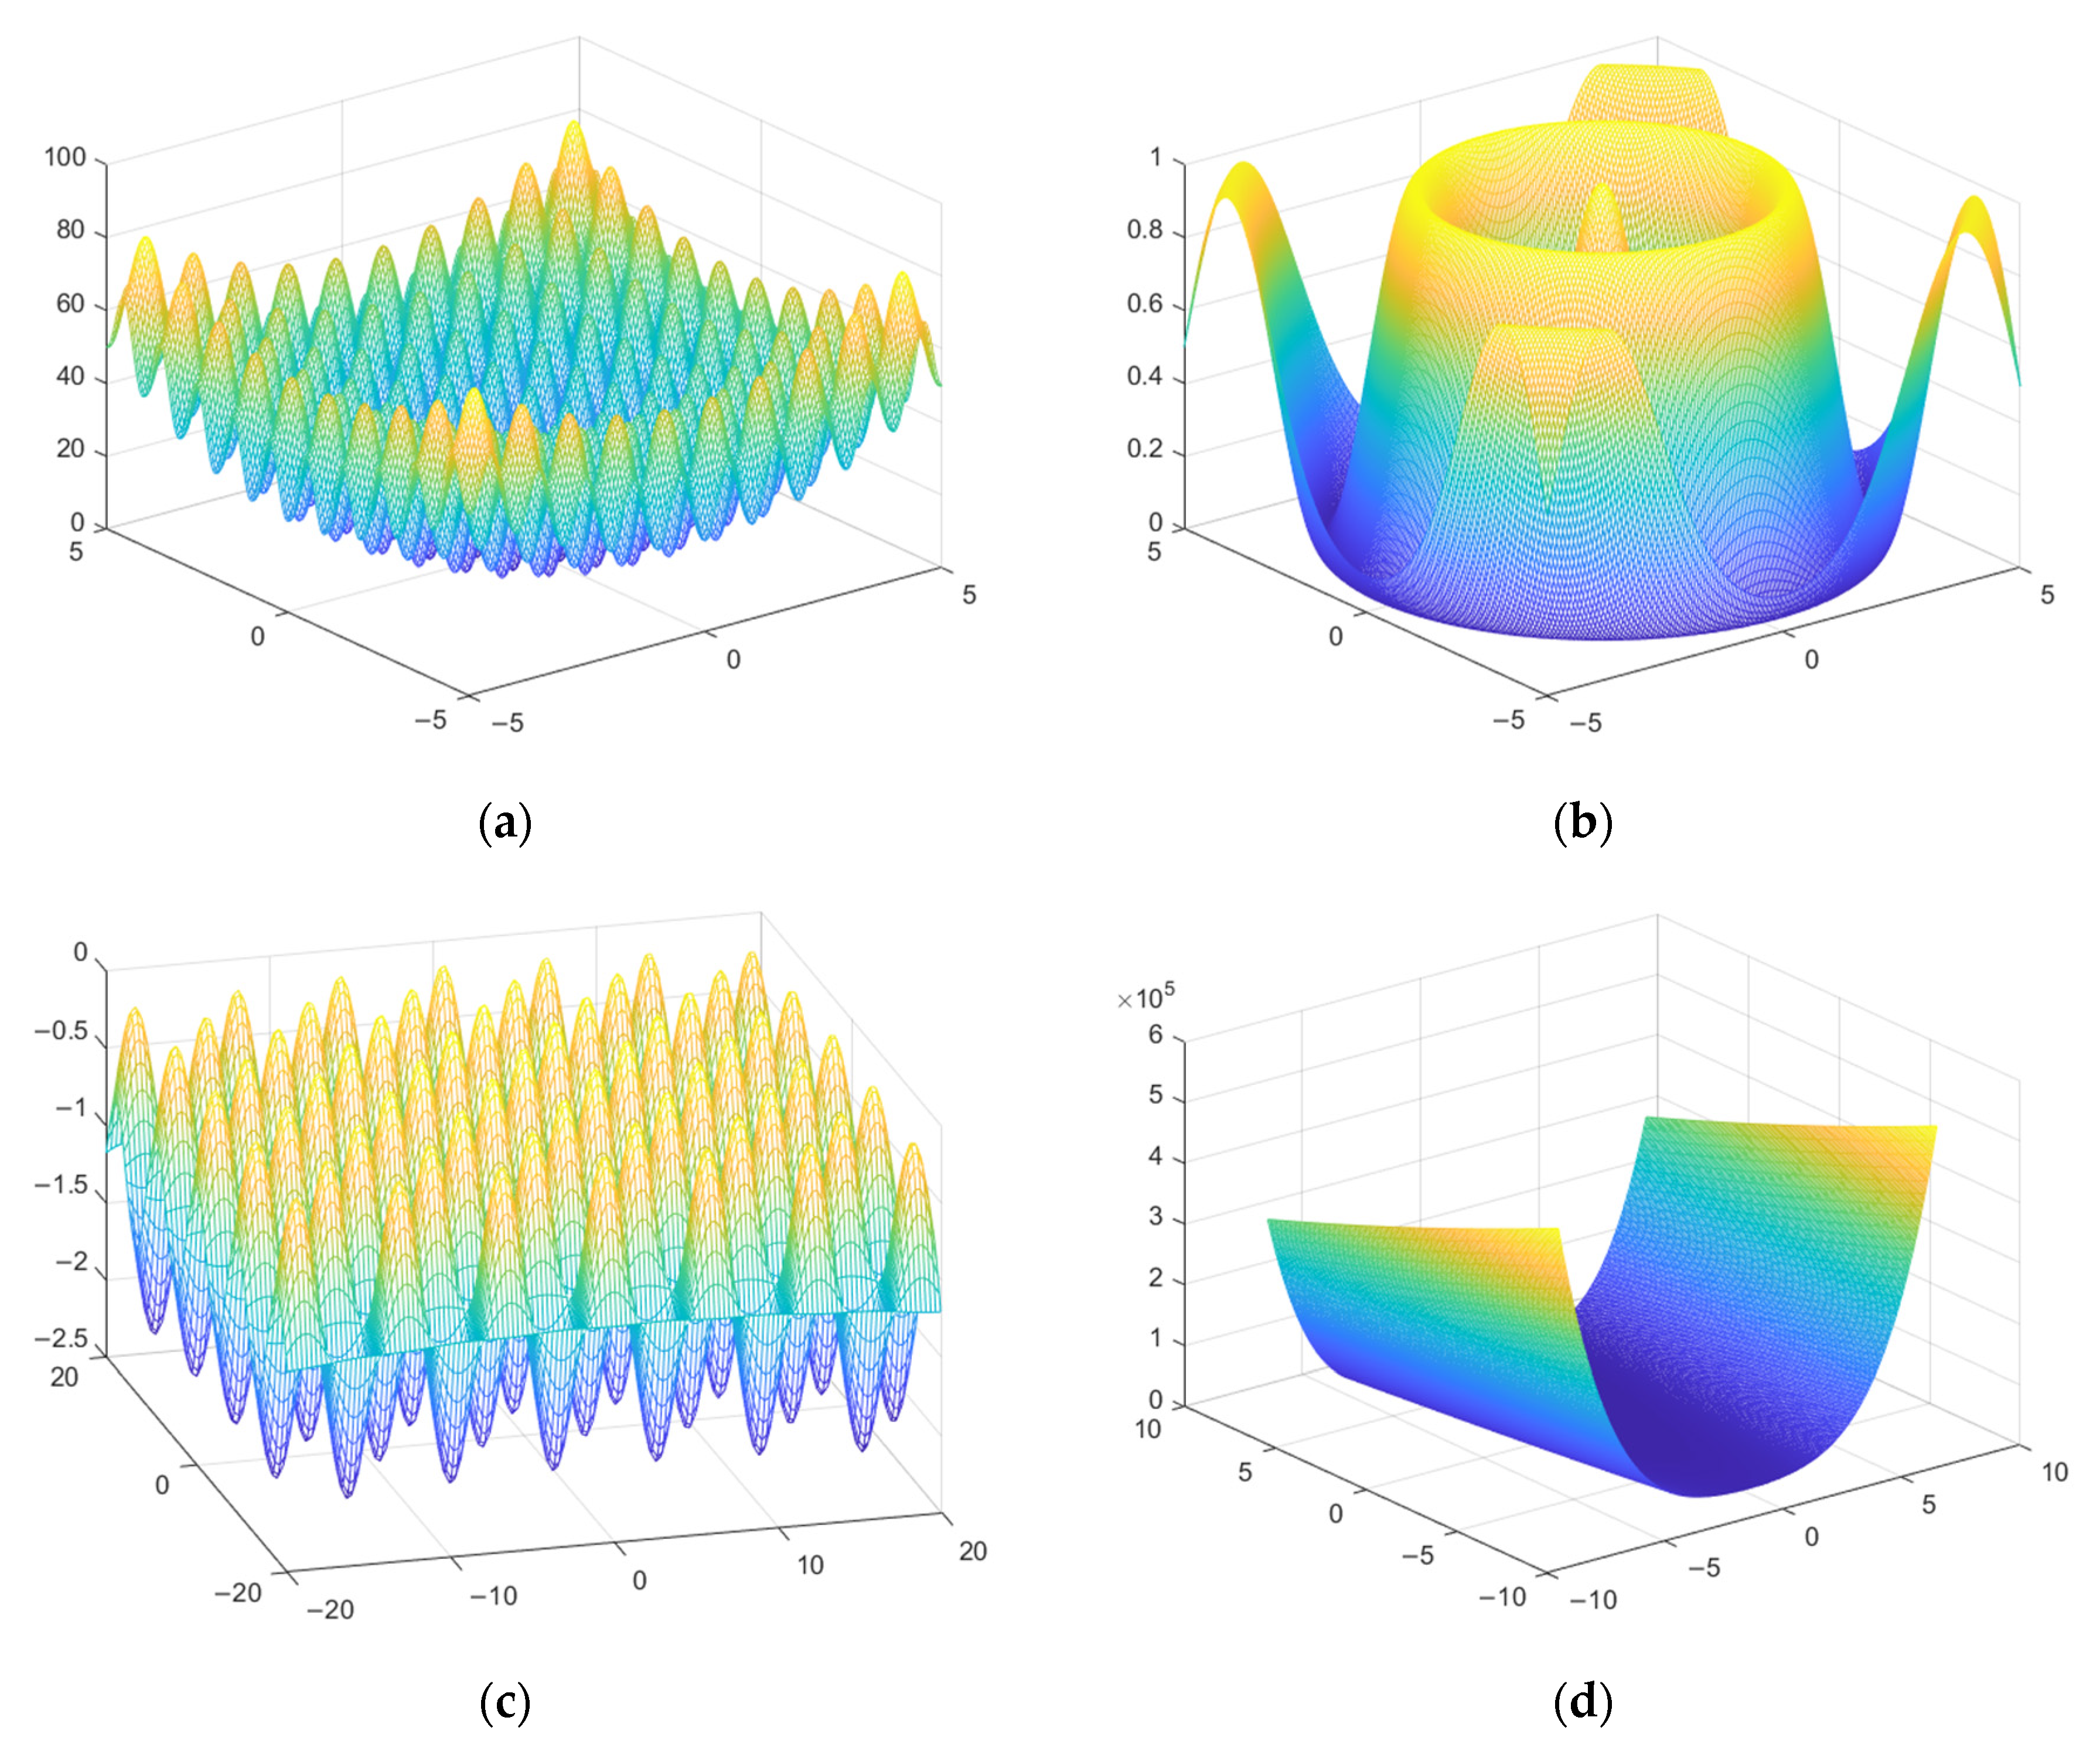
To verify the adaptability and interference resistance of the whale algorithm, four test functions, such as the more complex Schaffer and Rastrigin, are chosen to test the WOA algorithm (Figure 5).
The restringing function is a complex multimodal function, which is highly multimodal, but the position of the minimum value is regularly distributed, and the peak value fluctuates and jumps, so it is not easy to optimize and find the optimal value. The function expression is shown in Formula (24):
f 1 ( x ) = i = 1 D [ x i 2 10 cos ( 2 π x i ) + 10 ]
The Schaffer function is a two-dimensional complex function with numerous minimum points. It is not easy to find the optimal value because it is superior to this function with stable oscillation. The expression of the function is as follows:
f 2 ( x 1 , x 2 ) = 0.5 + ( sin ( x 1 2 + x 2 2 ) ) 2 0.5 ( 1 + 0.001 ( x 1 2 + x 2 2 ) ) 2
Griewank functions are a typical class of multimodal test functions consisting of quadratic convex functions and oscillatory nonconvex functions. These two components show different relative importance in different dimensions. Unlike most of the other test functions, the Griewank function becomes more difficult and then easier in the optimization process as the dimension of the function increases. The expression of the function is given in Equation (26).
f 3 ( x ) = 1 + 1 4000 i = 1 D ( x i 2 ) + i = 1 n cos ( x i i )
Each contour of the Rosenbrock function is roughly parabolic in shape, and its full-domain minimum is in a parabolic-shaped valley (a banana-shaped valley). It is easy to find this valley, but because the values within the valley do not vary much, it is pretty challenging to find the minimum value of the complete domain. The functional expression is shown in Equation (27).
f 4 ( x ) = i = 1 N 1 [ 100 ( x i + 1 x i 2 ) 2 + ( x i 1 ) 2 ]
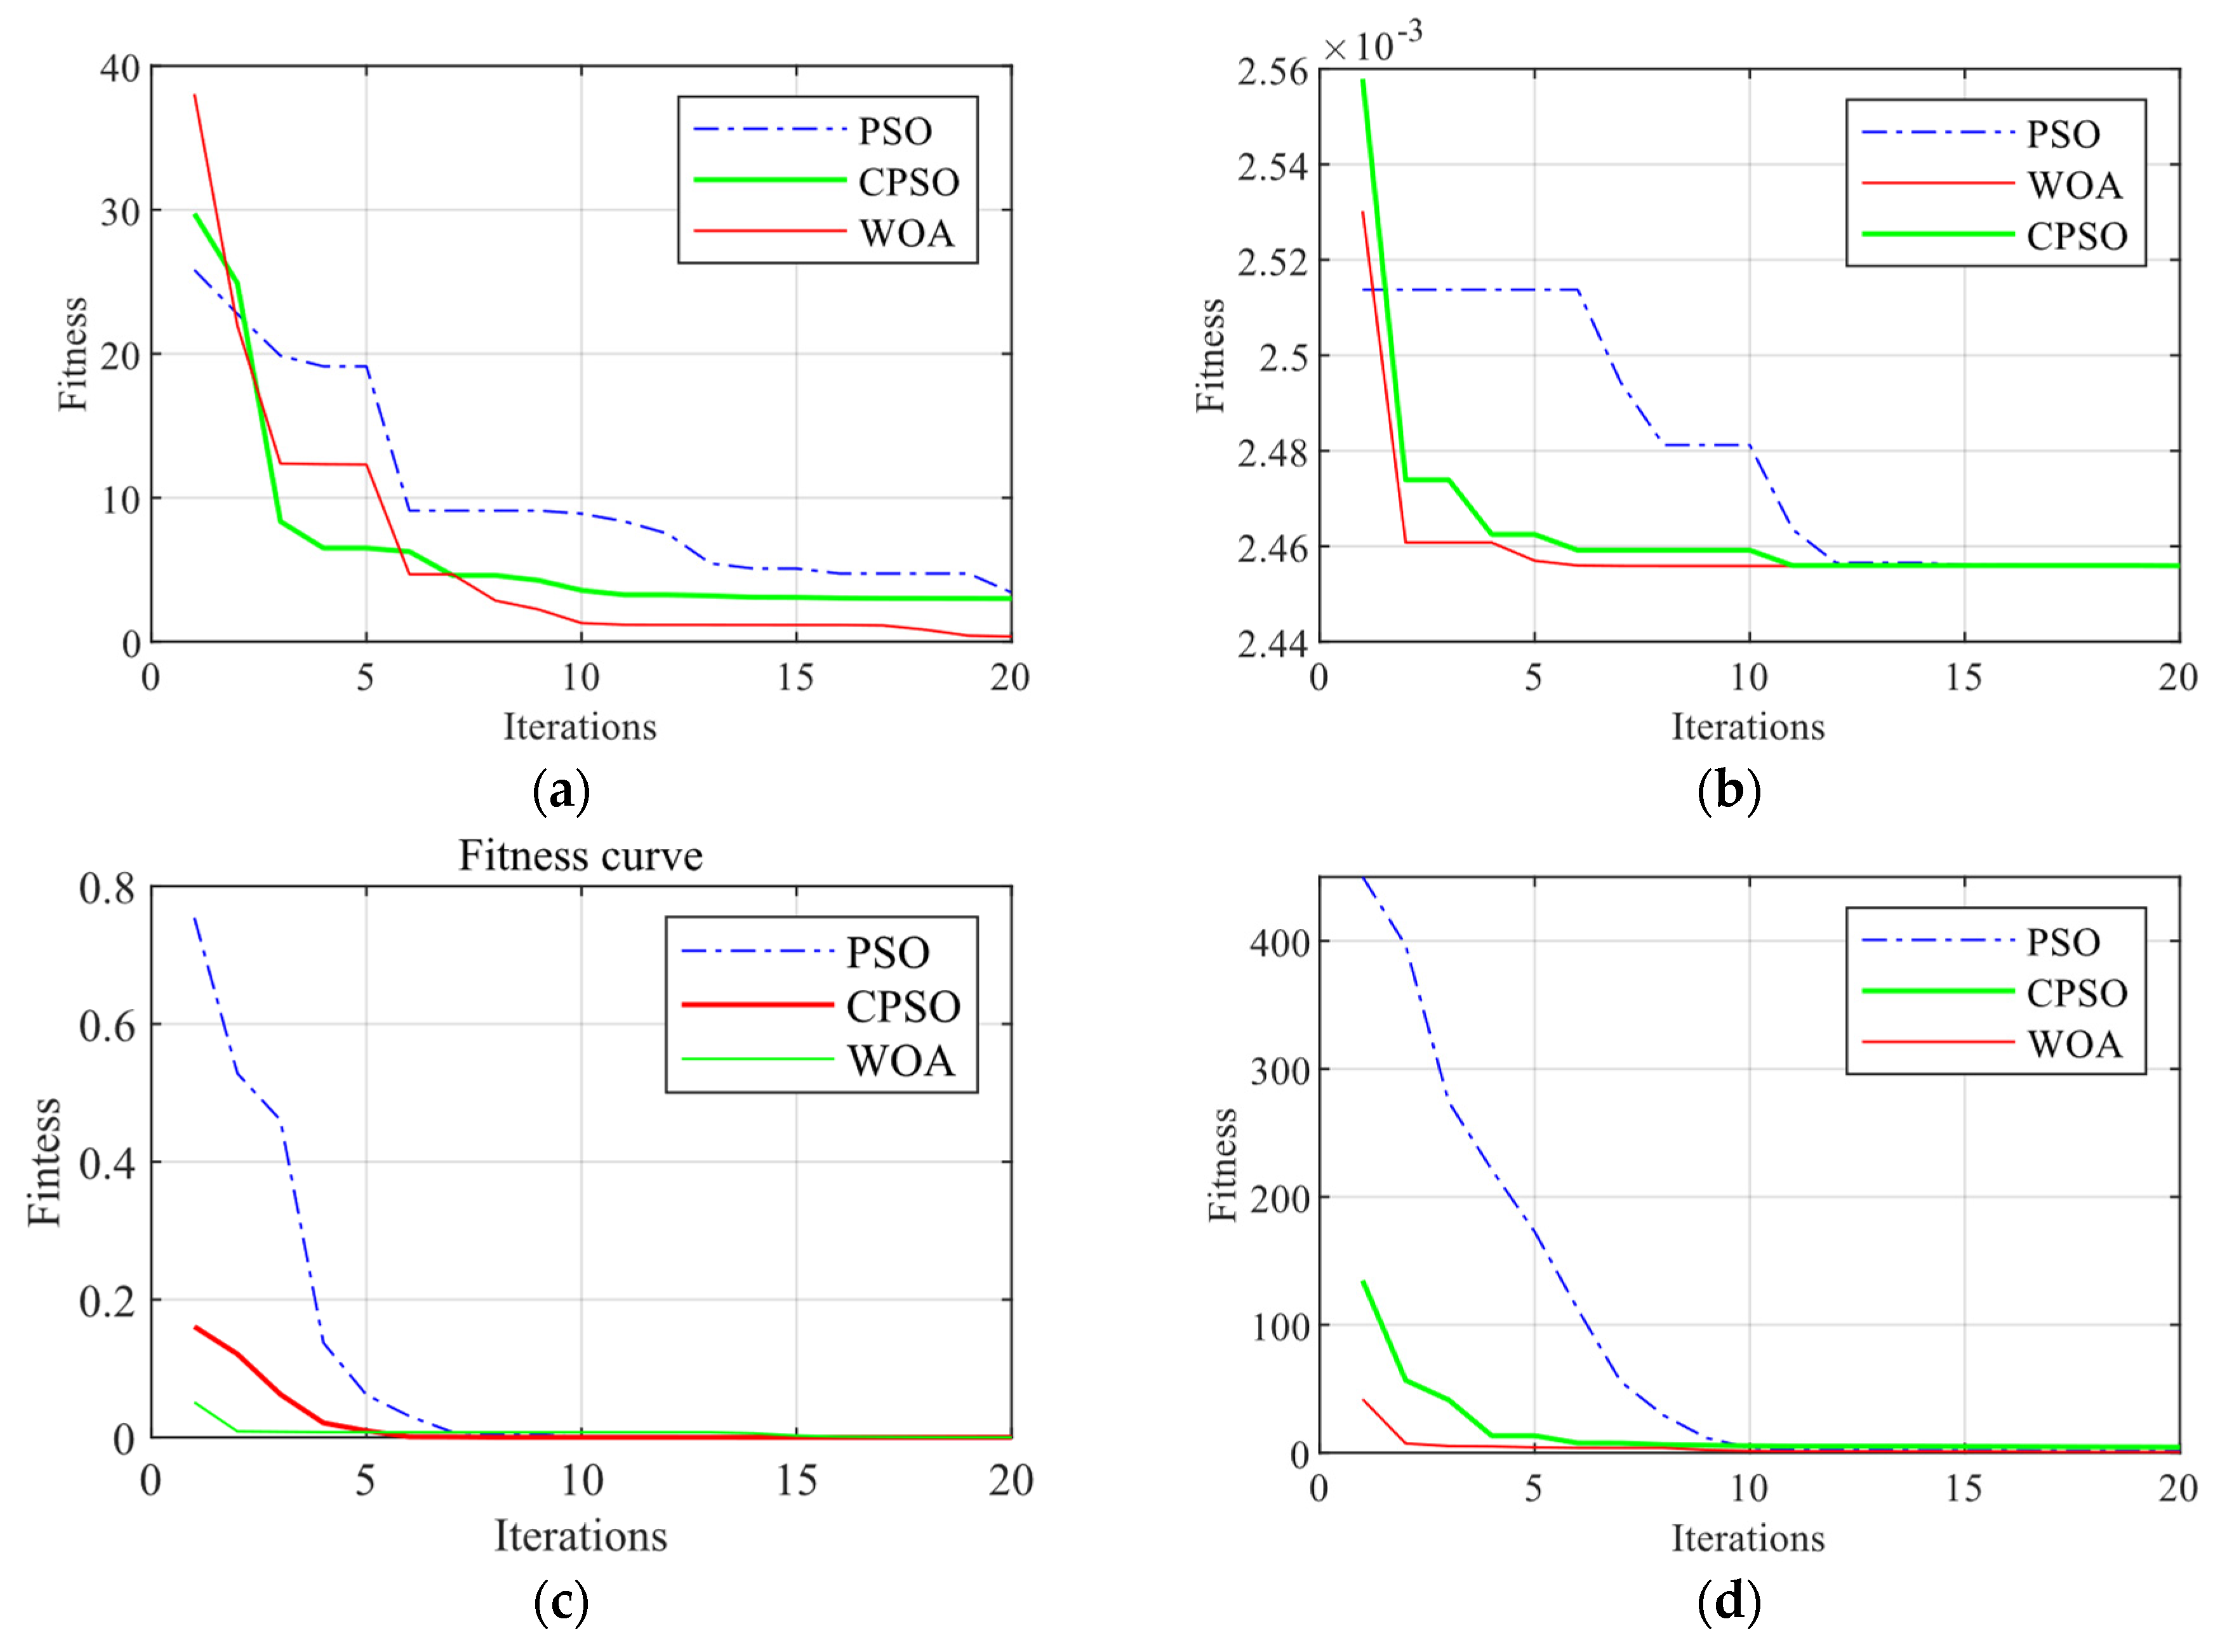
WOA is introduced to the parameter identification of the transmission system, and the algorithm is compared with PSO and CPSO. The simulation shows that the acceleration coefficient of PSO and inertia weight are both set. The social factor in the CPSO algorithm is set to 0.01. The number of iterations of the algorithm is 20, and the global optimal position convergence curves of PSO, CPSO, and WOA are shown in Figure 6.
From the figure, the blue dotted line indicates the fitness curve of the PSO algorithm, the green line indicates the fitness curve of the CPSO algorithm, and the red line indicates the fitness curve of the WOA algorithm. It can be seen from the figure that the convergence speed of WOA is significantly better than that of PSO and CPSO and the number of iterations required to find the best is less, and the results of WOA identification under the three test functions are smaller than those of PSO and CPSO.

4.2. Analysis of the Influence of Control Parameters under Three-Phase Grounded Short-Circuit Conditions

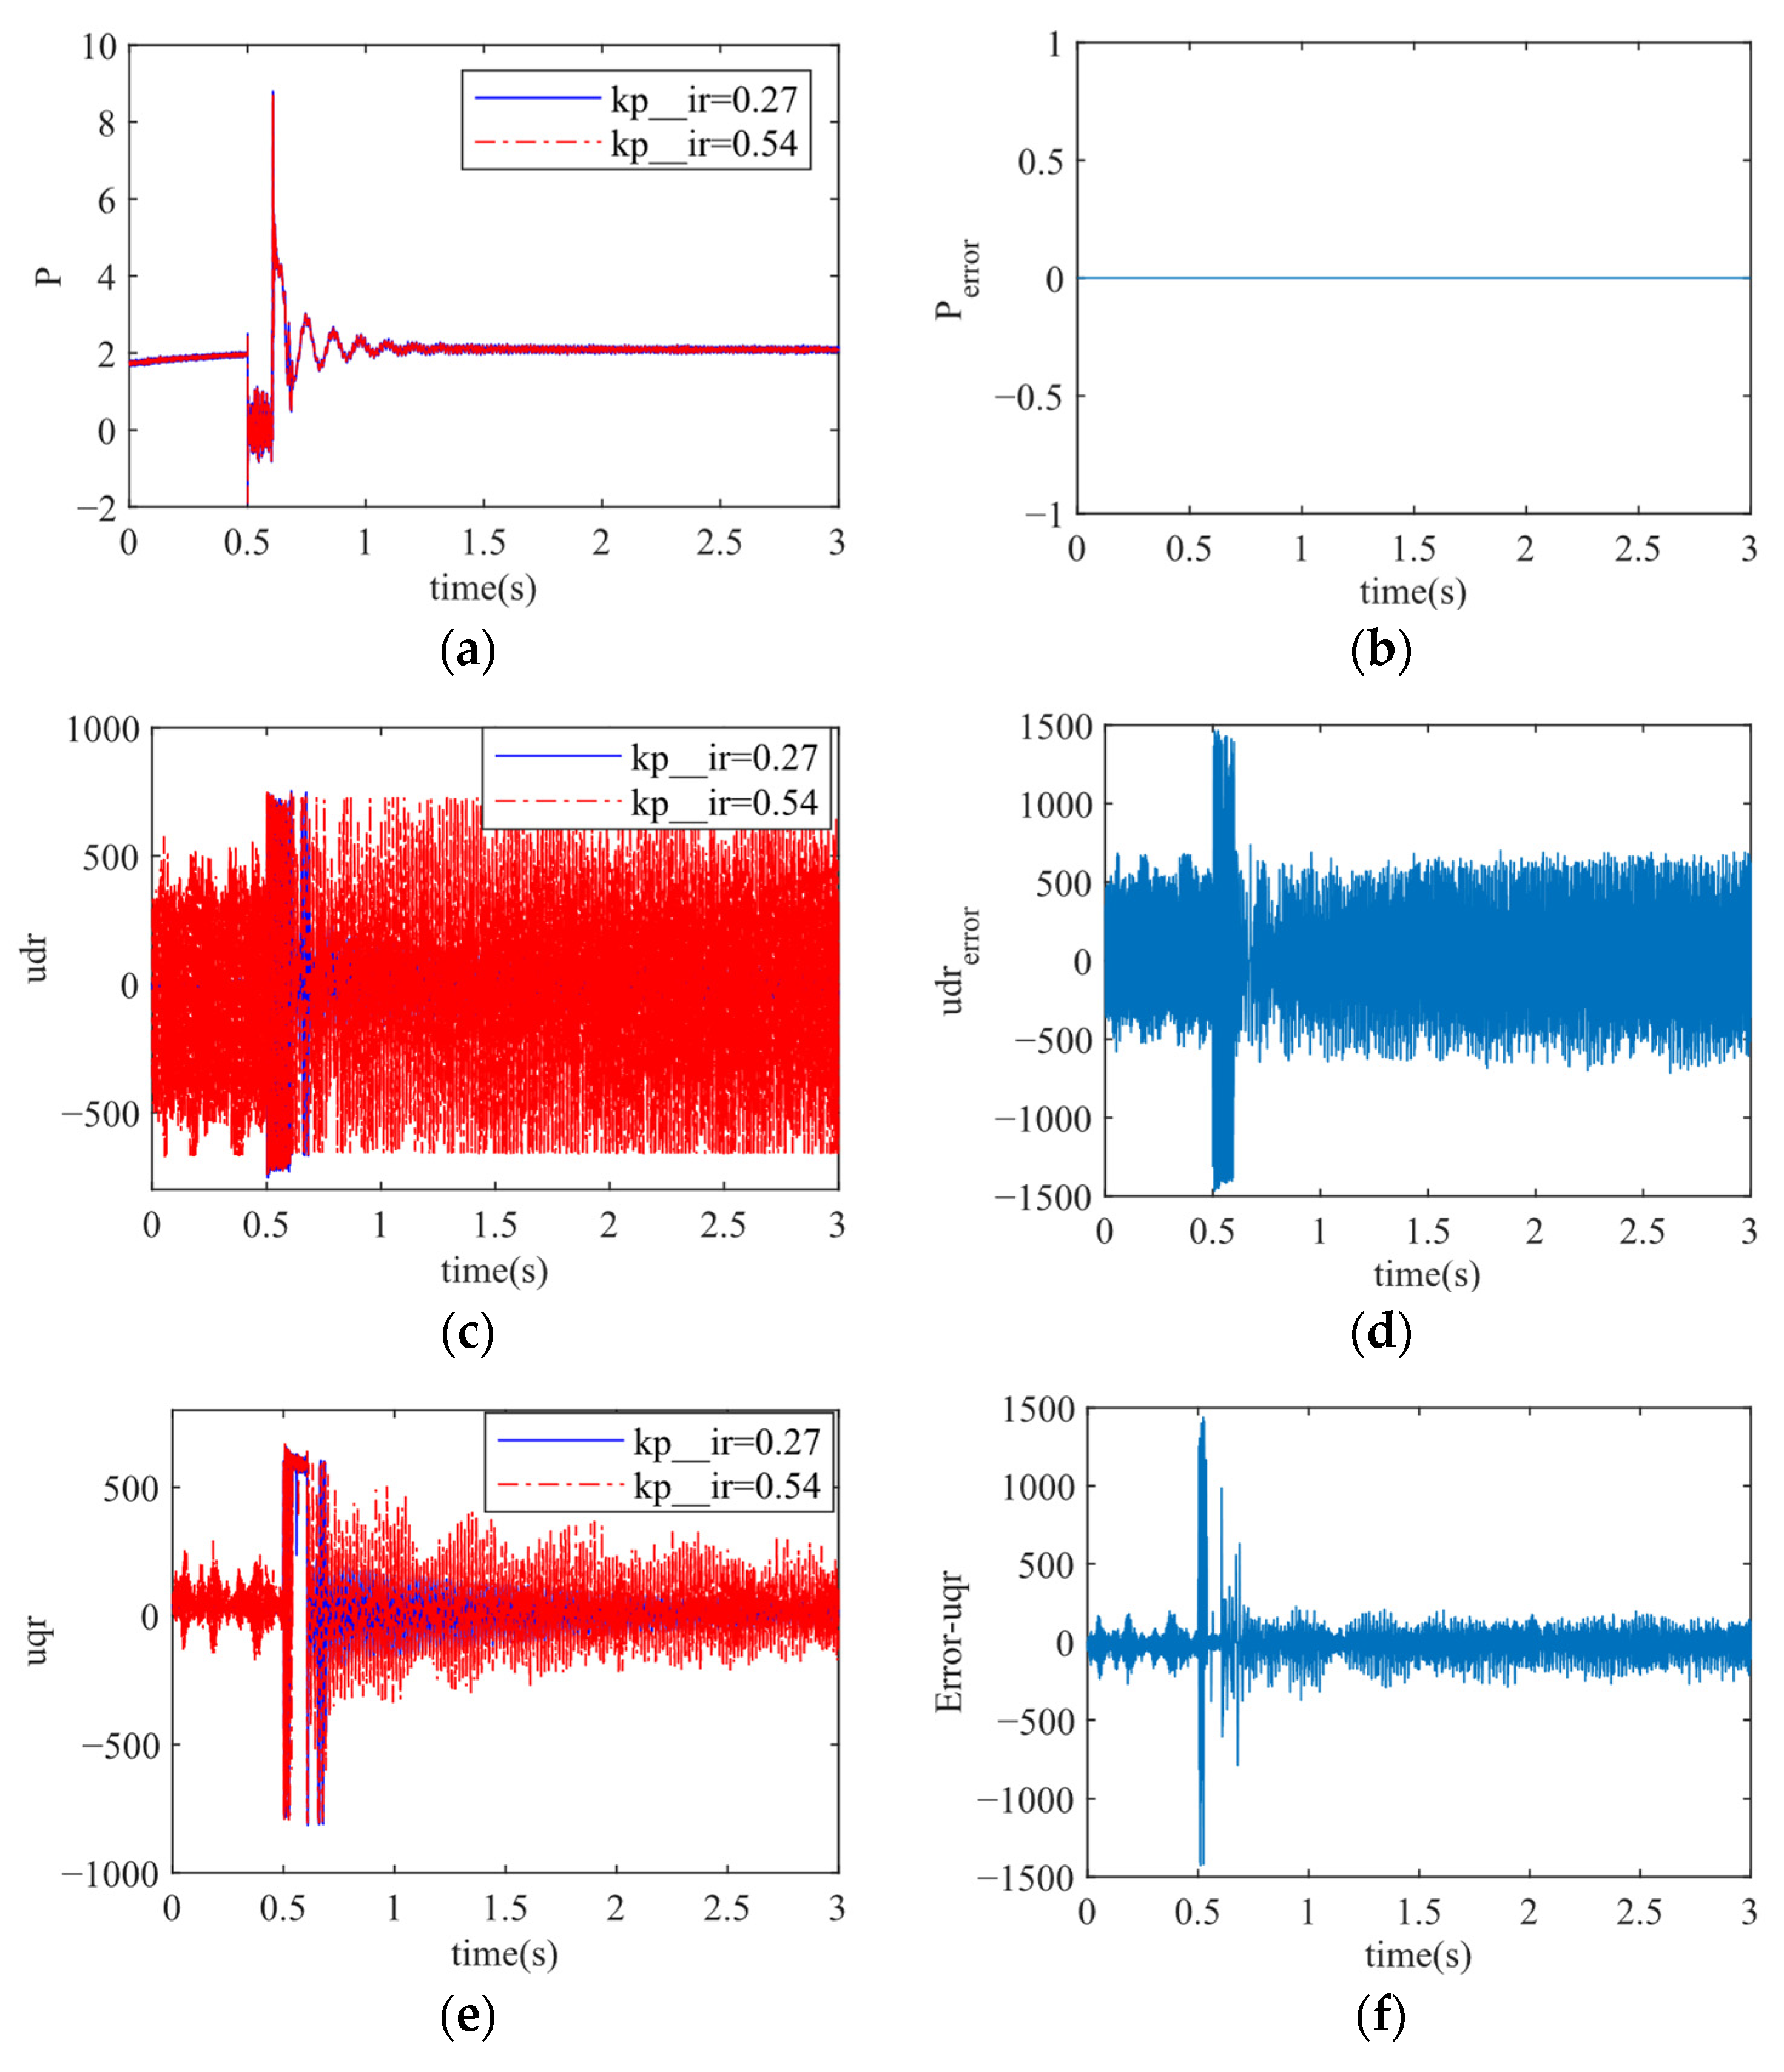
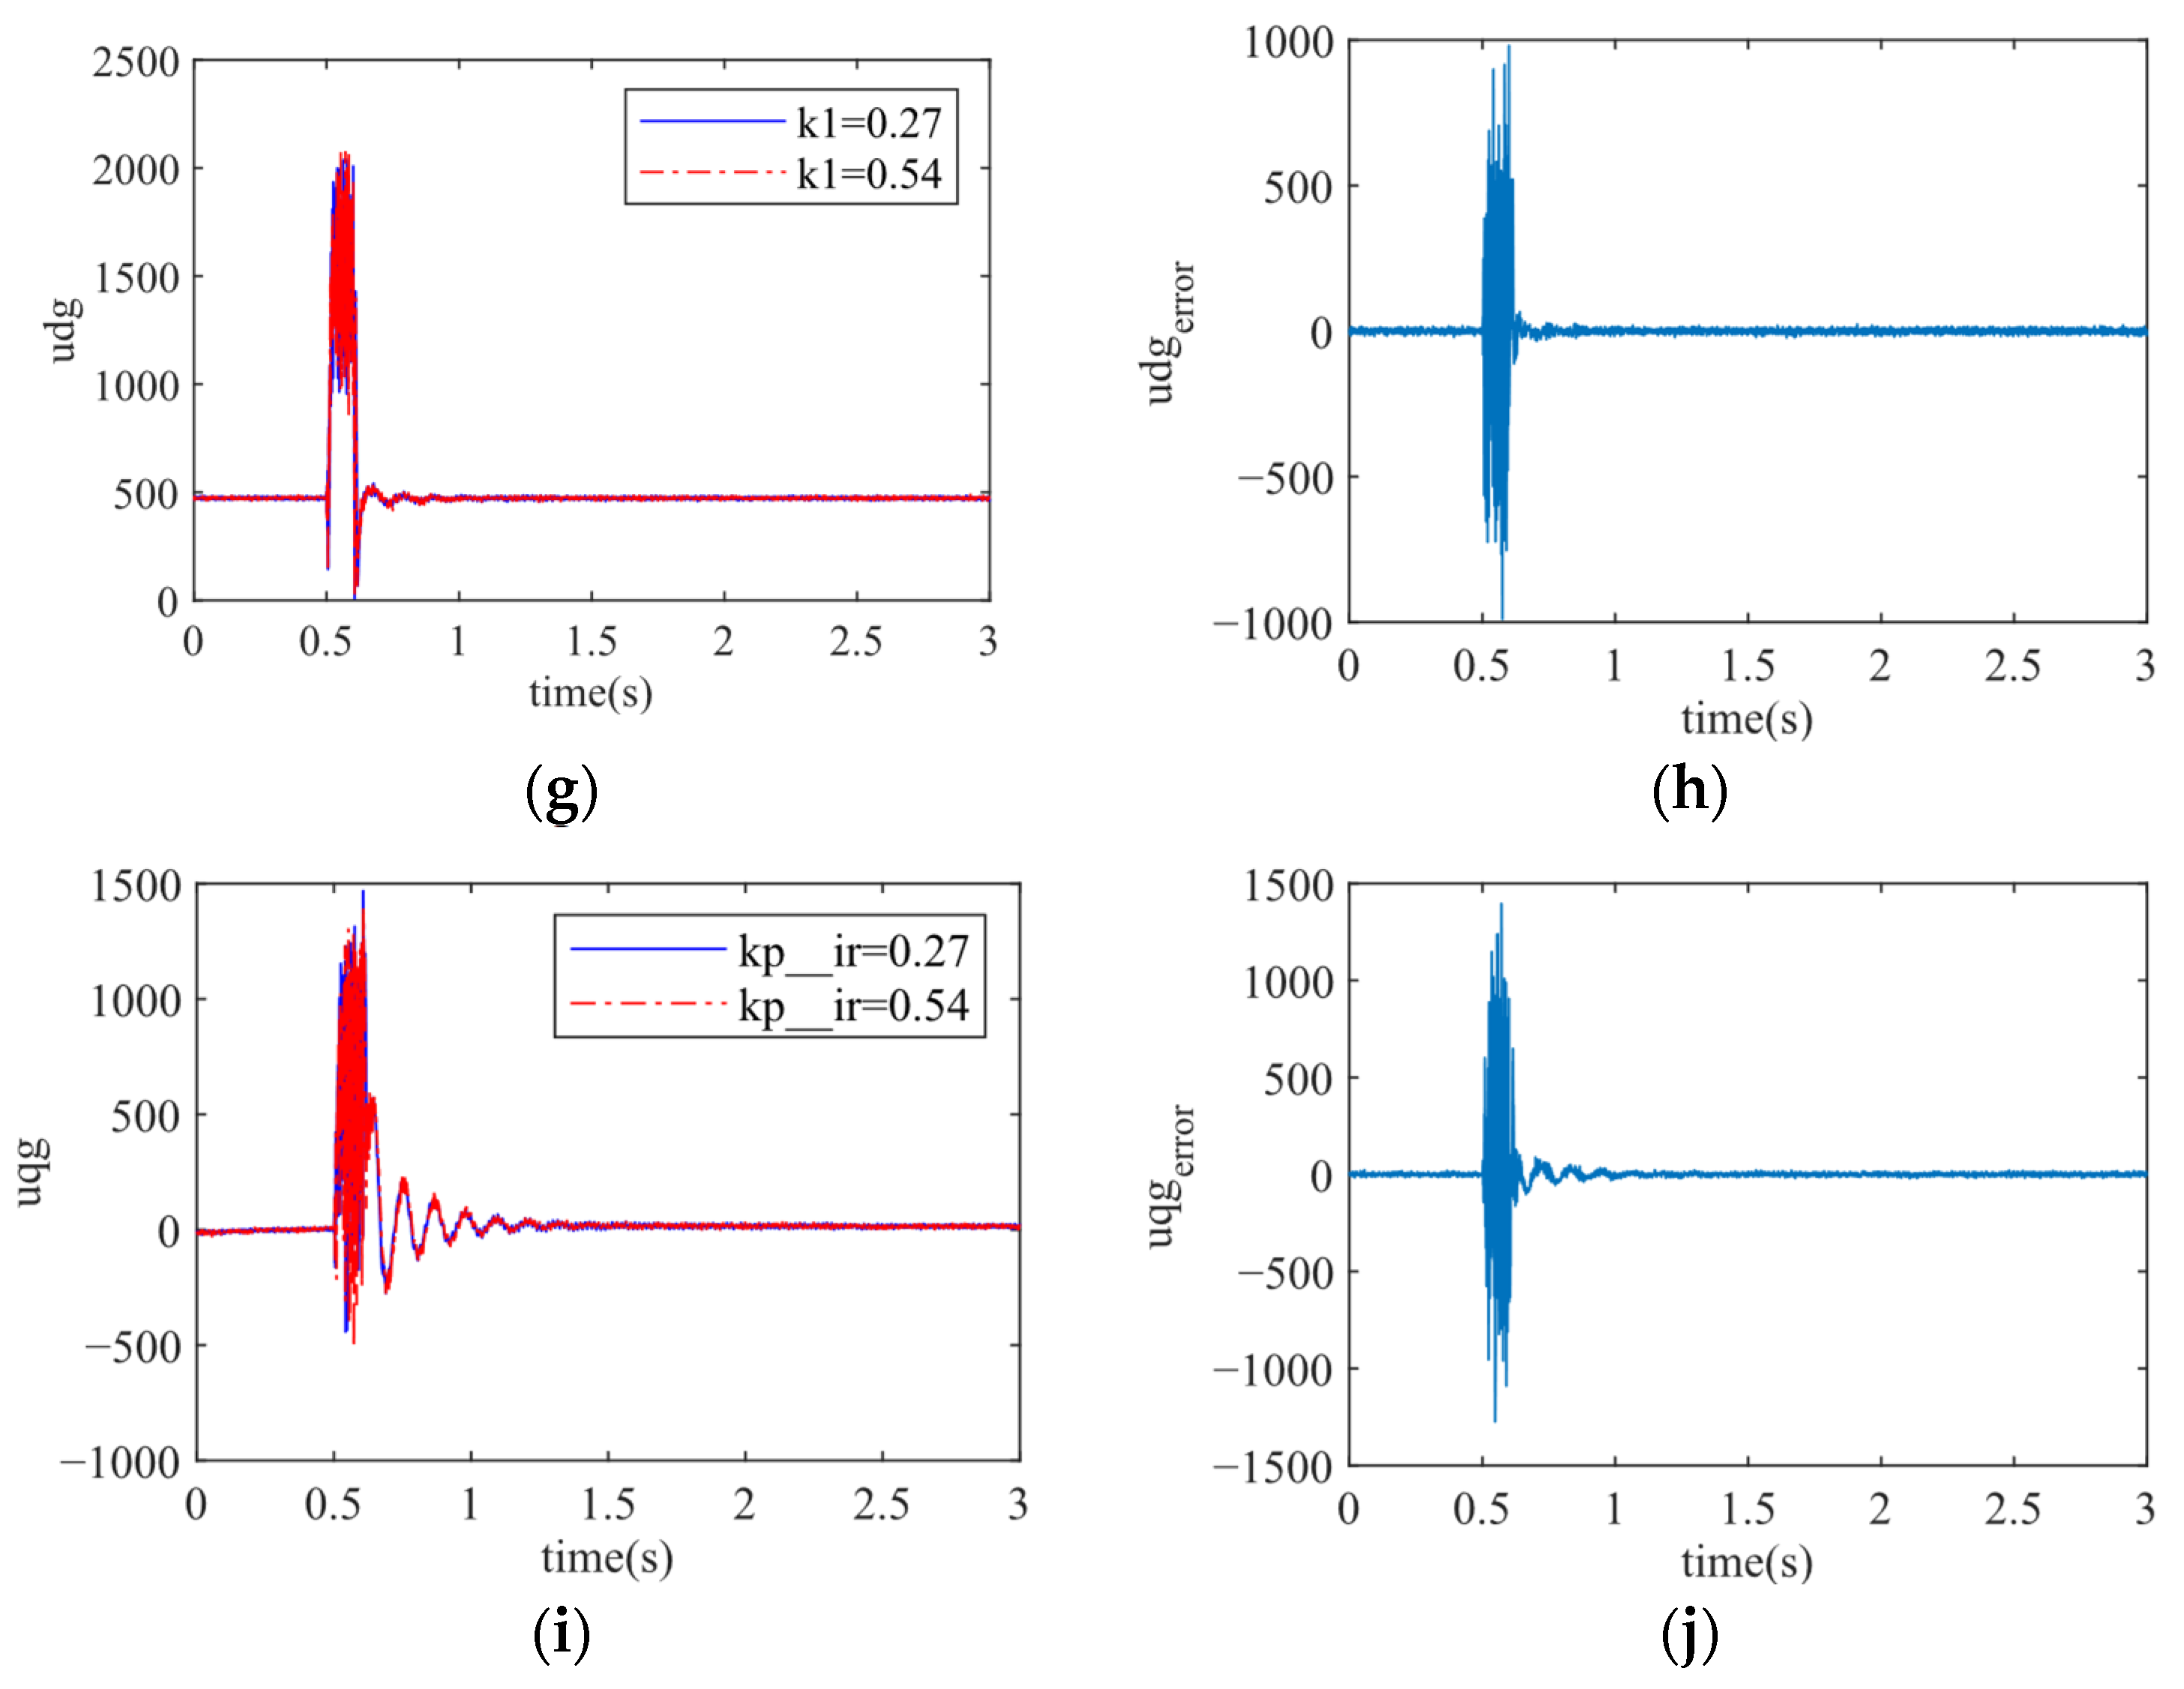
Generator failure is a common phenomenon in the power system, as the fault affects the stable operation of the grid, generates oscillations to the grid, and affects the output response of the wind turbine in the wind turbine. In this paper, we compare and analyze the parameter identification results of the converter control system under fault conditions, compare the effects of PI control parameter changes on active power, rotor-side, and grid-side dq voltage output response through simulation, and visualize the changes between the parameter identification output response and actual model output response. In the simulation experiment, the wind speed is kept at 11 m/s, the initial reactive power is set to 0, the sampling time is 1 × 10⁻⁵ s, a three-phase grounded short-circuit fault is set between the grid and DFIG, and the fault starts at 0.5 s and is removed at 0.6 s with a duration of 0.1 s. To better analyze the effects of converter control parameters on power and voltage under fault conditions, the parameters are set incrementally, and the rotor-side and machine-side PI To better analyze the impact of converter control parameters on power and voltage under fault conditions, the parameters are set in increments, and the rotor-side and machine-side PI parameters are set to +100%, and the active voltage, machine-side, and grid-side rectifier voltage components are collected separately under wind speed fluctuation conditions and compared to the machine-side and grid-side voltage components when the PI control parameters are not changed, and the power and voltage fluctuations are shown in Figure 7.
As can be seen from the above figure, under the maximum power tracking area, the active power is not affected by the rectifier control parameter k1, the voltage components of the dq-axis of GSC vary greatly, the d-axis fluctuates most obviously, and the control parameter of RSC has slightly less influence on the dq voltage components than the rotor side. When the three-phase grounded short-circuit fault occurs at 0.5 s, the voltage components of both the network side and the machine side produce obvious fluctuations, and after 0.6 s, they exit. The voltage quickly returns to stability in a very short time, but the voltage components of the actual unit and the voltage components of the simulated unit produce large errors during the fault occurrence and recovery phases due to the influence of the k1 control parameter, which is consistent with the results of the trajectory sensitivity analysis, further verifying the significant influence of the control parameter on the machine-side and network-side voltages and demonstrating the necessity and practicality of identifying the control parameters of the converter.

4.3. Analysis of Parameter Identification Results

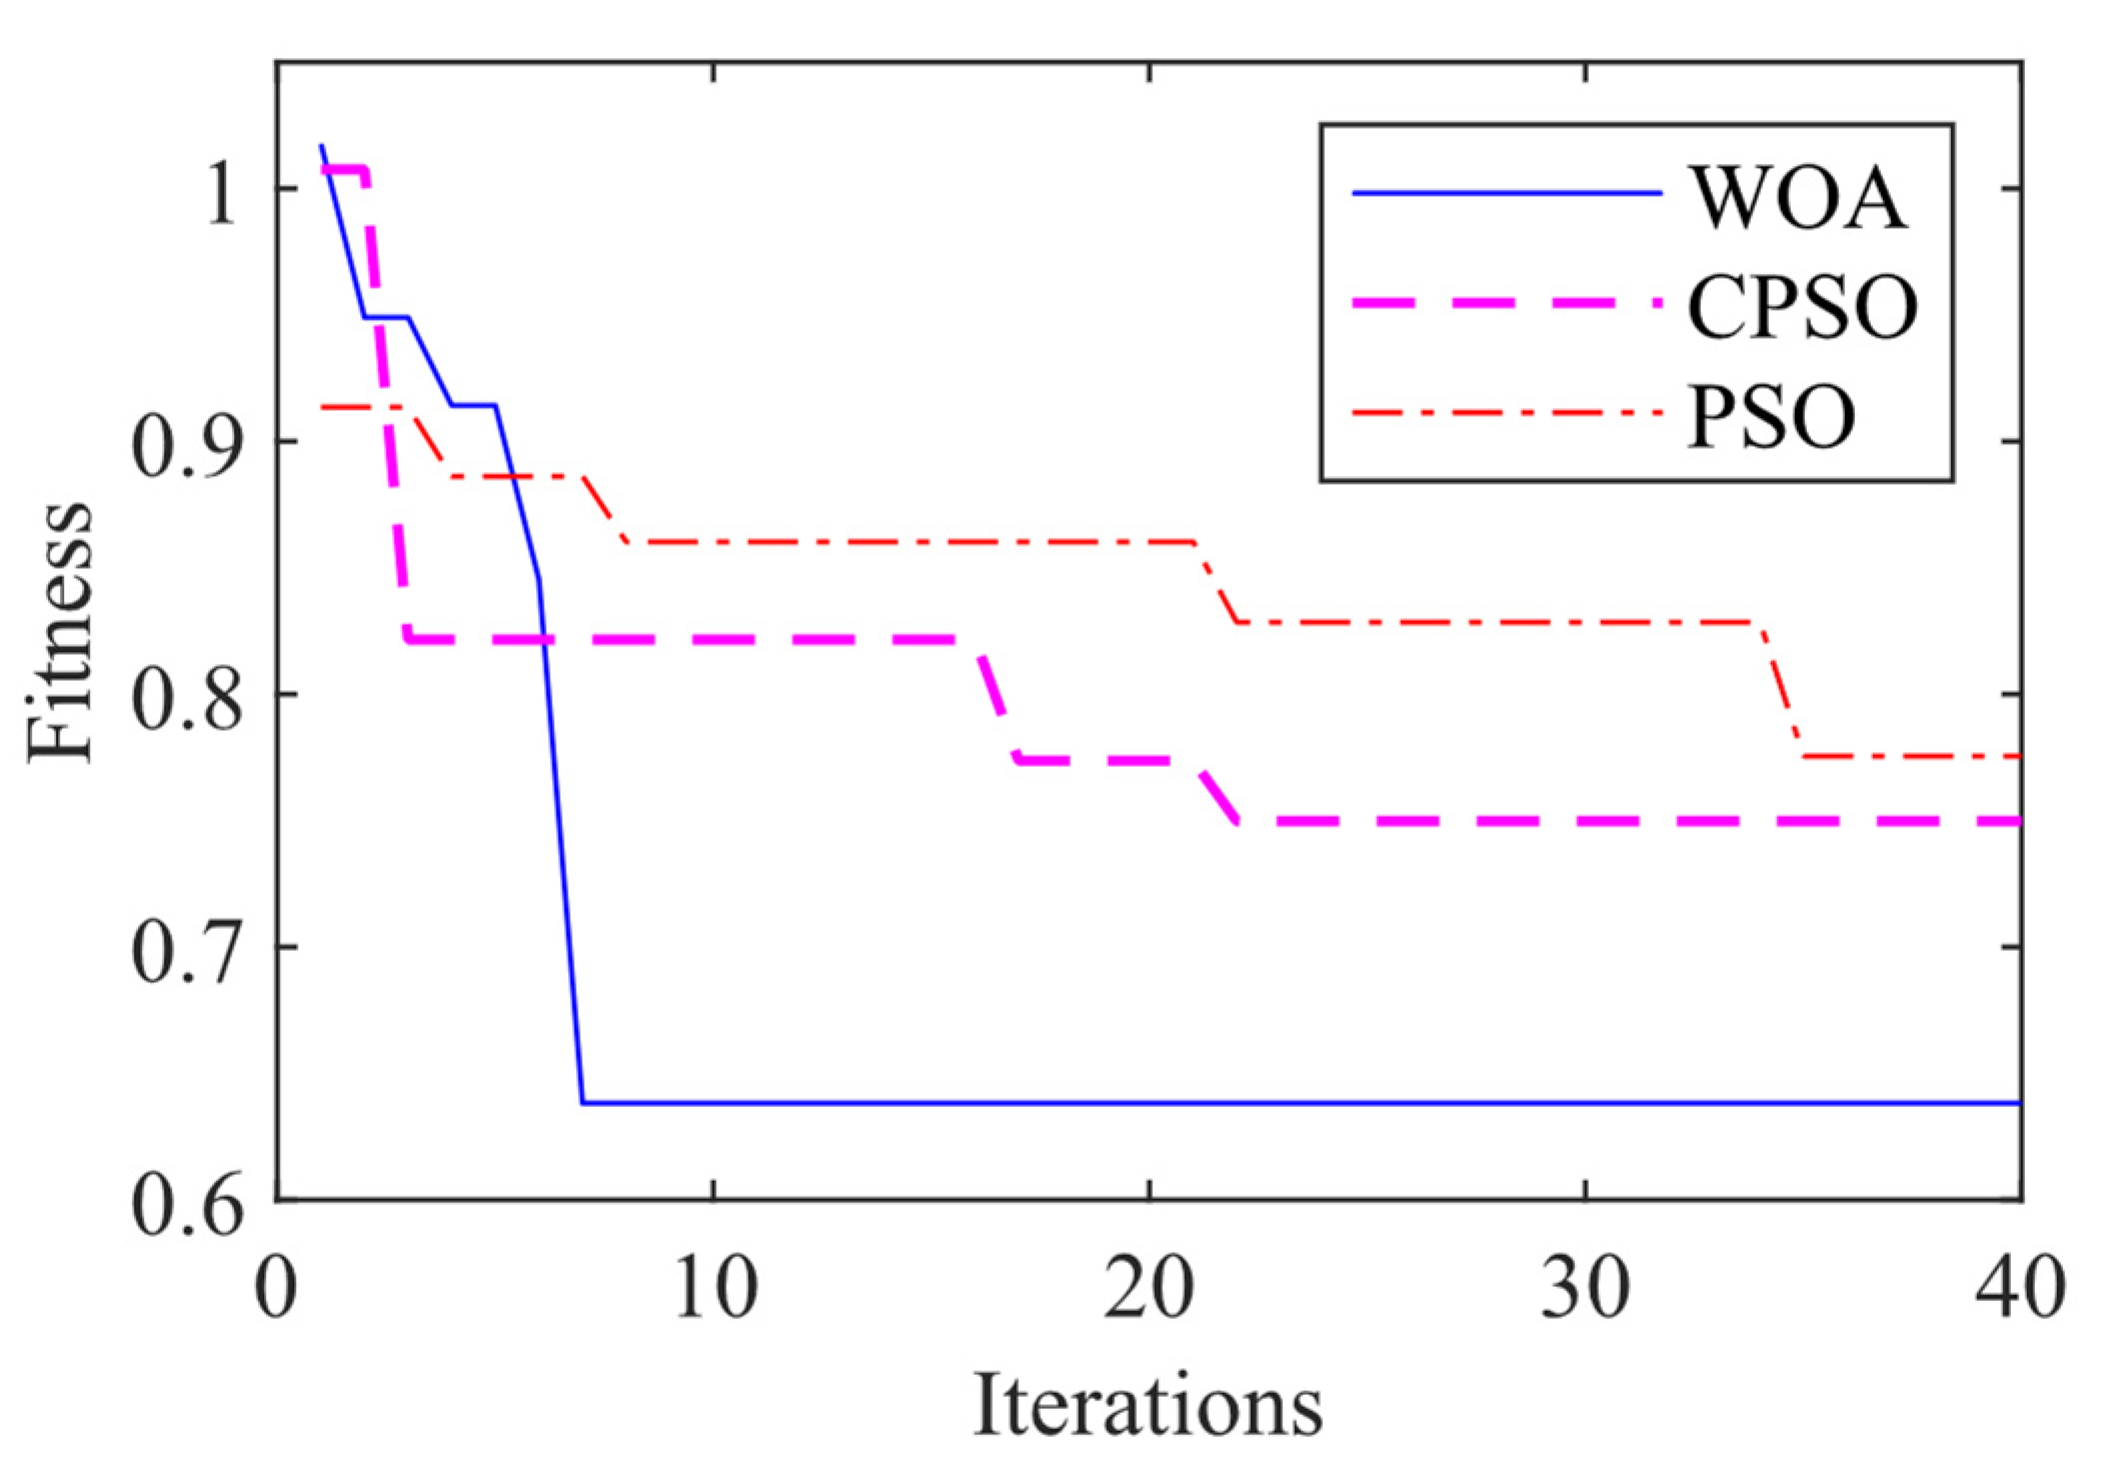
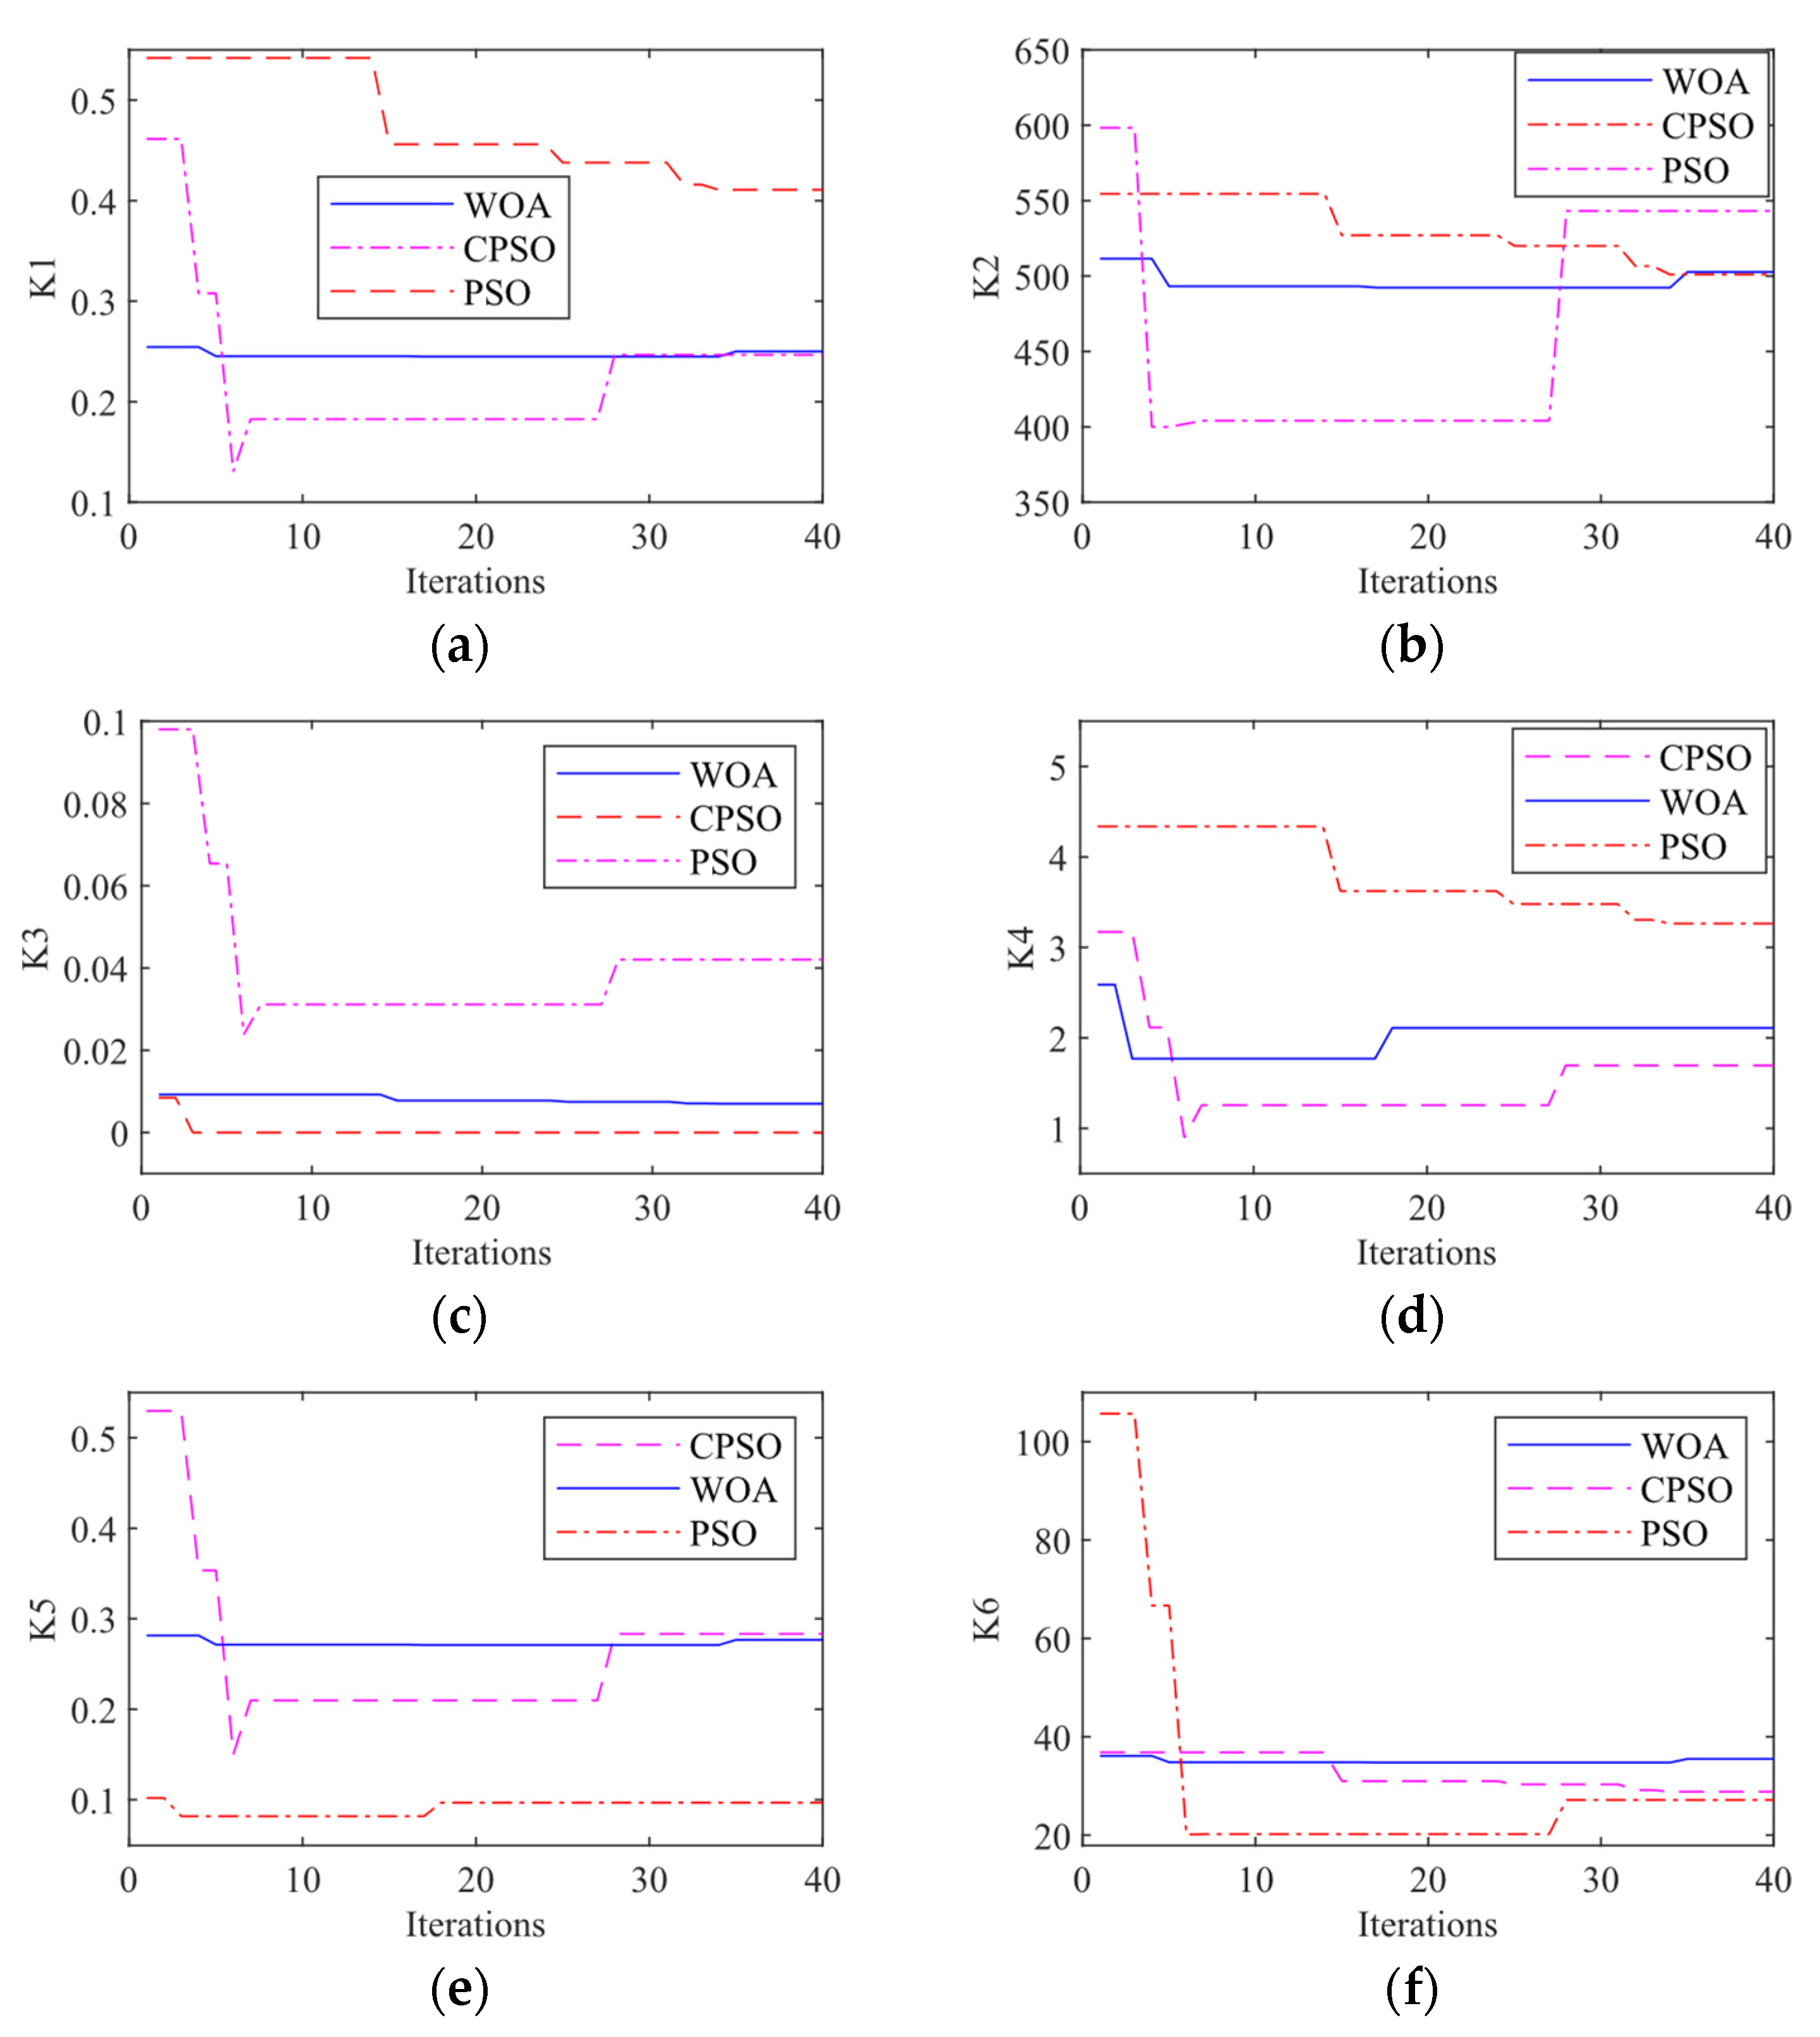
In the simulation experiments, the WOA algorithm is invoked and compared with the computational results of PSO and CPSO. The basic settings of the algorithm are as follows: the number of populations is set to 4, the number of iterations is set to 40, the actual control system parameters k1 = 0.27, k2 = 510, k3 = 0.01, k4 = 2, k5 = 0.3, k6 = 38.6, the upper and lower limits of the particles are the actual values of the parameters ±100%, and the chaos factor of the chaotic particle swarm algorithm is set to 0.01. A three-phase grounding is set between the grid and DFIG For a fair comparison of the algorithms’ advantages and disadvantages, the particle initialization position is set near −100%, the simulation time is 3 s, and the sampling period is set to 1 × 10⁻⁵ s. The convergence curve of the identification algorithm under the MPPT zone is shown in Figure 8.
The comparative graphs of the rotor-side and network-side control system PI parameter identification results for the three-phase ground fault condition is shown in Figure 9.
Among them, the comparison of the optimal deviation values of each generation of the machine side and the network-side converter under the three-phase grounded short circuit under the three algorithms for parameter identification is shown above. Due to the problem of the local optimum of the particle swarm, the particle swarm algorithm cannot find the global optimal solution after a certain number of iterations, which makes the parameter identification results have a large error, and the chaotic particle swarm algorithm reflects the chaos factor to improve the identification ability of the algorithm, which has significantly improved the identification accuracy and convergence speed compared with the particle swarm algorithm. Compared with WOA, WOA has a higher and faster parameter recognition ability, so WOA can improve the recognition accuracy by recognizing the parameters of the DFIG rectifier control system.

5. Conclusions

In order to solve the problems of insufficient accuracy, slow iteration speed, and narrow optimization range of the existing algorithm for doubly fed wind turbine converter control parameters, we propose a Whale Optimization Algorithm (WOA) with fast convergence speed, fewer adjustment parameters, and strong active search capability, analyze the influence of different parameters on power and voltage output under different operating conditions, and construct a converter control parameter adaptation function to improve converter control parameter identification accuracy. The main conclusions are as follows:
(1) The whale algorithm is introduced and compared with PSO and CPSO algorithms, and the convergence of the algorithm is analyzed by classical test functions, which shows that the WOA converges fast and discriminates accurately, and the algorithm jumps out of the local search and increases the global search capability, and its convergence effect is generally better than that of PSO and CPSO.
(2) Based on the detailed dynamic model of the DFIG converter, the trajectory sensitivity analysis is adopted by selecting the same observables, and the combination of machine-side dq voltage and RSC dq voltage as the observables is conducive to improving the drive system parameter identification accuracy.
(3) The influence of converter control system parameter changes on unit output response under MPPT area, and the analysis of control parameter fluctuations on rotor-side and grid-side dq voltages under fault conditions, show the necessity and practicality of converter control parameter identification.
(4) The WOA-based method for accurate parameter identification of the converter control system is proposed. By tracking the dq voltage component of converter control parameters in real-time and using WOA for parameter identification, the accuracy is improved compared to both PSO and CPSO. The WOA algorithm can identify the parameters more accurately and quickly, improve the parameter technology support for the simulation field, further improve the system control performance and reduce the system loss in the engineering application field, which shows the effectiveness and practicality of the WOA proposed in this paper.

Author Contributions

Conceptualization, Y.L.; methodology, Y.L.; software, Y.Z., J.Q., F.Y. and S.X.; validation, Y.L., Y.Z., J.Q., F.Y. and S.X.; formal analysis, Y.L.; investigation, Y.L.; writing—original draft, Y.L.; writing—review and editing, Y.L.; supervision, Y.Z., J.Q., F.Y. and S.X. All authors have read and agreed to the published version of the manuscript.

Funding

The research reported here is financially supported by the National Natural Science Foundation of China (No. 52079059 and 52269020).

Conflicts of Interest

The authors declare no conflict of interest.

References

  1. Aghajani, G.; Ghadimi, N. Multi-objective energy management in a micro-grid. Energy Rep. 2018, 4, 218–225. [Google Scholar] [CrossRef]
  2. Gollou, A.R.; Ghadimi, N. A new feature selection and hybrid forecast engine for day-ahead price forecasting of electricity markets. J. Intell. Fuzzy Syst. Appl. Eng. Technol. 2017, 32, 4031–4045. [Google Scholar] [CrossRef]
  3. Liu, Y.; Wang, W.; Ghadimi, N. Electricity load forecasting by an improved forecast engine for building level consumers. Energy 2017, 139, 18–30. [Google Scholar] [CrossRef]
  4. Wang, T.; Zhu, Z.; Nian, H. A review of the operation technology of doubly-fed wind power system under a non-ideal grid. J. Electr. Eng. Technol. 2020, 35, 455–471. [Google Scholar] [CrossRef]
  5. Wang, R.; Zhang, R.; Wang, M.; Gao, X.; Qin, B. A tracking control method to enhance the low voltage ride-through capability of doubly-fed wind power systems. Power Eng. Technol. 2021, 40, 185–191. [Google Scholar]
  6. Huang, S.; Ji, T.; Wang, T. Transfer Function Sensitivity Based DFIG Shedding Scheme to Mitigate Subsynchronous Oscillation. In Proceedings of the 2021 IEEE 4th International Electrical and Energy Conference (CIEEC), Wuhan, China, 28–30 May 2021; pp. 1–6. [Google Scholar]
  7. Kouadria, S.; Berkouk, E.M.; Messlem, Y.; Denaï, M. Improved control strategy of DFIG-based wind turbines using direct torque and direct power control techniques. J. Renew. Sustain. Energy 2018, 10, 043306. [Google Scholar] [CrossRef] [Green Version]
  8. Yuhao, Z.; Long, Z.; Jen, L.W. Robustness Analysis of Dynamic Equivalent Model of DFIG Wind Farm for Stability Study. IEEE Trans. Ind. Appl. 2018, 54, 5682–5690. [Google Scholar]
  9. Xiaoyu, Z.; Chao, L. Accommodation capability assessment of high-voltage direct current with a large-scale wind power integration system based on risk constraints of sub-synchronous oscillation. J. Eng. 2019, 2019, 2131–2136. [Google Scholar] [CrossRef]
  10. Jishnu, K.K.; Ullah, K.M.S.; Youyi, W.; AIi, I.M.; Jin, Y.Y. A Novel Control Technique to Reduce the Effects of Torsional Interaction in Wind Turbine System. IEEE J. Emerg. Sel. Top. Power Electron. 2019, 7, 2090–2105. [Google Scholar]
  11. Teng, W.; Meng, Y. An improved control strategy to the frequency regulation of DFIG based wind turbine. J. Renew. Sustain. Energy 2017, 9, 063303. [Google Scholar] [CrossRef]
  12. Abdelhak, D.; Seddik, B.; Hossein, I.E. Efficient real-time estimation for DFIG—Performance and reliability enhancement of grid/micro-grid connected energy conversion systems. J. Renew. Sustain. Energy 2019, 11, 025503. [Google Scholar]
  13. Li, H.; Wu, Y.; Li, Q.; Gong, L.; Yang, W. Improved identification method of doubly-fed induction generator based on trajectory sensitivity analysis. Int. J. Electr. Power Energy Syst. 2021, 125, 106472. [Google Scholar] [CrossRef]
  14. Bai, C.; Qin, M.; Sun, Z.; Hong, W. Power response characteristics of wind turbine drive chain under generator short-circuit conditions. Electromech. Eng. 2022, 39, 612–619. [Google Scholar]
  15. Li, H.; Ma, W.; Zhang, Y. Damping control strategy for wind turbine drive chain. Electrotechnology 2022, 14, 19–20+24. [Google Scholar] [CrossRef]
  16. Wei, J.; Guo, J.; Zhang, W.; Xu, Z.; Yan, J.; Ji, K. Study on the dynamic characteristics of electromechanical coupling of large wind turbine gearing system. J. Sol. Energy 2022, 43, 300–308. [Google Scholar] [CrossRef]
  17. Tian, D.; Liu, F.; Fang, J.J.; Li, B.; Tang, S.; Deng, Y. Simulation study on air-machine-electric coupling modeling of wind turbine drive chain. Wind. Energy 2021, 72–78. [Google Scholar]
  18. Wang, J. Characterization method of wind turbine main drive chain based on SCADA system. Inf. Rec. Mater. 2022, 23, 211–214. [Google Scholar] [CrossRef]
  19. Wu, I.; Li, Y.; Yang, C.; Yang, L.; Wang, I. Dynamic load identification algorithm and validation for wind turbine drive chain. Vibration. Test. Diagn. 2022, 42, 664–670+822. [Google Scholar] [CrossRef]
  20. Seif, A.; Karimi, S.; Abdi, H.; Fazli, M. Comparison of DFIG and SEF-DFIG operation in wind turbine systems. In Proceedings of the 2015 16th International Conference on Computational Problems of Electrical Engineering (CPEE), Lviv, Ukraine, 2–5 September 2015; pp. 168–173. [Google Scholar]
  21. Wang, L.; Liu, H.; Chen, J.; Yu, C.; Wang, Z. Research on identifying parameter of DFIG-based wind farm based on mathematical mechanization analysis. IOP Conf. Ser. Earth Environ. Sci. 2022, 983, 012009. [Google Scholar] [CrossRef]
  22. Zhang, J.; Xin, F.; Chen, X.; Wang, J. Parameter identification of DFIG with three-phase short circuit. Dianli Zidonghua Shebei/Electr. Power Autom. Equip. 2012, 32, 86–89. [Google Scholar]
  23. Lei, T.; Barnes, M.; Ozakturk, M. Doubly-fed induction generator wind turbine modelling for detailed electromagnetic system studies. IET Renew. Power Gener. 2013, 7, 180–189. [Google Scholar] [CrossRef]
  24. Trilla, L.; Gomis-Bellmunt, O.; Junyent-Ferre, A.; Mata, M.; Navarro, J.S.; Sudria-Andreu, A. Modeling and Validation of DFIG 3-MW Wind Turbine Using Field Test Data of Balanced and Unbalanced Voltage Sags. IEEE Trans. Sustain. Energy 2011, 2, 509–519. [Google Scholar] [CrossRef]
  25. Zhang, Y.; Qin, W.P.; Cao, R.; Zhu, Z.L.; Xue, S.K.; Wang, K. A simplified modeling approach for DFIG dynamic full process simulation based on two-level trajectory sensitivity analysis. Power Autom. Equip. 2022, 1–13. [Google Scholar] [CrossRef]
  26. Linlin, W.; Hui, L.; Jiaan, Z.; Chenyu, L.; Yamin, S.; Zhijun, L.; Jingwei, L. Identification of Control Parameters for Converters of Doubly Fed Wind Turbines Based on Hybrid Genetic Algorithm. Processes 2022, 10, 567. [Google Scholar]
  27. Pradhan, P.P.; Subudhi, B. An ARMAX-DFIG model based adaptive controller for a wind energy conversion system. Wind Eng. 2022, 46, 12–22. [Google Scholar] [CrossRef]
  28. Xie, G.; Zhao, D. Improved ant-lion algorithm for multi-parameter identification of permanent magnet synchronous motors. J. Power Syst. Autom. 2022, 1–8. [Google Scholar] [CrossRef]
  29. Li, J.; Yang, S.Y.; Xie, Z.; Zhang, X. Online identification of permanent magnet synchronous motor parameters based on effective information iterative fast particle swarm optimization algorithm. J. Electr. Eng. Technol. 2022, 37, 4604–4613. [Google Scholar] [CrossRef]
  30. Zhong, K. Short-Term Wind Power Prediction Based on WOA and LSSVM. Master’s Thesis, Nanchang University, Nanchang, China, 2021. [Google Scholar]
  31. Liu, K.; Wei, D.T. WOA-ESN-based prediction of chaotic oscillations in motor systems. Comput. Phys. 2021, 49, 34–37. [Google Scholar]
  32. Guo, J.; Wu, L.; Qi, J.; Gao, S.; Wang, J. Research on line loss calculation based on WOA optimized Elman neural network. Hebei Electr. Power Technol. 2022, 41, 42–47. [Google Scholar]
  33. Qin, L.Z.; Zhou, Z. Multi-objective combustion optimization for ultra-supercritical units based on whale optimization algorithm. Power Sci. Eng. 2022, 38, 70–78. [Google Scholar]
  34. Hu, D.; Yuan, Y.; Qu, X.; Yin, Q. Energy efficiency optimization analysis of fuel cell/lithium battery hybrid ships based on whale optimization algorithm. Chin. Ship Res. 2022, 17, 155–166. [Google Scholar] [CrossRef]
  35. Zheng, K.; Ding, Y. Fault diagnosis of wind turbine gearbox based on WOA-LSSVM algorithm. J. Shanghai Inst. Electr. Eng. 2020, 23, 317–322. [Google Scholar]
  36. Gong, X. Online Identification of Low Frequency Oscillation Patterns in Power Systems Based on ARMA Recursive Algorithm. Master’s Thesis, Chongqing University, Chongqing, China, 2011. [Google Scholar]
  37. Zhang, H.Q.; Yan, H.F.; Leng, Y.L.; Wang, X.Y. Study on online identification of PMSM based on model reference adaption. Electr. Drives 2015, 45, 3–7+16. [Google Scholar] [CrossRef]
  38. Pan, X.P.; Ju, P.; Wen, R.C.; Wu, F.; Jin, Y.Q. A frequency domain approach for decoupling identification of rotor-side controller parameters of doubly-fed wind turbines. Power Syst. Autom. 2015, 39, 19–25+108. [Google Scholar]
  39. Pan, X.; Wen, R.; Ju, P.; Jin, Y.; Zhang, Y. A frequency domain approach to identify the parameters of doubly-fed wind turbine grid-side controllers. Power Grid Technol. 2015, 39, 634–638. [Google Scholar] [CrossRef]
  40. Li, J. Research on Parameter Identification Algorithm of Double-Fed Wind Turbine Converter Control System. Master’s Thesis, Hebei University of Technology, Baoding, China, 2021. [Google Scholar]
  41. Zhai, H.; Zhu, C.; Song, C.; Liu, H.; Li, G.; Ma, F. Dynamic modeling and analysis for transmission system of high-power wind turbine gearbox. J. Mech. Sci. Technol. 2015, 29, 4073–4082. [Google Scholar] [CrossRef]
  42. Andrzej, B.; Michał, P.; Joanna, J. The Whale Optimization Algorithm Approach for Deep Neural Networks. Sensors 2021, 21, 8003. [Google Scholar]
Figure 1. RSC system schematic diagram.
Energies 16 02618 g001
Figure 2. GSC system schematic diagram.
Energies 16 02618 g002
Figure 3. Trajectory sensitivity diagram. (a) k1 trajectory sensitivity under active and rotor-side observations; (b) k2 trajectory sensitivity under active and rotor-side observations; (c) k3 trajectory sensitivity under active and rotor-side observations; (d) k4 trajectory sensitivity under active and rotor-side observations; (e) k5 trajectory sensitivity under active and rotor-side observations; (f) k6 trajectory sensitivity under active and rotor-side observations; (g) sensitivity of k1 trajectory under grid-side observation measure; (h) sensitivity of k1 trajectory under grid-side observation measure; (i) sensitivity of k2 trajectory under grid-side observation measure; (j) sensitivity of k3 trajectory under grid-side observation measure; (k) sensitivity of k4 trajectory under grid-side observation measure; (l) sensitivity of k5 trajectory under grid-side observation measure.
Energies 16 02618 g003aEnergies 16 02618 g003b
Figure 4. Parameter identification flow chart.
Energies 16 02618 g004
Figure 5. Test function model. (a) Rastrigin; (b) Schaffer; (c) Griewank; (d) Rosenbrock.
Energies 16 02618 g005
Figure 6. Test function fitness curve. (a) Rastrigin; (b) Schaffer; (c) Griewank; (d) Rosenbrock.
Energies 16 02618 g006
Figure 7. Output response and error curve during a three-phase ground fault. (a) P-response curves; (b) P-error curves; (c) udr-response curves; (d) udr-error curves; (e) uqr-response curves; (f) uqr-error curves; (g) udg-response curves; (h) udg-error curves; (i) uqg-response curves; (j) uqg-error curves.
Energies 16 02618 g007aEnergies 16 02618 g007b
Figure 8. Recognition algorithm fitness curve.
Energies 16 02618 g008
Figure 9. (a) Parameter k1 identification result; (b) Parameter k2 identification result; (c) Parameter k3 identification result; (d) Parameter k4 identification result; (e) Parameter k5 identification result; (f) Parameter k6 identification result.
Energies 16 02618 g009
Table 1. Comparison of algorithm advantages and disadvantages.
AlgorithmsApplication AreasAdvantagesDisadvantages
Least SquaresCurve fitting, state estimation, offline parameter identification, etc.Can find the best functional match for the data by minimizing the sum of squares of errorsEasy to saturate data, unable to realize online parameter identification
PSOState estimation, online parameter identification, etc.High precision, a simple calculationEasy local convergence, slow convergence speed, difficult multi-parameter identification, and weak global search capability
CPSOState estimation, online parameter identification, etc.High precision, complex computation, strong global search capabilityEasy to converge locally, slow convergence speed
WOAState prediction, multi-objective optimization, fault diagnosis, etc.High precision, fast convergence, simple computation, and strong global search abilityStill have a local convergence problem
Disclaimer/Publisher’s Note: The statements, opinions and data contained in all publications are solely those of the individual author(s) and contributor(s) and not of MDPI and/or the editor(s). MDPI and/or the editor(s) disclaim responsibility for any injury to people or property resulting from any ideas, methods, instructions or products referred to in the content.