Article

A Comprehensive Assessment of the Refrigerant Charging Amount on the Global Performance of a Transcritical CO2-Based Bus Air Conditioning and Heat Pump System

School of Energy and Power Engineering, Xi’an Jiaotong University, Xi’an 710049, China
*
Author to whom correspondence should be addressed.
Energies 2023, 16(6), 2600; https://doi.org/10.3390/en16062600
Submission received: 7 February 2023 / Revised: 19 February 2023 / Accepted: 7 March 2023 / Published: 9 March 2023
(This article belongs to the Special Issue Current Status on the Thermal Management of Electric Vehicles)

Abstract

:
To mitigate the contemporary environmental challenges and to respect the regulations on the progressive ban of hydrofluorocarbons (HFC), natural fluid CO2 was selected as an ideal refrigerant alternative in the transportation domain. In this study, the optimal CO2 charging amount and the refrigerant distribution in a bus air conditioning/heat pump system were analyzed in detail. The results showed that there was a plateau (so named by the best charging amount) of the CO2 charging amount in which the system performance reached an optimal value and maintained it nearly unchanged during this plateau while the performance declined on both sides of the plateau. In addition, the ambient temperature was found to have little effect on the determination of the refrigerant charging plateau, while the refrigerant distribution was affected by the ambient temperature to some extent. Due to the large thermal load and thermal inertia on a bus, the data and conclusions obtained are different from those of ordinary electric small passenger vehicles. This article aims to discover some quantitative parameters and lay a theoretical foundation in this field which is lacking relevant research. Through the research based on the GT-Suite simulation platform, we simulated the transcritical CO2 cycle applied on a bus, and the performance changes of the bus system (COP 1.2–2.2, refrigerating capacity 9.5–18 kW) under different charging rates (3–8 kg) were obtained.

1. Introduction

In view of the prevailing global requirements for environmental protection and conservation, it is urgent to find new refrigerants that are more environmentally friendly, energy-saving, clean, and efficient for use in thermal systems such as vehicle air conditioners [1,2,3]. Various kinds of refrigerants are available, including CO2, R290, and R1234yf, and mixtures, for example, R290/R134a, R600a/R134a, R600a/R290, etc., and there have been many discussions about them [4,5,6]. However, Llopis found that through some technologies such as supercooling, CO2 has better competitiveness and is a better choice as a new refrigerant [7]. In fact, Bellos stated that refrigeration systems with CO2 seem to be attractive choices for the design of refrigeration systems with a small environmental impact [8].
CO2 transcritical technology has a good development prospect, and research on transcritical CO2 in the market is emerging continually [9]. Among many available strategic policies, Manjili proposed that, due to the destructive effects of synthetic refrigerants on the ozone layer of the Earth’s atmosphere, the use of carbon dioxide as a safe, economical, and clean refrigerant has attracted many studies, which means CO2 will increasingly be used as a solution for heating, cooling, and refrigeration [10]. The excellent heating capacity of the transcritical CO2 heat pump/air conditioner has been noticed by all parties, and its extensive application and excellent ability in this field have been confirmed to some extent by its actual application; for example, Song et al. found the best medium temperature in space heating and evaluated the best discharge pressure of a CO2 system [11,12]. Additionally, some researchers have analyzed the advantages of a transcritical CO2 waste heat heating system, compared with general water cooling, and found that it has a better thermal economy, can improve COP, and has better development prospects [13,14]. For the application of the transcritical CO2 heat pump, most of the present research is focused on passenger cars. Chen et al. proposed an improved CO2 heat pump system for electric vehicles by introducing the concept of the two-stage compression of intermediate cooling [15]. They also did some research on the impact of ambient temperature and discussed the impact of the ambient temperature on the refrigerant charge and system. Dandong et al. improved the gas cooler, optimized the thermal parameters, and adopted the system design of the secondary loop. Through the various improvements, they verified that the CO2 heat pump system has excellent heating potential; they also evaluated the CO2 heating system used in electric vehicles and obtained some basic data on the environment in which CO2 is applicable [16,17]. In addition, Llops observed that an indirect two-stage system using CO2 as a cryogenic fluid is a feasible practical solution, especially for warm regions, which further demonstrates the feasibility of CO2 as a new refrigeration fluid [18].
Wang studied the heat transfer performance of the microchannel gas cooler of an automobile CO2 heat pump system and put forward a series of practical theories [19]. In another paper, Dong conducted experimental research on the R744 heat pump system for electric vehicles [20]. Wang also performed experimental research on the determination of the charge of the transcritical CO2 mobile air conditioning system and the performance of the accumulator, so there has been some research on transcritical CO2 [21]. In addition, there are studies on the heating performance of CO2 heat pump buses that examined the influence of various indoor and outdoor parameters, such as the relationship between the discharge pressure and outlet temperature of a gas cooler [22], the influence of the compressor speed and expansion valve opening on a system [23], and waste heat recovery [24]. However, there are few references on the charging amount of the transcritical CO2 system used in bus vehicles, therefore, there are more aspects that need to be studied for regarding the use of CO2 in buses. However, it can be predicted that the transcritical CO2 air conditioning/heat pump system will have a better performance on buses or rail vehicles [25]. Its larger heat exchange area, more than enough air volume, and top-mounted structural layout will bring a better heat exchange performance and less heat loss and can also make full use of energy potential to improve overall efficiency [26].
In terms of the refrigerant selection for bus refrigeration systems, most of the current bus refrigerants on the market are hydrofluorocarbons (HFCs), such as R407C and R410A. However, their use is greatly limited under the current policy, and there are also irreparable shortcomings. With the reduction in ambient temperature, the reduction in heating capacity and system efficiency is inevitable. Therefore, most buses on the market use PTC (positive temperature coefficient) electric heating as the main winter heat source. In this regard, there have been studies aimed at steam jet heat pumps to improve the efficiency of heat pumps, hoping to replace the traditional PTC electric heating system. However, considering the extreme weather conditions in northern China, the improvement measures in this regard are limited, and they cannot fully and efficiently provide the heat needed in winter [27]. In view of this, hydrofluorides have a high GWP, which should be replaced. Professor Lorentzen believed that the proposal of a transcritical CO2 heat pump has re-introduced the possibility of the application of transcritical CO2 technology in the vehicle field, and its rapid development and promotion are on the rise [28,29,30]. Compared with other commonly used refrigerants, the GWP and ODP coefficients of CO2 are 1 and 0, respectively, which means it is environmentally friendly and can solve the problem of excessive global carbon emissions to a considerable extent. In addition, for extreme working conditions, CO2 can provide advantages that other refrigerants cannot. Xu et al. found that CO2 has good potential in a cold environment [31] and Stene et al. studied CO2 residential heat pumps and found the potential of CO2 heating in low-temperature spaces [32]. In addition, Song et al. studied the optimal temperature and pressure in a CO2 heating system and pushed the research of CO2 in temperatures below −20 °C [33,34]; it was found to have enough potential to replace the PTC electric heating module used in ordinary trams, greatly reducing costs and saving resources. Yerdesh et al. studied the numerical simulation of a solar collector and cascade heat pump composite hydrothermal system and determined that the refrigerant R744/R290 is an environmentally friendly and sustainable choice due to its global warming impact on the application of a two-stage cascade heat pump [35]. Moreover, Qin et al. conducted a comprehensive study on the effect of internal heat exchangers based on the new evaluation method of a transcritical carbon dioxide heat pump system and discovered the advantages of using CO2 [36]. Therefore, there is an increased possibility of using CO2 as a heat pump refrigerant, and thus the transcritical CO2 air conditioning/heat pump system has been increasingly studied and used. As an environment-friendly refrigerant, CO2 has been used in various fields, such as domestic water heaters [37,38], heating working fluids in winter buildings [39,40], and the drying processes of some items [41].
At present, there has been some research on refrigerant charges. Cho et al. studied the effect of refrigerant charge on the performance of the CO2 system and believed that the COP of the system increased significantly with the increase in refrigerant charge until the optimal charge was reached but then decreased slowly when the refrigerant charge exceeded the optimal charge [42]. The general trend of the system performance change with the change in the CO2 charge was obtained, but the situation of a storage tank was not considered. Kim et al. studied the effect of the refrigerant charging amount on system performance and believed that in the CO2 cycle, the evaporation pressure decreases with the increase in the charging amount, resulting in the enhancement of the specific refrigeration effect under overcharge conditions and the reduction in the specific compression work under under-charged conditions [43]. Zhang et al. evaluated the influence of EEV (electronic expansion valve) opening on the refrigerant charging amount and believed that when the EEV opening was constant, the system performance would first become better and then become worse with the increase in charge volume [44]. With the increase in EEV opening, the pressure in the evaporator would increase, the pressure in the gas cooler would decrease, and the superheat would decrease, which would have a significant impact on the system. Basically, in a normal operating refrigeration system, the refrigerant loaded into the system usually exists in various components in different forms, and the influence of the refrigerant charge amount on the system performance varies under different working conditions [45]. Therefore, there is an optimal refrigerant charge that determines whether the system performance is good or not and is an important parameter that can be improved and optimized [46,47]. At the same time, the refrigerant charge also has an impact on the distribution of refrigerant in the system; the refrigerant charge has a significant effect on the cooling and heating performance of the system [48]. Therefore, exploring this dynamic is conducive to finding the ideal amount to optimize the system.
The research on the transcritical CO2 system indicates that its heating capacity is indeed very good, but there are also constraints in other aspects. Relevant researchers have made a series of improvements in terms of the disadvantages of CO2, and have made great efforts to solve them [49]. To improve energy efficiency, Zhang et al. adopted a multistage compression method to select the appropriate pressure ratio and reduce compressor loss to improve the energy efficiency ratio [50]. At the same time, Andres et al. proposed that the CO2 system for refrigeration was becoming complicated, while parallel compression was physically limited in practical engineering. They then optimized an experimental device for parallel compression, improved the cooling capacity of CO2, and improved its COP [51]. In addition, Han et al. proposed using solar energy in CO2 heat pump systems to reduce energy waste [52]. From another point of view, Baomin et al. studied the thermal performance of the refrigeration cycle of the transcritical carbon dioxide thermoelectric subcooled expander. They advocated using a liquid expander to optimize the discharge pressure of the transcritical carbon dioxide system during system cycle operation [53]. Kohsokabe et al. then connected the expander and compressor in series, which improved the system performance by nearly 30% [54]. Kim et al. adopted the expansion compressor, which enhanced the heat exchange capacity of the unit and improved the COP of the system [55]. Kakuda and Nagata et al. developed the scroll expansion compressor, which they hoped to use to reduce the throttling loss during the system operation [56,57]; the COP increased by nearly 30% and the ejector had the same effect. The use of an ejector can recover a lot of energy. According to the research of Park et al., under reasonable capacity control conditions, an ejector has excellent performance [58,59]. As for the gas cooler, a too-high of outlet temperature will lead to a significant decline in the refrigeration capacity of the transcritical CO2 system, so the application of supercooling is also a means to solve the problem. Song et al. discovered that the use of a subcooler with a transcritical CO2 system can improve the performance of the system; its refrigeration COP increases by at least 10%, and its capacity is improved to a certain extent [60,61]. When summarizing the current development of transcritical CO2, Rony et al. pointed out that the refrigeration capacity of CO2 needs to be improved [62]. In general, in the cooling mode, the outdoor ambient temperature is high, and the outlet temperature of the gas cooler is high, so the enthalpy difference of refrigeration is small, and the COP is low. Scholars have put forward many methods, such as mechanical supercooling, an ejector, expander, etc., but they are not suitable for application in the wide operating conditions of the automotive field. In terms of the safety of the CO2 system, CO2 is a high-pressure system, which requires specific pipelines. Although there is a risk of leakage, the concentration is not high, which will not cause discomfort to personnel. Under normal conditions, the CO2 system is generally in a steady-state operation, and the transient system changes, such as local pressure changes, will not affect the normal operation of the CO2 system.
At present, there are few relevant pieces of research on the transcritical CO2 system being used in buses, but quantitative results are needed to enrich this field. Under the background conditions of completely different thermal inertia and thermal load between buses and small passenger vehicles, some quantitative results were obtained based on the simulation analysis method of the GT-Suite simulation platform. For example, when the charging amount changes from 3 kg to 5 kg, the system is under-charged and only becomes stable when the charging amount changes from 5 kg to 8 kg. After the charging amount reaches 5 kg, the suction and discharge temperatures are stabilized at 30 °C and 100 °C, respectively, and the suction and discharge pressures become about 4.5 MPa and 10 Mpa. For refrigerant distribution, with a charging amount ranging from 5 kg to 8 kg, the evaporator has 1 kg and the gas cooler has 3.6 kg, which remains unchanged. The main change is in the gas-liquid separator, where the liquid increases from 0 kg to 3.3 kg and the gas decreases from 0.4 kg to nearly 0 kg. Regarding the ambient temperature, the optimal cooling capacity is 22, 21, and 19 (kW) at different ambient temperatures of 30, 35, and 40, and the optimal COP is 2.9, 2.5, and 2.1, respectively. The optimal charging range is still 5–8 kg, which is not affected by the change in ambient temperature.
This paper discusses the application of the transcritical CO2 air conditioner/heat pump in buses and railway vehicles, and deeply studies the influence of the refrigerant charge on the operation of the CO2 heat pump. First, we analyzed the influence of the refrigerant charge on the components of the system cycle, then we analyzed the influence of the refrigerant charge on the refrigerant distribution, and finally, we discussed the influence of the ambient temperature. In addition, based on the GT-Suite simulation platform, a simulation model of a passenger car air conditioning/heat pump system based on transcritical CO2 was constructed, and a simulation coupling calculation was carried out. At the same time, a bus experimental environment based on a transcritical CO2 heat pump system was built to test the measured quantity, and a more specific study was carried out for the research problems.

2. The Establishment of the Simulation Model

2.1. The Transcritical CO2-Based Bus Air Conditioning and Heat Pump System

Different from the transcritical CO2 thermal management system with distributed structures installed in passenger cars, the transcritical CO2 air conditioning/heat pump systems used in buses and railway vehicles were always designed as an integrated structure. Thus, the connection of pipes can be soldered to each other, causing an almost negligible refrigerant leakage rate of the transcritical CO2 system.
It can be seen from Figure 1a that the schematic of the transcritical CO2-based bus air conditioning/heat pump system is clear and concise, compared with the transcritical CO2 systems used in passenger cars. Because of the lack of large flow, a large diameter four-way reversing valve, one three-way solenoid valve, and two two-way solenoid valves were employed to achieve the mode-switching function between cooling and heating.
For instance, under the cooling mode, as shown by the solid lines from Figure 1a, the supercritical CO2 fluid was directed into the outdoor heat exchanger and cooled down by the ambient temperature. Next, the supercritical or subcooled CO2 fluid (that is dependent on the temperature and pressure) was forced into the IHX through the check valve, and further cooled down by the low-temperature CO2 fluid. Then, after throttling by the EEV (electronic expansion valve), the two-phase CO2 fluid absorbed heat from the cabin ambient temperature in the indoor heat exchanger and flowed through the liquid-vapor separator and IHX before going back into the compressor. In Figure 1a, EV represents an electromagnetic valve, EEV represents an electronic expansion valve, and IHX represents an internal heat exchanger.
Similarly, under the heating mode, as shown by the dashed lines from Figure 1a, the CO2 fluid could achieve heat release in the indoor heat exchanger and heat absorption from the outdoor heat exchanger by switching the three-way valve. It should be noted that no obvious heat transfer would occur inside the IHX due to the almost 0 K of the temperature approach.
Additionally, the P-h diagram of the transcritical CO2-based bus air conditioning/heat pump system under cooling conditions is shown in Figure 1b. It is obvious that the evaporating pressure could be relatively high (around 4 MPa) to achieve a lower pressure ratio of the cycle due to the appropriate crew cabin temperature, but the gas-cooler outlet CO2 temperature was difficult to cool down to lower than 35 °C due to the high outdoor ambient temperature. On the contrary, the evaporating pressure was always lower thereafter so the discharge pressure could not rise too high for the appropriate pressure ratio and discharge temperature, but the gas-cooler outlet CO2 temperature could be reduced to a lower value to achieve an increased heating capacity under heating conditions. Thus, it was difficult to simply judge whether the cooling COP or heating COP was higher.

2.2. The Simulation Model

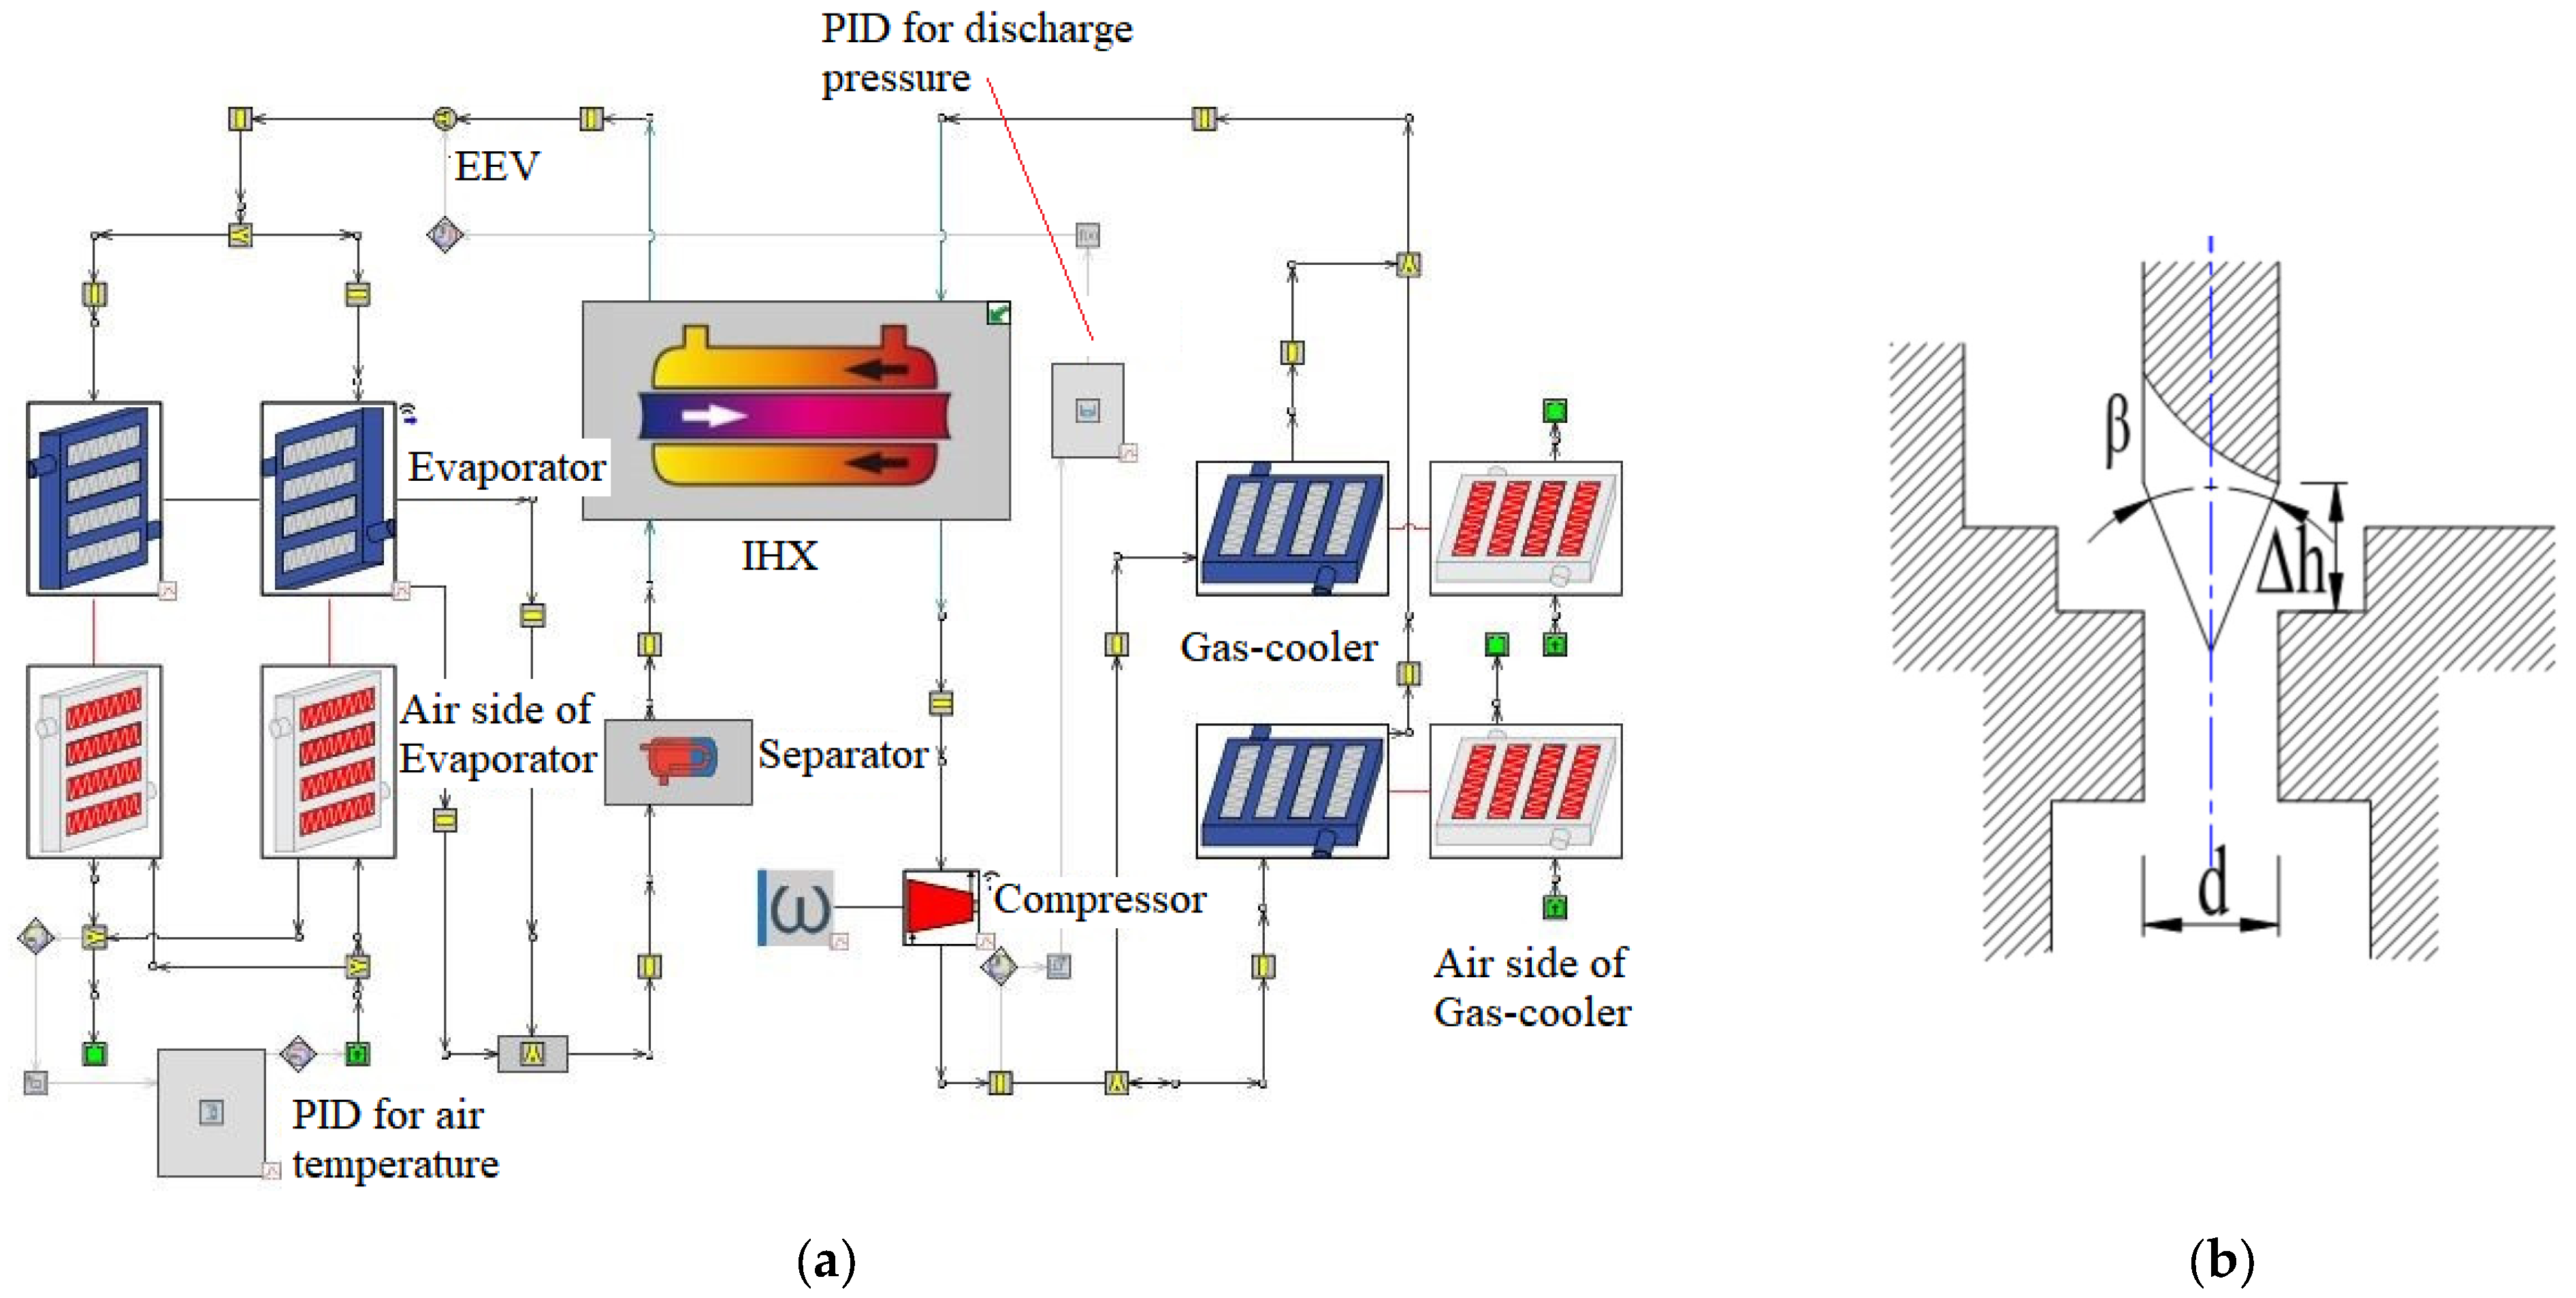
A simulation model of the transcritical CO2-based bus air conditioning/heat pump system was built based on the GT-Suite simulation platform, as shown in Figure 2a. The construction of the evaporator and gas cooler was designed as outdoor and indoor heat exchangers. It should be noted that the three-way and two-way valves were not added in this simulation model because the cooling and heating modes were simulated for simplicity of calculation; the structures of the indoor and outdoor heat exchangers were only swapped between modes.
Two PID controllers were added inside this simulation model: the opening of the EEV was totally dependent on the discharge pressure valve, by which the optimal discharge pressure of the transcritical CO2 cycle could be achieved, and the indoor air supply temperature was totally dependent on the indoor air flow rate, by which a comfortable air supply temperature could be adjusted to a proper value.
The specific modeling methods of each component are described in detail as follows.
  • Compressor
The three-efficiency model was employed in this study to evaluate the performance and parameters of the transcritical CO2 compressor. The mass flow rate of the CO2 compressor can be calculated as:
m r = η v V c o m ρ s ,
Moreover, the shaft power consumption, discharge enthalpy, and total power consumption can be calculated as:
W s h a f t = m r h d h s η s ,
h d = h s + h d , i s h s η i s ,
W c o m = W s h a f t η m o t o r ,
Additionally, the volumetric efficiency, motor efficiency, and isentropic efficiency of the transcritical CO2 compressor can be drawn by the following correlations (the data are from the empirical value of the experiment).
η v = 1.19379 0.13635 P d P s ,
η m = 0.64107 0.07487 P d P s ,
η s = 0.8014 0.04842 P d P s ,
  • Gas-cooler
In the GT-Suite simulation model, the idea of the distributed parameter method was always adopted for the simulation of the heat exchangers. In this study, the gas cooler under cooling conditions was the outdoor heat exchanger, which was presented in the form of finned tubes. The heat transfer conservation at No. j microelement between refrigerant and air can be written as:
Q j = m r , j h T , P r i , j h T , P r o , j ,
Q j = m a , j c p , a T a o , j T a i , j ,
Q j = T r i , j T a o , j T r o , j T a i , j / l n ( T r i , j T a o , j T r o , j T a i , j ) ( 1 α r , j A r , j + 1 α a , j η a A a , j ) ,
The heat transfer of supercritical CO2 was calculated as Gnielinski correlation [41]:
N u D = D h α r λ r = f D / 8 R e D 1000 P r 1 + 12.7 f D / 8 0.5 P r 2 / 3 1         0.5 < P r < 2000 2300 < R e D < 5 * 10 5 ,
In addition, based on the Churchill correlation [42], the friction factor is:
f D = 8 8 R e 12 + 2.457 l n 1 7 R e 0.9 + 0.27 ε 16 + 37530 R e 16 3 2 1 12 ,
  • Evaporator
Similarly, the evaporator under cooling conditions was the indoor heat exchanger, which was also a fin-tube heat exchanger, and the idea of distributed parameter method was still introduced in this part. Then, the heat transfer conservation at the No. j microelement between the refrigerant and air (heat absorption in the refrigerant side, convection between CO2 and wall, and heat release in the air side) can be written as:
Q j = m r , j h r o , j h r i , j ,
Q j = α r A r , j T p m , j T r m , j ,
Q j = m a , j h a i , j h a o , j ,
In addition, the convection between the air and wall should be considered as two situations, named the dry condition and wet condition, and the convection under these two conditions can be obtained by:
Q j = α a d η a d A a , j T a m , j T p m , j ,
Q j = α a d η a d A a , j T a m , j T p m , j b w , m ,
The Cheng boiling heat transfer correlation of the two-phase CO2 fluid during the evaporating process was adopted in this study for evaluating the heat transfer in the evaporator (that is the indoor heat exchanger under cooling conditions and the outdoor exchanger under heating conditions). Due to the obvious shift in flow patterns (intermittent flow, annular flow, and drying region, etc.), the convection heat transfer needed to be drawn by different correlations, which can be written as:
Intermittent flow and annular flow:
α t p = S α n b 3 + α c b 3 1 3 ,
α n b = 131 P r 0.0063 l o g 10 P r 0.55 M 0.5 q 0.58 ,
α c b = 0.0133 4 G 1 x δ 1 ε μ L 0.69 c p L μ L λ L 0.4 λ L δ ,
ε = 1 + 0.12 1 x x ρ g 1 x ρ f + 1.18 G g δ ρ f ρ g ρ f 2 1 4 1 x 1 ,
x L A = 1.8 1 0.875 ρ g ρ f 1 1.75 μ L μ g 1 7 + 1 1 ,
Drying region:
α t p = α t p x d i x x d i x d e x d i α t p x d l α m i s t x d e ,
α m i s t = 0.0117 R e H 0.79 P r g 1.06 Y 1.83 l g D ,
Y = 1 0.1 ρ L ρ g 1 1 x 0.4 ,
q c r i t = 0.131 ρ g 0.5 h L G g σ ρ L ρ g 0.25 ,
x d i = 0.58 e x p 0.52 0.67 W e g 0.17 F r g 0.348 ρ g ρ L 0.25 q q c r i t 0.7 ,
  • Expansion Valve
As mentioned above, an electronic expansion valve (EEV) was employed in the transcritical CO2 system to simply adjust the discharge pressure towards the optimal value. A sketch of the EEV structure is shown in Figure 2b, and the opening of the EEV corresponded to the vertical position of the valve needle. The pores between the valve needle and the orifice plate serve as the flow channel for the refrigerant, thus the area of flow and the mass flow rate through the EEV can be obtained by the size and geometry of the mechanical structure, as shown in Figure 2b:
m r = C D A D 2 ρ e x p , i n P e x p , i n P e x p , o u t 0.5 ,
C D = 0.02005 ρ e x p , i n + 0.634 v e ,
v e = x v g + 1 x v l ,
A D = Δ h π s i n ( β 2 ) ( d Δ h 2 s i n β ) ,

2.3. Methodology

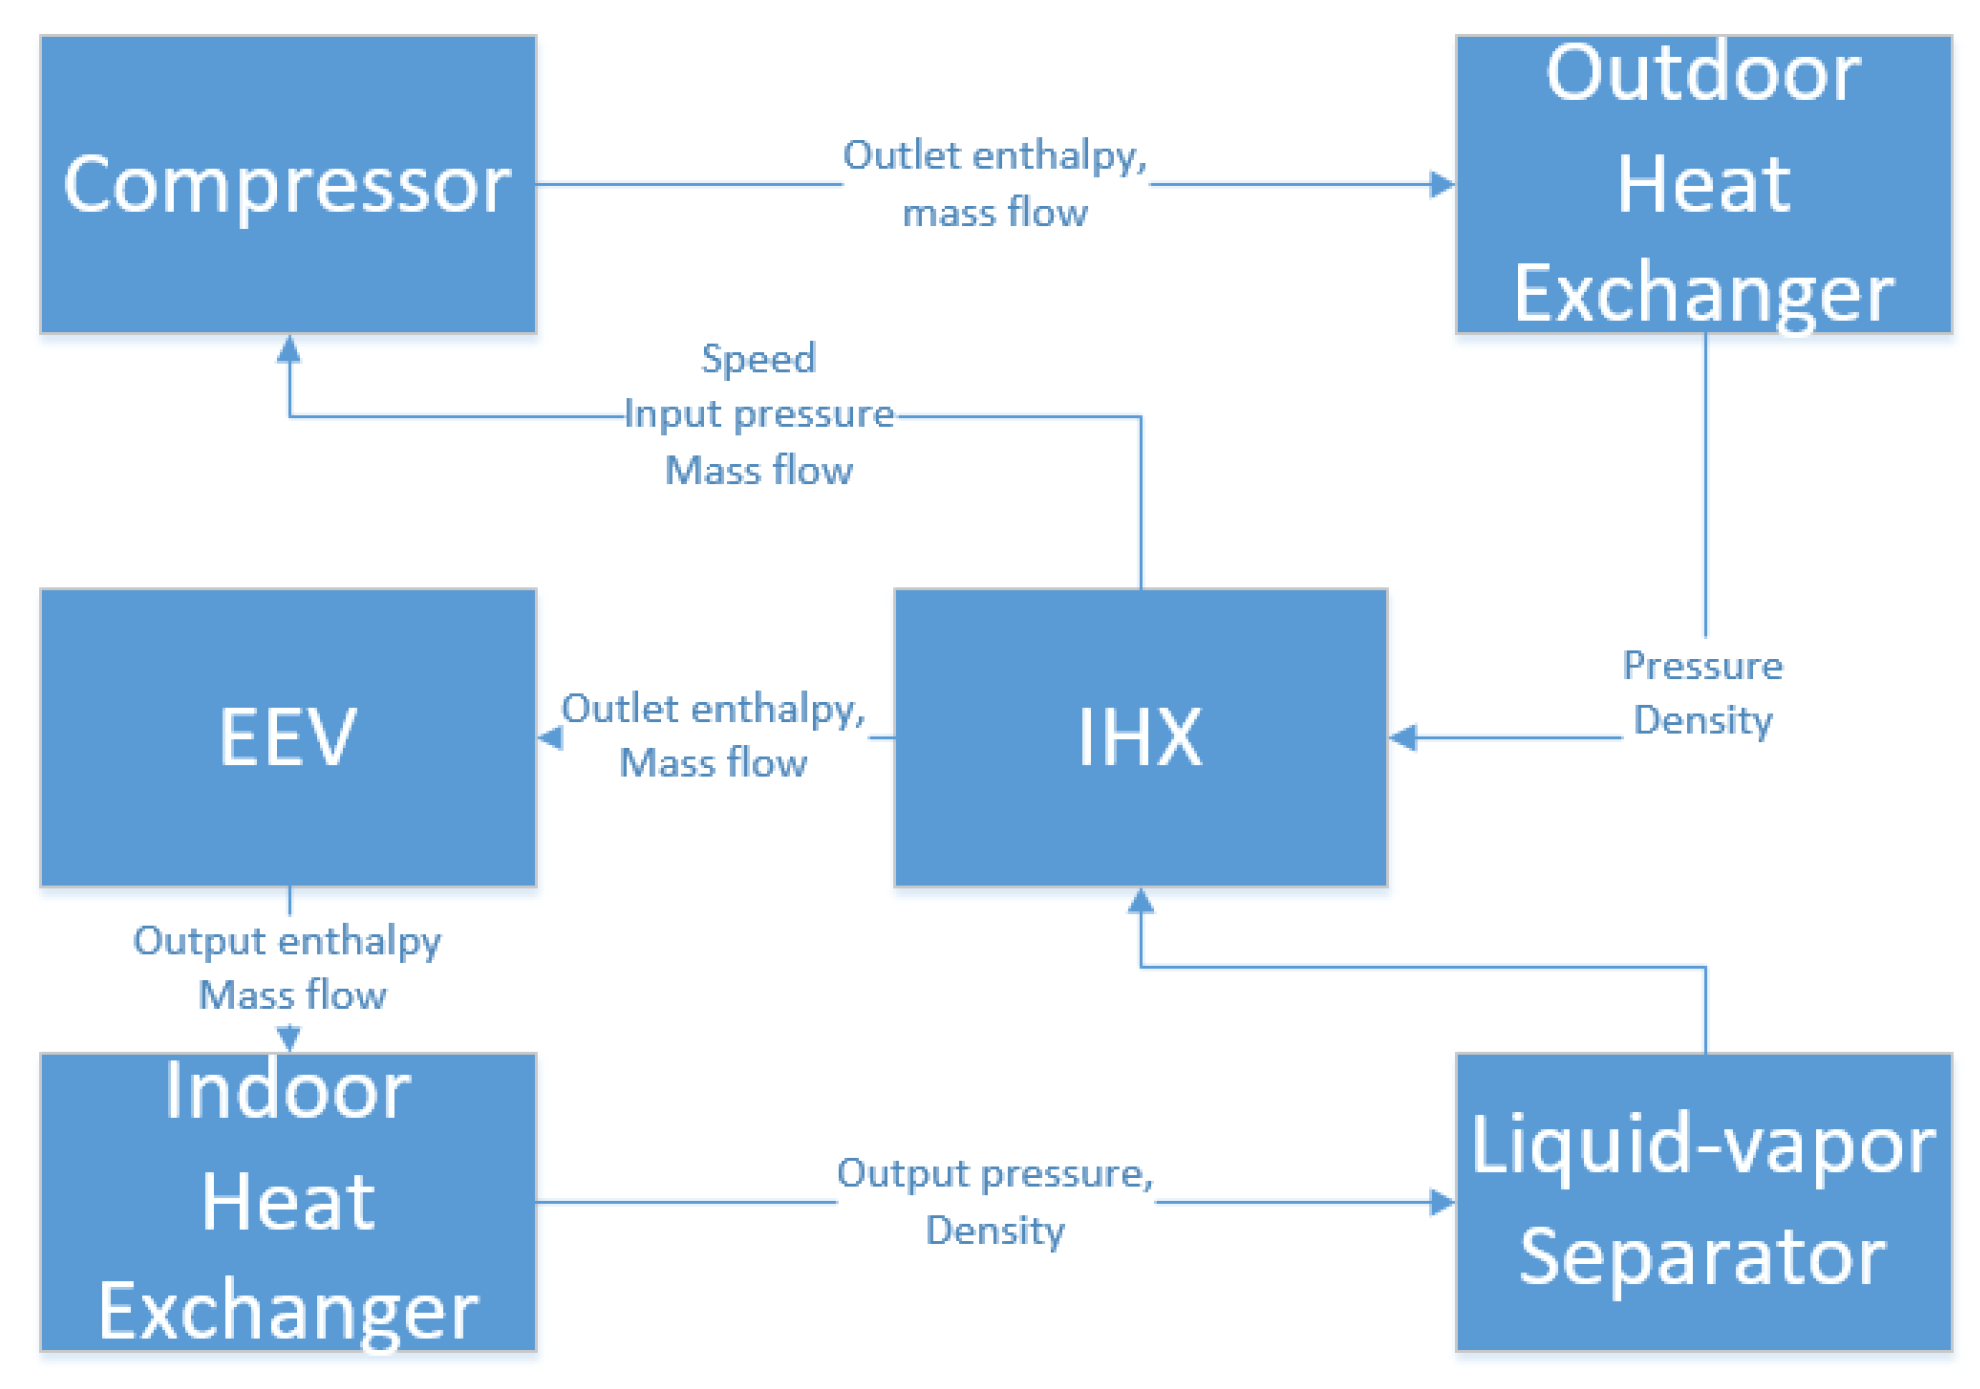
According to the system principles in Section 2.1 and the component models in Section 2.2, we simulated the transcritical CO2 system in a bus through the GT-Suite simulation platform.
The system starts with the compressor components. The speed, suction pressure, and density of the compressor are input, then the outlet enthalpy and mass flow of the compressor are output to the inlet of the gas cooler. The refrigerant and air exchange heat are input under the conditions of temperature, pressure, humidity, and mass flow of the gas cooler. Then, the outlet conditions of the gas cooler, such as the pressure density, are input into the inlet of the high-pressure side of the internal heat exchanger. The air-side wind enters the bus or discharges into the environment with new parameters. After that, the outlet enthalpy value and mass flow of the internal heat exchanger are transferred to the electronic expansion valve, where the refrigerant is throttled, and then the output enthalpy, density, and other parameters are transferred to the gas-liquid separator, then input to the internal heat exchanger, and finally return to the compressor. The whole system continuously inputs and outputs the relevant state parameters to complete the cycle work of the whole system. A corresponding illustration is shown in Figure 3.

3. Experimental Setup

As mentioned above, by switching the three-way and two-way valves, the transcritical CO2 system can cover the demands of heating and cooling the bus cabin environment. Generally, the discharge pressure of the compressor was monitored and regulated by the opening of the EEV in real time for obtaining the highest COP. The system was mainly composed of basic heat exchange cycle components, including indoor and outdoor heat exchangers, electronic expansion valves, transcritical CO2 compressors, internal heat exchangers, and gas-liquid separators.
The overall air conditioning system of high-speed railways, motor trains, or buses would be designed as an overhead type at present to reduce the space occupancy of vertical height and make more space available to create a more spacious place for passengers. To obtain more accurate and powerful conclusions, a transcritical CO2 bus air conditioning/heat pump system was built, relevant experiments were carried out, and the maximum COP of heating and cooling was measured under different working conditions. The physical experimental prototype of the bus CO2 air conditioning heat pump is shown in Figure 4 and the important parameters of the experimental components are shown in Table 1.
Additionally, a series of measuring instruments were used to monitor the experimental test data for the convenience of subsequent result processing. Table 2 shows the parameters of some of the main measuring instruments used in this study and auxiliary experimental equipment.
Based on the accuracy of the sensors mentioned in Table 2, the error propagation for the heating/cooling capacity and COP was obtained using the Kline and McClintock method [63]:
w R = R x 1 w 1 2 + R x 2 w 2 2 + + R x n w n 2 1 / 2 ,
Adopting Equation (32), in which the wR is the resultant uncertainty and w1, w2, …, wn are the uncertainty of the independent variables, the calculated maximum uncertainties for the heating/cooling capacity and COP were 2.84% and 3.20%, respectively.

4. Results and Discussion

In a functioning refrigeration system (a bus air conditioning/heat pump system included), the refrigerant charged into the system generally exists in different forms in various components. For example, a supercritical CO2 fluid existed in the gas cooler with various densities, a subcritical two-phase CO2 fluid existed in the evaporator, and a subcooled and superheated CO2 existed in the high-pressure side and low-pressure side of the IHX, respectively. In addition, due to the introduction of a gas-liquid separator, a large amount of saturated vapor and liquid CO2 was stored in this container, while there was also a part of the vapor or liquid phase CO2 in the compressor cylinder, suction, and discharge pipes, liquid pipeline, etc., which were referred to as “other positions” in this article.
From the perspective of the macroscopic performance and microscopic reasons, the influence of the refrigerant charging amount on the system performance and the distribution law of refrigerant in the system under different conditions were carefully analyzed in this section. Thus, the optimal refrigerant charging amount and its influencing factors can be obtained to some extent through these analyses.

4.1. The Influence of the Charging Amount on the Global Performance

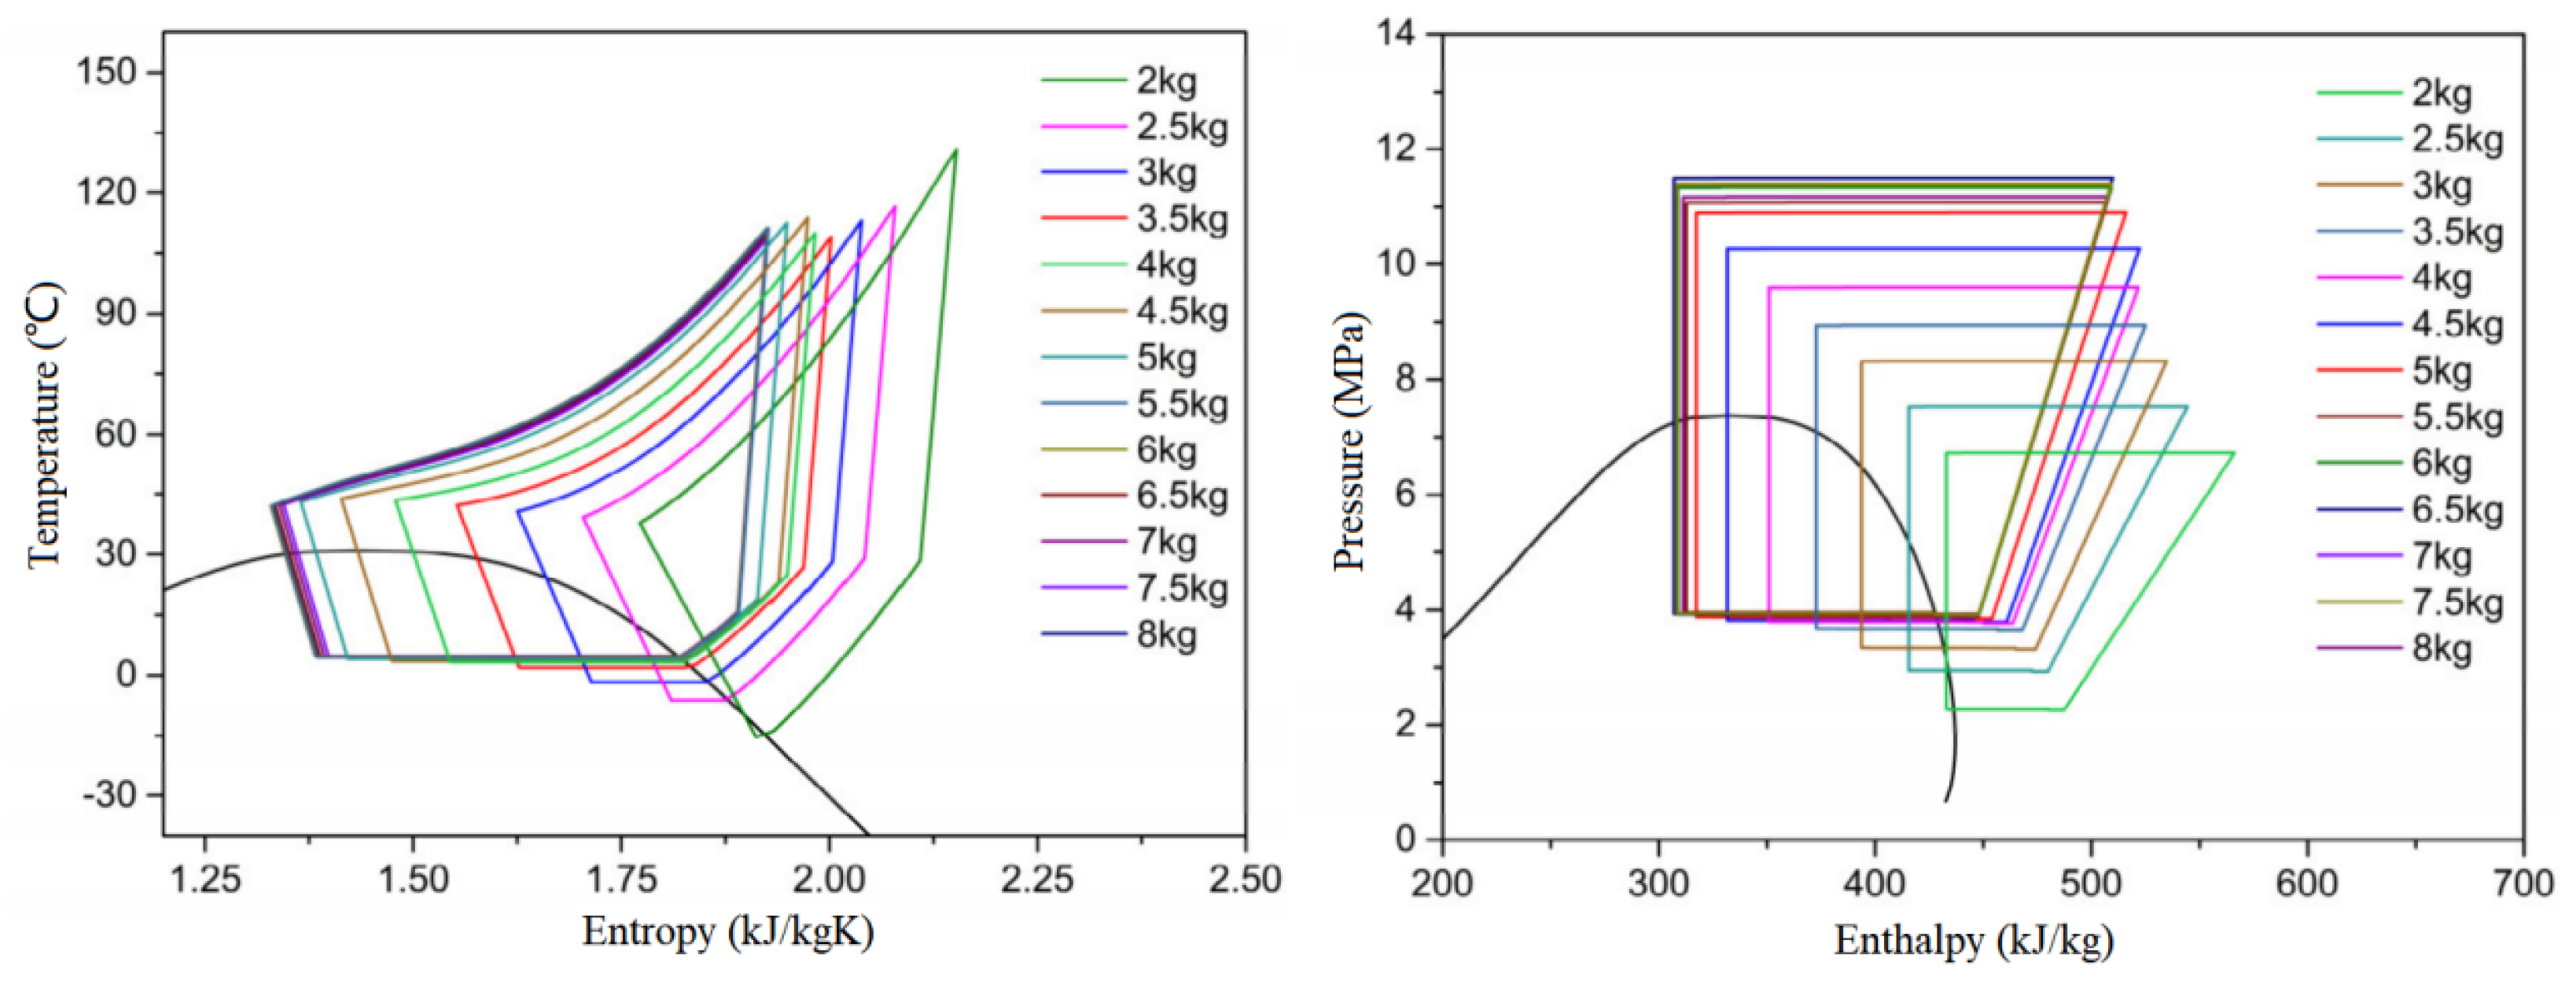
Basically, the global performance of any refrigeration system (the bus air conditioning/heat pump system included) would be highly affected by the refrigerant charging amount, hence the optimal refrigerant (CO2 in this model) charging amount became a significant optimizable parameter to evaluate whether the system operates well or not. Based on the simulation model mentioned in Section 2, the T-s diagram and P-h diagram of the transcritical CO2 cycle in the bus air conditioning/heat pump system under various refrigerant charging amounts can be obtained, as shown in Figure 5. It should be noted that the operating condition was 40 °C ambient temperature, 2~8 kg range of CO2 charging amount with 0.5 kg as step, 27 °C cabin temperature, and 12 °C cabin air supply temperature.
It can be seen from Figure 5 that the discharge pressure of the transcritical CO2 cycle could always enter the supercritical region (which meant that the discharge pressure was higher than the critical pressure, 7.377 MPa) in most running conditions, except for those cases with a very low refrigerant charging amount. In those cases with low charging amounts, both the discharge and suction pressures of the transcritical CO2 cycle were much lower than the average values because the extreme lack of refrigerant CO2 ensured that the effective working pressure could not be established in both the gas cooler and evaporator. Thus, these cases were considered “under-charging conditions”.
Similarly, it was obvious that the system running states (the shapes of T-s or P-h diagrams) were highly affected by the increase in the refrigerant charging amount in the beginning, but varied slightly when the refrigerant charging amount reached a certain level. When the system running states of the transcritical CO2 cycle were basically unchanged with an appropriate increase or decrease in the refrigerant charging amount, we declared that the charging amount reached the “well charging condition”, as shown in Figure 5.
In addition, it can be observed that the suction pressure (pressure in the evaporator) of the transcritical cycle reached its stable state very quickly with the increased charging amount, but the discharge pressure (pressure in the gas cooler) kept rising for a longer period until it reached the well charging condition. The exact reason will be clearly explained in Section 4.2.
Furthermore, from the perspective of temperatures instead of pressures, it can be seen from Figure 5 that the system running states (the shapes of T-s or P-h diagrams) continuously moved from the superheated vapor region to the subcooled liquid region until reaching the well charging condition. On one hand, according to the trend of CO2 isotherms in the supercritical region from Figure 1b, the CO2 state point in the gas-cooler exit will definitely move to the left with the rising discharge pressure, with the premise that the refrigerant CO2 in the gas cooler can be cooled to a same temperature. On the other hand, the continuous increase in the discharge pressure corresponds to the remarkable rising temperature of the CO2 working fluid inside the gas cooler, thereafter raising the temperature approach between the CO2 fluid and the airflow and enhancing the heat transfer in the gas cooler. Thus, the CO2 temperature in the gas-cooler exit will be probably cooled down to a lower value. Considering that the throttling process could be treated as an unchanged-enthalpy process, one can see why the CO2 state point in the evaporator entrance kept moving to the left inside the two-phase region.
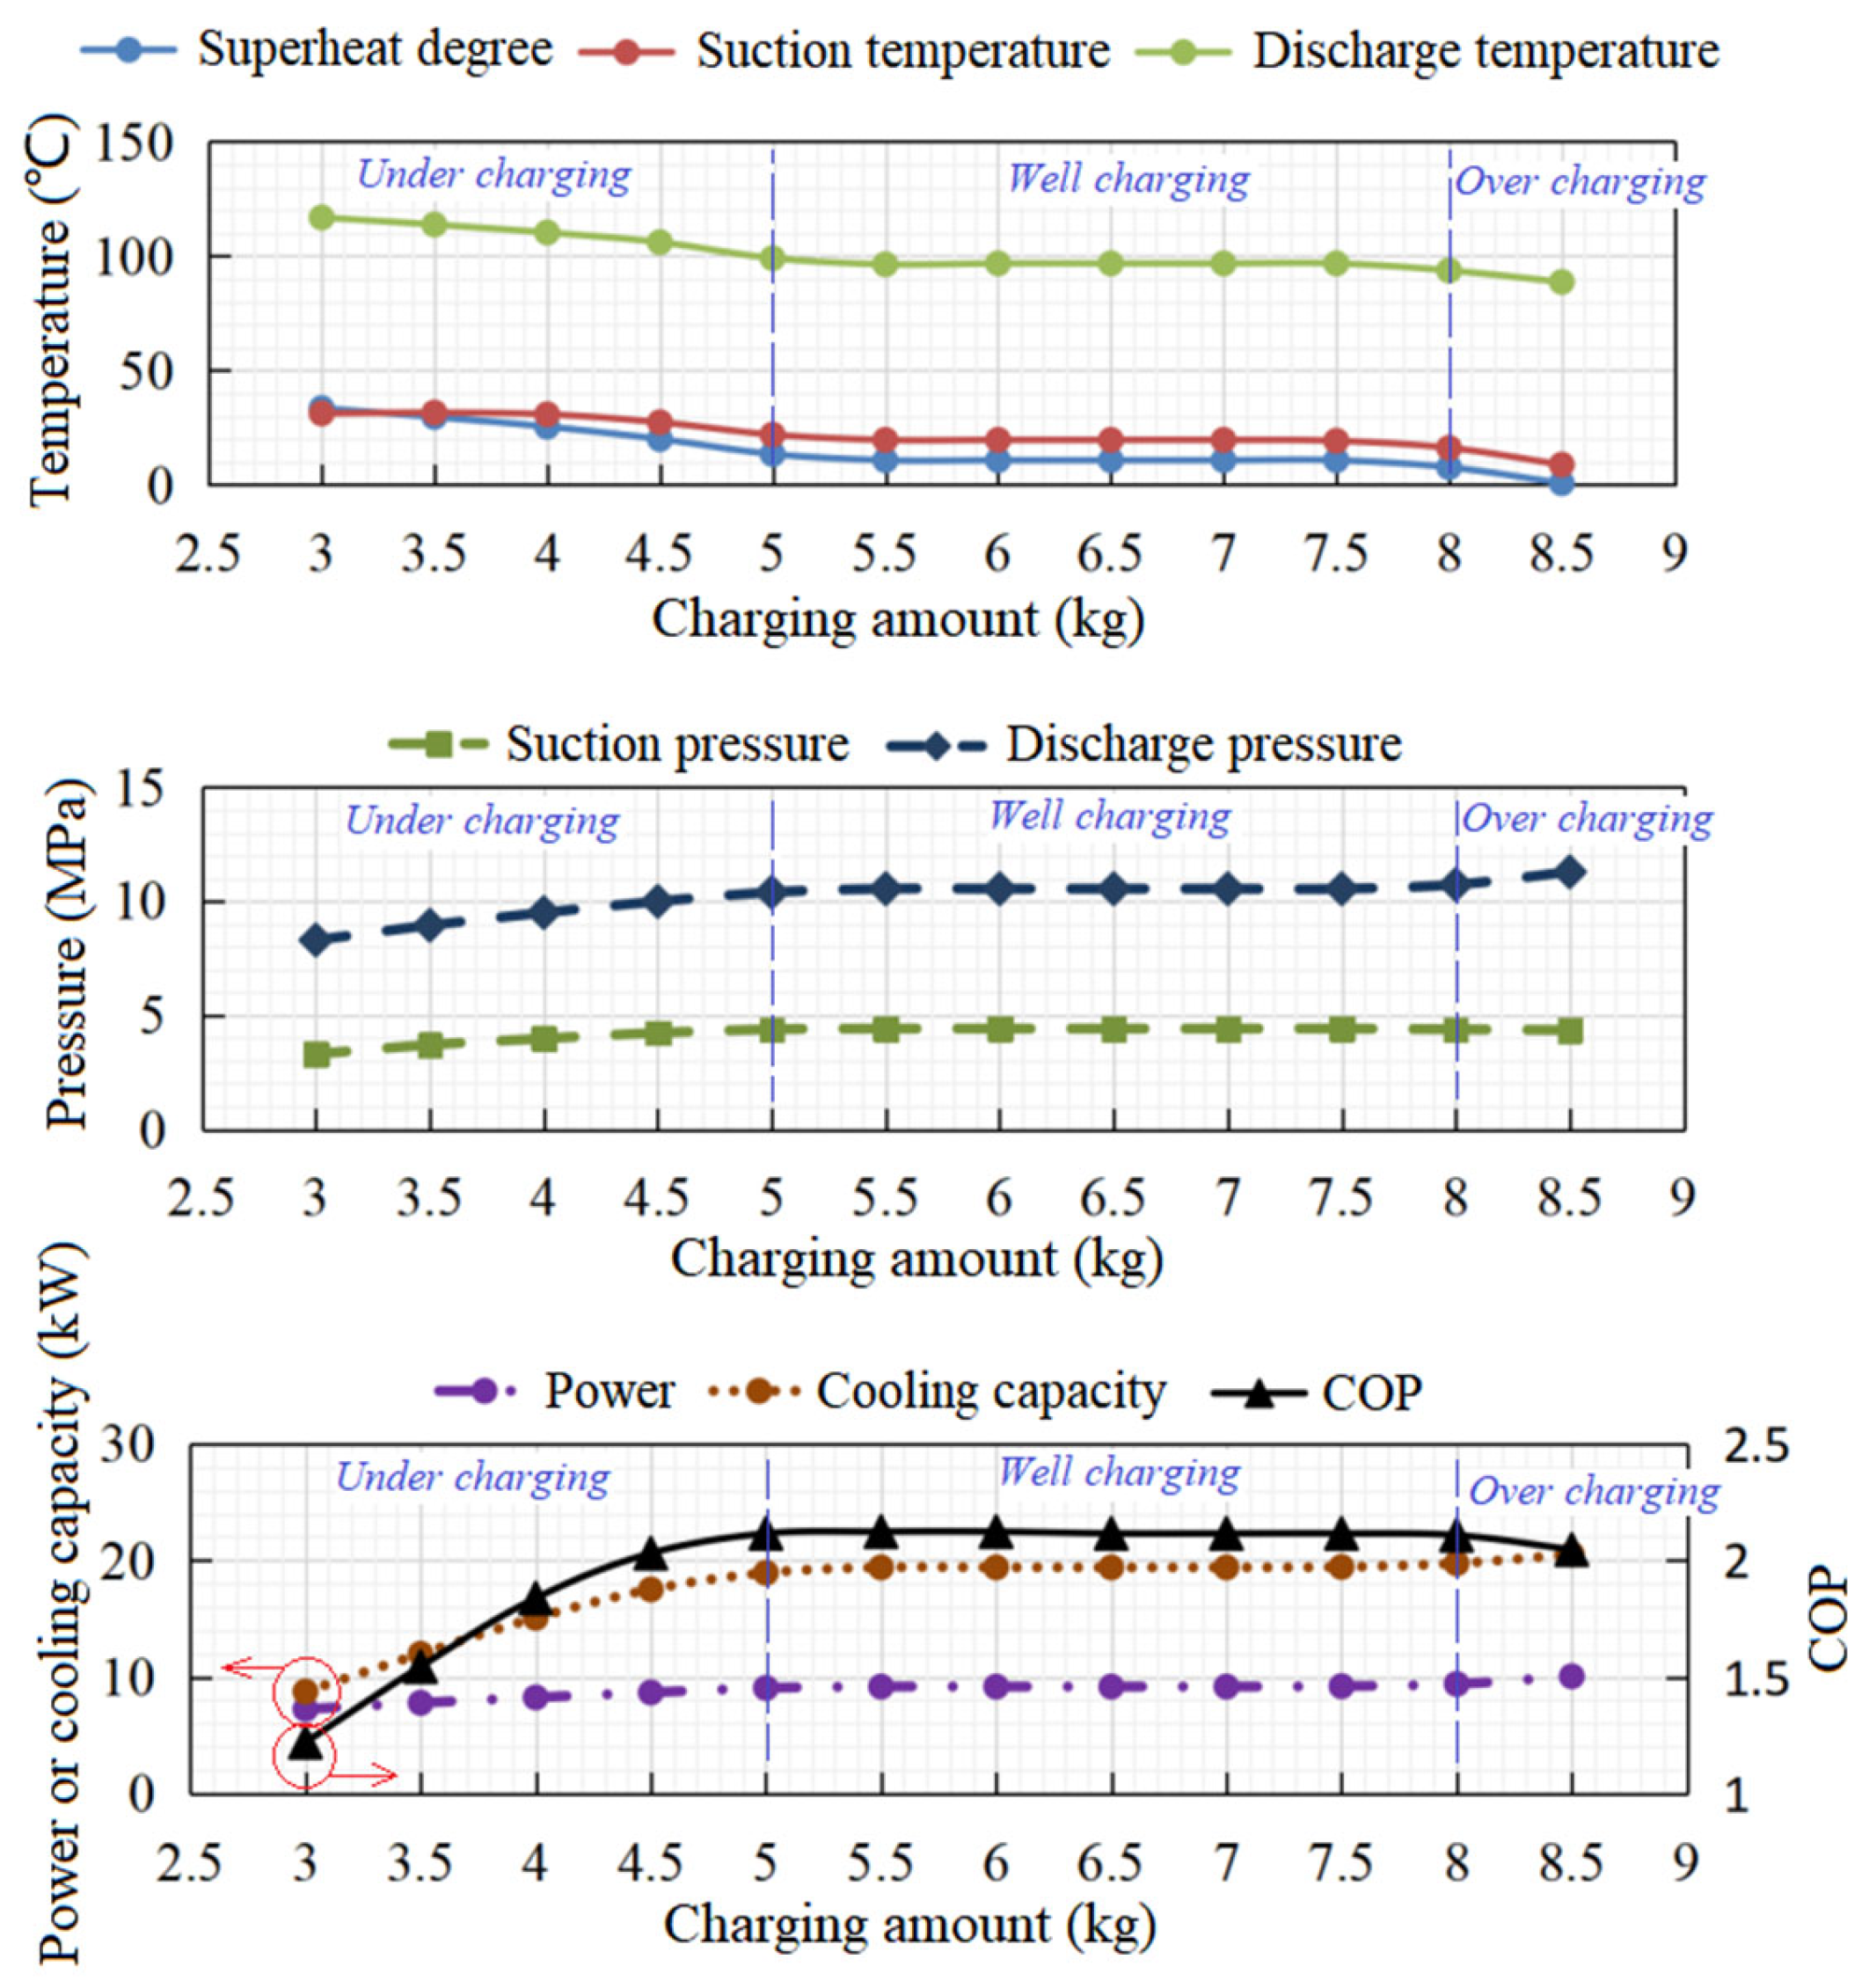
Furthermore, although both the suction and discharge pressure were quite low, the highest discharge temperature was achieved at the most serious “under charging state”. Because the refrigerant in most areas of the cycle was in the superheated states, although the compressor pressure ratio was approximate, a larger suctioning superheat will certainly cause a worse isentropic efficiency and a higher discharge temperature. This result can be also confirmed by the first graph in Figure 6.
For a similar reason, with the rising charging amount, the suctioning superheat degree decreased remarkably, thereafter the discharge temperature of the compressor was highly affected, also presenting a downward trend. Additionally, it should be noted that the algebraic difference between the suction temperature and superheat degree represented the CO2 temperature at the evaporator exit (reflecting the evaporating temperature to some extent). It can be seen that, similar to the information from Figure 5, in addition to the obvious low evaporation temperature at extreme under-charging conditions, the evaporating temperature is kept almost constant under other running conditions, which can be also deduced by the evaporating pressure trend from the second graph of Figure 6. What is more, the discharge pressure also presented a similar changing trend.
As expected, the superheat degree would keep decreasing until reaching 0; even if liquid compressor suction occurred as the charging amount kept rising, the superheat degree would never decline further. However, as in the first graph of Figure 6, the discharge temperature (the green line) would predictably keep decreasing with a charging amount rising to over 8.5 kg. In this article, those cases were named “over-charging conditions”.
In addition, it can be clearly observed that most thermodynamic parameters (COP, power consumption, cooling capacity, superheat degree, suction and discharge pressures, and suction and discharge temperatures included) would remain unchanged under the well charging conditions. The reason could be that, because of the adoption of the liquid-vapor separator, the refrigerant that cannot be accommodated in the components could accumulate in the form of saturated liquid in the separator, which could cause the rising liquid level in the separator. That is, theoretically, the separator should be empty with 5 kg of refrigerant charging (the demarcation point between under and well charging conditions), and should be full with 8 kg of refrigerant charging (the demarcation point between well and overcharging conditions). For the same reason, excessive discharge pressure and deficient cooling capacity would cause under-charging conditions, and liquid suction, a low discharge pressure, and excessive power consumption would cause overcharging conditions, as shown in the last diagram from Figure 6. Thus, the maximum COP could always achieve a well charging condition.

4.2. The Influence of the Charging Amount on the Refrigerant Distribution

In a refrigeration system, except for the separator, the gas cooler and the evaporator always occupy most of the refrigerant fluid (liquid and vapor included). It can be drawn from Figure 5 that both the suction and discharge pressures were deficient and the refrigeration cycle was almost in the superheat region under the severe “undercharging condition”, which caused the suction density of the compressor and the CO2 mass flow rate to be quite low. However, the evaporating pressure increased remarkably with a higher charging amount, which would definitely raise the suction density as well as the CO2 mass flow rate until it reached the “well charging condition”, as shown in Figure 7.
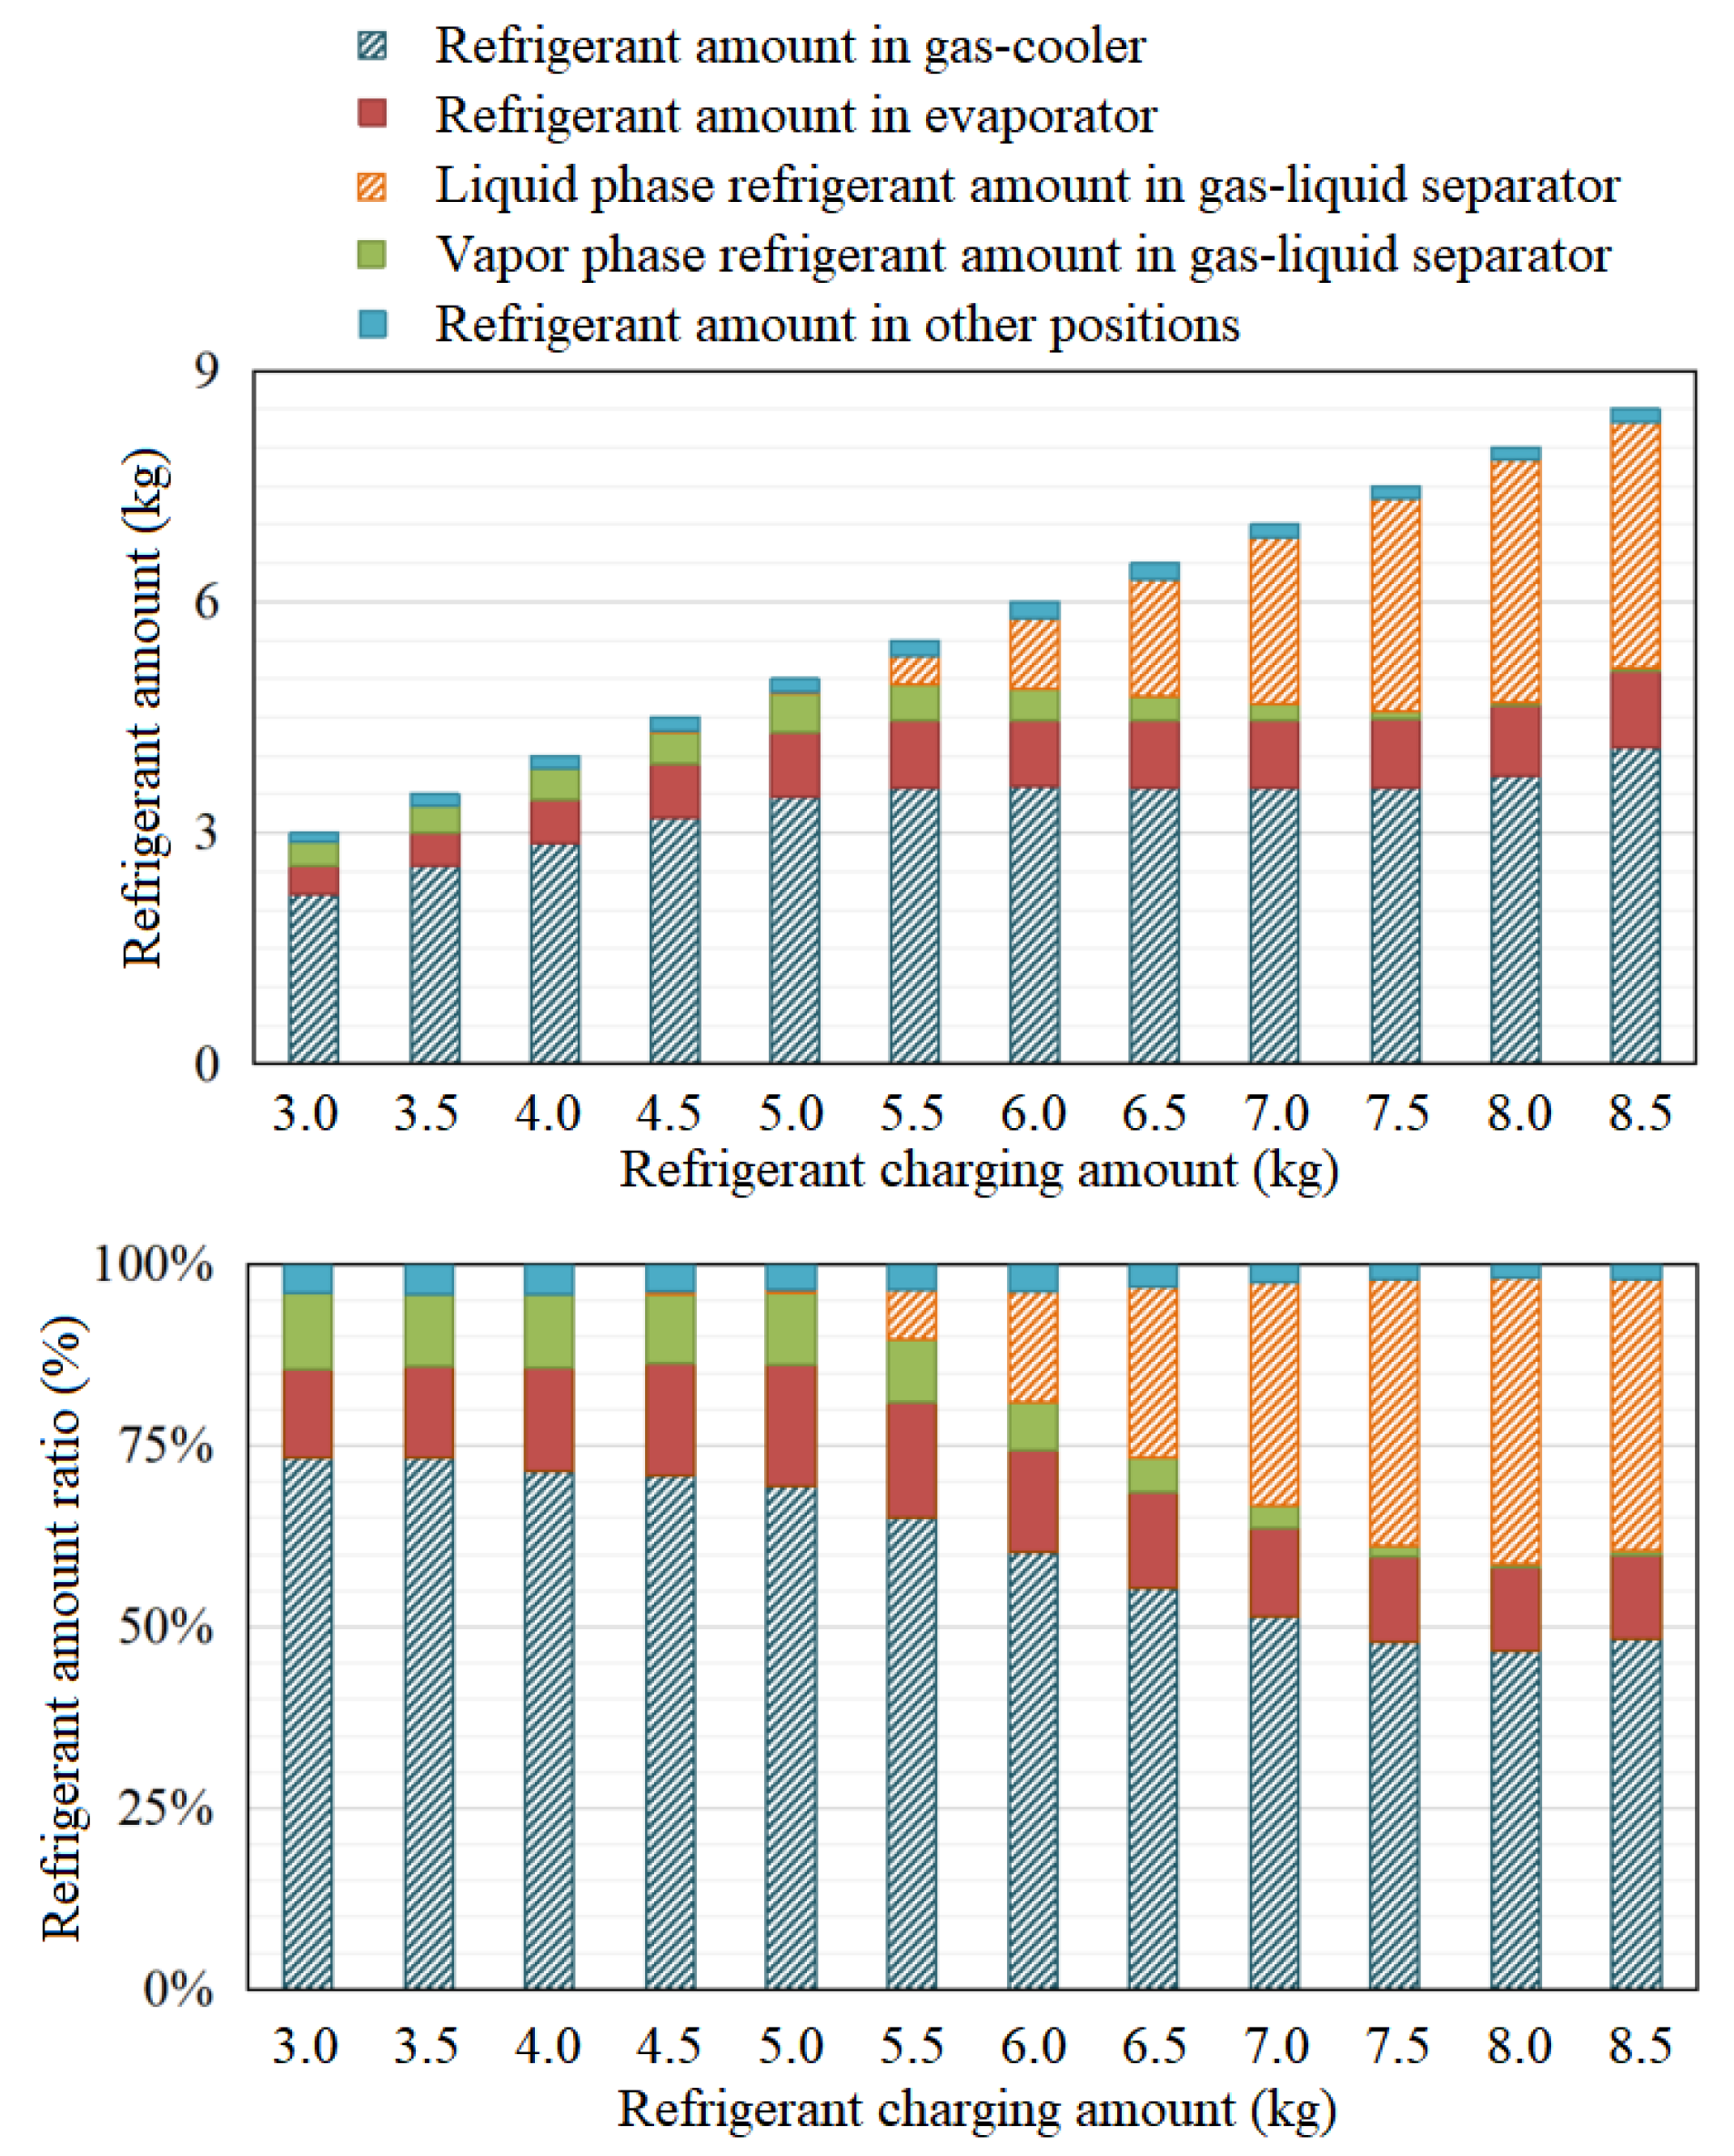
Similarly, as mentioned above for this study, the vapor-liquid separator would be empty until the charging amount reached 5 kg, and then the liquid level would go up continuously with the increase in the charging amount. Finally, the liquid level would reach almost 100% in the separator, and stay unchanged no matter how much more refrigerant was charged into the system after peaking.
Additionally, it should be noticed that the throttling valve opening changed slightly among all the test ranges, thus, the trends of evaporating and discharging pressures regarding the change of charging amount were affected by the heat transfer in heat exchangers. That is, the charged refrigerant accumulated first in the low-pressure side (mainly consisting of the evaporator and separator) due to the charging port that is usually located before the separator, which caused the remarkable rise in evaporating pressure with the rising charging amount, as shown in Figure 5. In addition, the refrigerant amount in the gas cooler increased significantly due to the much higher pressure and density of CO2 in the gas cooler over the evaporator side, as shown in Figure 7.
Then, almost all the parameters of the transcritical CO2 cycle were kept nearly constant after the refrigerant reached the “well charging condition”, except the parameters of the separator. It can be seen that the liquid level in the gas-liquid separator went up continuously, and the liquid phase refrigerant amount increased noticeably with the rising charging amount under the “well charging condition”, as shown in Figure 7. As the result, the vapor phase refrigerant amount in the separator kept decreasing under the “well charging condition” because of the encroachment on volume caused by the liquid level.
Similarly, the refrigerant amounts in the evaporator and gas cooler as well as the CO2 mass flow rate rose up again after reaching the “overcharging amount”, however, the separator (liquid level, vapor, and liquid refrigerant amounts included) parameters stayed almost constant because it would maintain the full liquid state in the “overcharging amount”, as shown in Figure 7.
It can be observed from Figure 8 that the CO2 gas cooler always occupied the highest refrigerant amount no matter how much refrigerant was charged into the system, but the relative proportion of it in the gas cooler kept decreasing gradually. In addition, once the system reached the “well charging amount”, the liquid phase in the separator increased significantly with the increase in charging amount, and it gradually became the second largest refrigerant container in the whole system. Correspondingly, both the absolute value and the relative proportion of the vapor phase kept declining with the rising liquid phase inside the separator, as shown in Figure 8. Additionally, the refrigerant amount in the evaporator increased first and then stayed almost constant, but its relative proportion increased first and then decreased with the rising charging amount.

4.3. The Influence of the Ambient Temperature on the Optimal Charging Amount

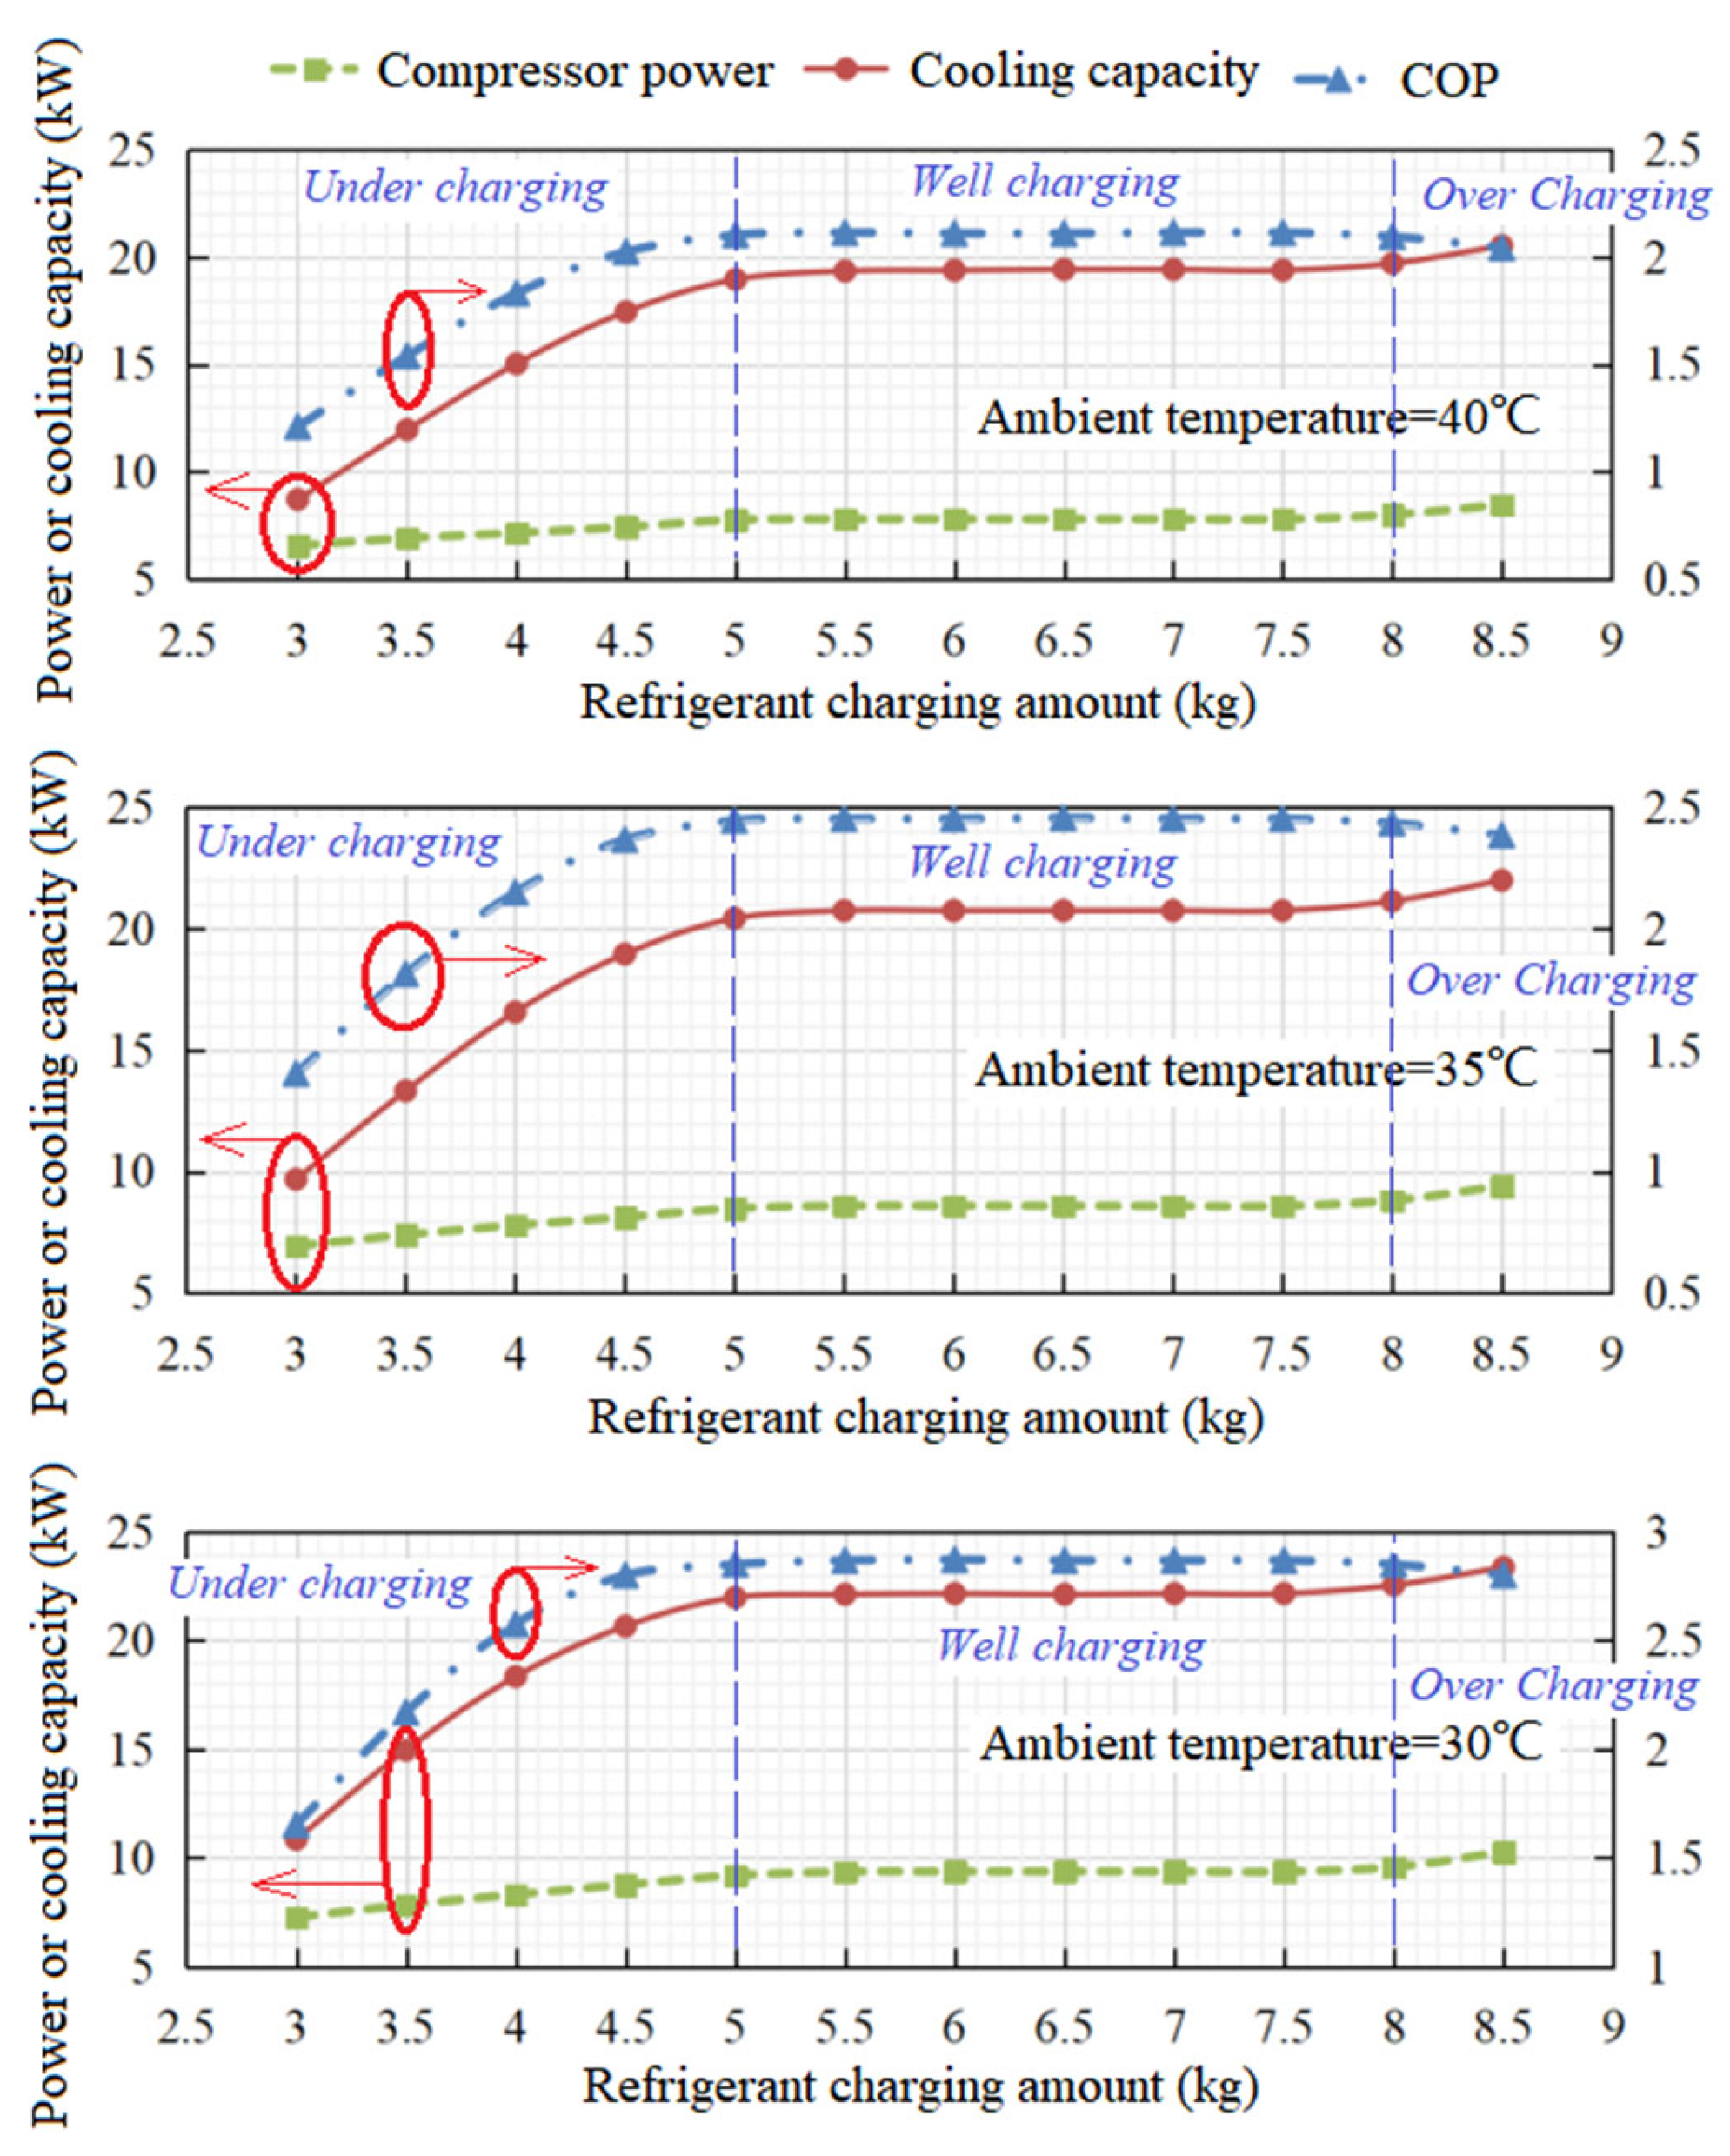
In the application of the bus air conditioning and heat pump in the field, the performance of the transcritical CO2 cycle was highly affected by the outdoor ambient temperature because the indoor temperature was almost kept at 27 °C. Moreover, as shown in Figure 9, under the cooling mode of the transcritical CO2 cycle, the gas-cooler outlet temperature (that was the most important parameter to some extent) was limited by the outdoor ambient temperature. That is, the system running state, the CO2 temperature/density before EEV, and the CO2 quality/density after EEV were determined by the outdoor ambient temperature.
As a result, it can be concluded that the system COP and cooling capacity increased significantly with the decline of the gas-cooler outlet CO2 temperature which was caused by the ambient temperature decreasing from 40 °C to 30 °C. However, even though the mean density in the heat exchangers changed, the “well charging condition” was always around 5~8 kg of charging.
In other words, the outdoor ambient temperature highly affects the system’s performance, but it does not significantly affect the optimal charging amount.

4.4. The Influence of the Ambient Temperature on the Refrigerant Distribution

For a more specific analysis of the conclusion from Section 4.3, the influence of the outdoor ambient temperature on the refrigerant distribution is discussed.
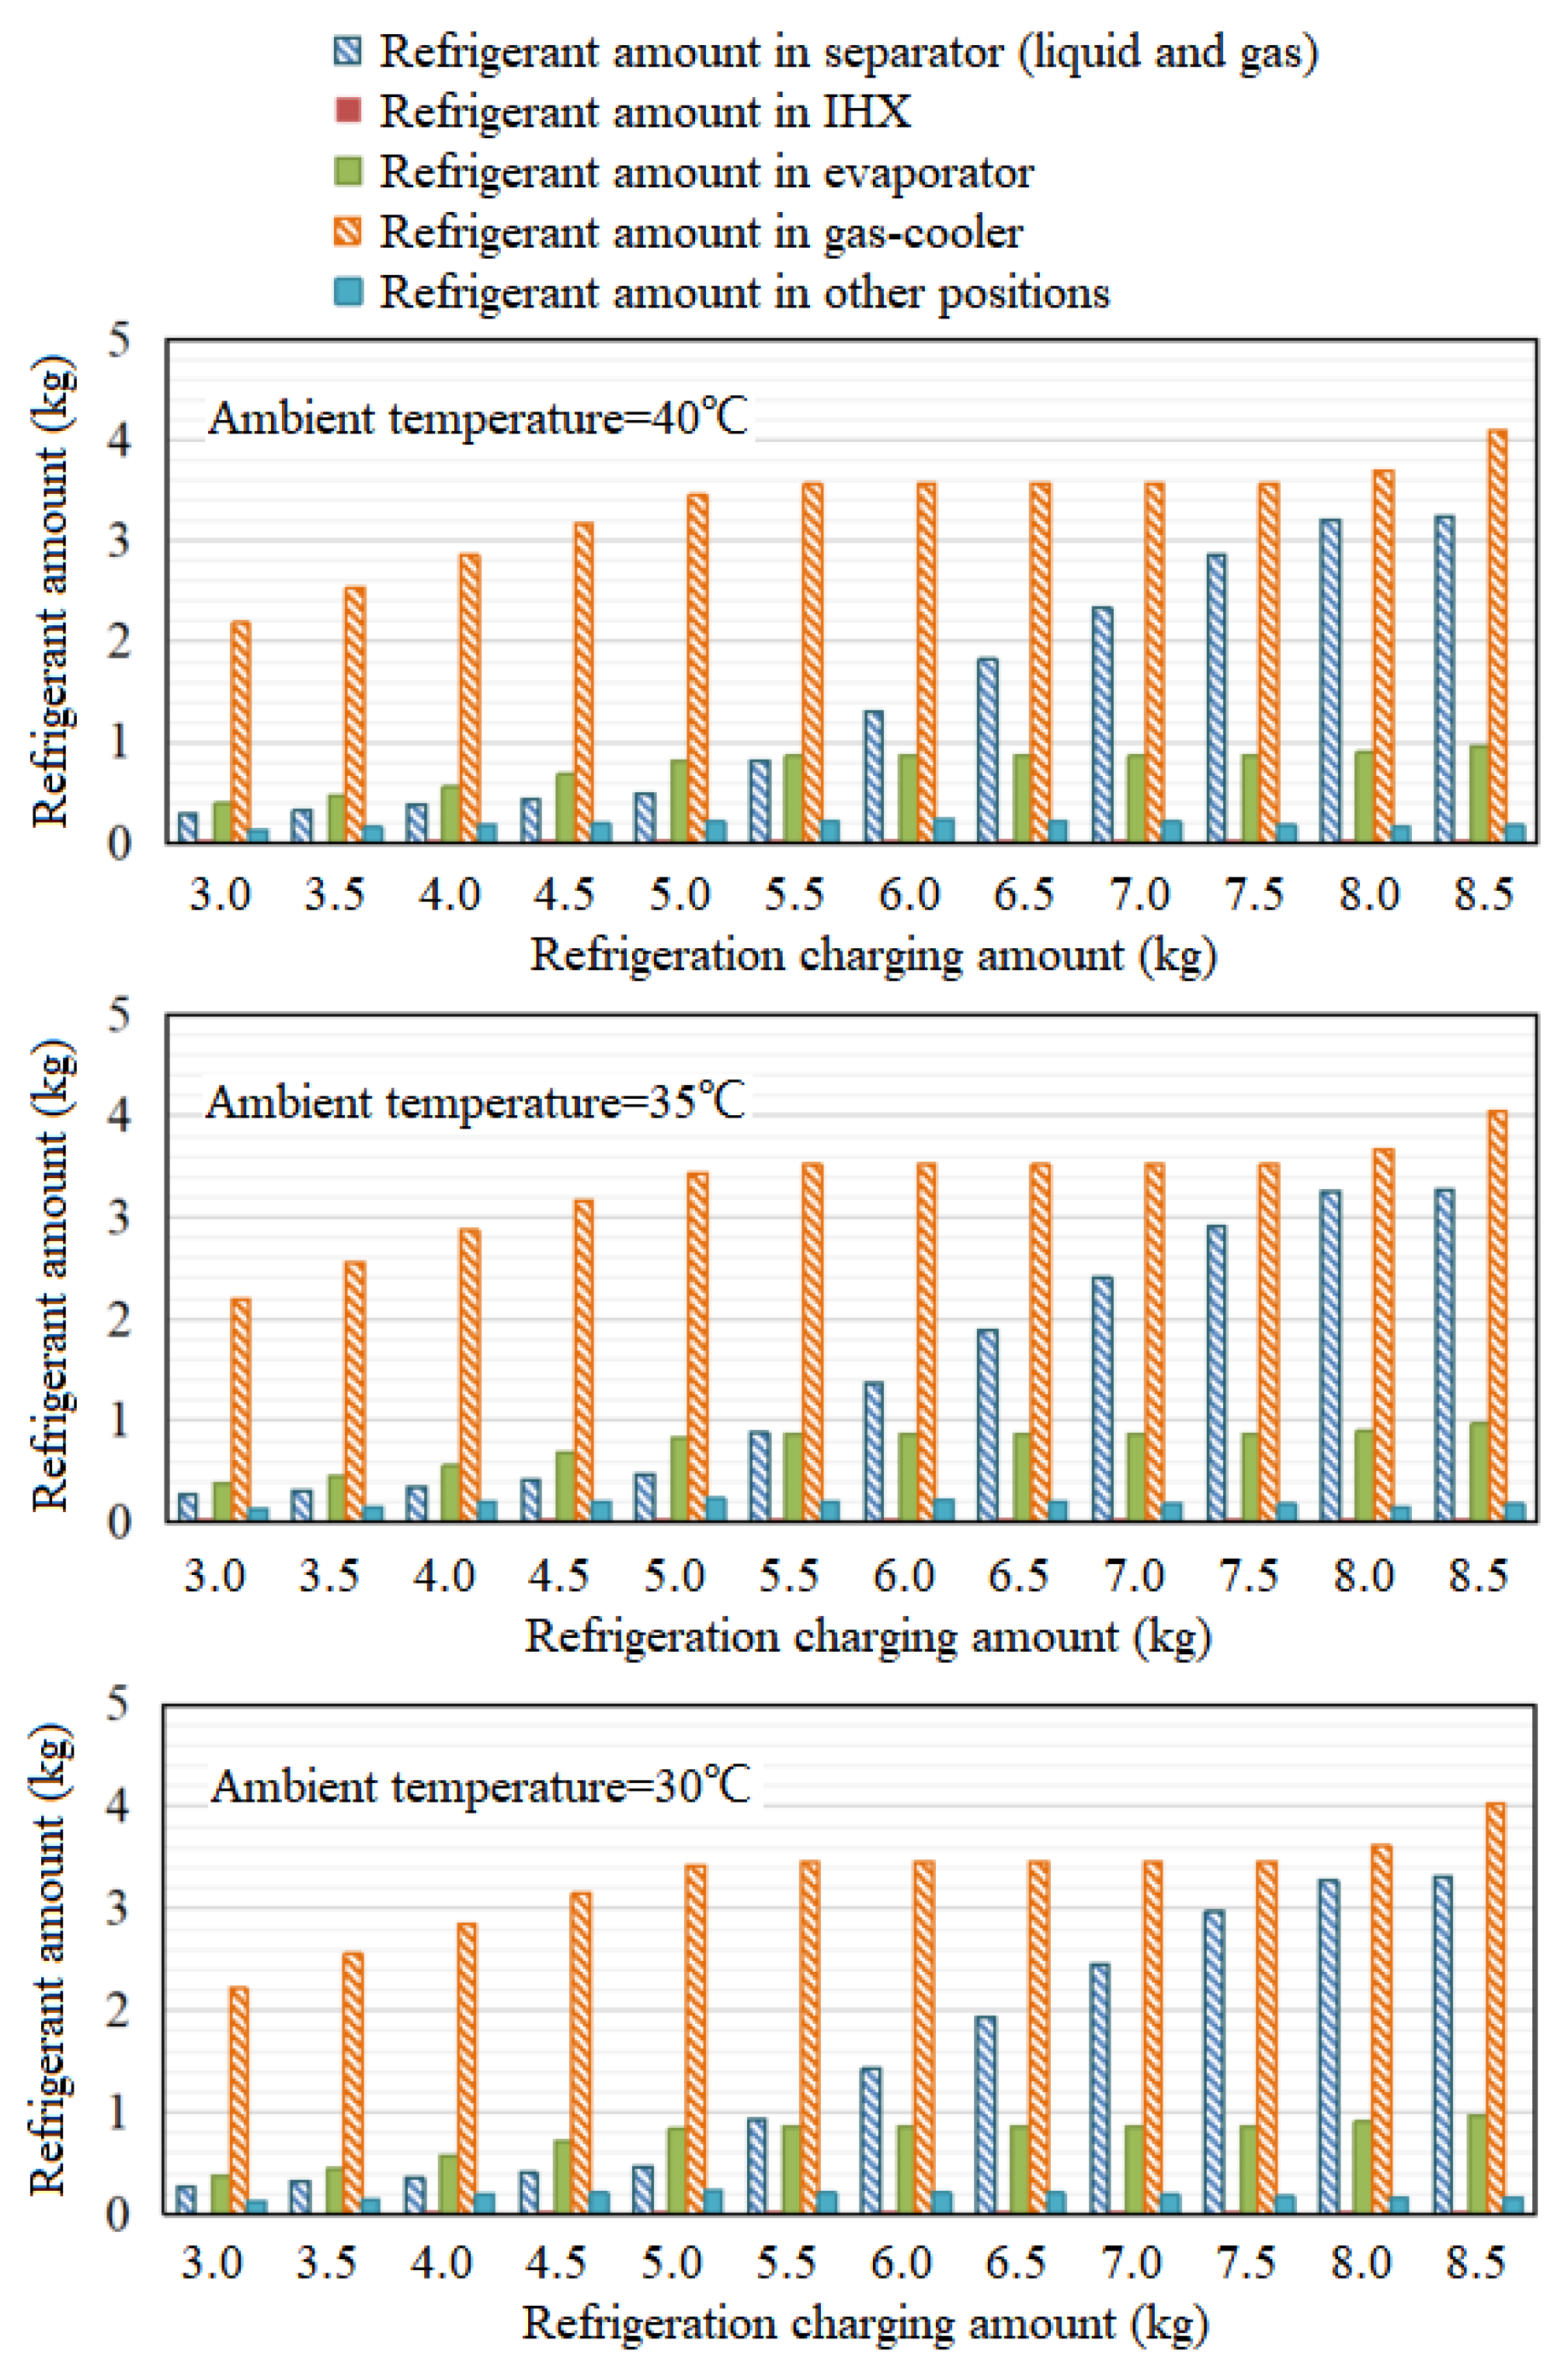
For instance, a lower ambient temperature, and thus the gas-cooler outlet temperature, would definitely increase the mean density in the gas cooler, which might be a signal of a higher refrigerant charging demand. However, the optimal discharge pressure of the transcritical CO2 cycle must decrease with a lower ambient temperature, thus a lower gas-cooler outlet temperature is also a signal of lower discharge pressure, lower mean density in the gas cooler, and lower refrigerant charging demand. Considering all these effects, the outdoor ambient temperature may have no effect on the gas cooler refrigerant amount.
Additionally, the operating condition of the evaporating side was relatively stable since the cabin temperature was kept around 27 °C in cooling mode, thus the refrigerant parameters on the low-pressure side also remained steady.
Therefore, as shown in Figure 10, even though the refrigerant amount in different components varied noticeably with the rising CO2 charging amount, the refrigerant distribution as well as the refrigerant proportion in different components was almost unchanged with different charging conditions.
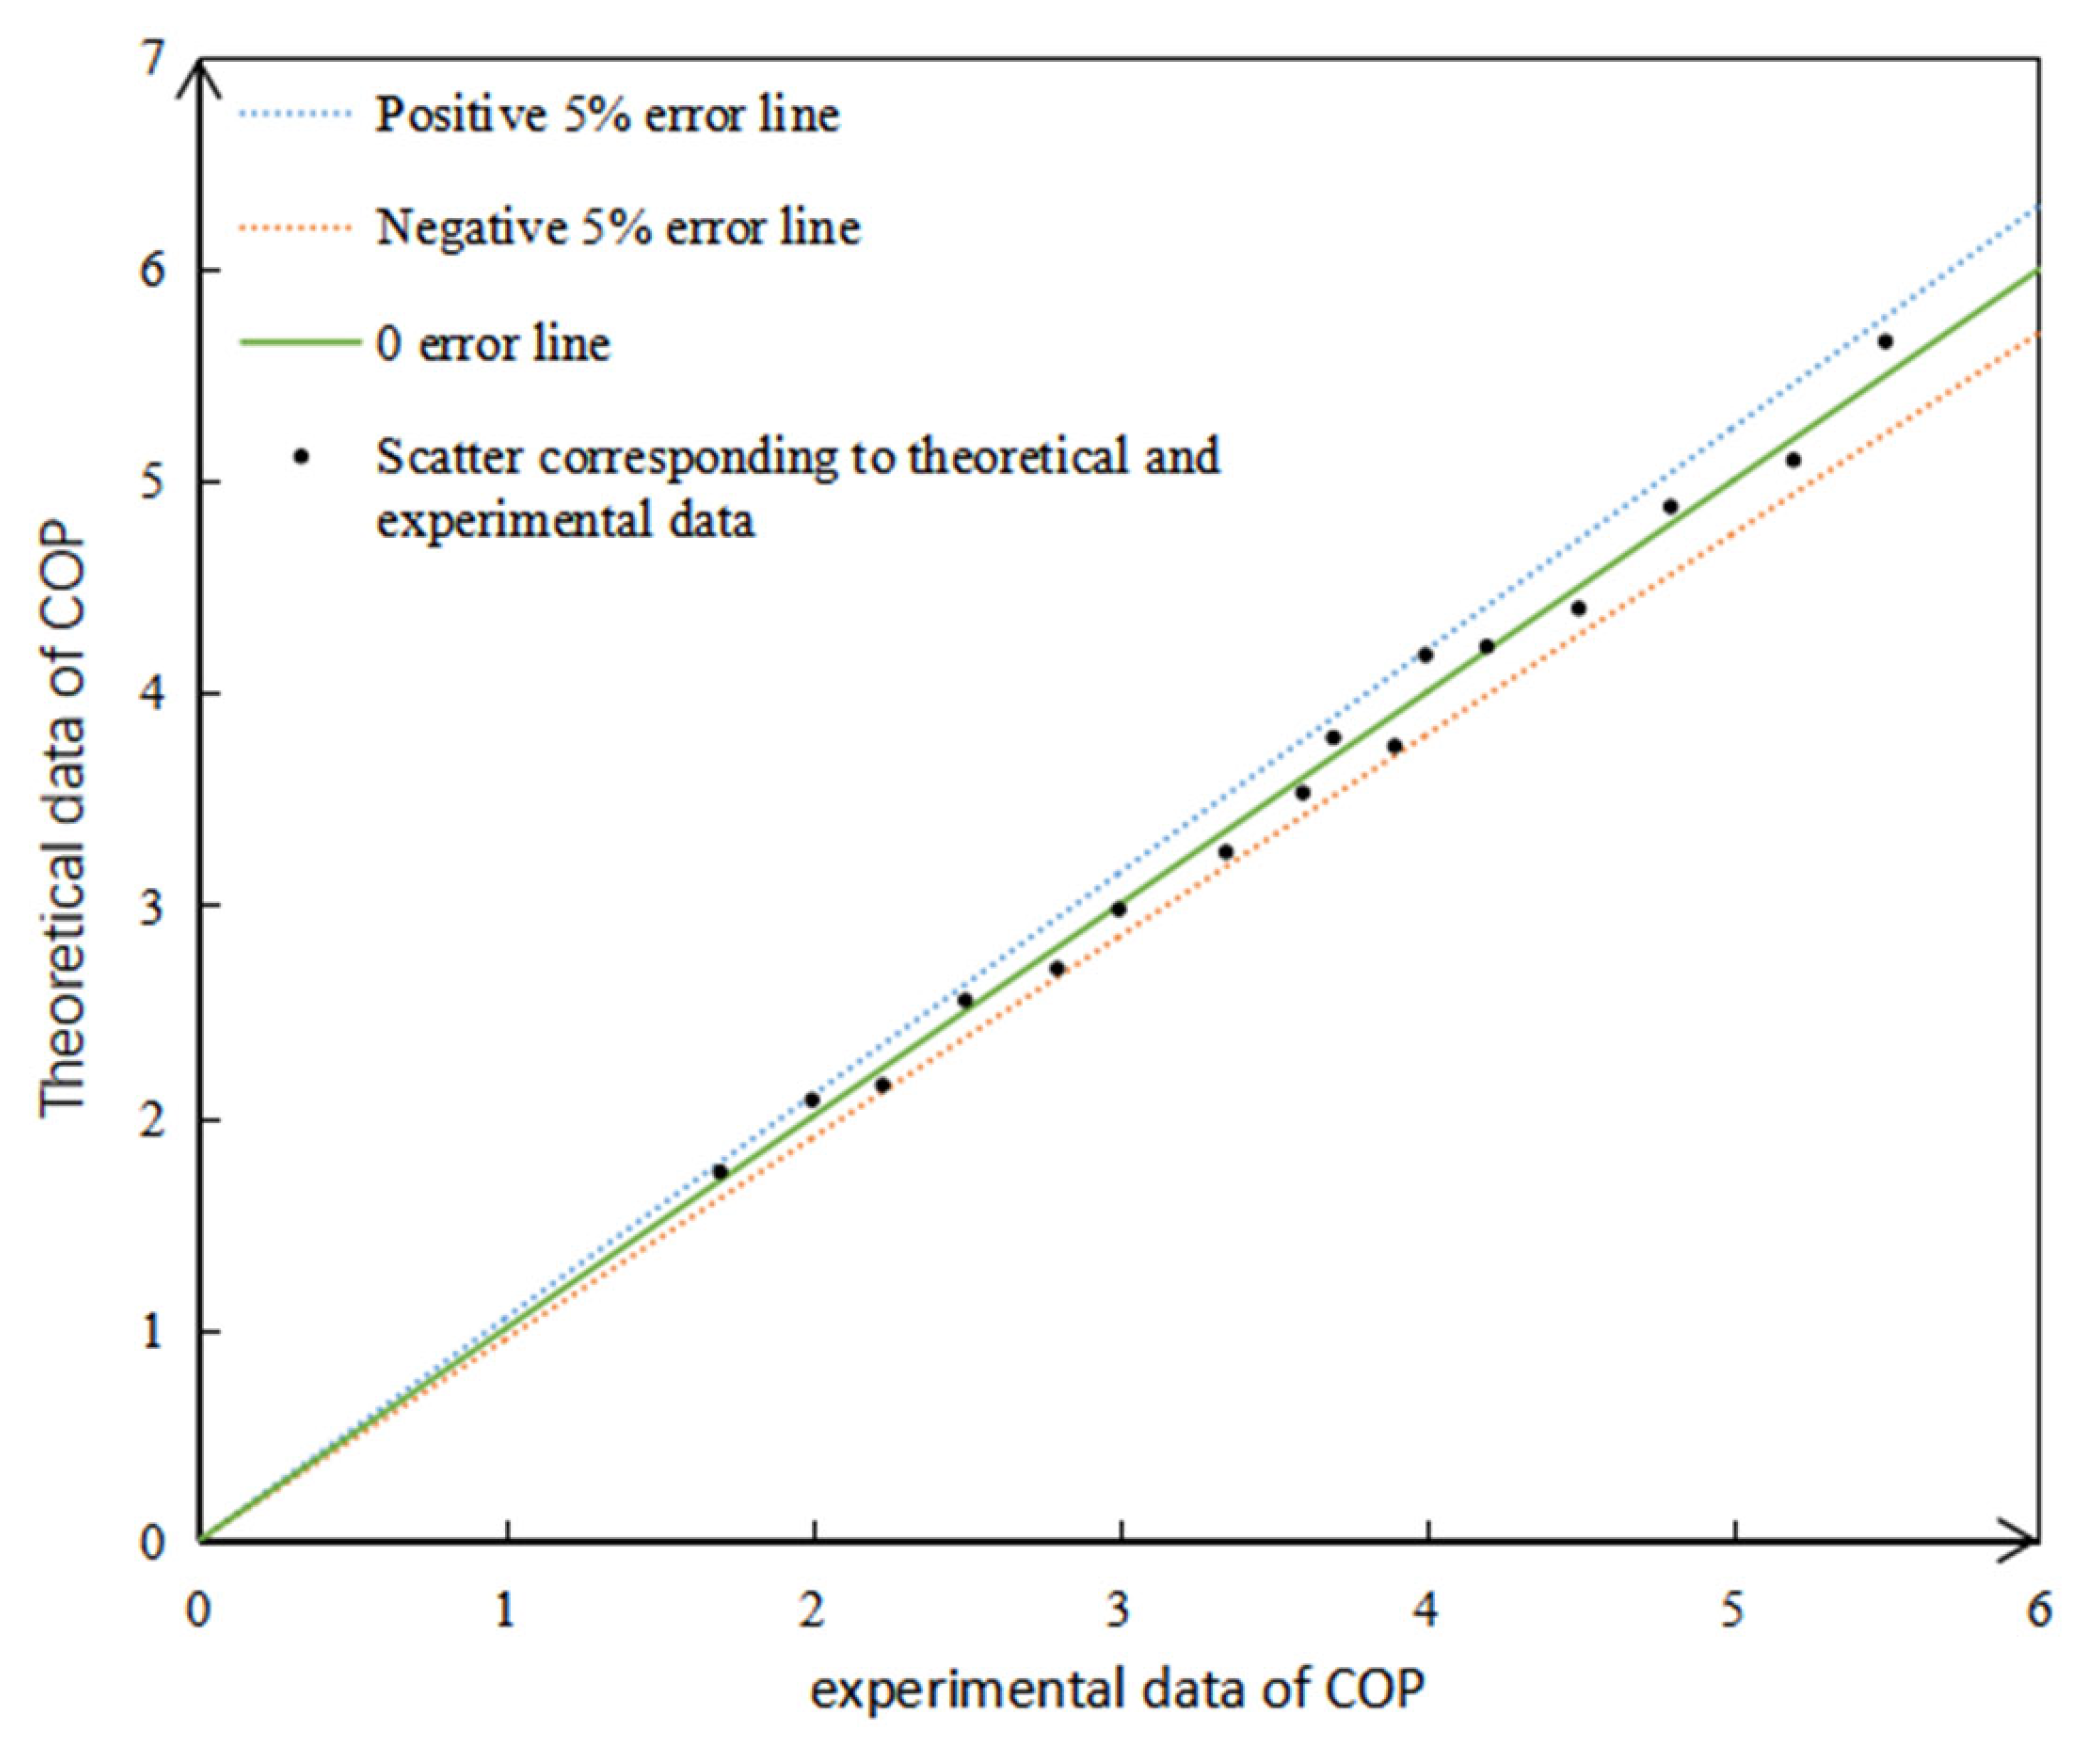
For the simulation results in this paper, we built a transcritical CO2 bus system, tested the relevant data, and then compared the experimental data with the simulation data (as shown in Figure 11); the error basically stayed within 5%, which verifies the accuracy of the simulation results.

5. Conclusions

Considering the excellent environmental properties and the unmatched heating ability under ultra-low ambient temperatures, CO2 refrigerant was selected as an ideal alternative to the HFC refrigerant in the transportation domain. In this study, the optimal CO2 charging amount and refrigerant distribution in a bus air conditioning/heat pump system were analyzed in detail, and the main conclusions are drawn as follows:
  • As the CO2 charging amount varied from severely insufficient to overcharged (2 kg-5–8 kg; seriously insufficient at 2 kg and stable from 5 kg to 8 kg) the transcritical CO2 cycle varied from the low-pressure overheat region to the high-pressure liquid region.
  • The system heating capacity and power consumption increased with the rising charging amount from the undercharging region, stayed almost unchanged during the well charging region, and finally increased again in the overcharging region; however, the system COP increased, remained almost unchanged, and then decreased in the undercharging, well charging and overcharging regions, respectively. From a quantitative perspective, regarding the cooling capacity, the 3–5 kg in the undercharged region increased rapidly from 9.5 kW to 18 kW, and the 5–8 kg in the stable region stabilized at 20 kW and then increased slowly in the overcharged region. The power showed the same trend, and the data showed that the stable area was maintained at 10 kW. For COP, at 3–5 kg, it rose rapidly from 1.2 to 2.2, remained stable at 2.2 from 5–8 kg, and then decreased slightly at 8–8.5 kg.
  • The main parameters of the bus air conditioning/heat pump system remained almost unchanged in the well charging region (under a well charging amount of 5–8 kg, the refrigeration in the evaporator was maintained at 1 kg, while in the gas cooler, it was maintained at 3.6 kg), while the liquid level of the separator increased gradually (the gas decreased from 0.5 kg to about 0 kg, and the liquid increased from 0 kg to about 3.2 kg), which meant that the separator provided a proper adjustable margin to the system to some extent.
  • The ambient temperature was found to have little effect on the determination of the refrigerant charging plateau (the well charging region), while the refrigerant distribution was found to be affected by the ambient temperature to some extent.
Finally, the quantitative results obtained in this paper show the importance of research on the charging capacity of electric buses. Relying on the technology based on the GT-Suite simulation, the influence of the charging amount on bus performance and refrigerant distribution was obtained, providing a reference result for future research in this field which will be conducive to the further development of science and technology.

Author Contributions

Y.S.: Conceptualization, Methodology, Data Collection, Writing, and Reviewing and Editing; H.X.: Data Collection, Writing, and Reviewing and Editing; M.Y.: Data Collection, Modeling and Editing; X.W.: Reviewing and Editing; F.C.: Conceptualization and Supervision; X.Y.: Reviewing and Editing. All authors have read and agreed to the published version of the manuscript.

Funding

This research was funded by the National Natural Science Foundations of China (52006161).

Data Availability Statement

Data are unavailable due to privacy restrictions.

Conflicts of Interest

The authors declare no conflict of interest.

Nomenclature

AHeat transfer area (m2)
CpSpecific heat capacity (kJ∙kg−1∙K−1)
DhHydraulic diameter (m)
hEnthalpy (kJ∙kg−1)
KHeat transfer coefficient (W∙K−1∙m−2)
mMass flow rate (kg∙s−1)
PPressure (MPa)
QHeat transfer rate (kW)
TTemperature (°C)
VTheoretical displacement (m3)
WPower consumption (kW)
α Convective heat transfer coefficient (W∙K−1∙m−2)
ρ Density (kg∙m−3)
η Efficiency
ξ Dehumidification coefficient
γheat leakage coefficient
λ Conductivity (W∙K−1∙m−2)
hEnthalpy (kJ∙kg−1)
vVolumetric
aair
comCompressor
dDischarge
expElectronic expansion valve
gSaturated gas-vapor
iInlet
isIsentropic
lSaturated liquid
MotorMotor
oOutlet
rRefrigerant
sSuction
shaftShaft

References

  1. Barta, R.B.; Groll, E.A.; Ziviani, D. Review of stationary and transport CO2 refrigeration and air conditioning technologies. Appl. Therm. Eng. 2021, 185, 116422. [Google Scholar] [CrossRef]
  2. Adams, S.; Adedoyin, F.; Olaniran, E.; Bekun, F.V. Energy consumption, economic policy uncertainty and carbon emissions; causality evidence from resource rich economies. Econ. Anal. Policy 2020, 68, 179–190. [Google Scholar] [CrossRef]
  3. Solaymani, S. CO2 emissions patterns in 7 top carbon emitter economies: The case of transport sector. Energy 2019, 168, 989–1001. [Google Scholar] [CrossRef]
  4. Mohanraj, M.; Abraham, J.D. Environment friendly refrigerant options for automobile air conditioners: A review. J. Therm. Anal. Calorim. 2020, 147, 47–72. [Google Scholar] [CrossRef]
  5. Yadav, S.; Liu, J.; Kim, S.C. A comprehensive study on 21st-century refrigerants—R290 and R1234yf: A review. Int. J. Heat Mass Transf. 2021, 182, 121947. [Google Scholar] [CrossRef]
  6. Cai, D.; Hao, Z.; Xu, H.; He, G. Research on flammability of R290/R134a, R600a/R134a and R600a/R290 refrigerant mixtures. Int. J. Refrig. 2022, 137, 53–61. [Google Scholar] [CrossRef]
  7. Llopis, R.; Nebot-Andrés, L.; Sánchez, D.; Catalán-Gil, J.; Cabello, R. Subcooling methods for CO2 refrigeration cycles: A review. Int. J. Refrig. 2018, 93, 85–107. [Google Scholar] [CrossRef]
  8. Bellos, E.; Tzivanidis, C. A comparative study of CO2 refrigeration systems. Energy Convers. Manag. X 2018, 1, 100002. [Google Scholar] [CrossRef]
  9. Yu, B.; Yang, J.; Wang, D.; Shi, J.; Chen, J. An updated review of recent advances on modified technologies in transcritical CO2 refrigeration cycle. Energy 2019, 189, 116147. [Google Scholar] [CrossRef]
  10. Manjili, F.E.; Cheraghi, M. Performance of a new two-stage transcritical CO2 refrigeration cycle with two ejectors. Appl. Therm. Eng. 2019, 156, 402–409. [Google Scholar] [CrossRef]
  11. Song, Y.; Cao, F. The evaluation of the optimal medium temperature in a space heating used transcritical air-source CO2 heat pump with an R134a subcooling device. Energy Convers Manag. 2018, 166, 409–423. [Google Scholar] [CrossRef]
  12. Song, Y.; Cao, F. The evaluation of optimal discharge pressure in a water precooler-based transcritical CO2 heat pump system. Appl. Therm. Eng. 2018, 131, 8–18. [Google Scholar] [CrossRef]
  13. Li, J.; Yang, Z.; Li, H.; Hu, S.; Duan, Y.; Yan, J. Optimal schemes and benefits of recovering waste heat from data center for district heating by CO2 transcritical heat pumps. Energy Convers. Manag. 2021, 245, 114591. [Google Scholar] [CrossRef]
  14. Zhou, A.; Li, X.-s.; Ren, X.-d.; Gu, C.-w. Improvement design and analysis of a supercritical CO2/transcritical CO2 combined cycle for offshore gas turbine waste heat recovery. Energy 2020, 210, 118562. [Google Scholar] [CrossRef]
  15. Chen, Y.; Zou, H.; Dong, J.; Wu, J.; Xu, H.; Tian, C. Experimental investigation on the heating performance of a CO2 heat pump system with intermediate cooling for electric vehicles. Appl. Therm. Eng. 2021, 182, 116039. [Google Scholar] [CrossRef]
  16. Wang, D.; Yu, B.; Li, W.; Shi, J.; Chen, J. Heating performance evaluation of a CO2 heat pump system for an electric vehicle at cold ambient temperatures. Appl. Therm. Eng. 2018, 142, 656–664. [Google Scholar] [CrossRef]
  17. Wang, D.; Yu, B.; Hu, J.; Chen, L.; Shi, J.; Chen, J. Heating performance characteristics of CO2 heat pump system for electric vehicles in a cold climate. Int. J. Refrig. 2018, 85, 27–41. [Google Scholar] [CrossRef]
  18. Llopis, R.; Sánchez, D.; Sanz-Kock, C.; Cabello, R.; Torrella, E. Energy and environmental comparison of two-stage solutions for commercial refrigeration at low temperature: Fluids and systems. Appl. Energy 2015, 138, 133–142. [Google Scholar] [CrossRef]
  19. Wang, D.; Wang, Y.; Yu, B.; Shi, J.; Chen, J. Numerical study on heat transfer performance of micro-channel gas coolers for automobile CO2 heat pump systems. Int. J. Refrig. 2019, 106, 639–649. [Google Scholar] [CrossRef]
  20. Dong, J.; Wang, Y.; Jia, S.; Zhang, X.; Huang, L. Experimental study of R744 heat pump system for electric vehicle application. Appl. Therm. Eng. 2020, 183, 116191. [Google Scholar]
  21. Wang, D.; Zhang, Z.; Yu, B.; Wang, X.; Shi, J.; Chen, J. Experimental research on charge determination and accumulator behavior in transcritical CO2 mobile air-conditioning system. Energy 2019, 183, 106–115. [Google Scholar] [CrossRef]
  22. Song, X.; Lu, D.; Lei, Q.; Cai, Y.; Wang, D.; Shi, J.; Chen, J. Experimental study on heating performance of a CO2 heat pump system for an electric bus. Appl. Therm. Eng. 2021, 190, 116789. [Google Scholar] [CrossRef]
  23. Chen, S.; Yang, W.; Wu, H.; Deng, R.; Li, T.; Guo, Y.; Jin, Z. Experimental study on the heating performance of transcritical CO2 heat pump for electric buses. Sci. Technol. Built Environ. 2022, 29, 65–74. [Google Scholar] [CrossRef]
  24. Han, X.; Zou, H.; Wu, J.; Tian, C.; Tang, M.; Huang, G. Investigation on the heating performance of the heat pump with waste heat recovery for the electric bus. Renew. Energy 2020, 152, 835–848. [Google Scholar] [CrossRef]
  25. Jiang, F.; Wang, Y.; Yu, B.; Wang, D.; Shi, J.; Chen, J. Effects of various operating conditions on the performance of a CO2 air conditioning system for trains. Int. J. Refrig. 2019, 107, 105–113. [Google Scholar] [CrossRef]
  26. Song, X.; Lu, D.; Lei, Q.; Wang, D.; Yu, B.; Shi, J.; Chen, J. Energy and exergy analyses of a transcritical CO2 air conditioning system for an electricity bus. Appl. Therm. Eng. 2021, 190, 116819. [Google Scholar] [CrossRef]
  27. Han, X.; Zou, H.; Xu, H.; Tian, C.; Kang, W. Experimental study on vapor injection air source heat pump with internal heat exchanger for electric bus. Energy Procedia 2019, 158, 4147–4153. [Google Scholar] [CrossRef]
  28. Lorentzen, G. Transcritical Vapor Compression Cycle Device. US Patent WO/07683 1990, 12 July 1990. [Google Scholar]
  29. Lorentzen, G. Revival of carbon dioxide as a refrigerant. Int. J. Refrig. 1994, 17, 292–300. [Google Scholar] [CrossRef]
  30. Lorentzen, G. The use of natural refrigerants: A complete solution to the CFC/HCFC predicament. Int. J. Refrig. 1995, 18, 190–197. [Google Scholar] [CrossRef]
  31. Xu, Y.; Mao, C.; Huang, Y.; Shen, X.; Xu, X.; Chen, G. Performance evaluation and multi-objective optimization of a low-temperature CO2 heat pump water heater based on artificial neural network and new economic analysis. Energy 2020, 216, 119232. [Google Scholar] [CrossRef]
  32. Stene, J. CO2 Heat Pump System for Space Heating and Hot Water Heating in Low-Energy Houses and Passive Houses. In Proceedings of the 1st Nordic Passive House Conference Passivhus Norden 2008, Trondheim, Norway, 2–3 April 2008; p. 36. [Google Scholar]
  33. Song, Y.; Cui, C.; Li, M.; Cao, F. Investigation on the effects of the optimal medium-temperature on the system performance in a transcritical CO2 system with a dedicated transcritical CO2 subcooler. Appl. Therm. Eng. 2020, 168, 114846. [Google Scholar] [CrossRef]
  34. Song, Y.; Ye, Z.; Wang, Y.; Cao, F. The experimental verification on the optimal discharge pressure in a subcooler-based transcritical CO2 system for space heating. Energy Build 2018, 158, 1442–1449. [Google Scholar] [CrossRef]
  35. Yerdesh, Y.; Abdulina, Z.; Aliuly, A.; Belyayev, Y.; Mohanraj, M.; Kaltayev, A. Numerical simulation on solar collector and cascade heat pump combi waterheating systems in Kazakhstan climates. Renew. Energy 2020, 145, 1222–1234. [Google Scholar] [CrossRef]
  36. Qin, X.; Wang, D.; Jin, Z.; Wang, J.; Zhang, G.; Li, H. A comprehensive investigation on the effect of internal heat exchanger based on a novel evaluation method in the transcritical CO2 heat pump system. Renew. Energy 2021, 178, 574–586. [Google Scholar] [CrossRef]
  37. Ye, Z.; Wang, Y.; Song, Y.; Yin, X.; Cao, F. Optimal discharge pressure in transcritical CO2 heat pump water heater with internal heat exchanger based on pinch point analysis. Int. J. Refrig. 2020, 118, 12–20. [Google Scholar] [CrossRef]
  38. Wang, Y.; Ye, Z.; Song, Y.; Yin, X.; Cao, F. Energy, exergy, economic and environmental analysis of refrigerant charge in air source transcritical carbon dioxide heat pump water heater. Energy Convers. Manag. 2020, 223, 113209. [Google Scholar] [CrossRef]
  39. Nguyen, A.; Eslami-Nejad, P. A transient coupled model of a variable speed transcritical CO2 direct expansion ground source heat pump for space heating and cooling. Renew. Energy 2019, 140, 1012–1102. [Google Scholar] [CrossRef]
  40. Dai, B.; Qi, H.; Liu, S.; Ma, M.; Zhong, Z.; Li, H.; Song, M.; Sun, Z. Evaluation of transcritical CO2 heat pump system integrated with mechanical subcooling by utilizing energy, exergy and economic methodologies for residential heating. Energy Convers. Manag. 2019, 192, 202–220. [Google Scholar] [CrossRef]
  41. Dai, B.; Zhao, P.; Liu, S.; Su, M.; Zhong, D.; Qian, J.; Hu, X.; Hao, Y. Assessment of heat pump with carbon dioxide/low-global warming potential working fluid mixture for drying process: Energy and emissions saving potential. Energy Convers. Manag. 2020, 222, 113225. [Google Scholar] [CrossRef]
  42. Cho, H.; Ryu, C.; Kim, Y.; Kim, H.Y. Effects of refrigerant charge amount on the performance of a transcritical CO2 heat pump. Int. J. Refrig. 2005, 28, 1266–1273. [Google Scholar] [CrossRef]
  43. Kim, J.H.; Cho, J.M.; Lee, I.H.; Lee, J.S.; Kim, M.S. Circulation concentration of CO2/propane mixtures and the effect of their charge on the cooling performance in an air-conditioning system. Int. J. Refrig. 2007, 30, 43–49. [Google Scholar] [CrossRef]
  44. Zhang, Z.; Dong, X.; Ren, Z.; Lai, T.; Hou, Y. Influence of Refrigerant Charge Amount and EEV Opening on the Performance of a Transcritical CO2 Heat Pump Water Heater. Energies 2017, 10, 1521. [Google Scholar] [CrossRef] [Green Version]
  45. Li, Z.; Jiang, H.; Chen, X.; Liang, K. Optimal refrigerant charge and energy efficiency of an oil-free refrigeration system using R134a. Appl. Therm. Eng. 2019, 164, 114473. [Google Scholar] [CrossRef]
  46. He, Y.-J.; Liang, X.-Y.; Cheng, J.-H.; Shao, L.-L.; Zhang, C.-L. Approaching optimum COP by refrigerant charge management in transcritical CO2 heat pump water heater. Int. J. Refrig. 2020, 118, 161–172. [Google Scholar] [CrossRef]
  47. Li, K.; Lan, J.; Zhou, G.; Tang, Q.; Cheng, Q.; Fang, Y.; Su, L. Investigation on the Influence of Refrigerant Charge Amount on the Cooling Performance of Air Conditioning Heat Pump System for Electric Vehicles. J. Therm. Sci. 2018, 28, 294–305. [Google Scholar] [CrossRef]
  48. Li, K.; Yu, J.; Liu, M.; Xu, D.; Su, L.; Fang, Y. A Study of Optimal Refrigerant Charge Amount Determination for Air-Conditioning Heat Pump System in Electric Vehicles. Energies 2020, 13, 657. [Google Scholar] [CrossRef] [Green Version]
  49. Chesi, A.; Esposito, F.; Ferrara, G.; Ferrari, L. Experimental analysis of R744 parallel compression cycle. Appl. Energy 2014, 135, 274–285. [Google Scholar] [CrossRef]
  50. Zhang, J.; Zhang, H.-H.; He, Y.-L.; Tao, W.-Q. A comprehensive review on advances and applications of industrial heat pumps based on the practices in China. Appl. Energy 2016, 178, 800–825. [Google Scholar] [CrossRef]
  51. Laura, A.; Daniel, S.; Daniel, A.; Ramon, C.; Rodrigo, L. Experimental determination of the optimum intermediate and gas-cooler pressures of a commercial transcritical CO2 refrigeration plant with parallel compression. Appl. Eng 2021, 189, 116671. [Google Scholar]
  52. Han, Z.; Bai, C.; Ma, X.; Li, B.; Hu, H. Study on the performance of solar-assisted transcritical CO2 heat pump system with phase change energy storage suitable for rural houses. Sol. Energy 2018, 174, 45–54. [Google Scholar] [CrossRef]
  53. Dai, B.; Liu, S.; Zhu, K.; Sun, Z.; Ma, Y. Thermodynamic performance evaluation of transcritical carbon dioxide refrigeration cycle integrated with thermoelectricity subcooler and expander. Energy 2017, 122, 787–800. [Google Scholar] [CrossRef]
  54. Kohsokabe, H.; Funakoshi, S.; Tojo, K.; Nakayama, S.; Kurashige, K. Basic operating characteristics of CO2 refrigeration cycles with expander-compressor unit. In Proceedings of the International Refrigeration and Air Conditioning Conference at Purdue, West Lafayette, IN, USA, 14–17 July 2006; pp. 1–8. [Google Scholar]
  55. Kim, H.J.; Ahn, J.M.; Cho, S.O.; Cho, K.R. Numerical simulation on scroll expander–compressor unit for CO2 trans-critical cycles. Appl. Therm. Eng. 2008, 28, 1654–1661. [Google Scholar] [CrossRef] [Green Version]
  56. Kakuda, M.; Nagata, H.; Ishizono, F. Development of a Scroll Expander for the CO2 Refrigeration Cycle. HVACR Res. 2009, 15, 771–783. [Google Scholar] [CrossRef]
  57. Nagata, H.; Kakuda, M.; Sekiya, S.; Shimoji, M.; Koda, T. Development of a scroll expander for the CO2 refrigeration cycle. In Proceedings of the International Compressor Engineering Conference at Purdue, West Lafayette, IN, USA, 12–15 July 2010; pp. 1–7. [Google Scholar]
  58. Gullo, P.; Ryhl, K.M.; Haida, M.; Smolka, J.; Elbel, S. A review on current status of capacity control techniques for two-phase ejectors. Int. J. Refrig. 2020, 119, 64–79. [Google Scholar] [CrossRef]
  59. Gullo, P.; Tsamos, K.M.; Hafner, A.; Banasiak, K.; Ge, Y.T.; Tassou, S.A. Crossing CO2 equator with the aid of multi-ejector concept: A comprehensive energy and environmental comparative study. Energy 2018, 164, 236–263. [Google Scholar] [CrossRef]
  60. Song, Y.; Li, D.; Cao, F.; Wang, X. Investigation of the optimal intermediate water temperature in a combined R134a and transcritical CO2 heat pump for space heating. Int. J. Refrig. 2017, 79, 10–24. [Google Scholar] [CrossRef]
  61. Song, Y.; Li, D.; Cao, F.; Wang, X. Theoretical investigation on the combined and cascade CO2/R134a heat pump systems for space heating. Appl. Therm. Eng. 2017, 124, 1457–1470. [Google Scholar] [CrossRef]
  62. Rony, R.U.; Yang, H.; Krishnan, S.; Song, J. Recent advances in transcritical CO2 (R744) heat pump system: A review. Energies 2019, 12, 457. [Google Scholar] [CrossRef] [Green Version]
  63. Bevington, P.R.; Robinson, D.K.; Blair, J.M.; Mallinckrodt, A.J.; McKay, S. Data reduction and error analysis for the physical sciences. Comput. Phys. 1993, 7, 415–416. [Google Scholar] [CrossRef]
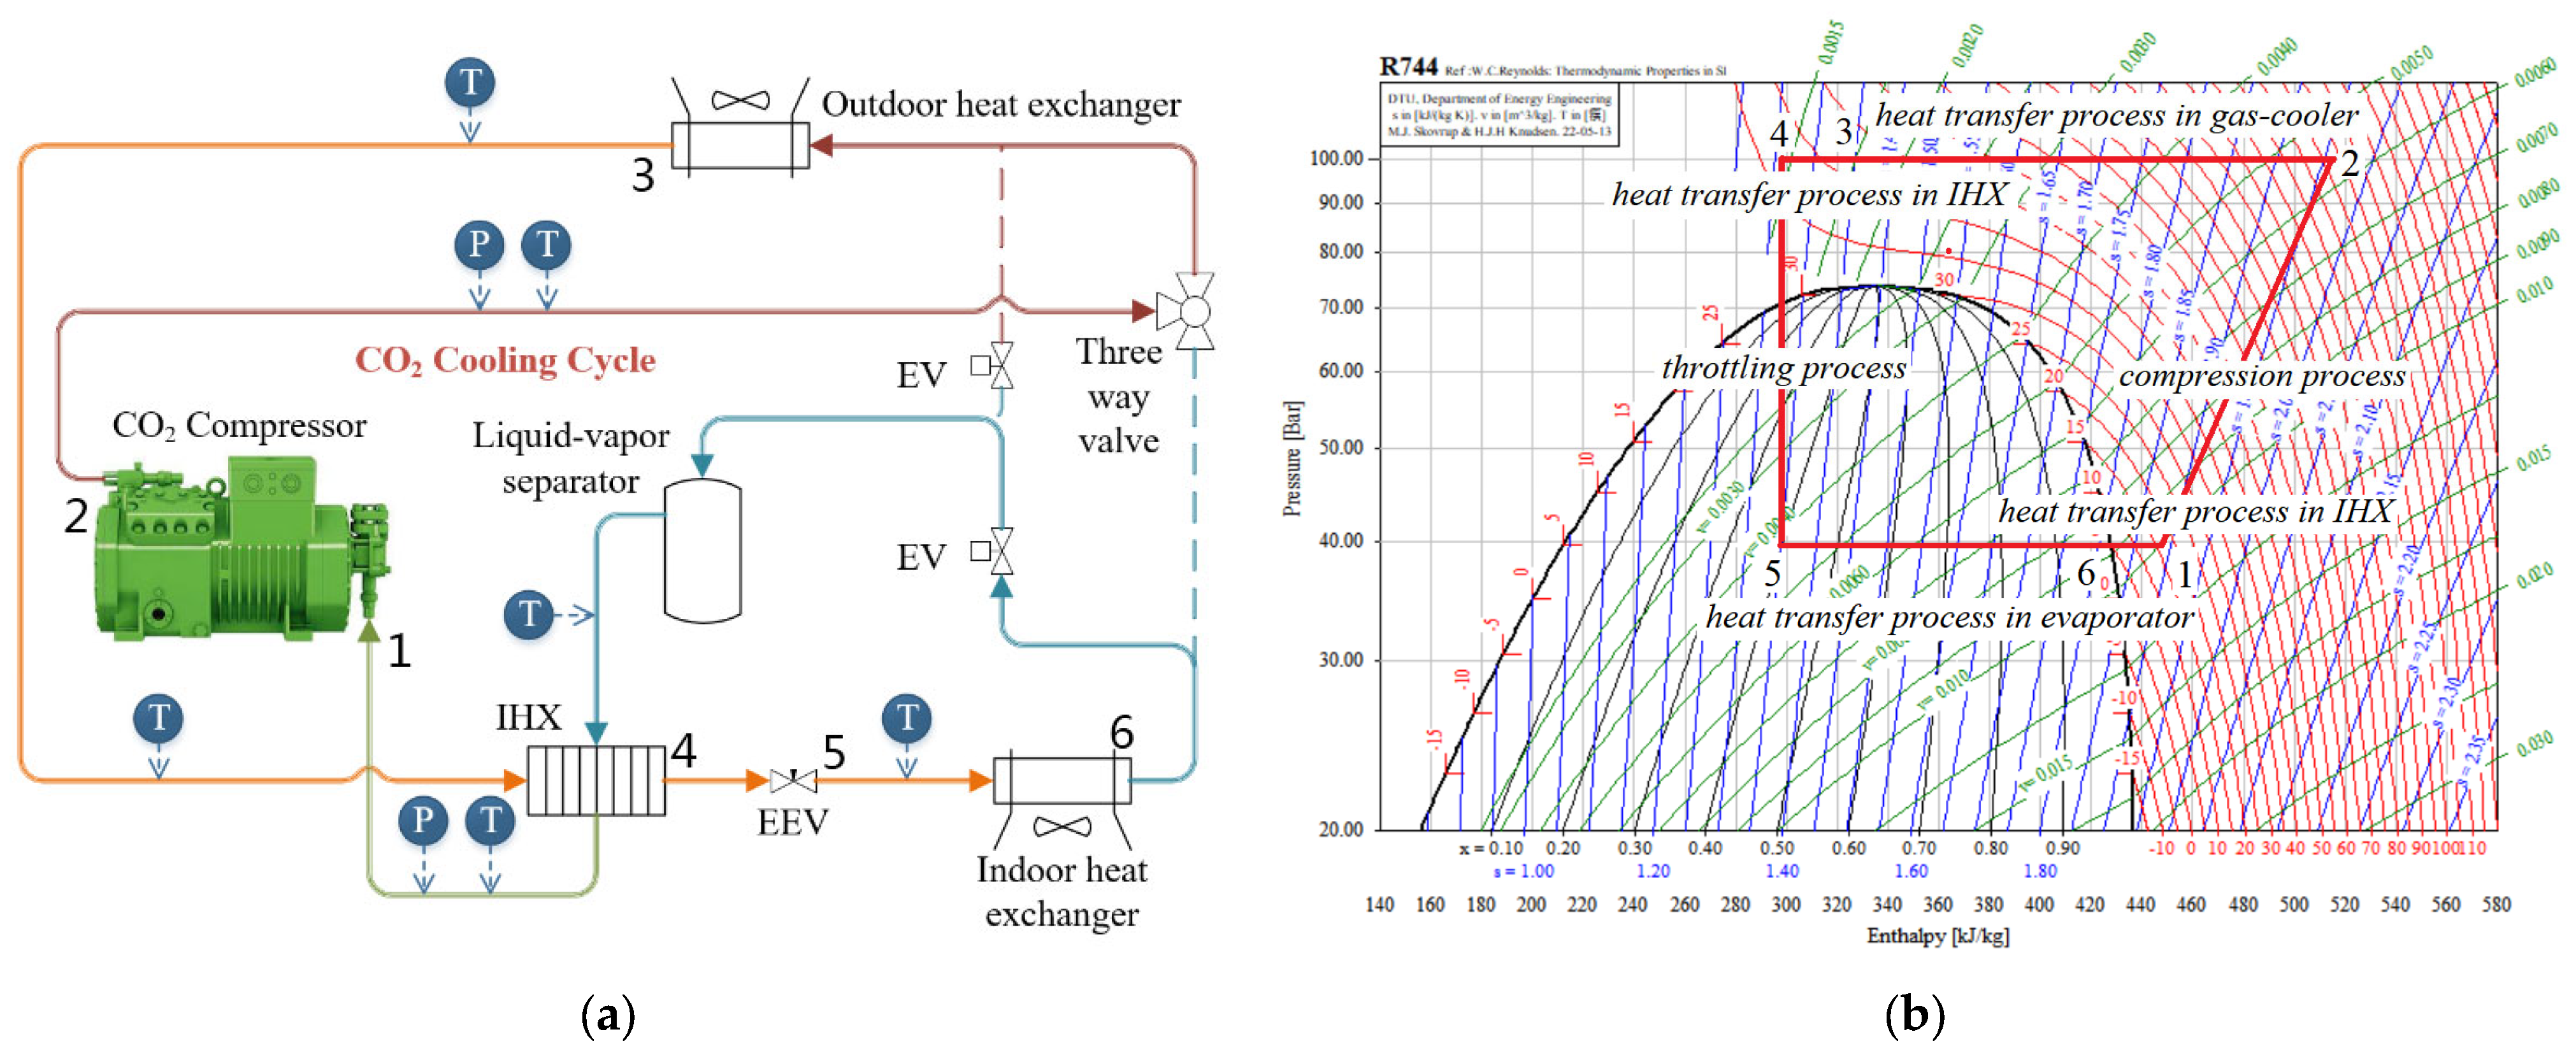
Figure 1. (a) The schematic of the transcritical CO2-based bus air conditioning/heat pump system. (b) The P-h diagram of the transcritical CO2-based bus air conditioning/heat pump system under cooling conditions.
Energies 16 02600 g001
Figure 2. (a) The GT-Suite simulation model of the transcritical CO2-based bus air conditioning/heat pump system. (b) The sketch of the EEV structure.
Energies 16 02600 g002
Figure 3. The simulation flow chart.
Energies 16 02600 g003
Figure 4. The experimental prototype of the transcritical CO2-based bus air conditioning/heat pump system.
Energies 16 02600 g004
Figure 5. The T−s diagram and P−h diagram of the transcritical CO2 cycle under various refrigerant charging amounts.
Energies 16 02600 g005
Figure 6. The global performance of the transcritical CO2 system under various refrigerant charging amounts.
Energies 16 02600 g006
Figure 7. The CO2 refrigerant distribution under various refrigerant charging amounts.
Energies 16 02600 g007
Figure 8. The refrigerant amount ratios in different positions under various refrigerant charging amounts.
Energies 16 02600 g008
Figure 9. System performance versus refrigerant charging amount under different ambient temperatures.
Energies 16 02600 g009
Figure 10. Refrigerant distribution versus refrigerant charging amount at different ambient temperatures.
Energies 16 02600 g010
Figure 11. Comparison between the experimental data and simulation data.
Energies 16 02600 g011
Table 1. Component parameters of the transcritical CO2-based bus air conditioning/heat pump system.
Part NameParameter Description
CompressorThe displacement is 31.1 cm2
Indoor heat exchangerThe finned heat exchanger is used as the heat exchanger, with the cross-flow as the flow path, copper tube as the material, and a heat exchange area of 0.972 m2
Outdoor heat exchangerThe finned heat exchanger is used as the heat exchanger, with the cross-flow as the flow path, copper tube as the material, and a heat exchange area of 1.615 m2
Throttling deviceThe electronic expansion valve (EEV)
Internal heat exchangerThe plate heat exchanger is used as the heat exchanger, the material is stainless steel, the number of plates is 10, and the heat exchange area is 0.095 m2
Gas-liquid separator4.8 L
Table 2. Main measuring instruments and auxiliary experimental equipment.
NameDetailed Description
Sample ductCollects indoor and outdoor ambient air for temperature measurement
Thermo-coupleReal-time temperature measurement of key components with a test error of ±0.5 °C
Armored thermocoupleMeasures the air temperature in the sampling air duct (which is considered to be extracted from the environment) with a test error of ±0.5 °C
Thermal insulation cottonMaintains the relative heat insulation of the thermo-couple measuring pipe
Pressure sensorMonitors the real-time pressure of each component with a test error of ±0.5% of the test value
Disclaimer/Publisher’s Note: The statements, opinions and data contained in all publications are solely those of the individual author(s) and contributor(s) and not of MDPI and/or the editor(s). MDPI and/or the editor(s) disclaim responsibility for any injury to people or property resulting from any ideas, methods, instructions or products referred to in the content.