1. Introduction
Lean premixed combustion technology is the leading technology employed in order to meet the low NOx emission targets. This applies to both fossil fuels and renewable fuels. It was first introduced for natural gas, but it will also apply to, for example, hydrogen, and in the near future, kerosene-fueled aero engines will burn in the lean premix mode. The formation of nitric oxides by means of the Zeldovich mechanism is strongly dependent on the flame temperature, which can be reduced by mixing combustion air with the fuel very well before reaching the combustion zone. This method is, however, accompanied by an increased risk of combustion instabilities known as thermoacoustic instabilities. These instabilities originate from the feedback loop between the acoustics of the combustion system and the heat released by the flame [
1]. The effect of the instabilities on the gas turbine engine components can be very harmful. Therefore, it is very important to be able to predict these instabilities in the design stage. This can be accomplished for low frequencies by making use of 1D acoustic network modeling with the input of a flame transfer function (FTF) [
2,
3]. The FTF is the active component that describes the amplitude and phase relation between the volume-integrated heat release rate of the flame and its dynamic response to the acoustic field in the burner passages.
The FTF can be obtained from measurements, transient CFD simulations, or analytical models. Experimentally obtained FTF have been outlined in several works; see, e.g., [
4,
5]. These studies investigate the FTF on atmospheric test rigs [
4,
5]. The FTF on high-pressure test rigs has been presented in [
6] (five-bar test rig) and [
7] (seven-bar test rig). Analytical models for FTF are discussed by several authors [
8,
9,
10]. Lieuwen discussed the unsteady well-stirred reactor model by specifying the reaction rate [
8]. The constant flame speed approach was further extended to model the unsteady behavior of a ducted flame by Downling et al. [
9]. Cho et al. investigated combustion instabilities by modeling the kinematic equations for the flame front [
10]. Van Kampen studied the FTF by means of CFD simulations using white noise excitation [
6]. Bohn et al. investigated the frequency response of the flame by introducing a sudden increase in the mass flow rate [
11]. Armitage et al. focused on the effects of the equivalence ratio oscillations and extracted flame responses from CFD results [
12]. Gentemann et al. estimated the FTF based on RANS simulations with broad band excitation of the flow variables [
13]. Innocenti et al. introduced perturbations in the system, imposing a broad band excitation as an inlet boundary condition [
14]. In this study the FTF will be determined by a numerical simulation, using an unsteady CFD simulation in which a swirl-stabilized premixed flame is excited by sinusoidal multi-excitations. Van Kampen and Kok presented a method for measuring the FTF using pressure sensors and a MOOG valve and also FTF calculations by means of CFD results [
15,
16]. Pozarlik obtained the FTF with use of experimental data and thermodynamic relations [
17]. In the present paper, for the numerical investigation of the FTF, equivalence ratio fluctuations are used as the controlling variable. In references [
15,
16,
18], measurements on the same configuration are reported, where the resulting heat release rate fluctuations were captured with a photomultiplier tube (PMT). The equivalence ratio fluctuations were generated in that experiment by exciting the fuel mass flow using a siren device [
18]. In that way, the maximum forcing frequency was increased to 800 Hz [
16], instead of 400 Hz with the MOOG valve used in [
15,
17]. This is important, as the combustor has an important thermoacoustic eigenfrequency at just over 400 Hz.
The non-linear extension of the flame transfer function was introduced in [
19] and earlier in [
20] as the Flame Describing Function (FDF). This is necessary for the prediction of the saturated amplitude and frequency of a limit cycle oscillation. Currently, there are many experimental investigations on the non-linear FTF [
19,
20,
21]. However, the number of studies on the CFD-predicted nonlinear FTF is limited. A good example of the latter is the FDF investigated for a two-dimensional ethylene flame, which was close to laminar, using a URANS approach by Armitage et al. [
12]. Krediet et al. analyzed the FDF by means of Large Eddy Simulation [
22]. In that investigation, at atmospheric conditions, the simulation-based linear FTF was validated with the measured FTF. Furthermore, the non-linear FTF was simulated. The results were implemented in the one-dimensional acoustic network model for an instability search.
One-dimensional acoustic network models (ANM) are very effective tools for answering instability questions. The whole combustion system can be represented by small and easy-to-calculate elements in the ANM. Every acoustic element can be defined as a transfer matrix which describes the relationships between acoustic quantities at both ends of the element [
6,
16]. The FTF can be used as an input to the ANM to substitute the flame. In this way, the ANM provides a solution for the complex eigenfrequencies of the system. These can be used to decide if oscillations at these frequencies are damped or excited. The transfer matrix formulation can be carried out in several ways. The method used by Van der Eerden [
23] relates the total pressure amplitudes to the mass flow perturbations. Another way to formulate the transfer matrix is to express the forward and backward pressure wave amplitudes instead of the total pressure wave amplitudes [
24]. Authors such as Polifke [
25] and Hobson [
26] used a scattering matrix method which describes the transfer function between the pressure and velocity perturbation at both sides of the acoustic element. In the present study, the method from Van der Eerden is used. Since this method uses the total pressure wave amplitudes, the experimental results can easily be compared with numerical predictions.
The main objective of this paper is to provide more insight into premixed swirled combustion dynamics. The combustion dynamics are studied by means of CFD simulation and validated by the experiments. In earlier studies, the FTF was simulated by means of white noise excitation [
6] or single-frequency excitations [
22]. In the state-of-the-art procedure, the FTF and FDF are simulated by URANS simulations, where the fuel mass flow is excited by multiple frequencies. The measured and simulated FTF is further used as an input to the network model. The implementation of the FTF is carried out by means of a rational transfer function, where the accuracy of the fitted transfer function increases dramatically.
In the next section, the FTF technique applied here is summarized. The combustor test rig on which the analysis will be performed is described in
Section 2.1. The computational domain of the setup and the specifics of the numerical method are described in
Section 2.2. In
Section 3, the numerical performance with a view to mesh resolution is discussed. The prediction of self-excited combustion and pressure fluctuations is discussed in
Section 4 and compared with available experimental data. This numerical analysis gives sufficiently accurate predictions to move on to the determination of the Flame Transfer Function, by performing transient numerical simulations with forcing of the fuel flow. This is discussed and validated against the measured data in
Section 5. The effect of high-amplitude excitation and the Flame Deriving Function are the topics of
Section 6. Finally, the acoustic stability of the combustor as a function of the FDF is analyzed with the implementation of the FDF in the Acoustic Network Model, and the results are presented in
Section 7. A summary of the applied ANM is presented in
Appendix A.
2. Summary of the Flame Transfer Function Application
The FTF is an important functional component for taking into account the combustion dynamics inside the combustion chamber. For the FTF, the influence of the burner inlet flow conditions on the flame heat release rate fluctuations has to be known. This can be determined by means of experimental or numerical studies. In this investigation, the FTF is considered for the fuel mass flow rate fluctuations that have a direct effect on the fuel-to-air equivalence ratio. In case of a partially premixed combustor, combustion instabilities are induced by equivalence ratio fluctuations at the location where fuel and air are mixed. Thus, this local change in the equivalence ratio changes the local flame temperature as well as the local heat release of the flame (discussed in Appendix 2 of [
15]). It was pointed out by several researchers that the equivalence ratio fluctuations have a major impact on the heat release of the flame and on the flame speed by changing the chemical reaction rate [
10,
24,
26,
27]. In the present investigation, the nominal equivalence ratio is 0.56, with an air-to-fuel mass flow ratio of 25. The FTF
as a function of frequency represents the ratio between the flame heat release rate and the mass flow fluctuation of fuel, as shown in Equation (1):
During the experimental investigation of the FTF, the mass flow of the fuel is perturbed with a siren. The siren has two disks with special hole profiles which are designed to provide pure sinusoidal excitation with a sufficient amplitude and a large signal-to-noise ratio. It is placed at approximately 0.7 m upstream of the fuel nozzles and connected to the fuel supply line. A reference signal of the siren is captured with a Kulite pressure transducer right down-stream of the siren. Due to the length of the fuel supply line, the mass flow fluctuations generated down-stream of the siren are changed in amplitude and shifted in phase at the exit of the fuel nozzles. Due to the lack of access, it is challenging to measure the mass flow fluctuations on the DESIRE test rig during operation. Therefore, at targeted points of the operation, the transfer function between the siren reference pressure signal and fuel nozzle mass flow is measured on a 1:1 scale experimental model of the fuel supply line. The nozzle mass flow is captured by means of measuring the pressure fluctuations at the nozzle outflow. The measured pressure can be transformed to the mass flow fluctuations at the fuel nozzles using a quasi-1-D-steady approach [
28]. The mass flow fluctuations imposed in the CFD simulations presented here are based on this.
The fluctuations of the mass flow of the fuel cause fluctuations in the heat release. Since the concentration of the CH* radicals is linearly proportional to the heat release rate in the flame [
6], measuring the CH* chemiluminescence with a UV-photomultiplier represents the heat release fluctuations.
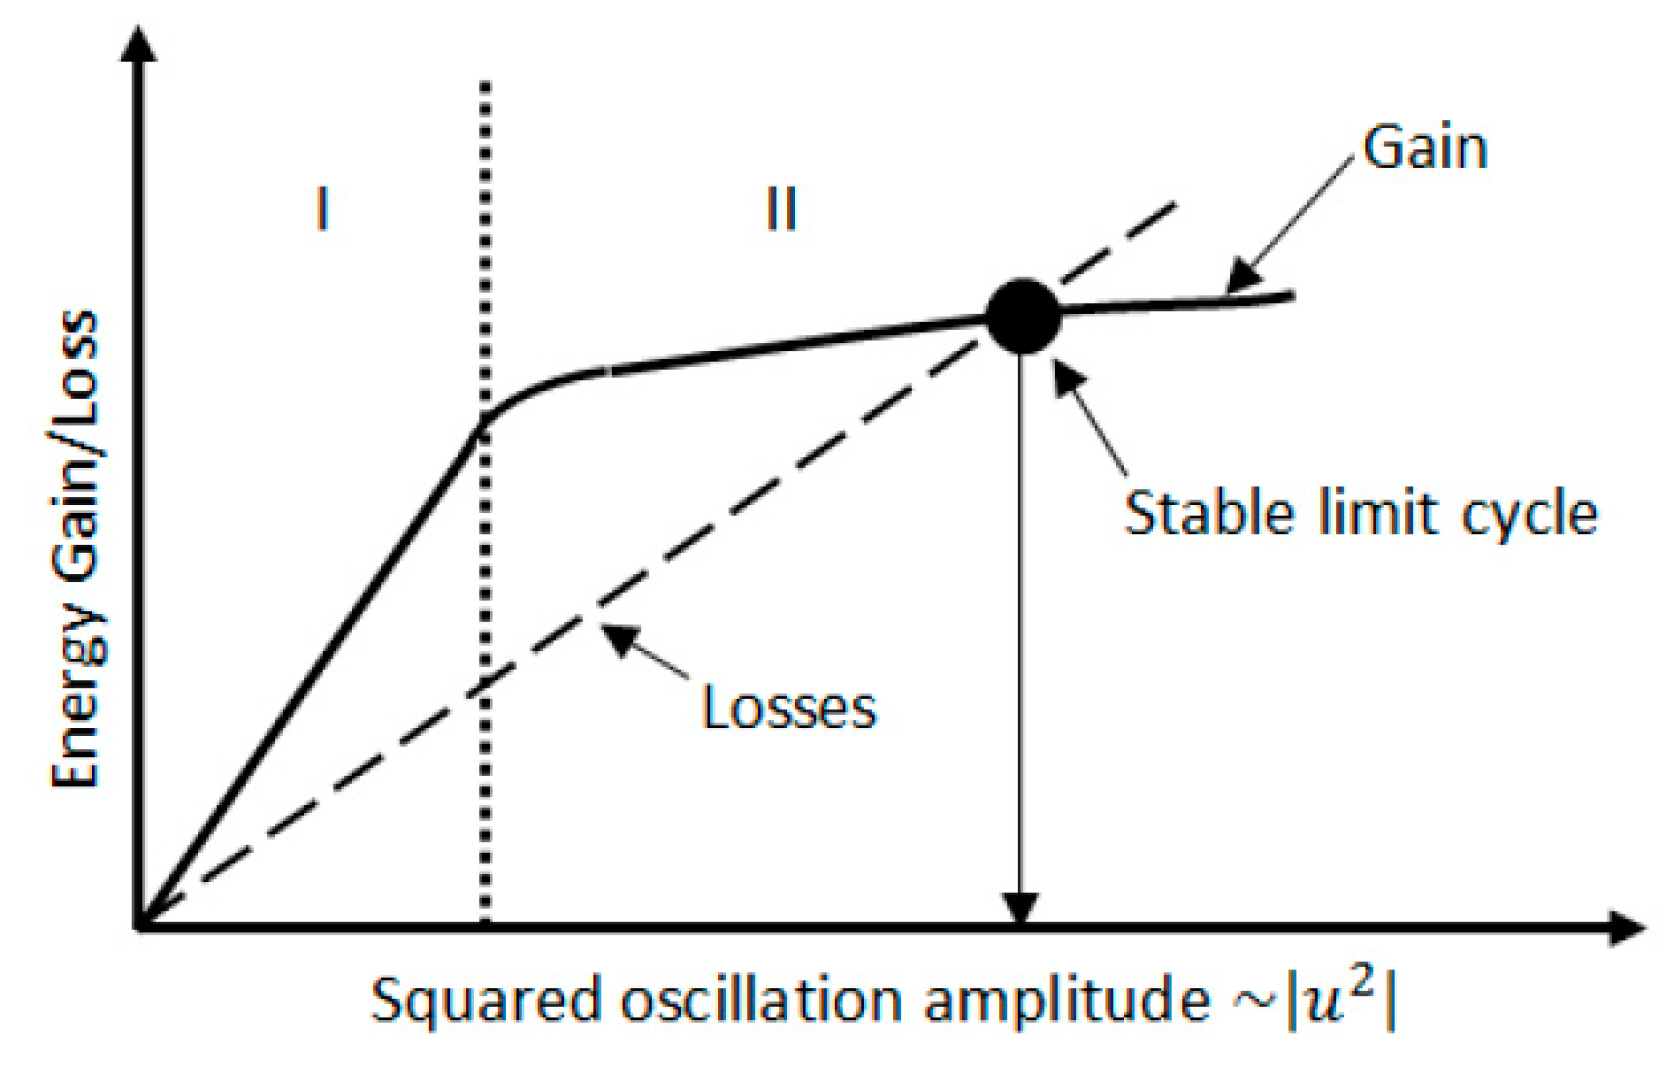
The present paper is on the calculation of the FTF by means of a series of CFD calculations using a multi discrete frequency excitation method. There are several ways to calculate the FTF, such as: white noise, impulse and sinusoidal excitation. In a turbulent flame, the white noise method is troublesome. In the multi discrete frequency excitation methods, the mass flow is forced in one simulation at several frequencies. The frequencies have to be chosen carefully to prevent possible interference with the eigenfrequencies of the system and the harmonics of the set frequencies. In the process, the response of the flame in terms of the volume integrated heat release rate is monitored. The sinusoidal excitation in the mass flow of the fuel and its result in the heat release rate can be transformed from the time domain to the frequency domain. The FTF is used in the acoustic network models to determine the frequency of the points with marginal stability. However, the amplitude of the instabilities cannot be predicted with the linear FTF. In that case, non-linear behavior must be taken into consideration. The non-linear system can be explained using
Figure 1. As shown in the figure, the amplitude of a limit cycle is reached by a balance of energy gain and losses. Up until this point, the oscillations grow in amplitude, and when the amount of energy added equals the energy losses, the oscillations reach a saturated amplitude. The linear FTF only describes the physics in region I in the figure, where the gain of the thermoacoustics is linear with the acoustic forcing. A non-linear definition of the flame dynamics can be explored by increasing the perturbation levels. This applies to region II in
Figure 1 where the gain depends non-linearly on the forcing, allowing limit cycle to develop. This is originally introduced by Dowling to upgrade the FTF to the Flame Describing Function (FDF) [
20]. Thus, the FDF can be described as
, which is not only a function of frequency but also a function of the fuel mass flow perturbation level in Equation (2).
The experimental investigation of the FDF is challenging due to the design of the fuel injection section of the experimental setup. The nozzles introduce a high damping, which limits the level of excitation [
29]. The investigation is carried out by comparing the measured FTF on the experimental setup with the calculated FTF by CFD. Afterwards, a detailed investigation for the FDF is carried out by means of numerical simulations.
2.1. Combustor Test Rig Description
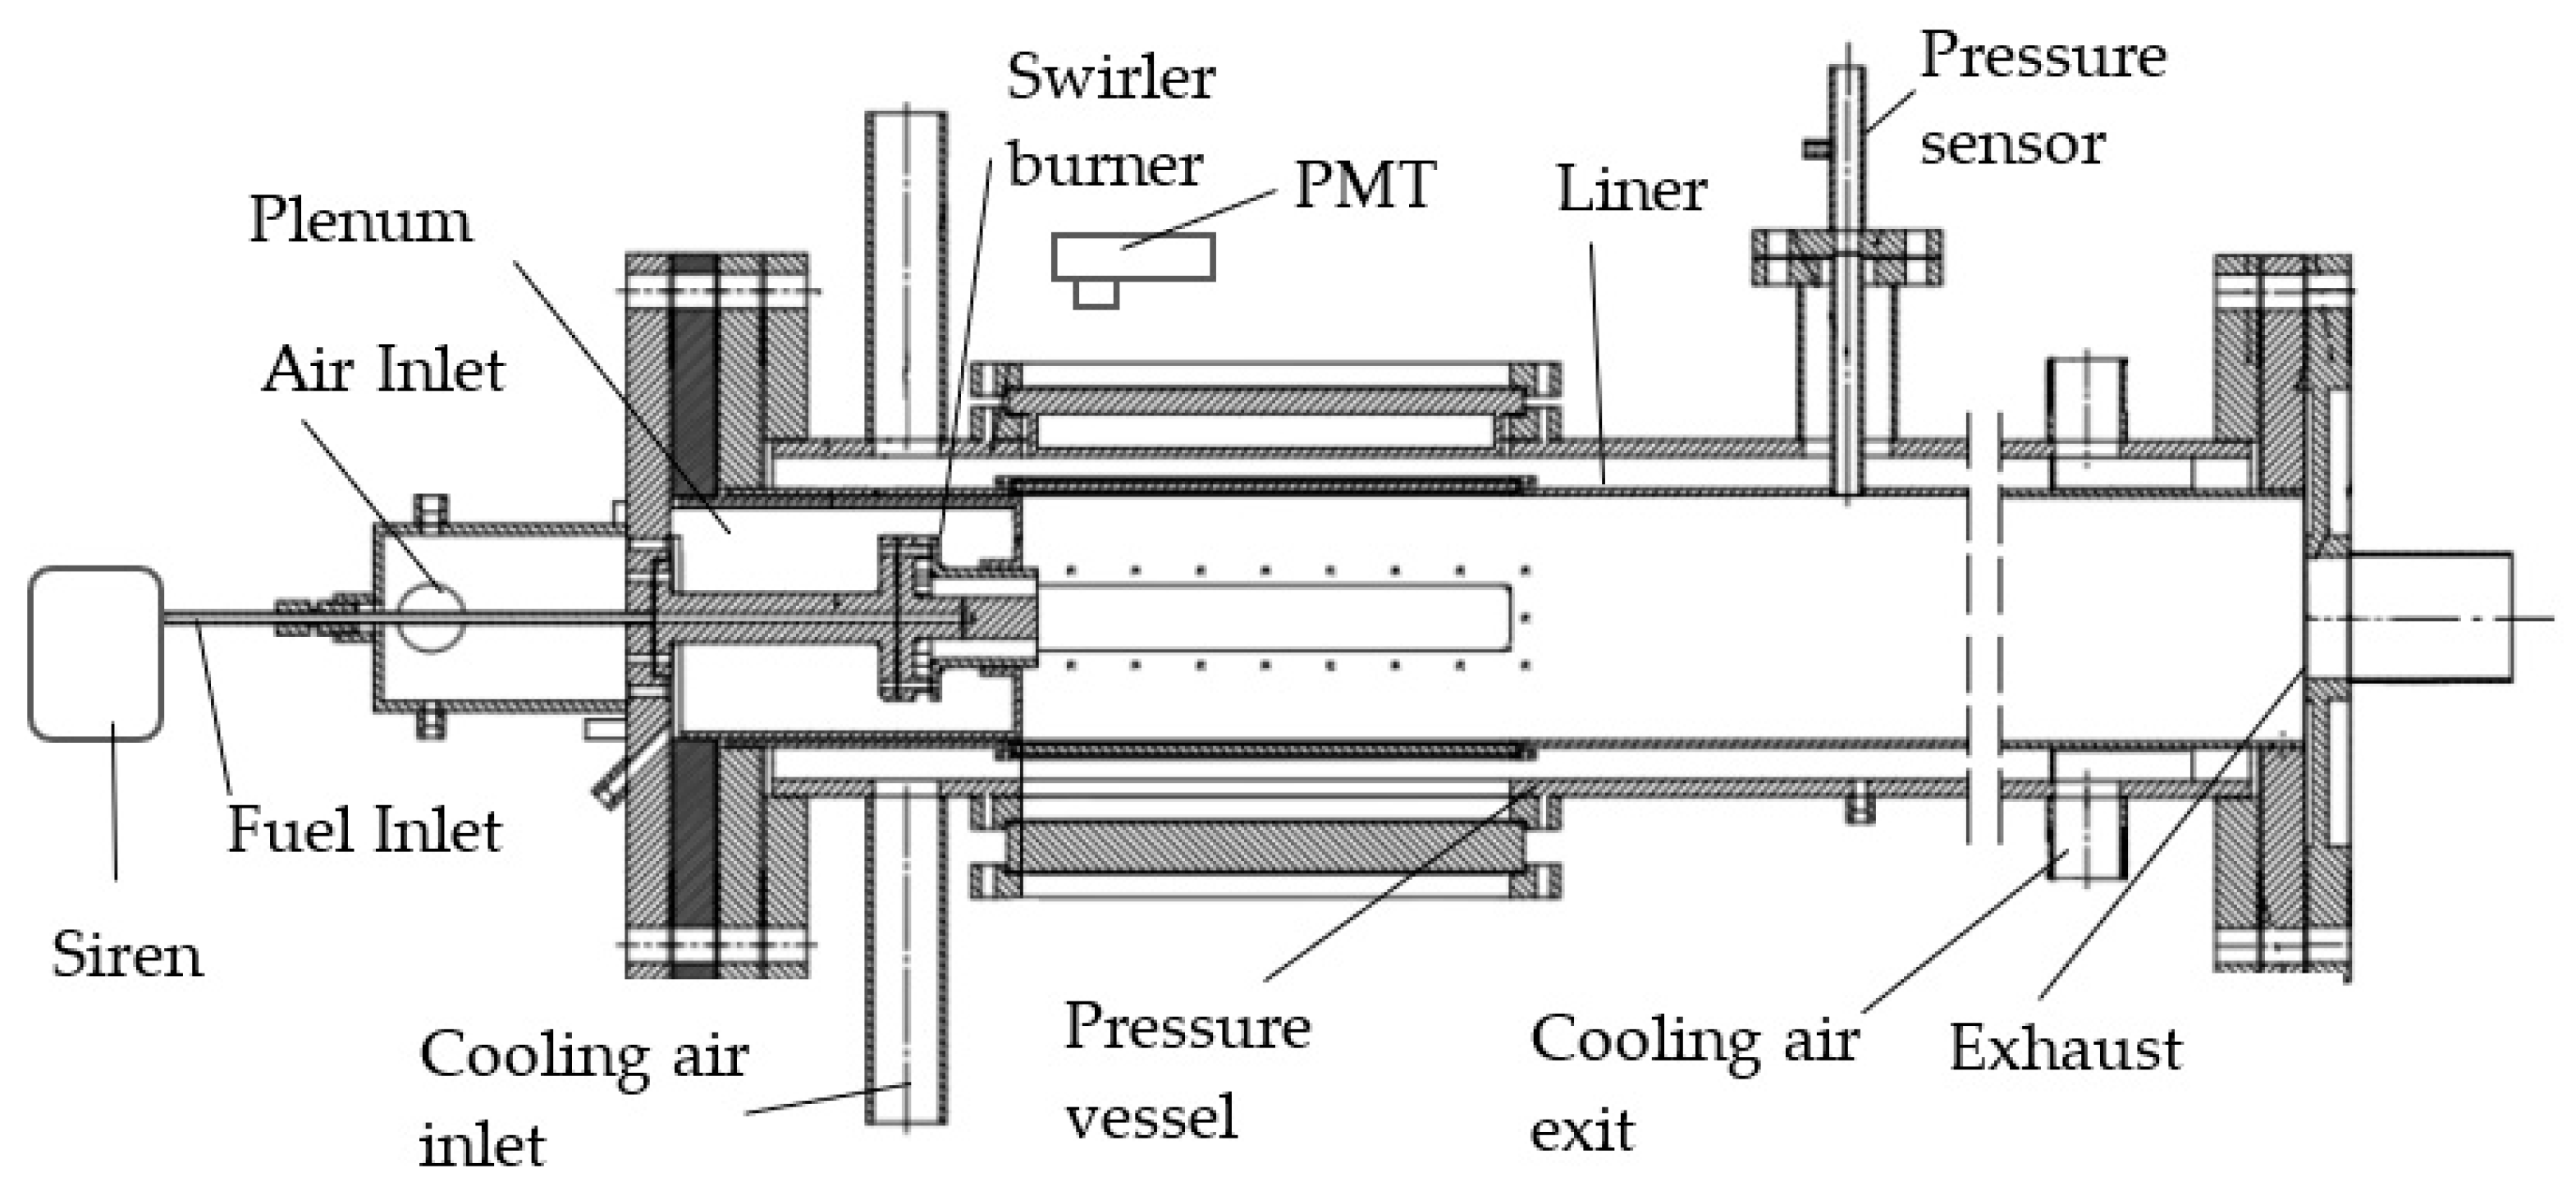
The numerical investigation in this paper is performed for the design and operating conditions of a test rig available at the University of Twente. This is the DESIRE test rig, for which measured data on combustion dynamics and acoustics are available. The DESIRE rig is a high-pressure combustor equipped with a swirl-stabilized premixed natural gas burner. The design is shown in
Figure 2. The combustor has an operating range up to 500 kW of thermal power at a five-bar absolute pressure. Natural gas with 89.12 Mol.% methane is used as a fuel in the premixed mode operation. The detailed description of the combustor along with its components is presented in earlier papers [
6,
16,
17]. Detailed results of the measurements are reported in [
18]. In the present paper, only the relevant components, which are essential to the numerical investigation in this paper, will be summarized.
The setup is assembled of several components which are relevant for the thermacoustic response. Preheated air (300 °C) is introduced to the burner plenum through a disk with 10 holes, each with a 10 mm diameter. These small injection holes provide an acoustically hard boundary condition for the acoustic waves. The swirler plays an important role for the stabilization of the flame by creating inner and outer recirculation regions. The fuel is injected through four fuel inlet holes, equally distributed along the circumference of the burner core, and it mixes with the swirled air in the annular channel. The sudden area change in the combustion chamber assists in forming the recirculation regions and flame stabilization. The overall size of the combustion chamber is 150 × 150 × 1813 mm3 (W × D × L). Another important boundary condition is provided by a contraction at the combustor exit. This contraction at the end of the combustion chamber is designed to uncouple the downstream exhaust system acoustically from the combustor.
2.2. CFD Domain
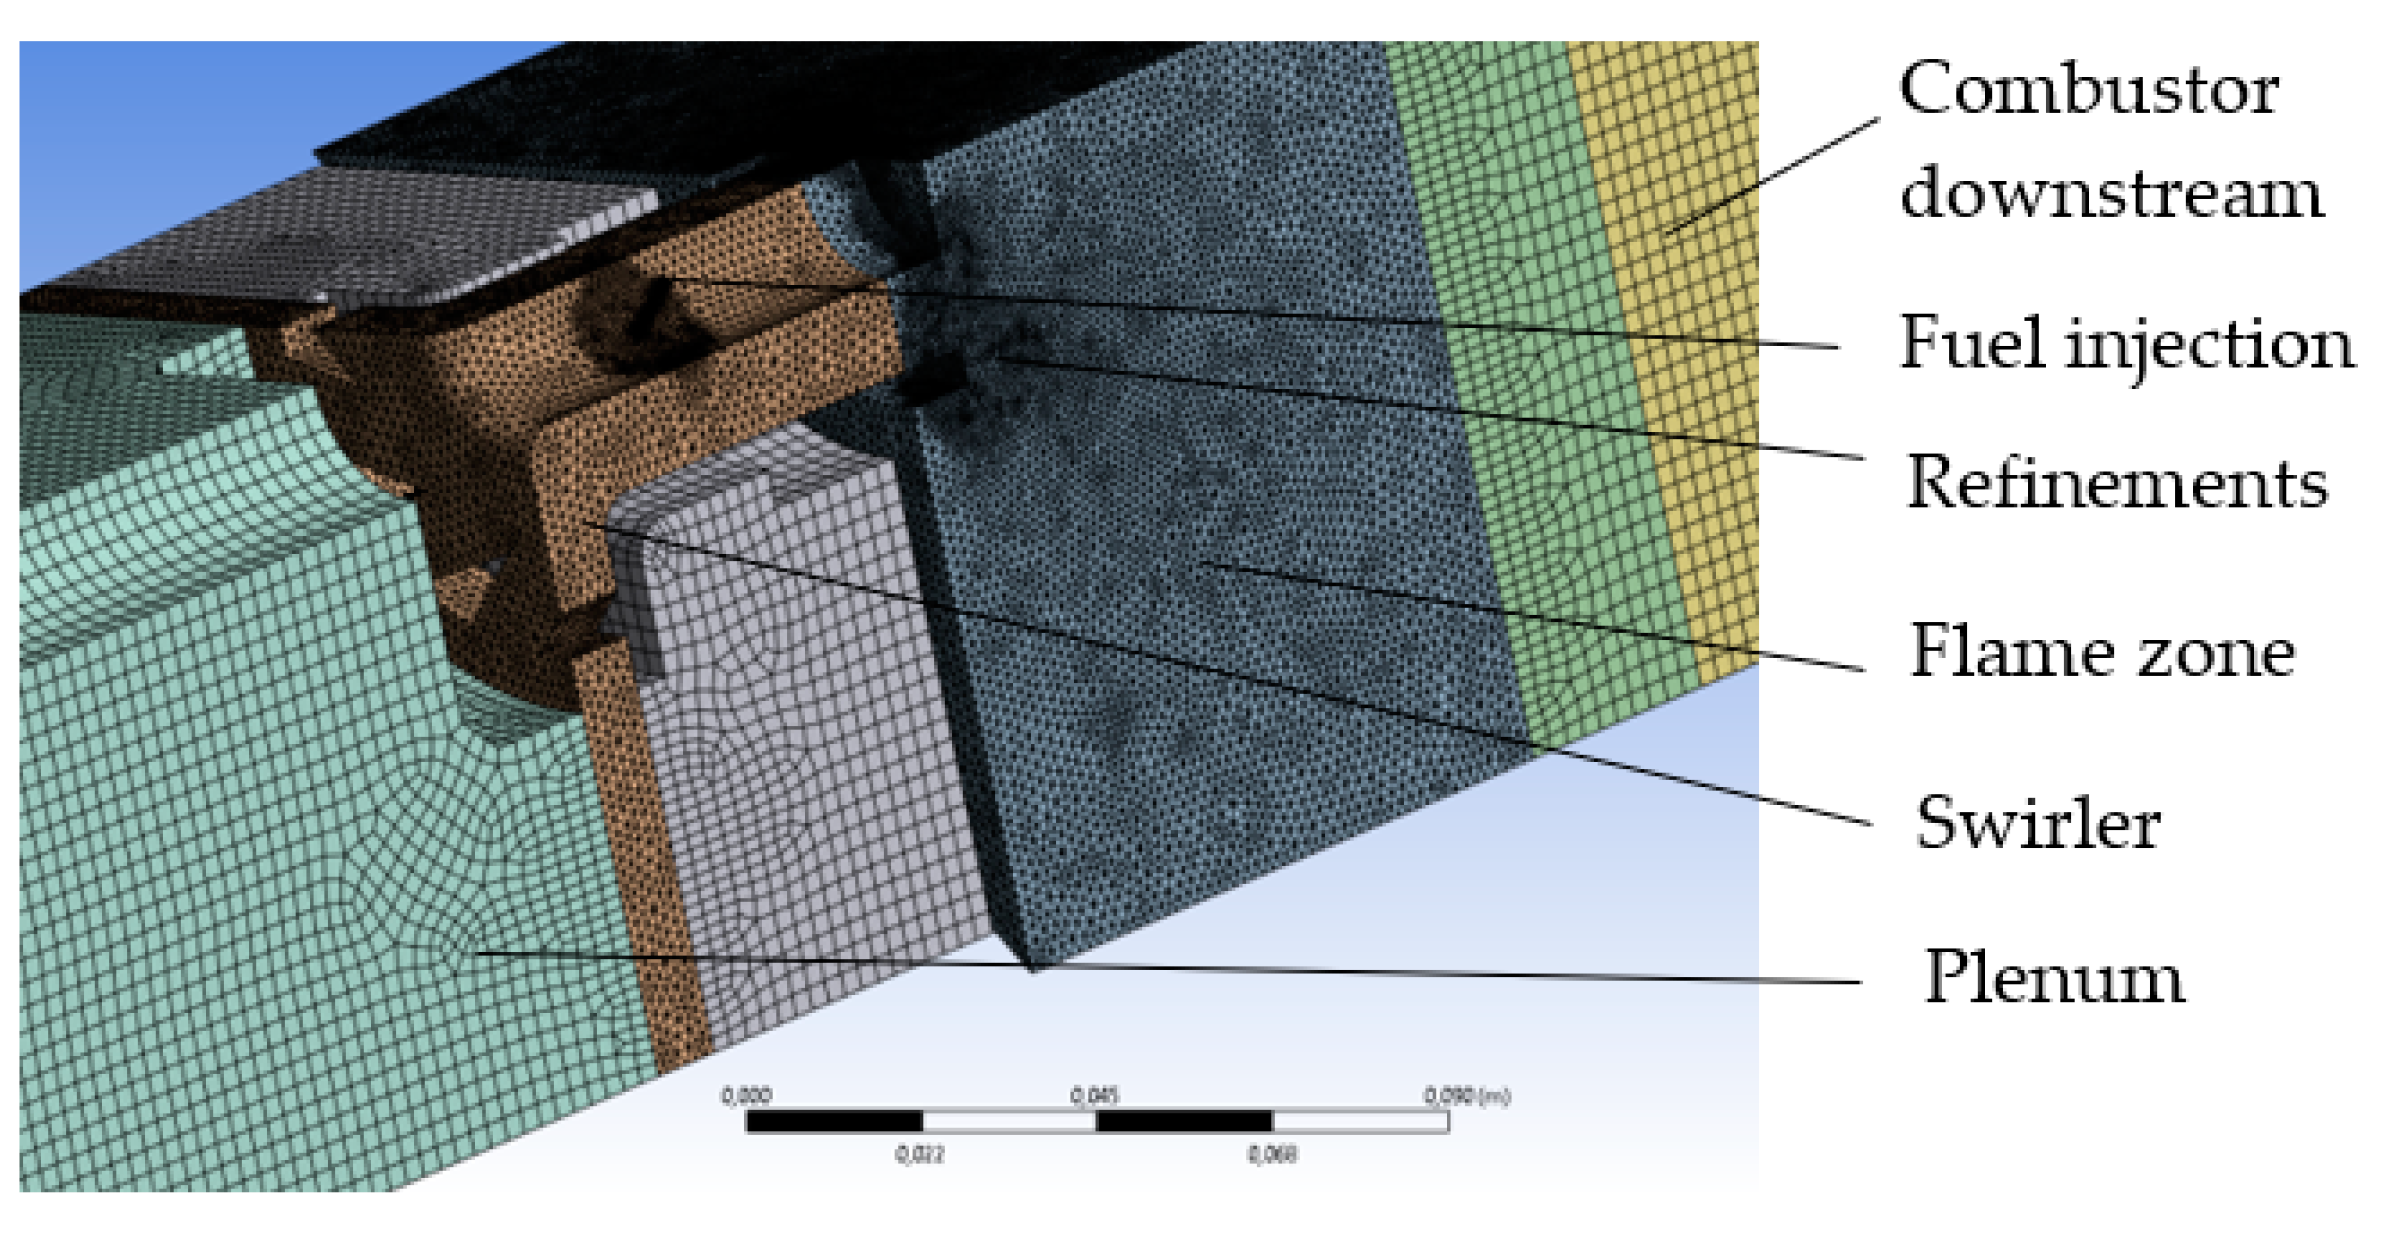
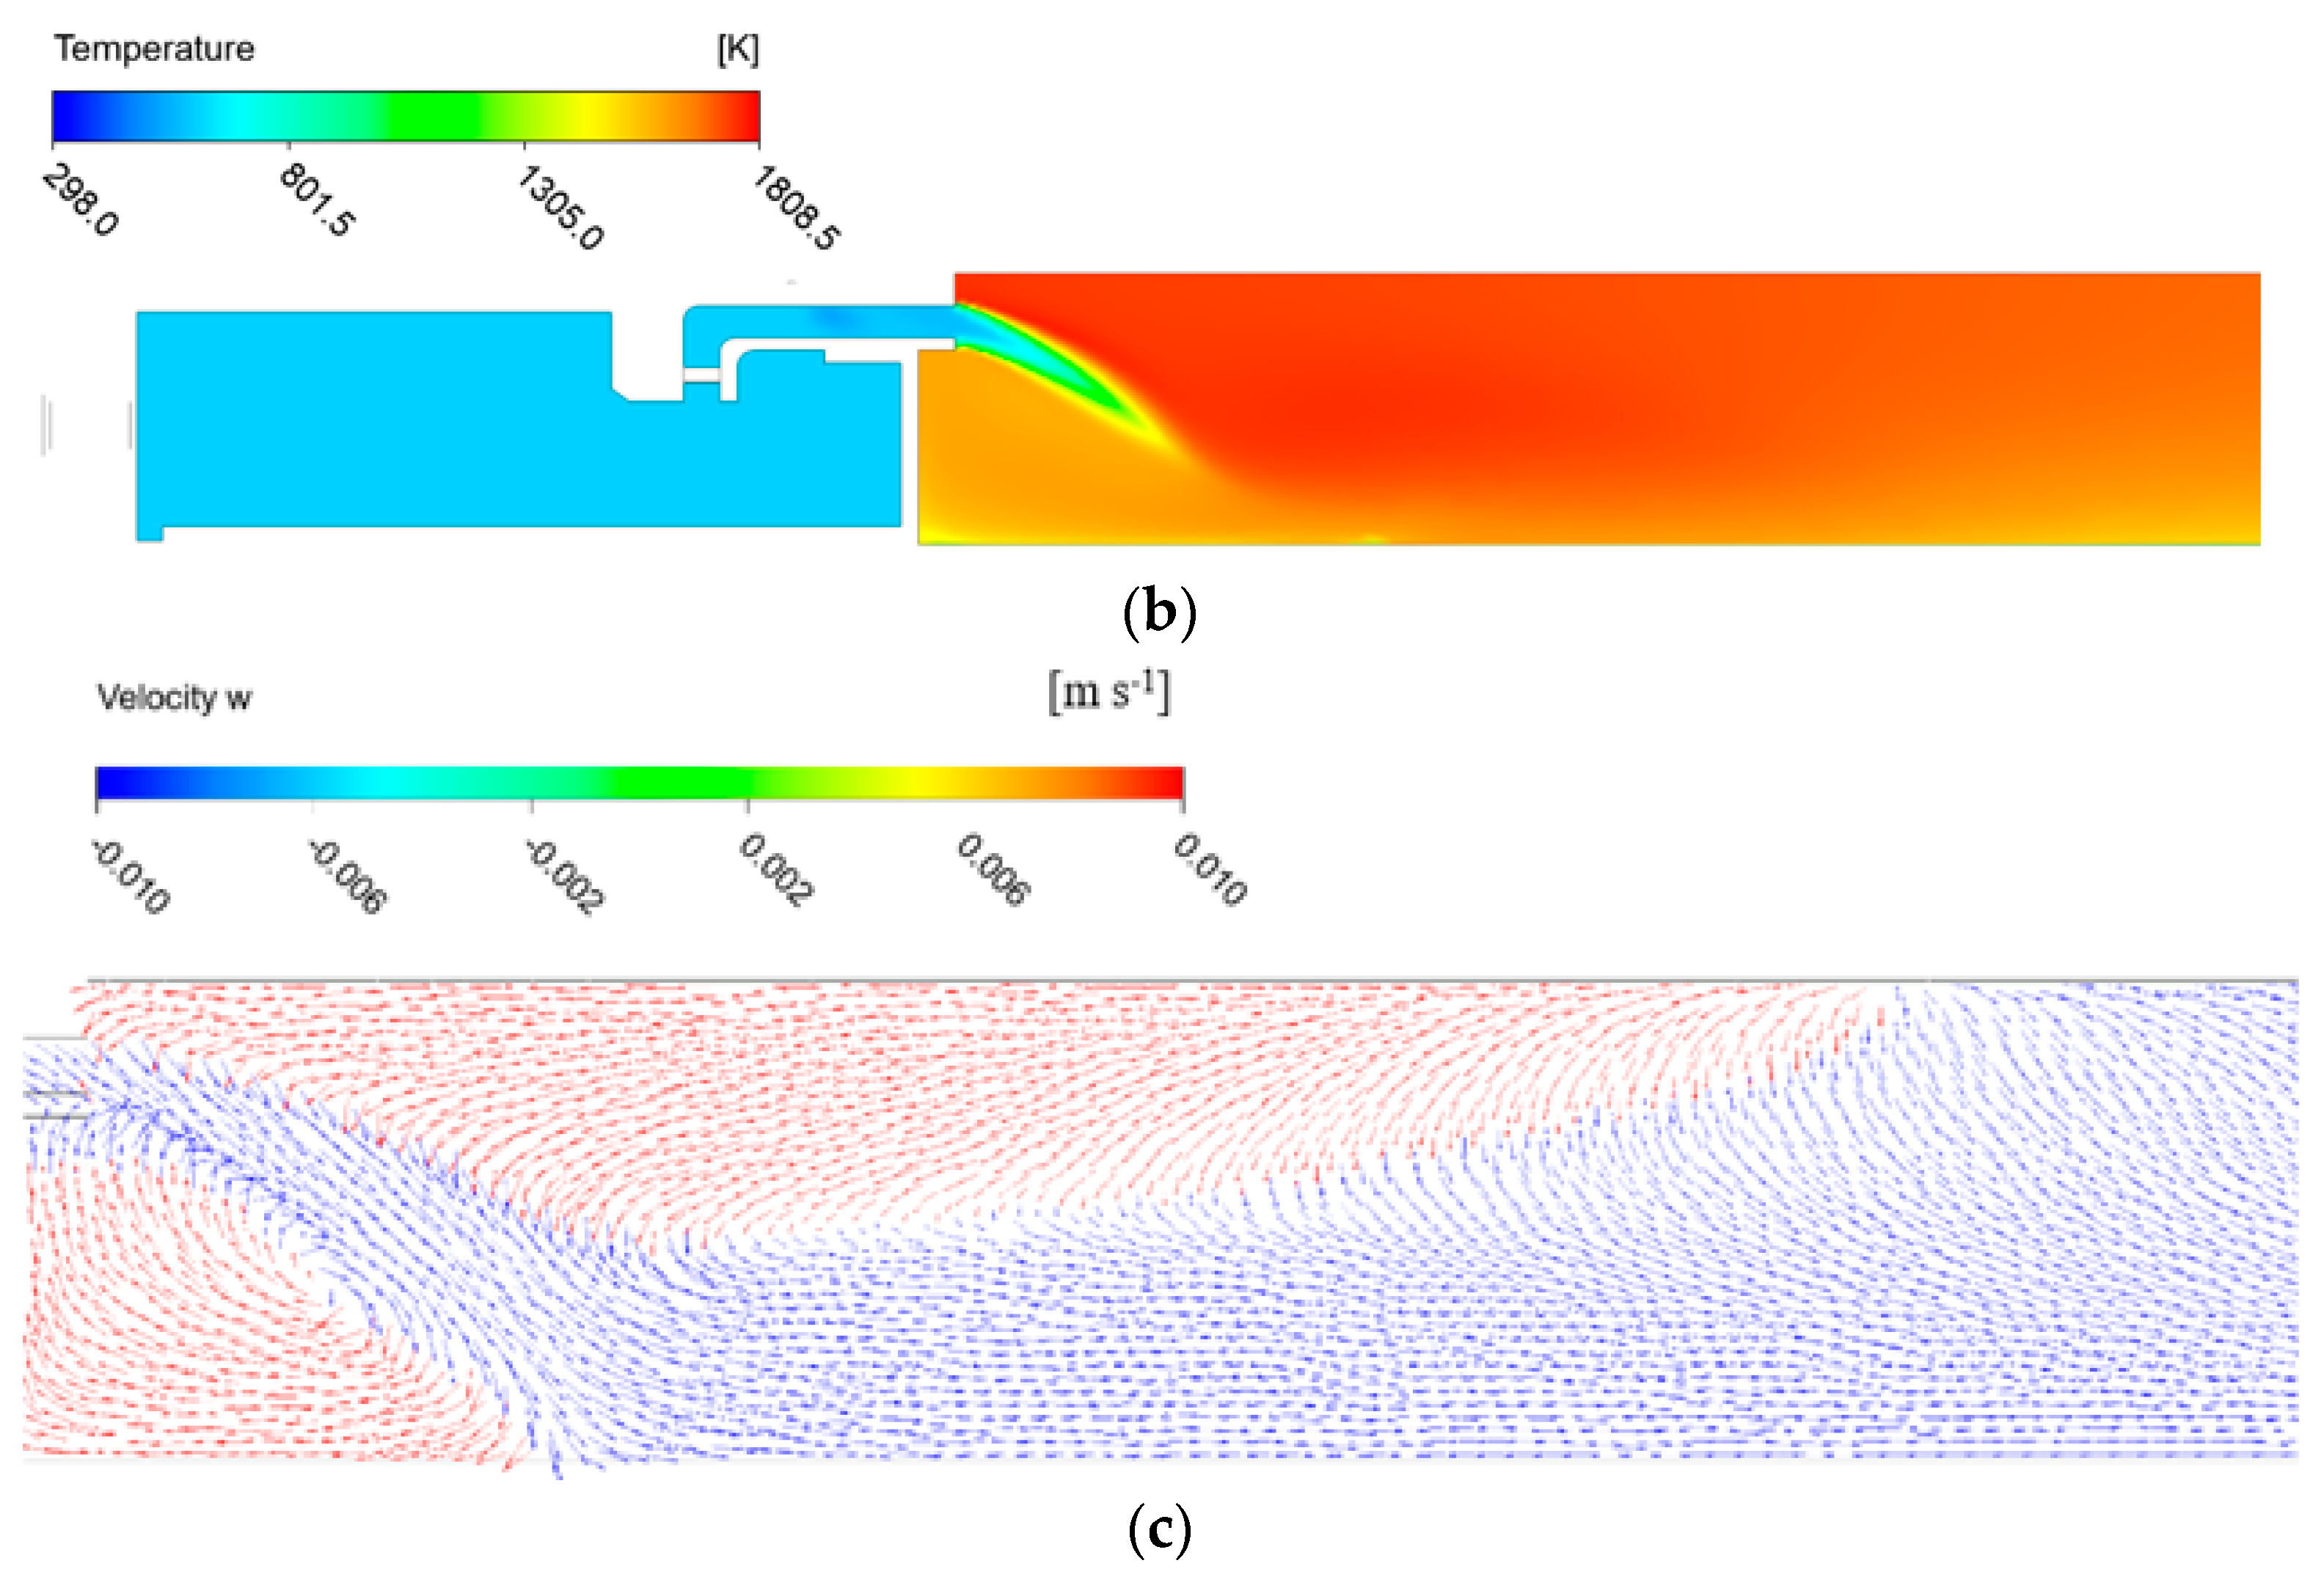
In accordance with the physical geometry, the fluid domain in the numerical model was reduced using symmetry boundary conditions in order to achieve acceptable computational effort. The sections, which are relevant in the prediction of the thermoacoustic phenomena inside the combustor, are the plenum, part of the fuel nozzle, the swirler, and the combustion chamber. However, the cooling channel surrounding the combustor and the flow downstream of the end contraction was discarded in the modeling. The heat loss of the combustor through the liner was introduced as a boundary condition. Since the combustor has a square geometry, only a quarter of the DESIRE combustor geometry is modeled to reduce the mesh size. An overview of the computational domain is shown in
Figure 3.
The resulting fluid domain is capable of modeling the swirling of the preheated air, the fuel injection in this swirling flow, the mixing that occurs afterwards, and the combustion process. The effects of fuel-mixing are taken into account with this model. This is an additional feature compared to the model created by Pozarlik [
17], which used a perfectly premixed fuel gas/air flow for his analyses.
The combined experimental investigations in [
18] were focused on the effect of pressure, while keeping the air factor, air inlet temperature, and thermal power-to-pressure ratio constant. The operating point in the numerical simulation work presented here is aligned with the available data from experimental research. For the studied reference operating condition, a thermal power of 125 kW at a 1.5 bar pressure with an air factor of 1.8 (equivalence ratio 0.56) is selected. This operating point corresponds to a mass flow of 3.06 g/s of natural gas and 72.47 g/s of air. The preheated air temperature was 300 °C.
A mass flow boundary condition is used for the air and fuel inlet. Since only a quarter section of the combustor is modeled, the fluid domain has two identical faces. Here, a periodic boundary condition could be implemented, which allows for the connection of these two faces as a fluid–fluid interface. The standard non-slip and adiabatic wall boundary condition is applied on the walls of the computational domain, except for the liner wall. Due to cooling air flow on the outer side of the liner wall, the effective heat transfer needs to be taken into account. Data for this boundary condition are obtained by an additional analysis in which the cooling channel is modeled [
31]. Finally, the operational pressure (reference case 150 kPa) averaged over the whole outlet is selected as an outlet boundary condition. The contraction at the outlet (reduction to 25% of the area) results in parallel streamlines, which allow for imposing an average pressure outlet. The pressure profile can vary locally; thus, the outlet does not act as a hard pressure node.
For the accuracy of the results, the meshing of the computational domain is very important. The grid sizes should be small enough to capture the gradients of the flow field and the combustion. The Courant–Friedrichs–Lewy (CFL) number criterium has to be satisfied in order to keep the numerical dissipation of acoustic waves to a minimum. The CFL number relates the mesh size and time step for acoustics, as defined in Equation (3).
The CFL number should be below unity to ensure the stability and accuracy of the CFD calculations. However, the total element number should be under a certain limit in order to keep the computational cost at a minimum. The mesh type has also a big influence on the total element number. The unstructured type of mesh element has a better mesh adaptivity and fits better in complex geometries, while the structured type of mesh offers easy data access. The best configuration would be to use them in combination. Therefore, the fluid domain is divided into sub-sections where different mesh types can be applied. Unstructured tetrahedral meshing is used for the locations for the swirler, annular channel, and flame zone in the combustion chamber. These locations have large gradients and high levels of turbulence. Since the flow field is smooth in the plenum and the down-stream section of the combustion chamber, a structured type of mesh element can be used there. Similar to this work, Ozcan [
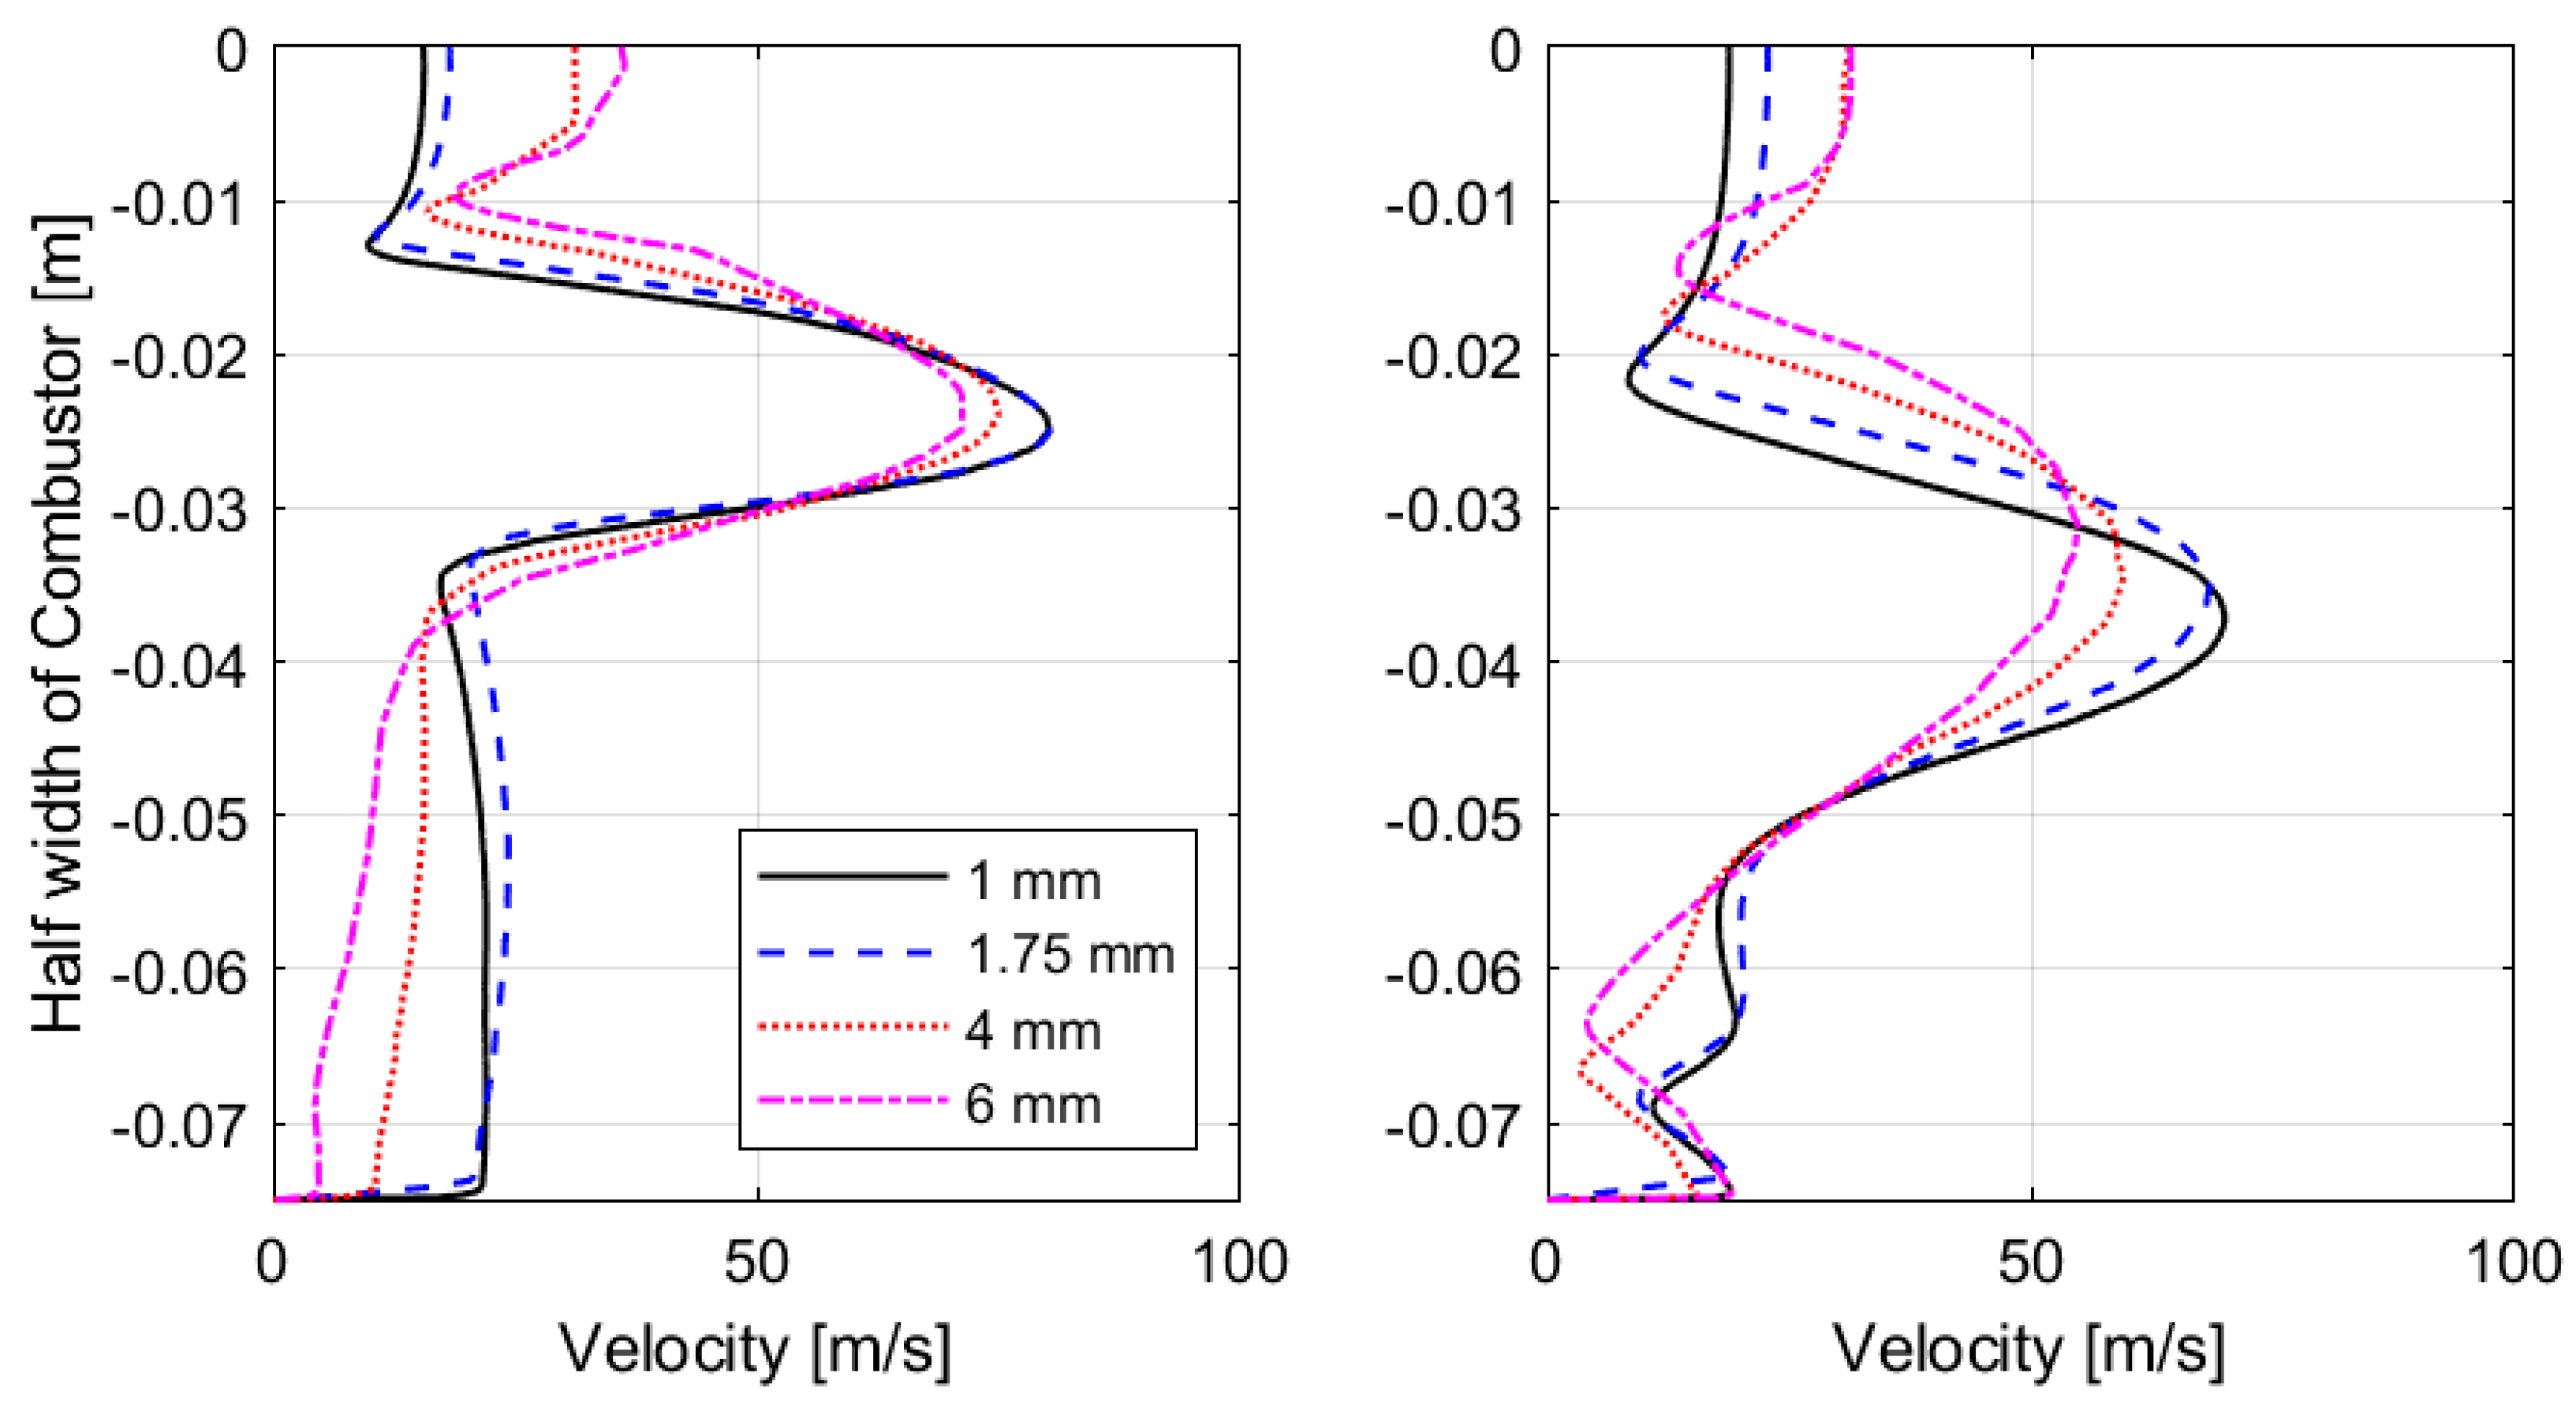
31] used only the unstructured type of element for a numerical investigation of the DESIRE combustor. The mesh chosen for that study consists of 2.17 million elements. In this investigation, the mesh sizes and types in the location of the swirler, annular channel, and flame zone were kept similar to those in Ozcan’s work, and a structured mesh type is used in the other sections. The total number of elements decreased to 1.35 million with this adjustment.
There are several combustion models available in ANSYS CFX. All models assume that the combustion process is in the flamelet regime. This is most like the case for methane/air flames. Two different combustion models were evaluated to verify this in earlier studies. These are the Eddy Dissipation and Finite Rate Chemistry model (ED-FRC) and the Burning Velocity Model (BVM). The ED-FRC model shows some incapability in correctly modeling the mixing and the chemistry of highly swirling and reacting flow. This model overpredicted the adiabatic flame temperature. The BVM model provided a better prediction of the adiabatic flame temperature, with a correct flame temperature distribution [
31]. Therefore, the BVM model was selected as the combustion model in this investigation. The flamelet library for natural gas–air combustion at a 1.5 bar pressure is generated with CFX-RIF.
The same solver preferences are used for all numerical simulations. Thermal energy is selected to model the heat transfer. The turbulence model selected was SST for the steady state calculations and SST-SAS for the transient calculations. The turbulence was initially calculated with a high-resolution scheme. The advection scheme had to be set, however, to first-order upwind, because the high-resolution settings did not provide a converged solution. This is also pointed out in different studies [
6,
17]. An error value of 1E-5 and below is accepted for the convergence. The background of the CFD modeling is described in
Appendix B.
4. CFD-Based Prediction of Combustion Noise
In order to predict the response of the flame to acoustic forcing at the burner inlet in the combustion chamber, transient calculations are performed. There are several parameters that can have significant influence on the results of transient calculations. These are the total simulation time, the time step, the data sampling frequency, and the initial conditions. The total simulation time should be chosen to be as large as possible to capture thermoacoustic stability or instabilities, which require some time to develop. The time step size determines the CFL number, which should be below unity in order to predict the transient combustion field accurately. The time step size is selected as 5 × 10⁻⁶ s to satisfy the CFL number criterium. The sampling frequency is set to 2000 Hz; thus, the response of signals can be observed up to 1000 Hz. In that way, our frequency range of interest, 100–800 Hz, is covered. The initial conditions address the properties of the flow field at time zero. To decrease the computational effort, the steady state solution is used to initialize the transient calculations.
The flame inside the combustor behaves as an acoustic sound source, which excites the eigenmodes of the combustor. When a system develops an instability, this happens usually around the first or second eigenmode of the combustor, since these modes have the lowest damping rate. Therefore, it is important to estimate the acoustic eigenfrequencies of the system prior to the numerical simulation. When it is assumed that a standing wave is excited in the combustion chamber at a constant temperature and closed–closed end acoustic boundary conditions, the eigenfrequencies are estimated to be given by:
where
n is the mode number,
c is the speed of sound, and
L is the length of the combustor. The speed of sound is estimated at 720 m/s from the measured mean temperature in this test rig [
32]. The predicted and measured thermoacoustic behavior of the combustor will be compared for the data of the pressure transducer located at 0.742 m downstream of the burner mouth.
Numerical simulations are now performed for the combustor in non-forced flow with the following reference operating condition: thermal power of 125 kW at a 1.5 bar pressure with an air factor of 1.8 (equivalence ratio 0.56). The preheated air temperature was 300 °C. The simulated time signal of pressure is shown in
Figure 7. It can be seen from
Figure 7 that the numerical simulation shows that the system is in stable condition. Thermoacoustic instabilities occur when the acoustic losses in the system are smaller than the gain, and this results in an exponential growth in pressure amplitudes. This is not seen in this simulation. The amplitude of the pressure data is fluctuating with time but not increasing. Amplitude saturation due to nonlinear effects is not observed, and, hence, it is not a limit cycle. There is, however, some strong acoustic activity focused at one frequency, which can be seen in the frequency spectrum displayed in
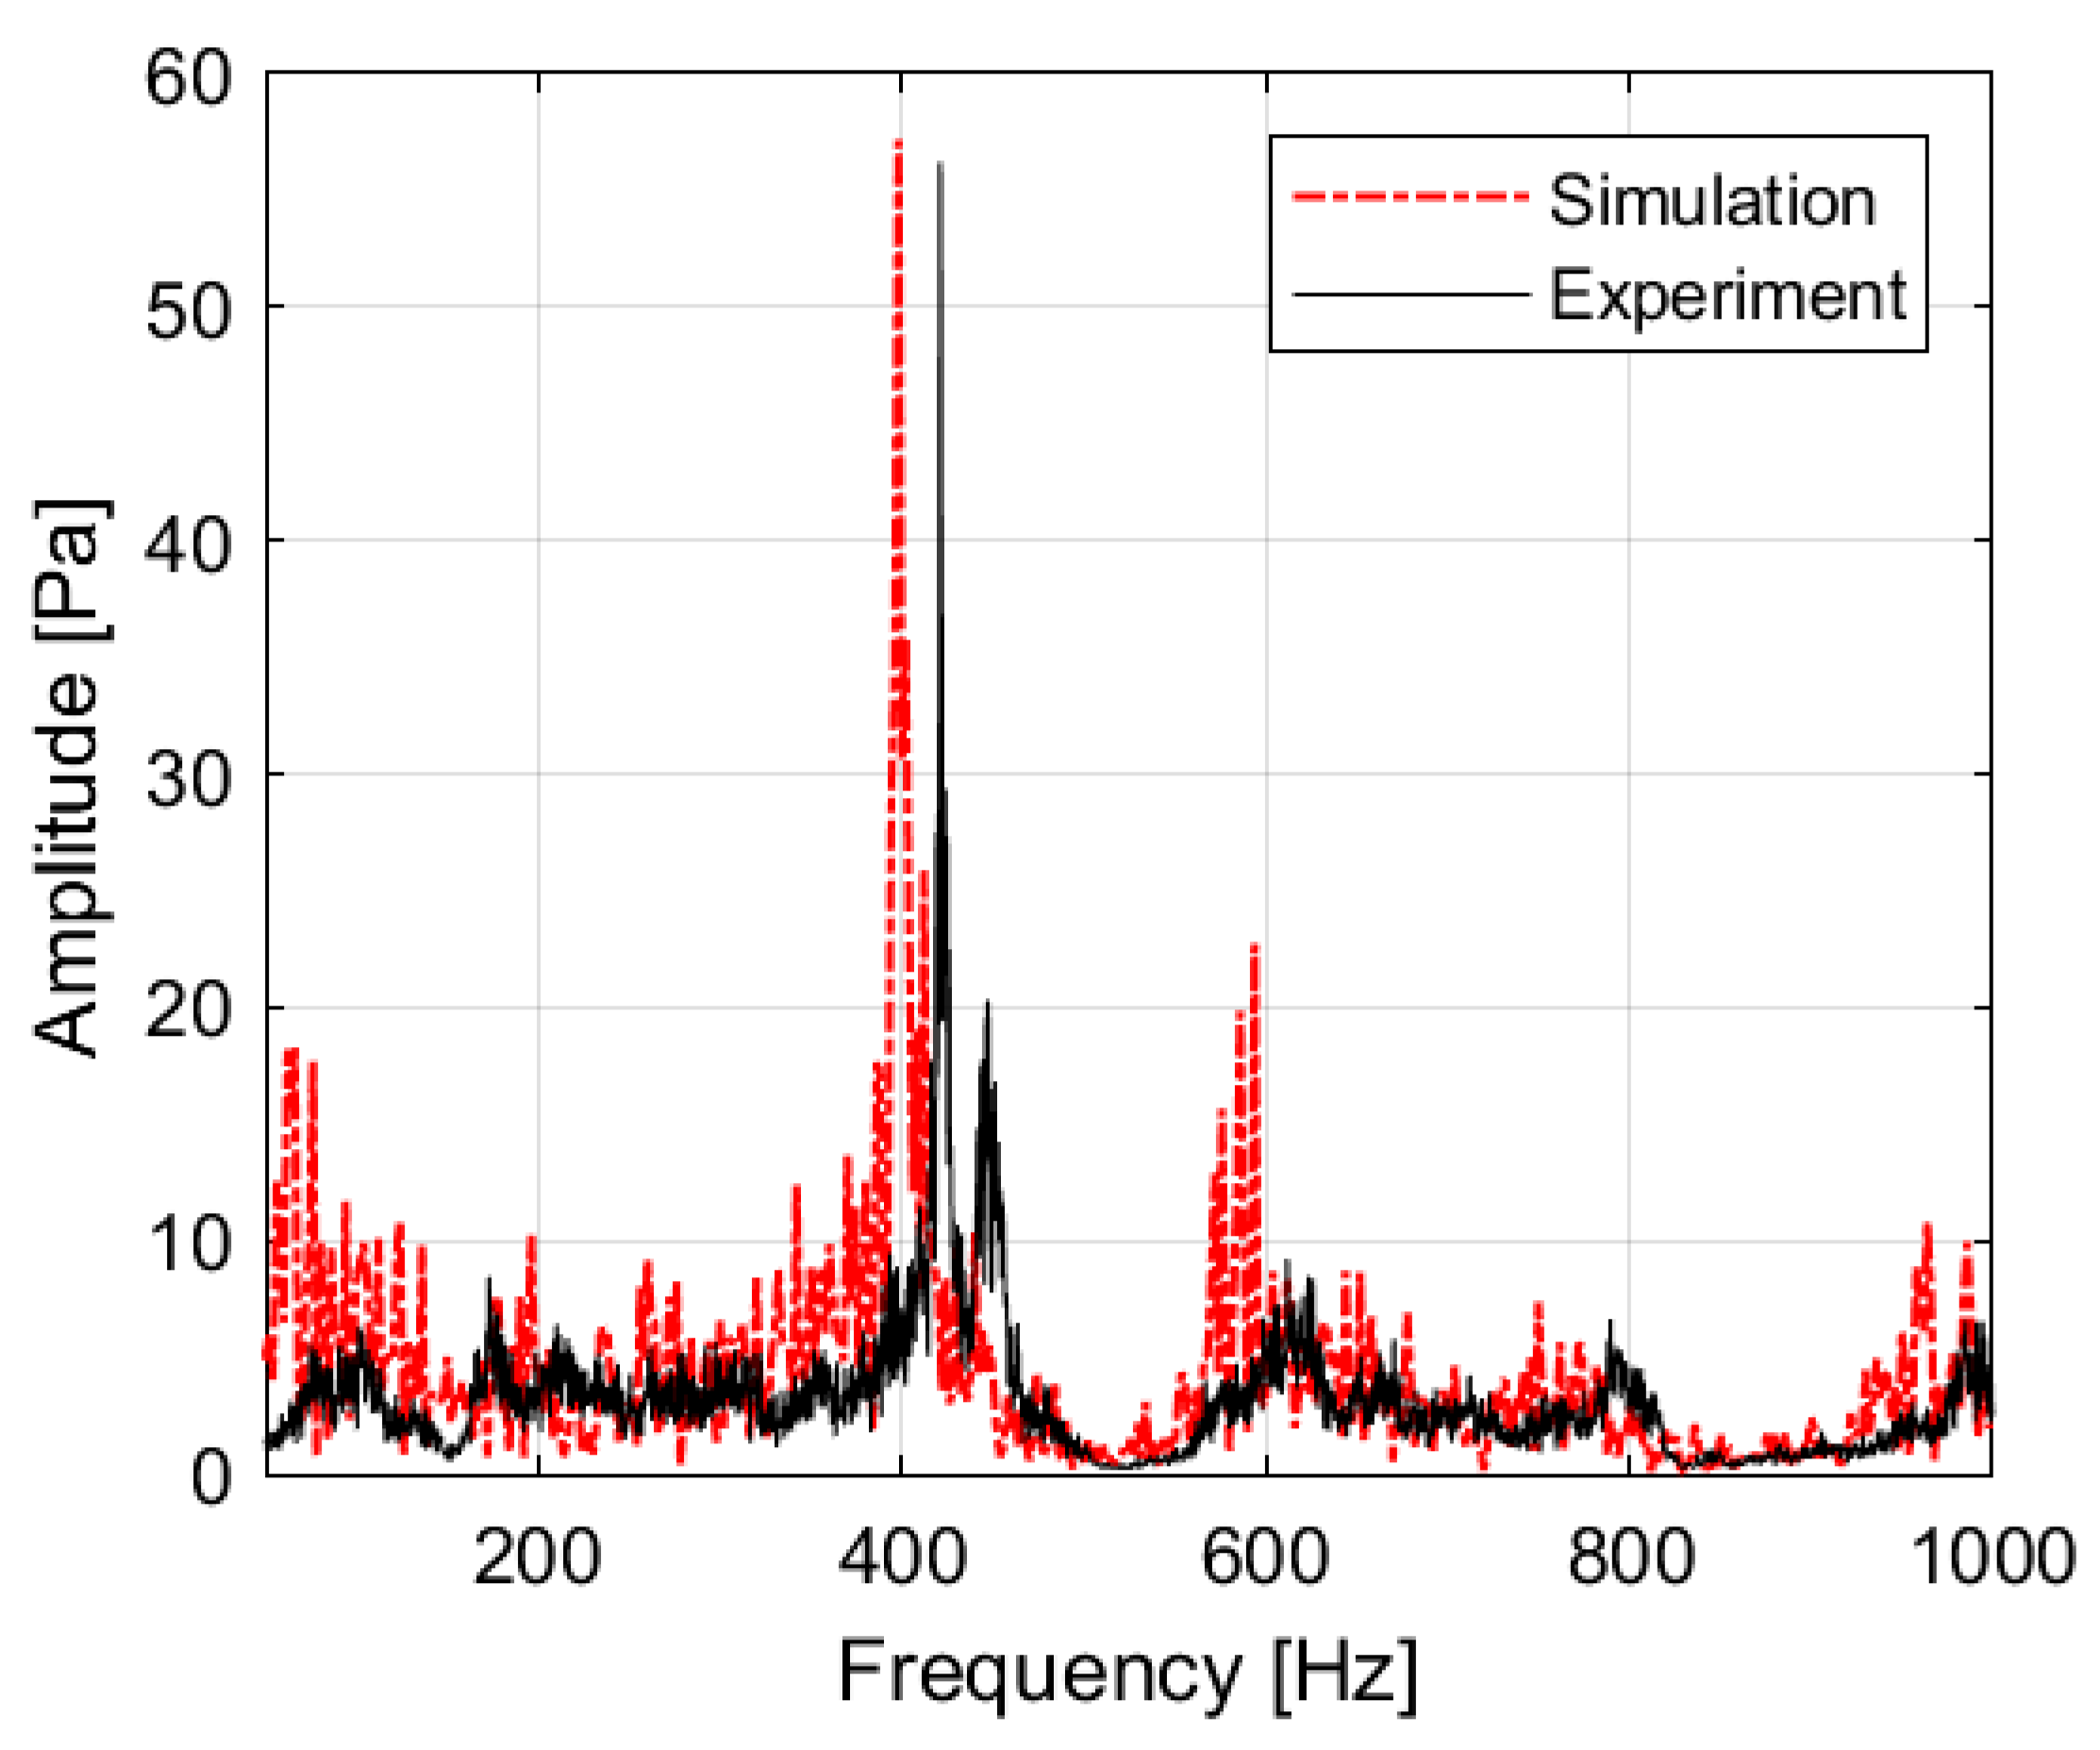
Figure 8.
Figure 8 compares the measured and predicted pressure amplitude spectra in the frequency domain. The measured spectra are presented in detail in [
18]. The black curve represents the measured pressure amplitude spectra [
18], and the red curve with a dash-dotted line represents the numerically predicted pressure amplitude spectra. The first four acoustic modes in the combustion chamber are visible in this figure. The experimental result shows that the system is sensitive to oscillations—in particular, at 420 Hz. These flame dynamics are near the second acoustic mode of the system. The numerical investigations predict a similar behavior at 398 Hz, with a deviation of 5% in the frequency.
The frequencies of the other peaks are also predicted in a similar error range. The well-known Acoustic Network Model can also be used to calculate the system’s eigenfrequencies. Detailed modeling of the network model representation of the combustor is presented in
Appendix A. For the ANM result in
Table 2, the experimentally obtained FTF is used with its rational transfer function fit [
18]. A comparison of the eigenfrequencies that were measured, estimated from acoustic theory, ANM-predicted, and spectra-computed with CFD is presented in
Table 2. It can be observed in
Table 2 that all of the predictive methods show a fair comparison of the predicted (rows 2–4) and measured (row 1) values for the first four eigenfrequencies of the acoustic system. The Acoustic Network Model shows the most accurate results.
5. Linear Behavior: The Flame Transfer Function
The previous section has shown that, with the ANM, the eigenfrequencies of the instability of the acoustic system can be computed with high accuracy. The accuracy for the frequencies with CFD on the basis of operation in stable, not forced, combustion is slightly worse, but this can take into account the onset of instability. As a next step, predicting the stability of the system for these eigenfrequencies will be explored, using the combination of the ANM for the acoustic properties and the CFD for the combustion dynamics. This is because a change in the design or operation may lead to a switch to instability. To this end, the ANM method will be applied, and as an input, this needs the Flame Transfer Function as an active component. The FTF is now determined by means of transient numerical calculations with acoustic forcing. The FTF is calculated for the reference operating point in a numerical experiment. A sinusoidal excitation is applied to the mass flow of the fuel at several frequencies simultaneously. Previously, it was explored and confirmed that single- and multi-excitation lead to identical results. Therefore, to decrease the computational cost, the multi-excitation case is applied for the FTF calculations. The excitation frequencies are chosen carefully. The system is not excited at one of the eigenfrequencies to prevent self-excitation, and, additionally, excitation at doubling frequencies is avoided. This is to minimize the always present effect of the nonlinearity of combustion dynamics. The applied frequencies per simulation are summarized in
Table 3. In the experimental test, the siren unit provides approximately 7.5% of the excitation amplitude level. Therefore, 7.5% of the fuel mass flow excitation is applied in the first series of FTF calculations. This excitation amplitude is expected to be sufficiently small to provide a response in the linear regime. In the calculation, the mass flow inlet of the fuel is forced, as shown in Equation (5).
where
with the overbar is the mean mass flow of the fuel,
is the excitation level,
is the frequency, and
is the time step.
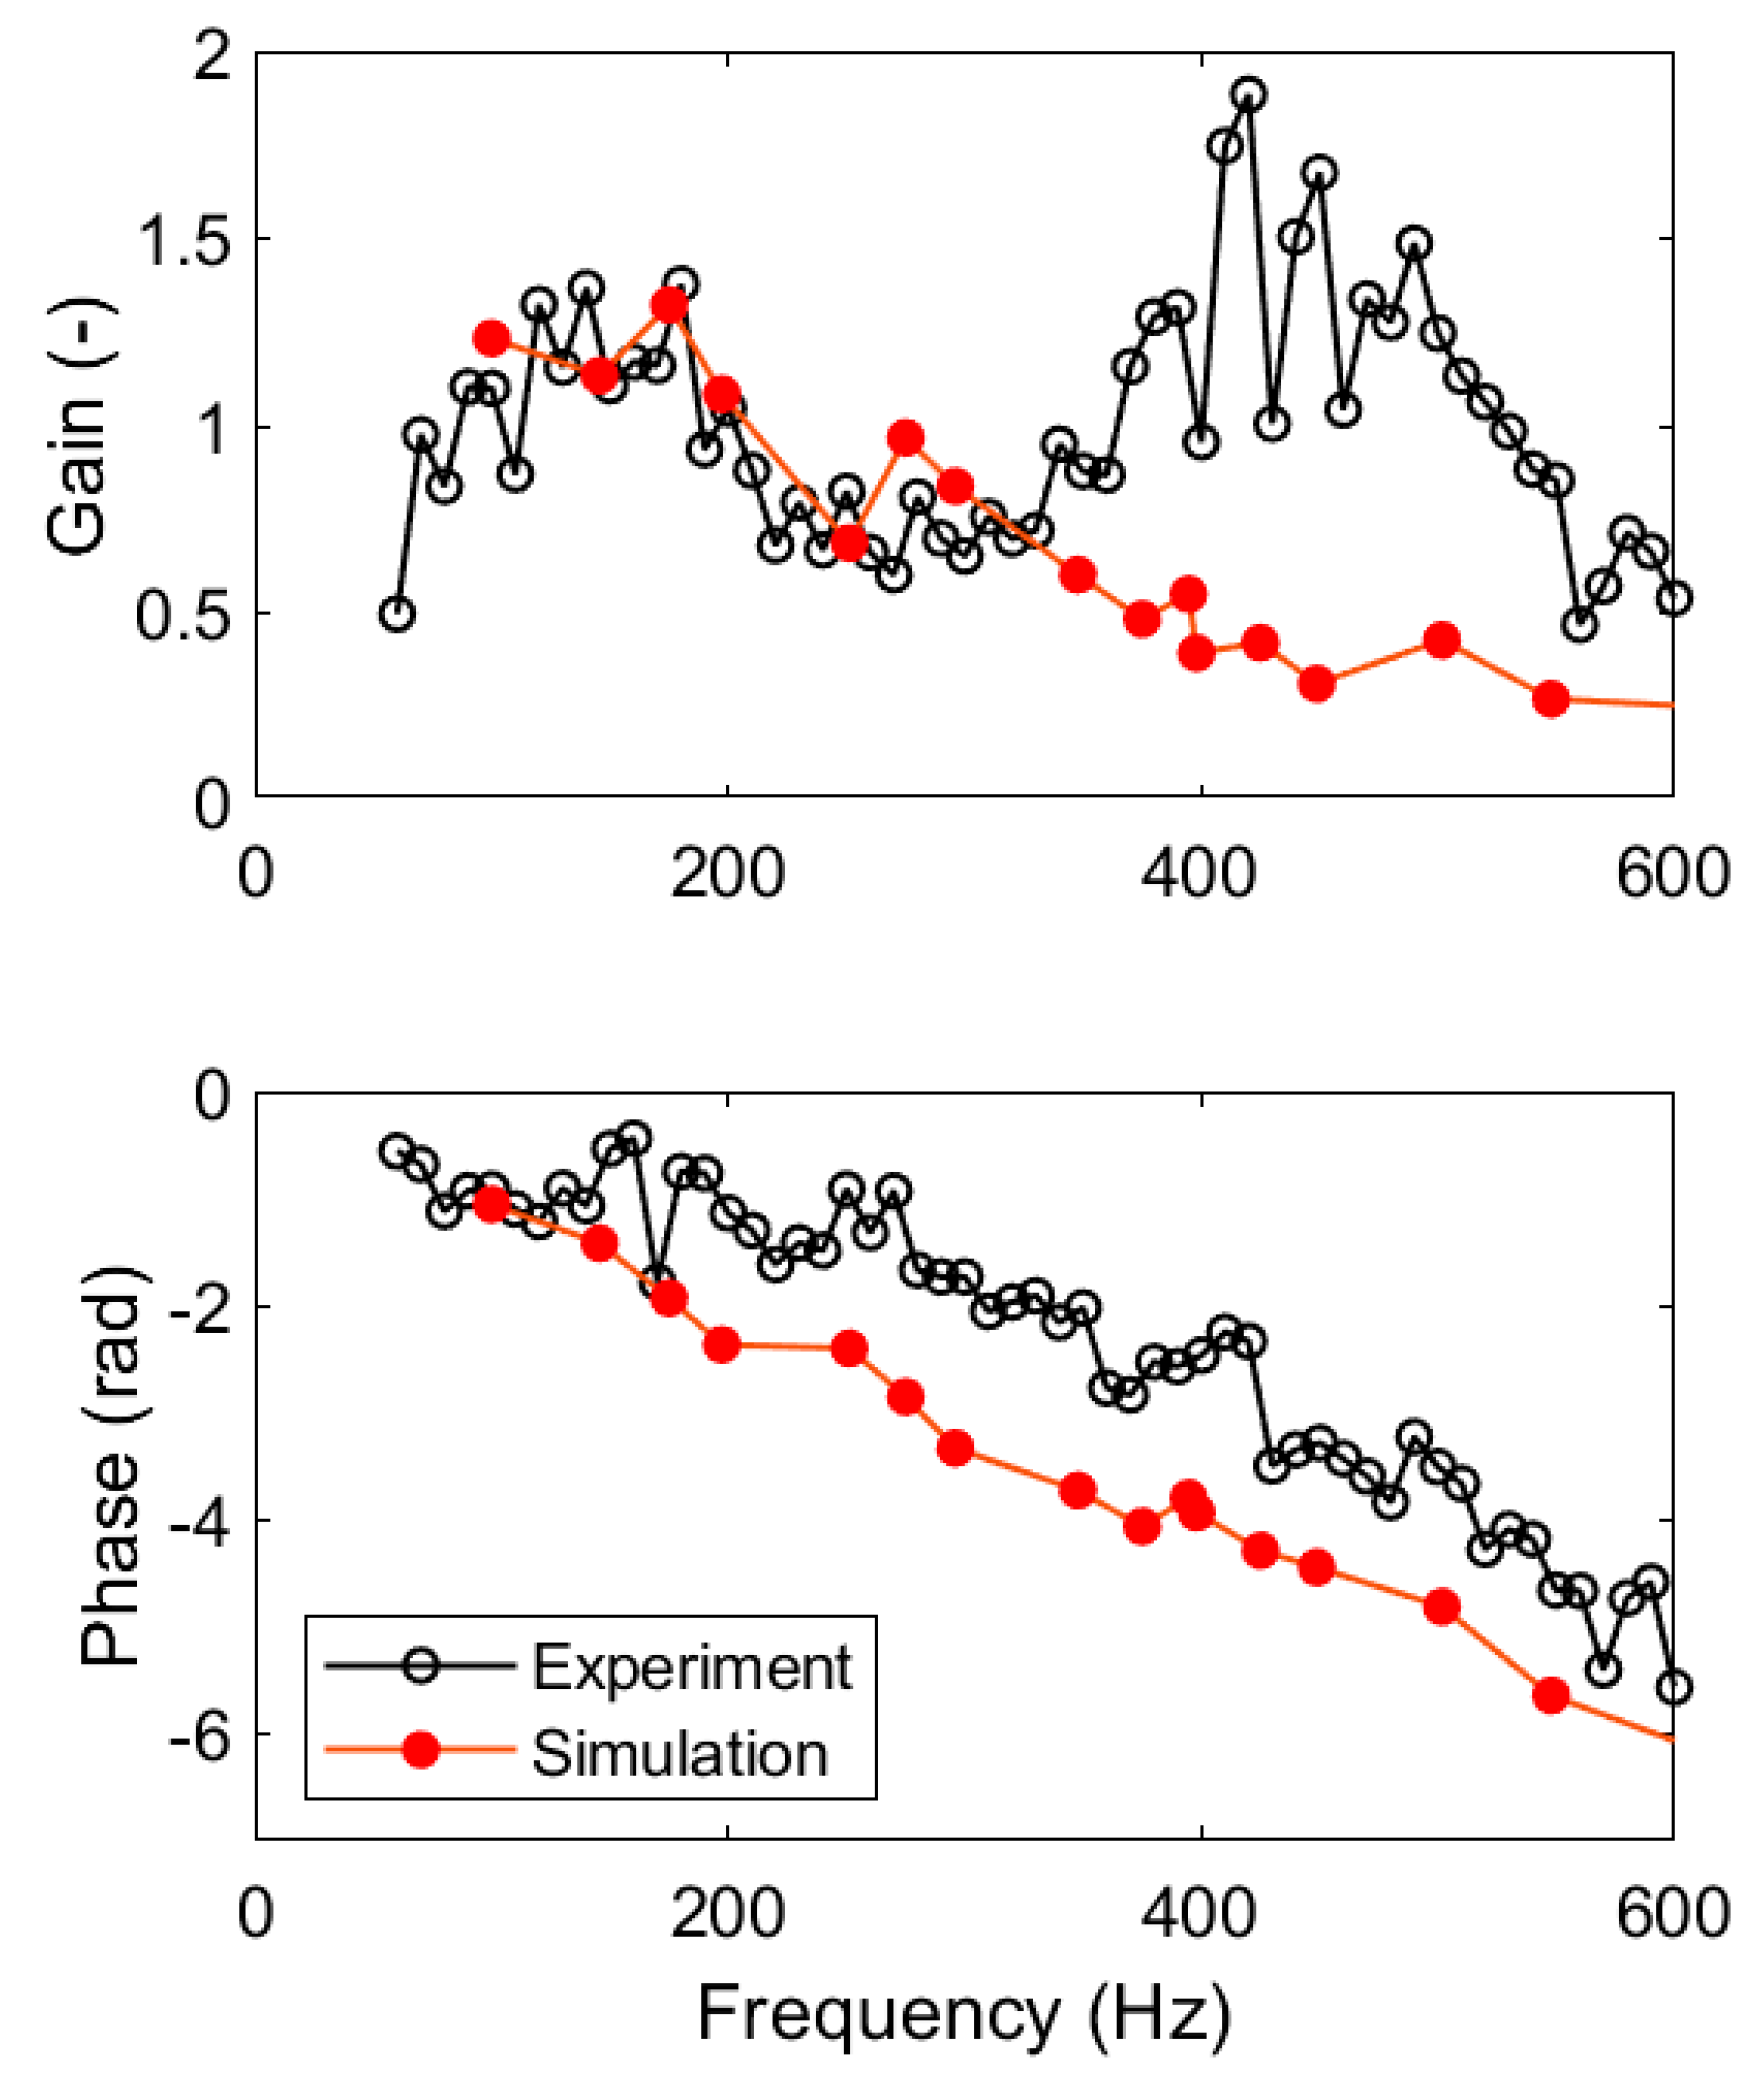
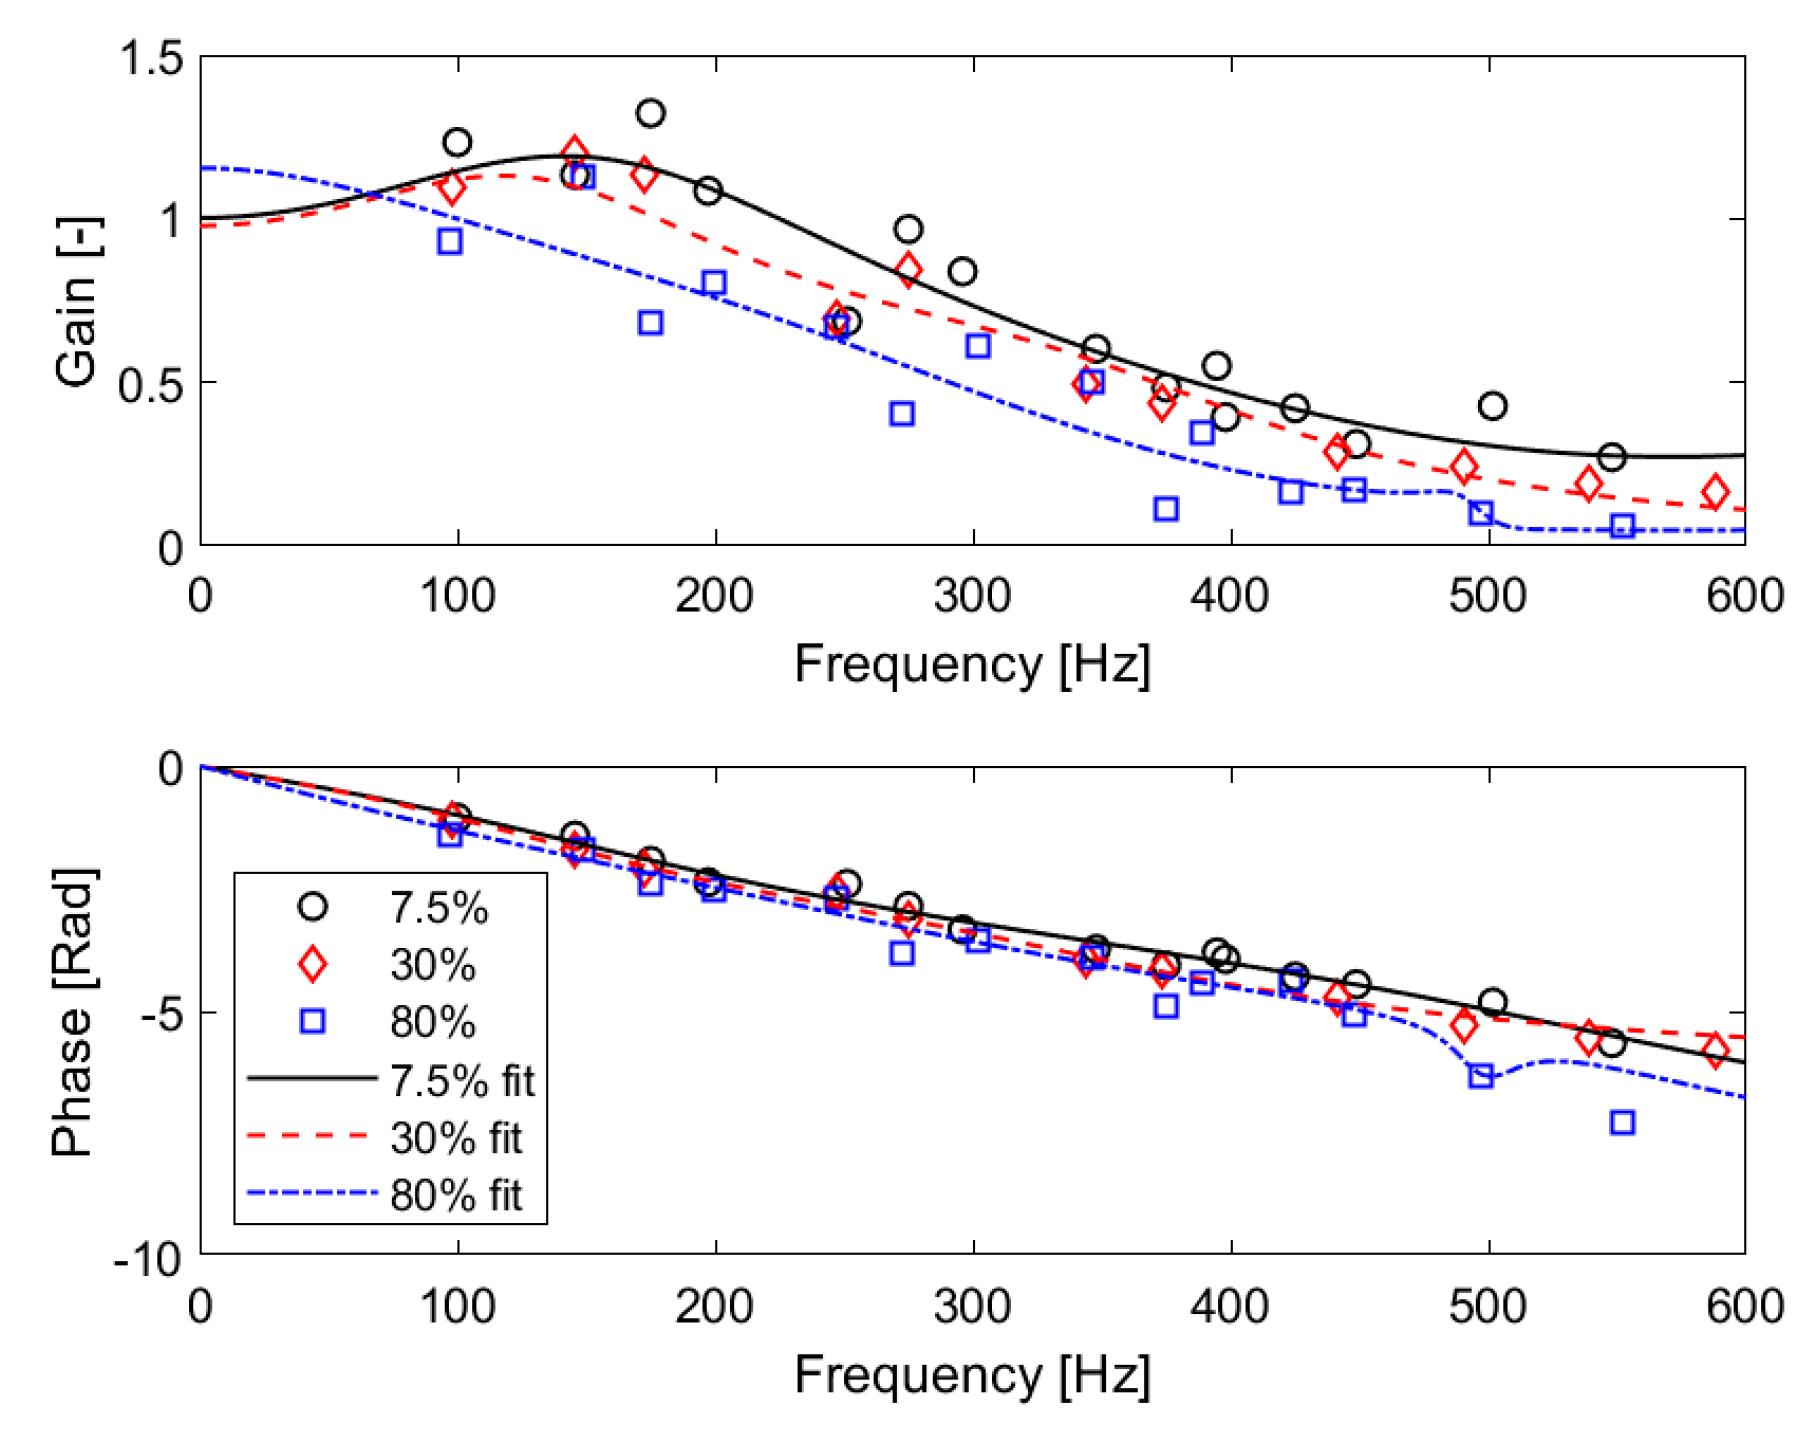
The FTF obtained in this way by means of the numerical experiment is presented in
Figure 9 together with the measured FTF. The diagram shows the amplitude and the phase of the FTF. In the figure, the black circles represent the measured FTF (taken from [
33]) and the red circles represent the numerically predicted FTF. The phase diagram is discussed first, as the phase behavior is fairly predictable and does not show any surprises.
Figure 9 shows that the phase of the FTF is predicted to vary linearly with frequency. Hence, there is a constant time delay between the rate of combustion fluctuations and the flow at the location of fuel flow forcing. The time delay is found to be 1.55 ms. This result slightly deviates from the measured phase behavior. The measured phase delay is also linearly varying with frequency but at a slightly lower time delay constant of 1.31 ms. This may be caused by the fact that the measured mass flow fluctuations at the fuel injection point can be measured indirectly only. They are established by means of fuel line pressure signals that were calibrated towards mass flow fluctuations at the injection point. The uncertainty in this process is small but hard to quantify and may lead to the observed difference between the measurement and prediction.
Next, the predicted FTF amplitude as a function of the forcing frequency will be discussed.
Figure 9 shows that a typical low-pass behavior is predicted. The gain is higher than unity up to a frequency of 200 Hz. At higher frequencies, the gain is predicted to decrease to values well lower than unity. When compared to the measured data in [
18] that are used for validation, there is a good comparison, and low-pass behavior is observed for frequencies in the range of 50–350 Hz, with the switching points in the low pass both at 200 Hz. For frequencies in the range of 350–550 Hz, the measured data do not confirm the predicted decrease in gain, however. Above 550 Hz, the decrease in gain with the frequency is matching again for the prediction and measurements. As this paper is about the numerical predictions, an explanation is given in reference [
18] presenting the measurement data. In short, the explanation is probably the strong self-excitation of the combustion dynamics in the range of 350–550 Hz, which leads to pressure amplitudes on top of the response due to the forcing. This leads to inaccuracies in the experiment-based FTF which are not present in the CFD-based FTF, as the CFD acoustics are not present. What needs to be explored in the future is this probably positive effect of using weakly compressible solvers for the estimation of the FTF. The low-pass behavior is also observed in the work of Van Kampen, where the maximum investigated frequency was 400 Hz, however [
6,
34].
In order to establish the accuracy of our applied numerical method as compared to similar work presented in the literature, a comparison is made with the work of Krediet et al. [
30,
35]. They did not investigate a pressurized combustor but rather an atmospheric one. The flame was, however, swirl-stabilized like the flame in this paper. Their setup consists of an adjustable upstream duct, swirler type burner, and combustion chamber. The setup had four loudspeakers mounted in the upstream duct to provide acoustic forcing. OH* chemiluminescence measurement was used for the heat release rate of the flame, and the acoustic field was determined by the microphones in the upstream duct using a multi-microphone method. The parameters of the operation point where the FTF was measured were: a swirl number of 1.2, air mass flow of 0.0417 kg/s, preheated air temperature of 220 °C, and equivalence ratio of 0.65. Krediet investigated, by numerical simulation, the Flame Deriving Function for an atmospheric swirl flame, for which the experimental data were available [
36], using Large Eddy Simulations. Here, we will qualitatively compare the measured behaviors of the different but similar swirled flames to see the trends and the success of Krediet’s simulation as compared to the approach in this paper. For our comparison of the results in the linear regime, only the excitation amplitude
of 0.1 is selected in the work of Krediet.
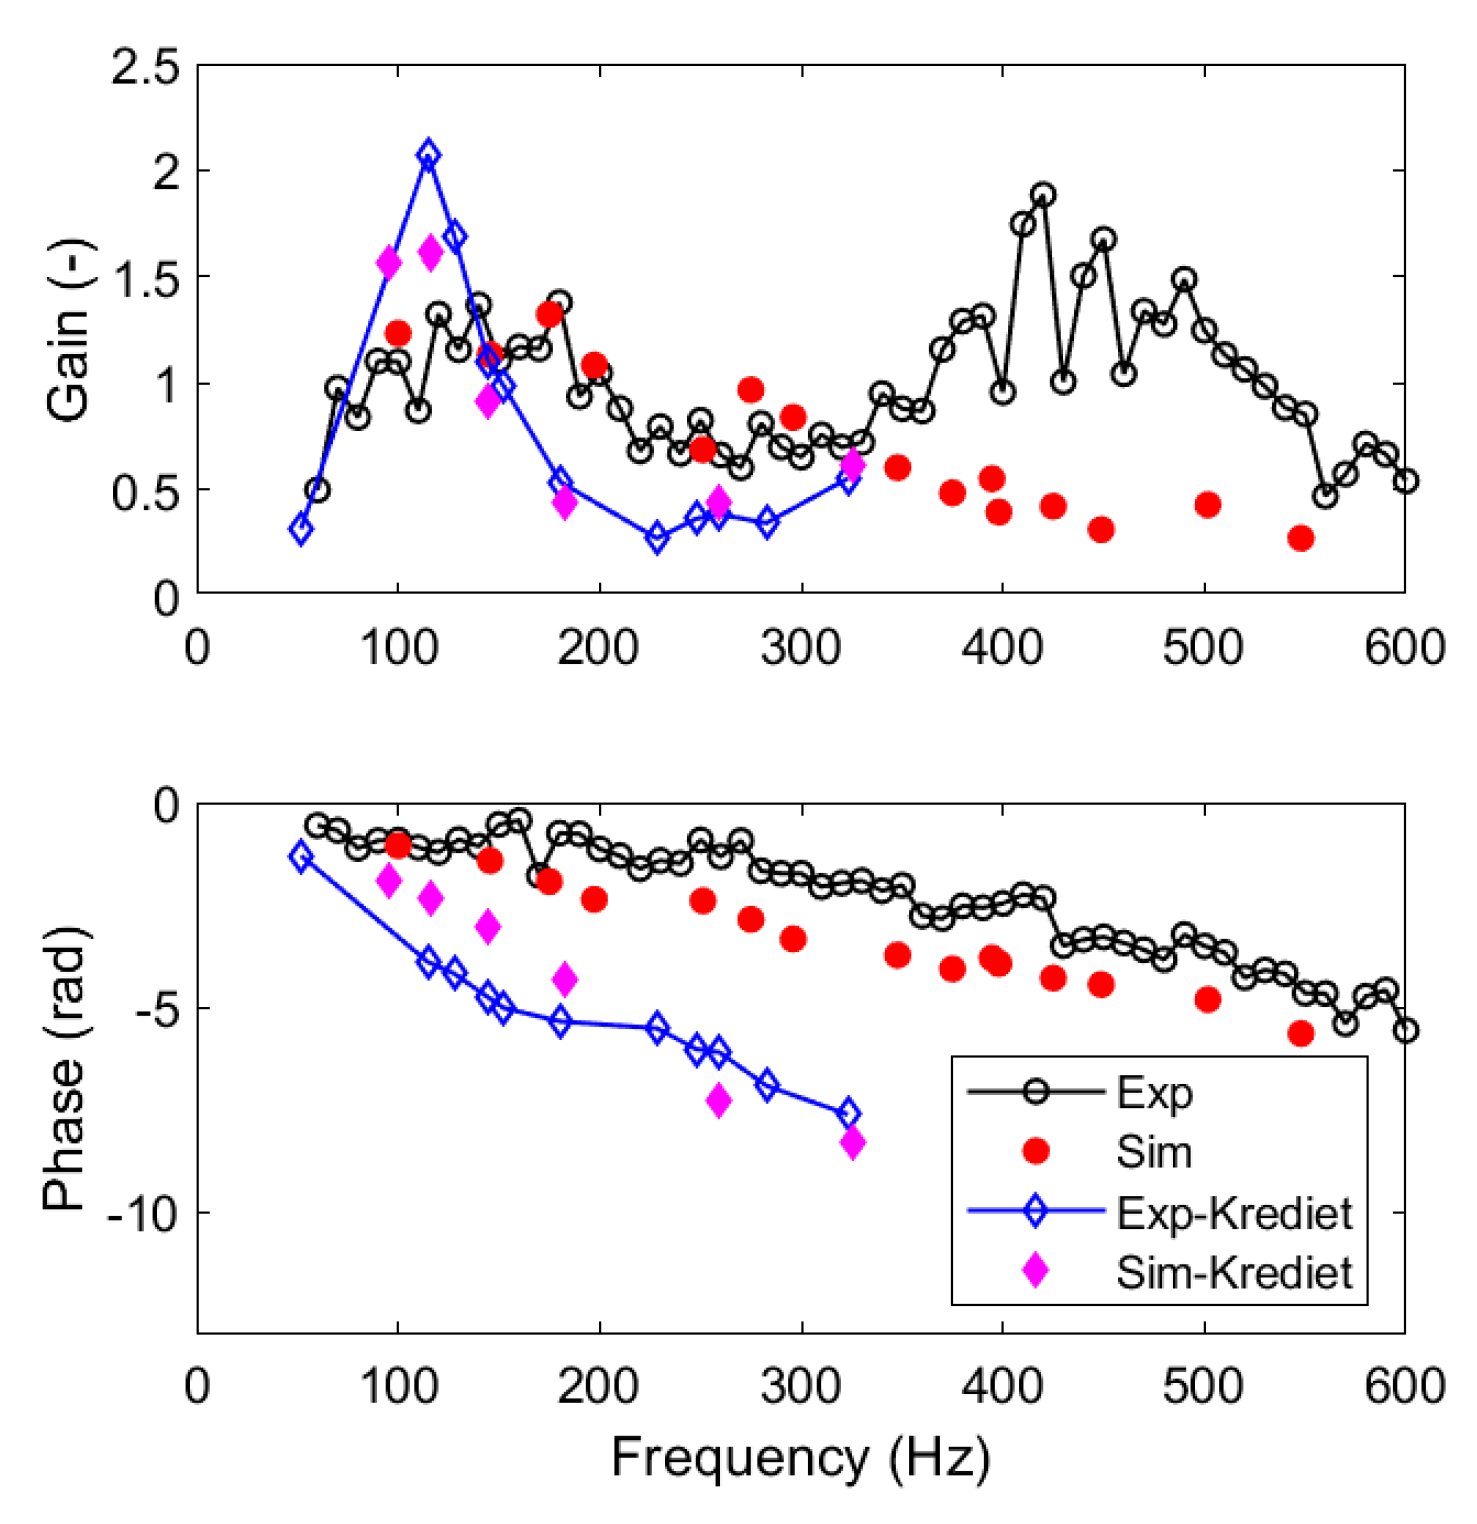
Figure 10 shows the comparison of the two methods and measurements. In the figure, the markers with a line represent the measured data of each case, and the solid markers are the simulation results. In our case, the measured and the simulation data are available until 600 Hz (line with a circle and solid line), while in Krediet’s paper, the data are limited to 350 Hz (blue diamonds and a solid line).
If we compare the gain of the FTF of both flames, they share the low-pass behavior measured and predicted in the frequency range up to 350 Hz. Above that frequency, unfortunately, data are lacking from Krediet. The match of the numerical prediction of the gain as compared to the measured data is similar in our approach as compared to the approach of Krediet. The data of Krediet show a phase of the FTF linearly changing with the frequency, which is similar to our data, but at a larger, different time delay constant. This constant will depend on combustor sizes and reactant gas flow rates. Probably, our combustor will be more compact and have higher mass flow rates. The most important conclusion to be drawn is that the accuracy reached by Krediet is similar to the accuracy achieved in the method presented here. Hence, despite the elevated pressure in our case and the atmospheric case of Krediet, the accuracy and behavior are comparable.
7. Acoustic Stability Analysis
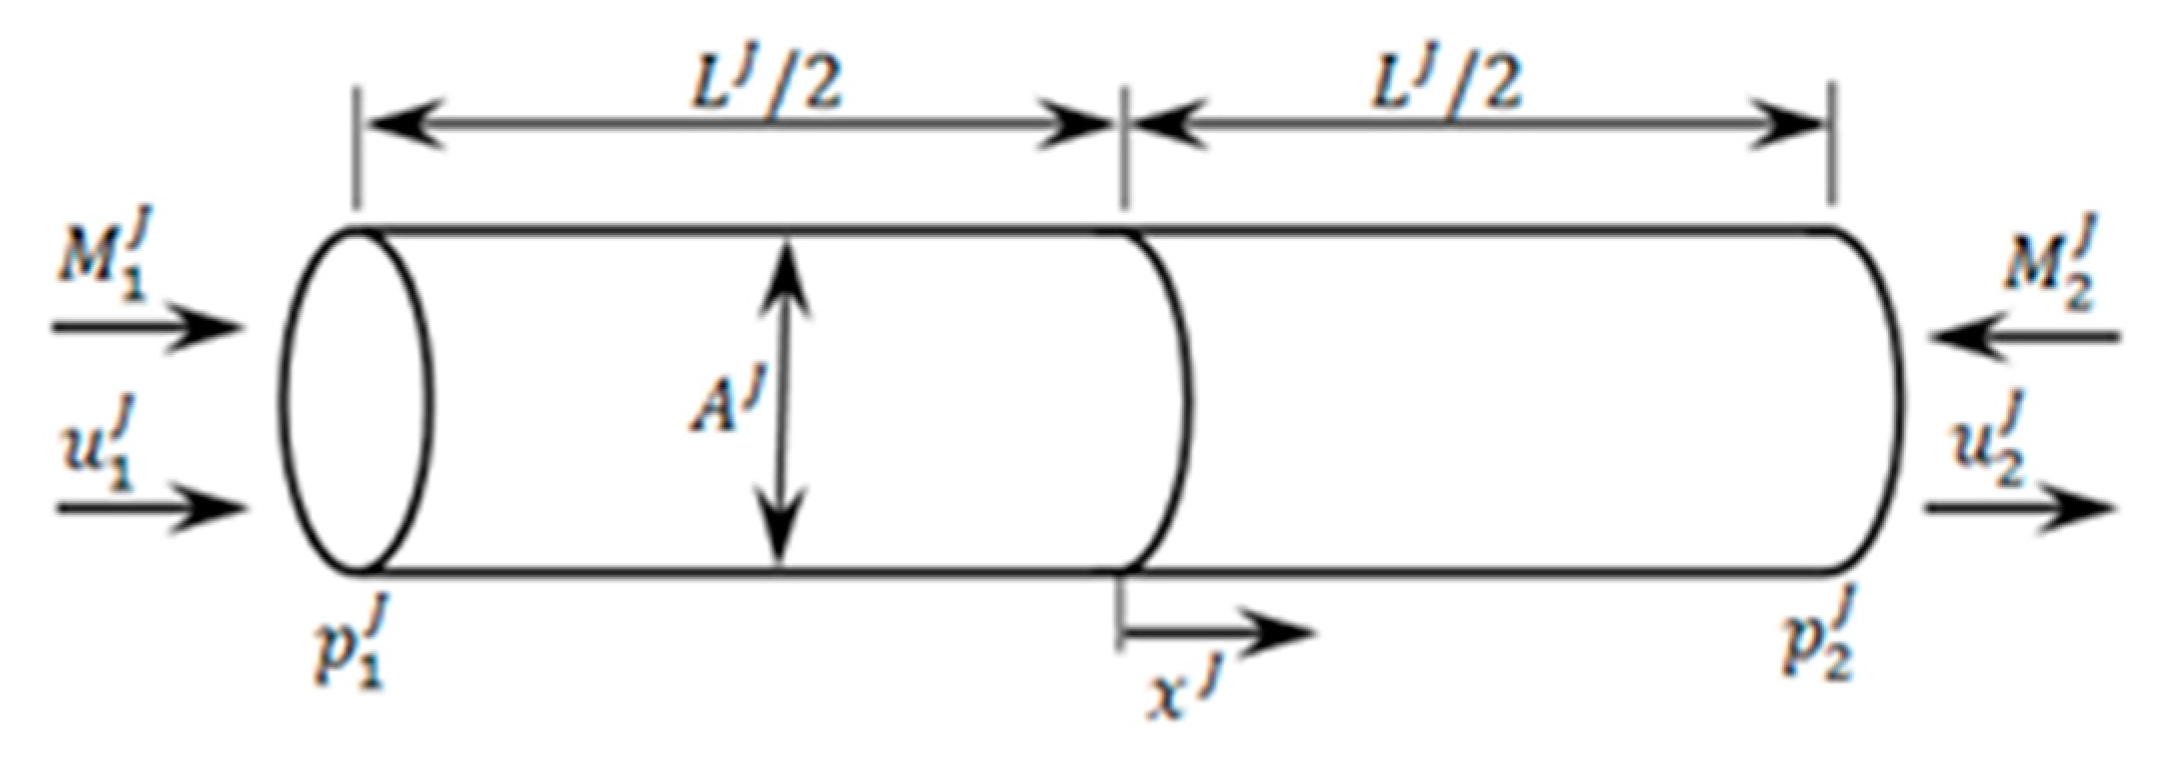
The FTF can be implemented into the ANM to conduct a marginal stability analysis. Whether the system will be stable or unstable can be predicted by looking at the complex eigenfrequencies for which the determinant of the system matrix is 0. The system matrix
A is a function of the frequency ω. When no time delays are present in the system, the determinant of
A will vanish for the real eigenfrequencies of the system. When time delays are present in the system, the determinant of
A will vanish for the complex eigenfrequencies, which can be written as
ω =
ωr +
iωi. The pressure signal can be assumed to have a time dependency proportional to
eiωt. In that way, the virtual component
ωi of the frequency will act as a damping factor when positive. In case
ωi is negative, the oscillation will grow exponentially with time until nonlinear effects appear. The frequency of the oscillation is given by
ωr. A growth rate GR can be defined as the ratio of the pulsation amplitude of two successive pulsation cycles:
When the GR is positive (negative virtual component ωi), fluctuations will be amplified in time. They will be damped for a negative GR (positive virtual component ωi).
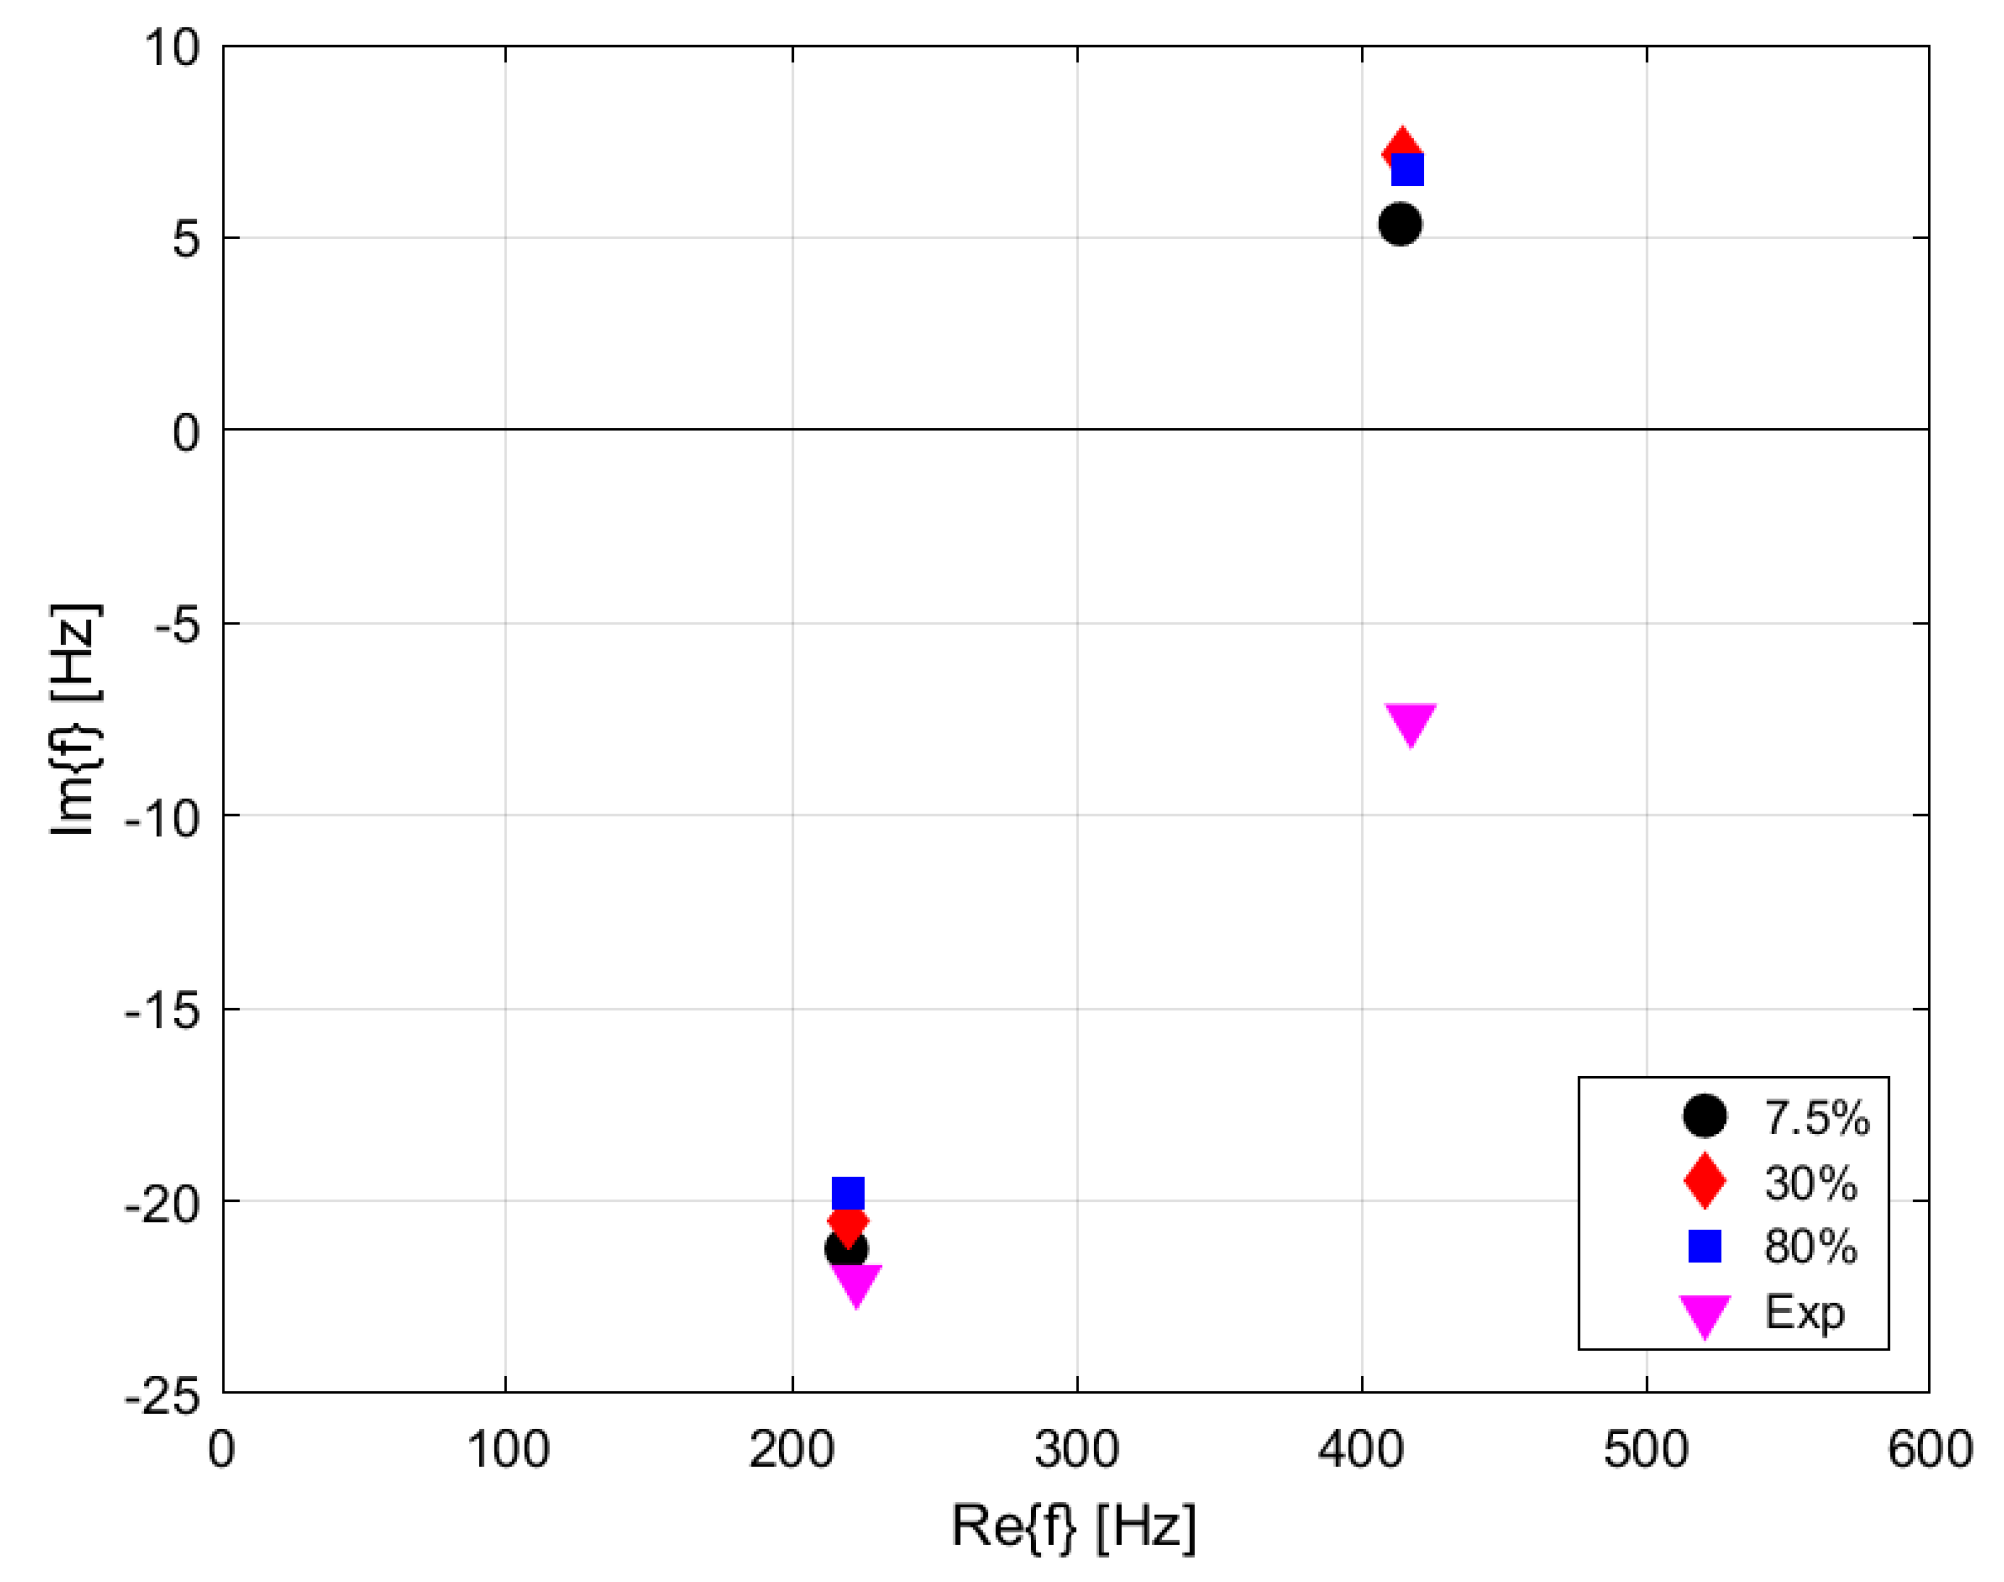
Figure 12 shows the results for the complex eigenfrequencies of the stability analysis of the combustor. Here, Flame Deriving Functions were used as an input with three different forcing amplitudes. The circle points represent the linear situation with a 7.5% forcing amplitude, the diamond points represent 30% forcing and the square points represent 80% forcing. The triangle data are based on a best analytical fit of the lowest amplitude measured transfer function, as proposed in [
33]. The acoustic system will behave linearly, but the effect of nonlinearity enters through the nonlinearity of the FDF at high amplitudes. The results read from
Figure 12 for the real and virtual eigenfrequency components and the growth rate GR are presented in
Table 4. The ANM predicts mode 1 for both the CFD-based FTF and experiment-based FTF to have an eigenfrequency at 212 Hz with a negative virtual component of 22. The predictions of all forcing amplitudes and the best fit all coincide, indicating that effects of nonlinearity are small. The GR is equal to 0.87. Hence, on basis of the negative virtual frequency component and the positive GR computed with the ANM, the system should be unstable at this frequency. Despite this prediction,
Figure 8 shows a negligible acoustic activity at 212 Hz. This is a disappointing result, as it is based on the Flame Transfer Functions of both CFD predictions and experimental data from [
18]. Hence, the cause of the discrepancy is expected not to be the FTF but the use of improper end conditions for the Acoustic Network Model. Probably, the acoustic hard end assumption for the combustor exit is not correct for low frequencies. This is discussed by E. J. Brambley and is the subject of current research for combustor applications [
41].
For mode 2, the ANM based on the CFD-based FTF predicts an eigenfrequency of 420 Hz with a virtual frequency component value of 7. The GR is computed to be small but negative (−0.09). Hence, the system is predicted to be stable but close to marginal stability. This is confirmed by the considerable acoustic activity observed in
Figure 8 at the second eigenfrequency. This mode does not have amplitude growth rates that lead to a limit cycle oscillation, but it seems to be very close to the marginal stability border. The results here are quite sensitive to perturbations, as there is a difference between the stability calculations based on either measured or predicted FTF’s. This sensitivity is also confirmed by the experiments in
Figure 8. The setup is very sensitive around 420 Hz, which shows a distinct peak, but the amplitudes are still modest.
Figure 12 shows somewhat inconclusive results for stability at 420 Hz. The prediction of the ANM with the input of the numerically determined FDF indicates a stable mode, while the results with the measurement-based FTF indicate an unstable mode; in both cases, it is close to the stability border. Apparently, the system is very sensitive to the implemented parameters of the ANM and the FTF.
8. Conclusions
A transient Computational Fluid Dynamic analysis has been carried out on a high-pressure premixed Natural Gas/Preheated-Air combustor using the BVM combustion model. It was assumed that the flame is in the flamelet regime in view of the adiabatic flame temperature of 1700 K. The target was to determine the linear and nonlinear Flame Transfer Function by means of forcing of the fuel flow. This was carried out at multiple frequencies to save computational time and in such a way that the interference of forcing was avoided. The predicted change in the phase of the FTF as a function of frequency is predicted to be linearly proportional with the frequency, and the time delay constant compares well with the measurement data. The predicted gain of the FTF as a function of frequency is above unity at low frequencies and decays with increasing frequency. The comparison with the measured gain is good up to about 400 Hz. Here, the CFD method for determining the FTF reveals a smooth decrease well below unity for the FTF gain. This is a deviation of the measured data, where, above 400 Hz, the gain is increasing above unity. Increasing the forcing level in the CFD simulation leads to a decrease in the amplitude of the FTF, confirming the path to amplitude saturation due to nonlinearity. The measured and CFD-based FTF results have been implemented into an Acoustic Network Model. An important assumption in the ANM was a hard acoustic boundary condition at the combustor exit. In an instability search, two eigenfrequencies were found below 600 Hz, which were identical for both FTFs. At the lowest eigenfrequency of 212 Hz, the result on the basis of both the CFD-based and experiment-based FTF coincided and predicted an unstable point with a positive growth rate. In the test rig, this instability was not observed, however, indicating that while, at high frequencies, the reflection coefficient approaches unity, this is not the case for lower frequencies. At the next predicted eigen frequency at 420 Hz, the CFD-based FTF leads to a correctly predicted, small, negative growth rate, whereas the measured data-based FTF leads to a small, positive growth rate and an unstable system. In the test rig operation, this instability was not observed, however. This indicates the correctly computed low gain by the CFD-based FTF.
In summary, the three major conclusions are that the CFD-based FTF has a correct time delay constant, backed by the measured data, and a correct gain, backed at a low frequency by the measured data. The difference in gain at high frequencies is observed to be due to an error in the measured FTF gain. In the Acoustic Network Model, the assumption of a hard acoustic boundary condition at the combustor exit may be correct at high frequencies, but this is an error at low frequencies. Potential work on improved validation of the CFD-computed FTF is the measurement of the FTF with the burner mounted in a combustor with, at all frequencies, a low reflection coefficient at the exit. This should avoid the erroneously observed high gain of the FTF. In case the thermoacoustic stability of a combustor is investigated, the assumption of a hard acoustic boundary condition at the exit should be replaced by an accurate frequency-dependent impedance condition. Future work will focus on computational and measurement methods for determining the acoustic impedance of a turbulent flow forced through a contraction.
