Article

Best Practice in Battery Energy Storage for Photovoltaic Systems in Low Voltage Distribution Network: A Case Study of Thailand Provincial Electricity Authority Network

1
School of Renewable Energy and Smart Grid Technology (SGtech), Naresuan University, Phitsanulok 65000, Thailand
2
Provincial Electricity Authority (PEA), 200 Ngamwongwan Road, Ladyao, Chatuchak, Bangkok 10900, Thailand
*
Author to whom correspondence should be addressed.
Energies 2023, 16(5), 2469; https://doi.org/10.3390/en16052469
Submission received: 14 January 2023 / Revised: 21 February 2023 / Accepted: 2 March 2023 / Published: 5 March 2023
(This article belongs to the Special Issue Materials and Energy in Negative and Neutral Carbon Society)

Abstract

:
This research investigated the increases of the voltage profile on the Provincial Electricity Authority (PEA)’s low voltage (LV) network due to the solar photovoltaic (PV) penetration. This study proposed the solution to maintain the voltage profile within the PEA’s standard limitation by using battery energy storage system (BESS) application. The algorithm using bisection method to figure out the optimal size and location of BESS was examined and simulated in different scenarios such as summer/winter and weekend/weekday behaviors. Furthermore, the allocation of a battery in various locations was also considered. DIgSILENT power factory with DPL script and Python are the tools used to cover diverse scenario cases. The results showed that the best practice of how to implement BESS to solve the voltage rise problem was the BESS installation at the distribution transformer and the BESS installation separately at the end of each feeder near the loads. However, the optimal size of BESS installation at the distribution transformer was almost double that of installation at the end of each feeder.

1. Introduction

The International Renewable Energy Agency (IRENA) reported that the share of renewable energy in the global power generation mix rose from 18% in 2014 to 36% in 2030 [1]. At the end of 2020, worldwide photovoltaic (PV) system installations were over 707 GW. The largest contribution to this growth came from Asia [2].
The Alternative Energy Development Plan 2018–2037 (AEDP2018) of the Ministry of Energy, Thailand [3], encourages investments in renewable energy projects in Thailand. This plan targets replacing fossil fuels with renewable energy by as much 30% in the final energy consumption. This is equivalent to 38,284 kilotonnes of oil equivalent (ktoe), resulting in a greenhouse gas emission reduction of approximately 140 million tons of carbon dioxide equivalent (tCO2e) by the year 2037. To achieve this target, the AEDP has defined three main strategies: (1) preparation of raw materials and renewable energy technologies (i.e., local production and manufacturing of renewable energy technology), (2) increasing renewable energy production, utilization, and market potential, and (3) creating awareness and providing access to knowledge and understanding of renewable energy. The target power capacity set by the AEDP is 12,139 MW for solar energy and 2989 MW for wind energy by 2037.
In 2019, the installed capacity of solar PV systems as reported by the Department of Alternative Energy Development and Efficiency (DEDE) was 2982 MW, which is about 24.57% of the 12,139 MW target by 2037 [4]. About 95% of the installations were ground-mounted utility-scale PV systems, of which 92% have signed a PPA (Power Purchase Agreement).
The future trend for solar PV systems is towards rooftop PV systems due to the continued reduction of solar PV costs and the more simplified administrative procedures for the installation of rooftop PV systems. Thus, the government has undertaken policies to eliminate various barriers to solar PV development such as supporting the change in installation and operation scheme for PV systems from self-consumption to energy trading, adapting the one-stop service for administrative licensing services, and liberalizing solar PV installation (i.e., liberalizing Thailand electricity retail market to support implementation of solar PV systems). The new government policy is based on the projection that high penetration of rooftop PV systems in the residential, commercial, and industrial sectors in the near future is inevitable.
According to the European Association for Storage of Energy (EASE) and European Energy Research Alliance (EERA) summary reports, with the adoption of the concept of incremental Variable Renewable Energy (VRE) to increase the penetration of rooftop PV systems, and with more energy storage technologies becoming available, PV systems are being used in a wider range of applications and are playing an increasing and important role in the electricity sector [5]. Additionally, the demand side management of other energy source units and thermal storage are important parts of power system flexibility [6].
However, in recent years, an increasing number of PV rooftop systems have been widely interconnected with the PEA Low Voltage (LV) distribution network, causing several problems. These include reversed power flow, voltage regulation, and power losses. The Provincial Electricity Authority (PEA) is the national electric distribution network of Thailand maintaining and ensuring the reliability and stability of the power distribution system to assure a continuous and efficient electricity supply to over 20 million customers, accounting for about 80% of the electricity meter number of the country. One of the solutions that the PEA is studying is to install BESS to mitigate the effects of PV rooftops as well as to maintain the reliability and stability of the distribution system.
There are already research studies analyzing the technical impacts of the application of PV rooftops together with energy storage systems [5,7,8,9,10,11,12,13,14,15,16,17,18,19]. Several of these studies implemented linear and nonlinear programming techniques [7,8,9,15] and genetic algorithm [9,13,15,19] to optimize the use of BESS as a solution. These quantitative analytical methods were complex and time-consuming. Moreover, they required an adequate number of input parameters and a specific software such as MATLAB to figure out solutions.
This study was thus conducted to develop a simpler analytical method to analyze the technical impacts of increasing penetration of PV systems and to determine how using BESS could eliminate or minimize the adverse impacts, particularly in the grid voltage profile. The more simplified and less time-consuming tool for finding results of this study was bisection method, and it was chosen to conduct simulation studies to determine BESS sizes and locations for the different scenarios.

1.1. Study Objective and Approach

This study aimed to develop a model, an algorithm using the bisection method, and to determine the optimal size and location of BESS. The algorithm was used to examine and simulate different scenarios that the grid may be subjected to such as seasonal changes (summer/winter) and load conditions (weekends/weekdays). Kumar et al. [20] also apply the bisection method to determine the optimum capacity of BESS in the electric vehicle charging station at each location and the requirement of PV capacity to charge the BESS. The study was conducted in various PV profiles and load profiles of different seasons, such as winter, spring, rainy reason, and summer, including traffic flow during the weekdays and weekends.
The present study started with an analysis of the technical problems resulting from increasing PV penetration of the grid. This study then determined solutions through the proper sizing and siting of the BESS using the model developed by this study in order to maintain the grid voltage profile within the limits of the PEA standards.
A representative PEA LV network was selected for the study, and its load profile from the Supervisory Control and Data Acquisition (SCADA) and Geographical Information System (GIS) database were synthesized and applied in the model to analyze various scenarios. The possible BESS types and characteristics (size and siting) for the various scenarios were identified and analyzed.
The Simplified Bisection Method [20,21,22] was used to conduct simulation studies to determine BESS sizes and locations for the different scenarios. The study used this bisection method since it was a more simplified and less time-consuming tool for finding appropriate BESS solutions. The DIgSILENT power factory with DPL script and Python were the tools used in this study. Using this tool, the optimal size and the location of a BESS in a LV distribution network, based on PEA standards, were determined and analyzed.

1.2. Literature Review

The literature review showed that high PV or VRE penetration greatly influences the operation of Medium Voltage (MV) and LV distribution networks, and there were many different solutions that could be considered to decrease its impacts (Table 1). BESS was the technique that was mostly introduced to solve the challenges resulting from high PV penetration such as voltage regulation, peak load shifting, harmonics, and reverse power flow.
Many research studies were also conducted to develop a Battery Management System (BMS) and modern operation control modes for BESS to maximize the advantages of BESS. Solutions for supporting PV penetration in a LV distribution network and optimization methods for BESS placement and sizing to increase the network threshold and reduce the technical problems associated with cost–benefit consideration were considered [23,24].
Habib et al. [7] showed the benefits of the optimal scheduling using an optimization based on residential customer scheduling using a MILP (Mixed-Integer Linear Programming) to increase the reliability of power delivery for subsystem customers during grid blackouts or emergency islanded operation. The isolated and interconnected cases were also studied in the presence of a local and centralized Energy Storage System (ESS). The proposed optimization method was able to determine the optimal ESS size, the daily initial State of Charge (SOC), and the charge/discharge schedule of the ESS for both the isolated and the connected cases. The final SOC in this paper was equal to the ESS name plate capacity. In order to maintain ESS health, the deep discharge cycle control was between 0.1–0.9. This paper showed that, despite the variability and intermittency of PV power generation, an ESS can substantially improve electric power reliability by almost four times compared with the situation without a centralized ESS. The centralized ESS strategy resulted in a smaller-sized ESS with higher solar utilization and higher percentage of the load met. With an ESS, residential customers with oversized PV systems fared better when the system remained disconnected. However, the investments in ESS capacity for the entire subsystem almost doubled. Therefore, it can be concluded that the interconnected centralized ESS strategy was preferred, as it supplied 100% of the load for a smaller capital investment in ESS.
Dominguez, O. D. M. et al. [8] studied on optimization of location and sizes based on a planning framework that optimized the location and size of renewable Distributed Generation (DG), Capacitor Banks (CB), and ESS to ensure the quality of the supplied energy and avoid technical and environmental violations. The proposed model used a Mixed-Integer Nonlinear Programming (MINLP), which was recast to a MILP using A Modeling Language for Mathematical Programming (AMPL). The results of the test system under three different conditions showed the effectiveness of the proposed model in decreasing the operating cost, reducing the emissions, and improving the voltage profile. That the ESSs were enhancing the operation of Electrical Distribution Systems (EDS) was undeniable, while the renewable energy generation played a fundamental role in reaching the future energy supply targets and addressing environmental concerns.
Babacan, O. et al. [9] explored the appropriation question of BESS in power distribution systems for voltage mitigation reduction under conditions of high PV penetration in networks. This study used a Genetic Algorithm (GA) base bi-level optimization method to reduce the voltage fluctuation by deploying BESS to the permitted nodes with consideration of the capital, land-of-use and installation costs using a qualitative cost model. A Linear Programming (LP) routine was used to determine each BESS operation. The results showed consistent decisions that appeared to be generally optimal under varying sizing costs, siting costs and PV penetrations.
Ma, Y. et al. [10] proposed a novel probabilistic framework to study the impact of a PV-battery system on low voltage distribution networks by using the Monte Carlo (MC) simulation. The simulation included the synthetic demand and PV profile from a smart meter and the Home Energy Management (HEM) decisions for battery scheduling optimization. The simulation results showed that the battery was able to mitigate the technical problem induced by PV generation. However, with an uncoordinated battery scheduling, the benefits were limited.
M. Zeraati et al. [11] proposed the distributed control strategy for BESS to manage voltage problems in the distribution network during the peak PV generation and the voltage drop, while meeting the peak load. The proposed strategy combined the local droop-based control method and a distributed control scheme to control the battery storage charge/discharge to ensure the voltage feeder remained within the allowed limits. The main function of the BESS was to support the voltage rise and drop. The test results verified that the control strategy kept the voltage in the network within the allowed limits during daily operations. The power sharing among BESS systems was automatically established according to the SOC and the installed capacity of batteries.
Marra, F. et al. [12] proposed energy storage options to support voltage quality in residential low voltage grids with high shares of PV generation. The three different concepts to install energy storage investigated were (1) a Centralized Storage (CS) at the feeder node, (2) a Distributed Storage (DS) at the PV location in the feeder, and (3) a combination of CS and DS storage with reactive power. The results showed that the DS concept can provide voltage support and secure voltage quality with relatively small power. The CS option showed that the power/energy of storage was minimized when installed at the end of the feeder. The last option was the combination of CS and DS with reactive power methods at the PV interface. With all PV inverters consuming reactive power with a constant power factor at 0.95, the storage power and energy levels were significantly reduced in both concepts of DS and CS.
Khaboot, N. et al. [13] analyzed a methodology to increase the PV penetration level in a practical LV distribution network through the implementation of BESS. The optimal siting, sizing, and operation of BESS were determined with the objective of maximizing the total Net Present Value (NPV). The GA was performed to solve the optimization problem. The simulation results showed that the suitable PV penetration level of this specific system was 130%. It was also found that the proposed optimal operation of BESS can totally flatten the load profile. The findings can be utilized for increasing the PV penetration level in the LV distribution system.
Katsanevakis, M. et al. [14] examined the introduction of a new droop control for ESS dispatch commands generation. The droop characteristic generated the ESS dispatch commands as a function of the power surplus at the substation transformer. The ESS with the new droop control proposed to increase the level of PV penetration in LV distribution networks for the most economical solution in terms of ESS placement and sizing. Simulation results revealed that both proposed control modes maintained a suitable grid operation for 70% PV penetration. Additionally, the study showed that an ESS located in the LV network performed some positive functions, including load management, peak load levelling, and voltage support.
Jannesar, M. R. et al. [15] analyzed the optimization of BESS sitting, sizing and daily charge/discharge characteristic to mitigate PV penetration in LV network. The idea was that the local BESS was charged during the surplus production from PV and discharged when customers’ demand increased. In this study, optimal placement, sizing, and daily charge/discharge of BESS were performed based on a cost function that included energy arbitrage, environmental emission, energy losses, transmission access fee, as well as capital and maintenance costs of BESS. DIgSILENT and MATLAB were used to carry out all simulations. The results showed that the proposed approach was able to reduce overvoltage and energy losses, prevent the reverse power flow, decrease the environmental emission, and maximize economic profit.
Yang, Y. et al. [16] studied a strategy on how to size the distributed BESS to manage voltage regulation and peak load shaving due to high PV penetration. The distributed BESS was applied to voltage regulation and peak load shaving. The proposed method examined the objective to optimize BESS size and conduct the cost–benefit analysis. The development of the system model, including a physical battery model, and a voltage regulation and peak load shaving-oriented energy management system (EMS), was applied to the proposed strategy. The results showed that the method was able to determine the size of distributed BESS being appropriate to PV penetration level based on cost and benefit factors.
Teja, S. C. and Yemula, P. K. [17] developed an algorithm for an energy management system between PV rooftop and batteries to manipulate a grid connected PV rooftop system and battery in order to minimize the power drawn from the grid during high grid prices. The challenges of intermittency of sources, time of the day prices, sizing of solar panels and battery, and the limitation of charging and discharging rates of the battery were presented as energy management concepts. Realistic demand and solar generation patterns for 30-day data were tested and compared with the coded MATLAB data. The results showed effective savings on monthly electricity bills. The optimal selection of the number of solar panels and battery size was also presented.
Bianco, G. et al. [18] presented a study on a DG project of a Distribution System Operator (DSO) company in Italy. The original design of this distribution network is radial and does not consider for interconnection any other generator with a significant capacity. In this type of feeder (radial), the power flows in one direction from a single source to the loads. The penetration of DG into the feeder can cause a reverse flow. This reverse flow violates the basis of “radial design” and has a significant effect on the operation of the feeder and especially on system protection and voltage regulation. BESS was installed in this project to mitigate intermittency in VRE generation. Fast BESS was installed in the MV busbar of three different HV/MV substations, which were used to reduce the variability of the power flow in the parts of the network with high penetration of VRE. BESS was used for DG dispatching to control energy exchanger profiles rather than voltage regulation in this case.
Carpinelli, G. et al. [19] proposed the optimal allocation for the siting and sizing of distributed electrical ESS in unbalanced electrical distribution systems. This paper formulated a mixed, non-linear, constrained minimization problem. The problem is complex from the computational point to guarantee reasonable accuracy. Although the computational efforts are limited, a new approach based on a Simultaneous Perturbation Stochastic Approximation (SPSA) method and on an innovative inner algorithm allowed the quick carrying out of the daily scheduling (charging/discharging) of the electrical ESS. The results clearly showed the feasibility and demonstrated the effectiveness of the procedure in terms of computational time effort, while preserving the accuracy of the solution. The obtained results were also compared with the results of a GA and of an exhaustive procedure.
There have been limited studies on solar PV penetration impacts of voltage regulation on realistic network data, load characteristic and solar power potential in the PEA low voltage network environment. The basic numerical method and less simulation time-consuming techniques to size the battery storage need to be implemented in order to expand and repeat such studies for PEA networks. Therefore, studies need to be undertaken to determine the best practices for solar PV rooftop systems and BESS in PEA LV distribution networks using actual case studies from the PEA.

2. Materials and Methods

The LV network selected for this study was a PEA network located in the central area of Thailand, which was the most crowded area of the national distribution network in terms of having high customer loads and solar PV rooftop installations. This network, with data exported from GIS, was modelled using the “DIgSILENT PowerFactory” software, which is well-known for power system analysis [25]. DIgSILENT Programming Language (DPL) scripts and Python programming language were applied to the simulation due to the diversity of scenarios and variability of the factors investigated.

2.1. PEA Network Components, Network Constraints, Loads and Solar PV Profiles

  • Network components
The network selected for this study, comprised of 88 customers in two main feeders under a common distribution transformer, account for 160 kVA capacity at 22 kV/400 V (see Figure 1). The network components are presented in Table 2 and Table 3. The network represents the residential characteristics of typical villages that are mostly found across the country.
  • Network constraints
The PEA regulations on power network system interconnection, under the “PEA Grid Code B.E.2016,” limits to 15% the distribution transformer capacity for Distributed Generation (DG) connection in low voltage networks [26,27]. In this investigation of the tolerance of the distribution transformer, this limitation was excluded, and the tolerance was exceeded with the implementation of the BESS.
Loss was also not taken into consideration as this was a study for a small low voltage network. This research investigated a DG (i.e., a rooftop PV) with a capacity of lower than 5 kW connected to a single-phase distribution system, in accordance with PEA Grid Code. The PEA voltage regulation standard, which defines 220 ± 10% V (0.90–1.10 p.u.) as standard voltage level in normal state [26,27], was adjusted to 220 ± 5% V 215 (0.95–1.05 p.u.) due to safety considerations in utilizing the BESS.
  • Load and solar PV generation profiles
The general objective of this study was to examine how the implementation of BESS can solve the voltage regulation problem. The study involved the analysis of the load and solar PV generation profiles during weekdays and weekends in both the summer and winter seasons. Summer is from March to May, and winter is from November to January. Although Thailand is a tropical country, it has defined the following three seasons: summer, winter, and rainy seasons. The study selected cases under the 24 h/day cycle. Each case represented different network system characteristics.
The study focused on the summer season because solar PV systems have the maximum power generation during this time as this is the period of high solar irradiance in the country. However, the winter season was also considered since even if the solar irradiance is moderate during this period, the solar PV systems are operating at lower temperatures, and the generation can still be high. The rainy season was not included as it is that period when a solar PV system produces the lowest power and thus has the least effect on the network system.
The conditions in both working- and off-days were considered in this study to cover all possible situations. Realistic load profiles under different conditions were collected from the residential meter data from the PEA GIS database (see Figure 2). The solar PV generation profiles for summer and winter were recorded by a weather station located in the central part of Thailand. The overall maximum load was approximately 71.15 kW.
Kitworawut, P. and Ketjoy, N. [28] investigated previously the installation of PV rooftop systems, with varying sizes (i.e., 1-, 2-, 3-, 4- and 5-kW systems), for different extents of customer penetration (from 10% to 100%). The study focused on weekday and weekend operations and for both summer and winter periods. The results showed that the worst-case “energy supply-demand situation” was the case of PV systems generating the maximum power, while the demand of the network was at the minimum requirement.
This worst-case energy supply–demand situation was then considered in this research, focusing on a network with 5 kW solar rooftop PV systems and where there was complete customer penetration (i.e., 100% penetration) of the grid. The maximum total installed capacity of the solar PV systems was approximately 440 kWp. In this worst-case situation, the total solar PV power generation exceeded the total consumption causing voltage profile problem in the network.
  • Focus points of the grid network studies
This study analyzed the grid voltage profile on the following focus points: the transformer bus, the end of feeder 1 (F1–4), and the end of feeder 2 (F2–11), as these could provide indicators of low stability (see Figure 1). Figure 3, Figure 4, Figure 5 and Figure 6 show the voltage profile at the three study focus points in the network under the four scenarios considered in this study. The voltage profiles at the end of the feeders exceeded by over 5% the standard limit (1.05 p.u.) set by the PEA. The reasons for voltage profile changes were due to the energy supply from PV and demand situation of weekdays and weekends in both the summer and winter seasons, including network conditions and constraints of this study mentioned earlier.

2.2. Scenarios for the Simulation Studies Using the Model

The case study was conducted for four scenarios as presented in Table 4. As mentioned earlier, the study focused on the summer season because solar PV systems have the maximum power generation during this time as this is the period of high solar irradiance in the country. The winter season was also considered since, even if the solar irradiance is moderate during this period, the solar PV system is operating at lower temperatures, and the generation can still be high. Then, the conditions in both working-days (weekdays) and off-days (weekends) were considered in this study to cover all possible electricity supply–demand situations. The sizes of the BESSs and their location at three different points, namely the transformer bus (TR bus), end of feeder 1 (F1–4), and end of feed 2 (F2–11), were then studied for the four scenarios as shown in Table 4.
Table 4 shows the maximum voltage value (p.u.) at the transformer bus and the ends of Feeders 1 and 2. It is apparent that the ends of the feeders, which are far from the transformer supply and high solar PV generation, have a voltage profile problem. This situation occurred when the PV generator were connected, and power was injected into the distribution network; the connection point voltage increased, and the voltage profile was then no longer within the acceptable limits. At every scenario, the end of Feeder 2 seemed to have more problems with regard to the voltage profile when compared with Feeder 1. The reason was because of the unbalanced load along Feeder 2. There was load scattering compared with Feeder 1 (see Figure 1). The first group of loads was from F2–1 to F2–6, while the other group was located at end of the feeder (from F2–9 to F2–11) area. During summer, when the solar PV generation was strongest, and on the daytime of weekdays when the demand was lowest, the maximum excess voltage at 1.0902 p.u. was understandable.

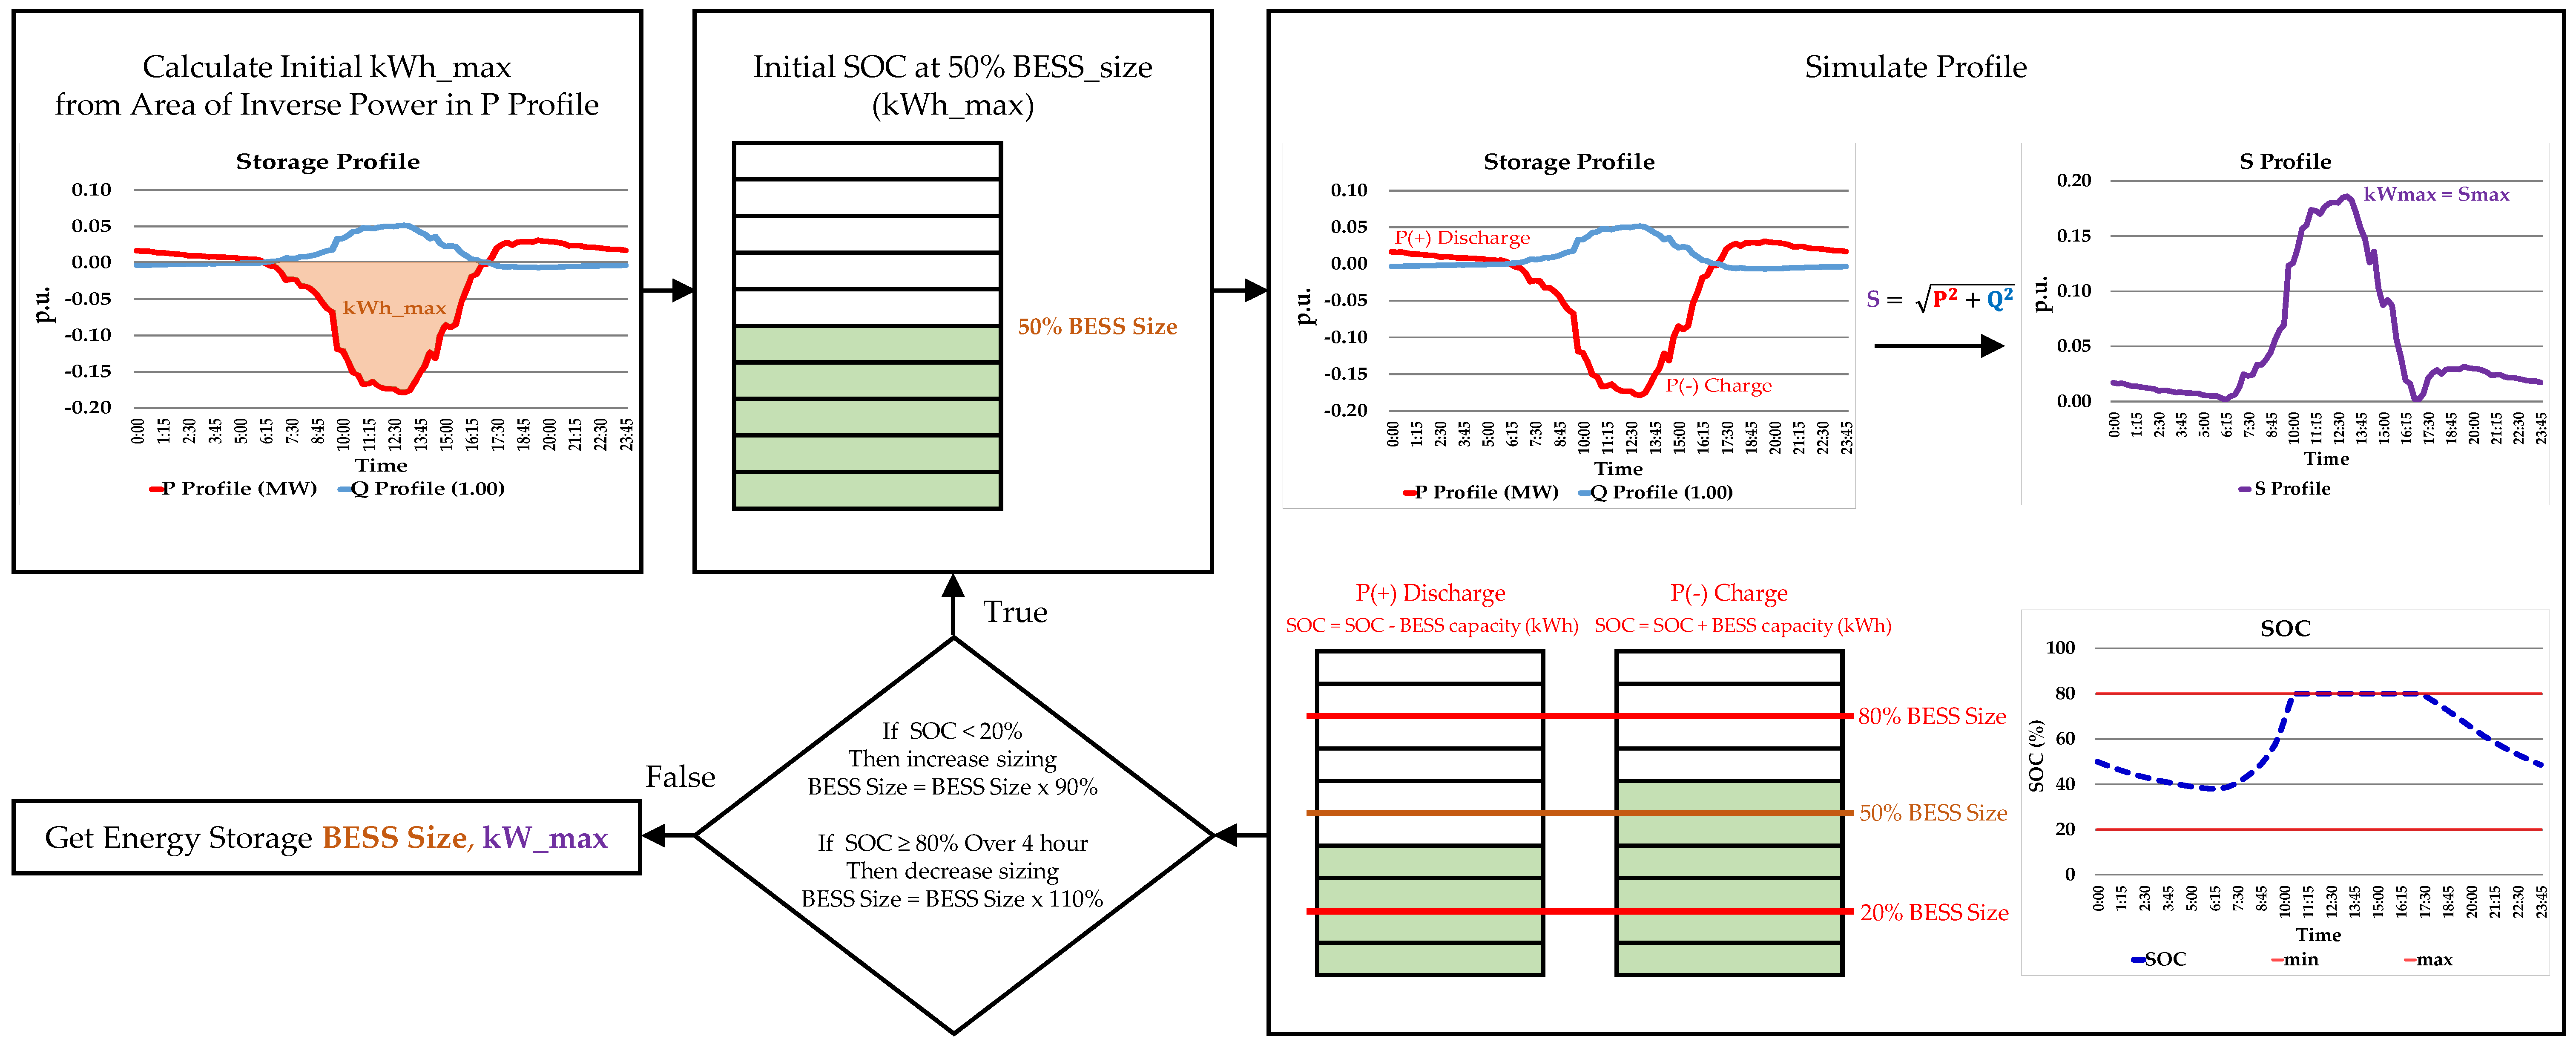
2.3. Description of the Model—Bisection Method and Sizing Algorithm for Optimization of BESS

According to [21]: “The bisection method is a numerical method that is formulated to find a root of an equation such that f(x) = 0. The root of an equation is in (a, b), when f is continuous on the interval [a, b] and values a, b is found that f(a) and f(b) have opposite signs. The bisection method will separate half an interval and replace it with either the other or one half, and then it is nearby to the root”. The bisection method is a procedure to search for a solution for a non-linear equation with logarithmic time complexity. Hence, the computational efficiency can be expressed as less time-consuming because of this logarithm time. Nevertheless, with strategic and comprehensive problem formulation, it can convert an optimization problem such that a derived estimator can be solved using the bisection procedure with an exact general solution [29].
This method was applied to figure out the optimal capacity of battery power and energy according to the technical conditions. The algorithm to calculate the battery size is explained in Figure 7.

2.4. Description of the Simulation Studies

Many types of BESS technology have been introduced for utility grid applications. Each technology provides a different type of behavior such as electrochemical properties (i.e., energy and power density), performance, and cost of installation per energy and power [19]. The criteria to be considered for the BESS should include high conversion efficiency, high power and energy density, as well as high power and energy rating, and fast response time [30]. Li-ion batteries were considered in this study due to their technical criteria such as a high efficiency, power and energy density, and rating including fast response time. Moreover, Li-ion batteries are maintenance-free and applicable for utility-scale use and high renewable energy penetration. However, the cost of Li-ion batteries is still an issue for applying this technology in grid applications. To limit the scope of this study, which focused on technical aspects, an economic analysis such as a cost benefit analysis will be a future work.
The first step in the simulation studies was to consider the active power profile (Equation (1)) excess from solar PV rooftop generating backward to the distribution transformer.
P profile = V × I × cos θ
The area of inverse P profile implied the expected maximum capacity of a battery that stored the full excess power from the PV modules of the system. This is the starting capacity of the battery before the calculations (see Figure 8). At the focused buses, the reactive power profile (Equation (2)) was determined by a simulation that kept a constant voltage profile of 1 p.u.
Q profile = V × I × sin θ
The bisection method was considered with the parameters P and Q, and set the boundary of BESS capacity between 0.01 and the maximum excess energy from solar PV (kWh_max or ESS size). The BESS state of charge (SOC) in the range of 20–80%, which is the typical utilization interval of BESS, was calculated to find out the BESS optimal capacity (kWh). The SOC of BESS was initialized at 50% of maximum ESS size (in kWh) in order to narrow the range of the BESS size for calculation and to reduce the simulated iteration. The BESS sizing was the area of P profile at a 1 h time step within 24 h as shown in Equation (3).
BESS   size   kWh _ max = 0 T P t dt   where   P < 0 ,   T = 24   h
For each iteration, the SOC was compared with its limit (20–80%) and then adjusted by tuning the values. If SOC was below 20%, that meant it was over discharged, so it was adjusted to 110% to raise its capacity. On the other hand, the capacity was lowered to 90% when SOC was higher than 80% for 4 h to downsize the BESS. The BESS power (kW) was determined by the apparent power (S) profile calculation as shown in Equation (4). The optimal rated power of BESS was equal to or larger than maximum S (S_max) profile to supply peak power to the load or to absorb peak power from PV (Figure 8).
S max   ( kW _ max ) = P 2 + Q 2
The PV rooftop model is the simplest system model. The inverter model is simply equal to the nominal PV array power. The energy available to the grid (Epv-grid) is what is produced by the array and reduced by inverter losses as shown in Equation (5).
Epv-grid = EA ηinv
EA = ηA(S × A)
EA is the array energy available to the load (kWh/day). ηinv is the inverter efficiency. ηA is the overall array efficiency. S is solar radiation (kWh/m2·day). A is the area of the array (m2).
In this simulation, the BESS operated as a synchronous generator. This study considered the overall efficiency of BESS including: the battery, battery management system and cooling system, and power conversion system (PCS), which was set to either the power factor control mode or the voltage control mode, depending on the simulation criteria that were obtained through modelling using the DIgSILENT power factory software.
EBESS = Egrid ηpcs
EBESS is the BESS capacity (kWh). Egrid is the grid energy (kWh). ηpcs is the power conversion system efficiency. The different scenarios were simulated with power flow and voltage level at the points of consideration in DIgSILENT. The DPL script and Python programming were used for looping with the change of variables.

2.5. Limitation of the Simulation Studies

There are other key factors that need to be undertaken to make a full evaluation. Maintenance-free and applicable for utility-scale use in high renewable energy penetration should also be taken into account in doing a full evaluation. Other considerations include commercial availability. However, in this study, the only factors considered were BESS sizing and its siting in the grid network. Economics analysis, which is significantly affected by government policies that still remain uncertain, was not considered.

3. Results and Discussions

Simulation studies of scenarios were conducted to find out the impact of the BESS installation in maintaining the grid voltage when the grid voltage rose because active power was fed into the grid by a PV system. The results of the simulation studies showed that the algorithm selected in this study could be used to determine the suitable BESS size for each scenario. The locations of battery installation were determined using either DS or CS criteria. As previously mentioned, the points considered for siting the BESS were at F1–4, F2–11, and the TR bus. The simulation studies showed that the configuration of the BESS determined by the algorithm could maintain the voltage profile and manage the excess power from the solar PV system within the limits set by the PEA code. The results were determined by measuring technical parameters, such as the grid voltage, in the chosen LV network. Table 5 shows the optimal battery storage size and location for each scenario. The simulation study demonstrated the best practice for implementing BESS in solving the voltage rise problem. Each scenario is discussed in detail in the following sub-sections.

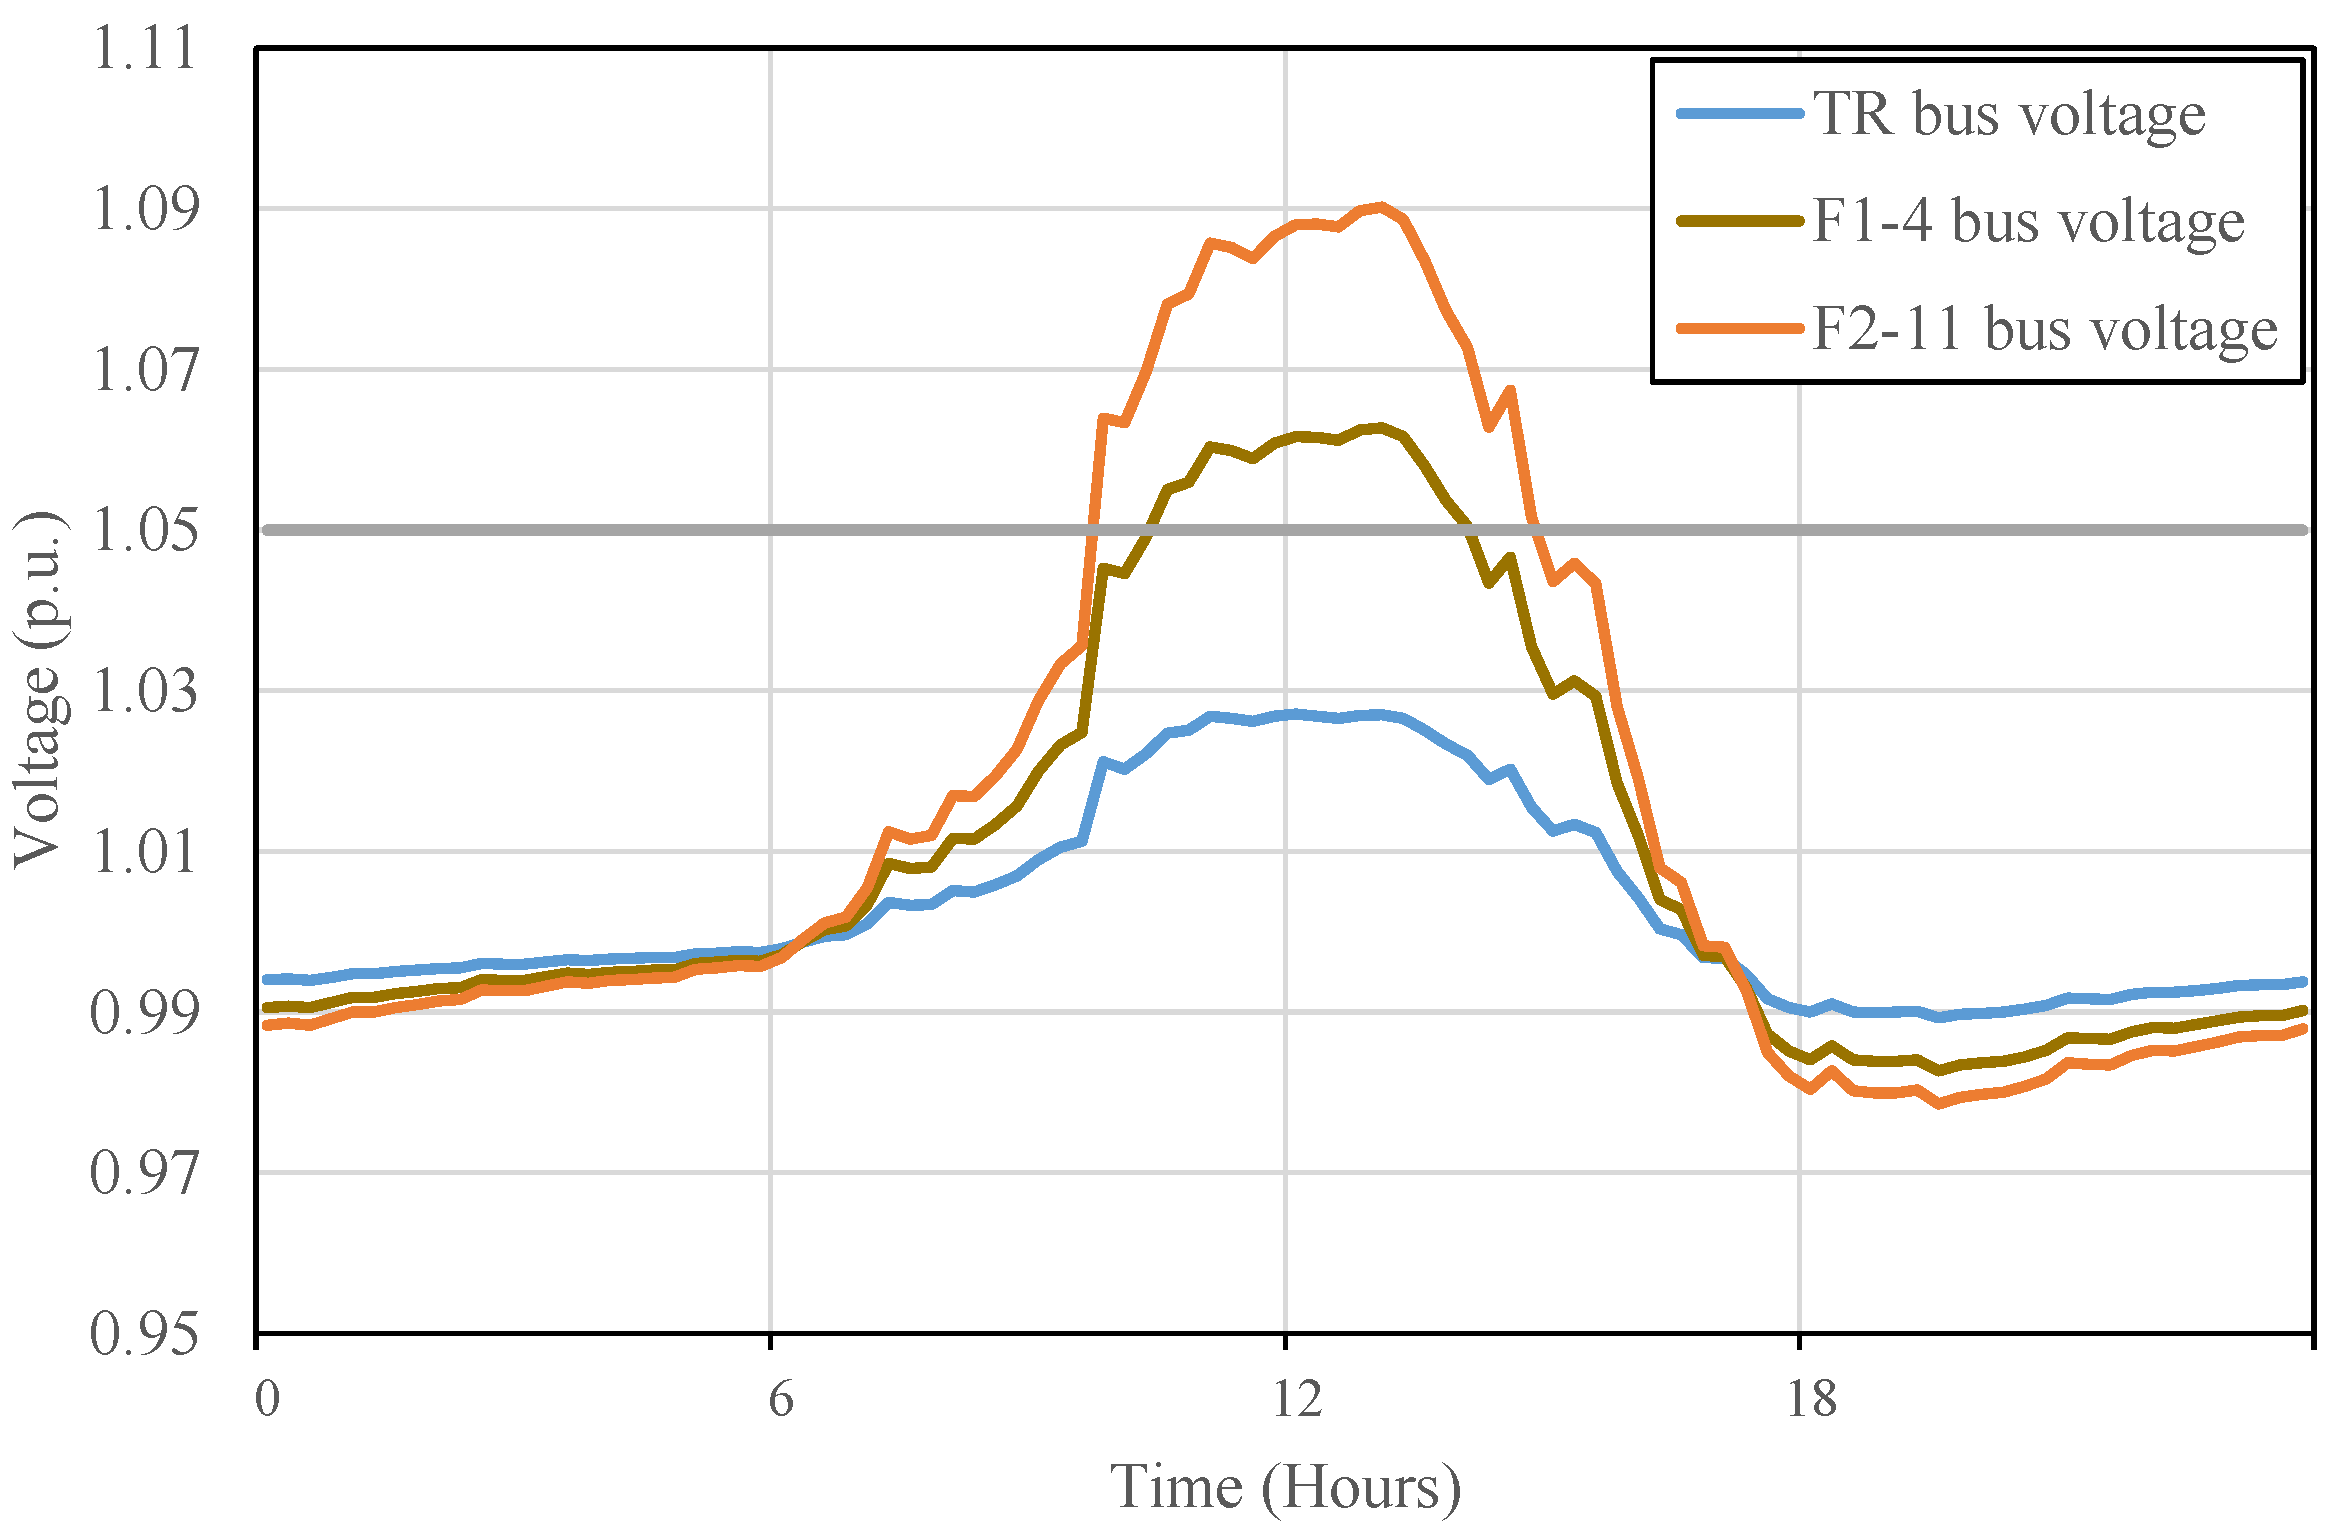
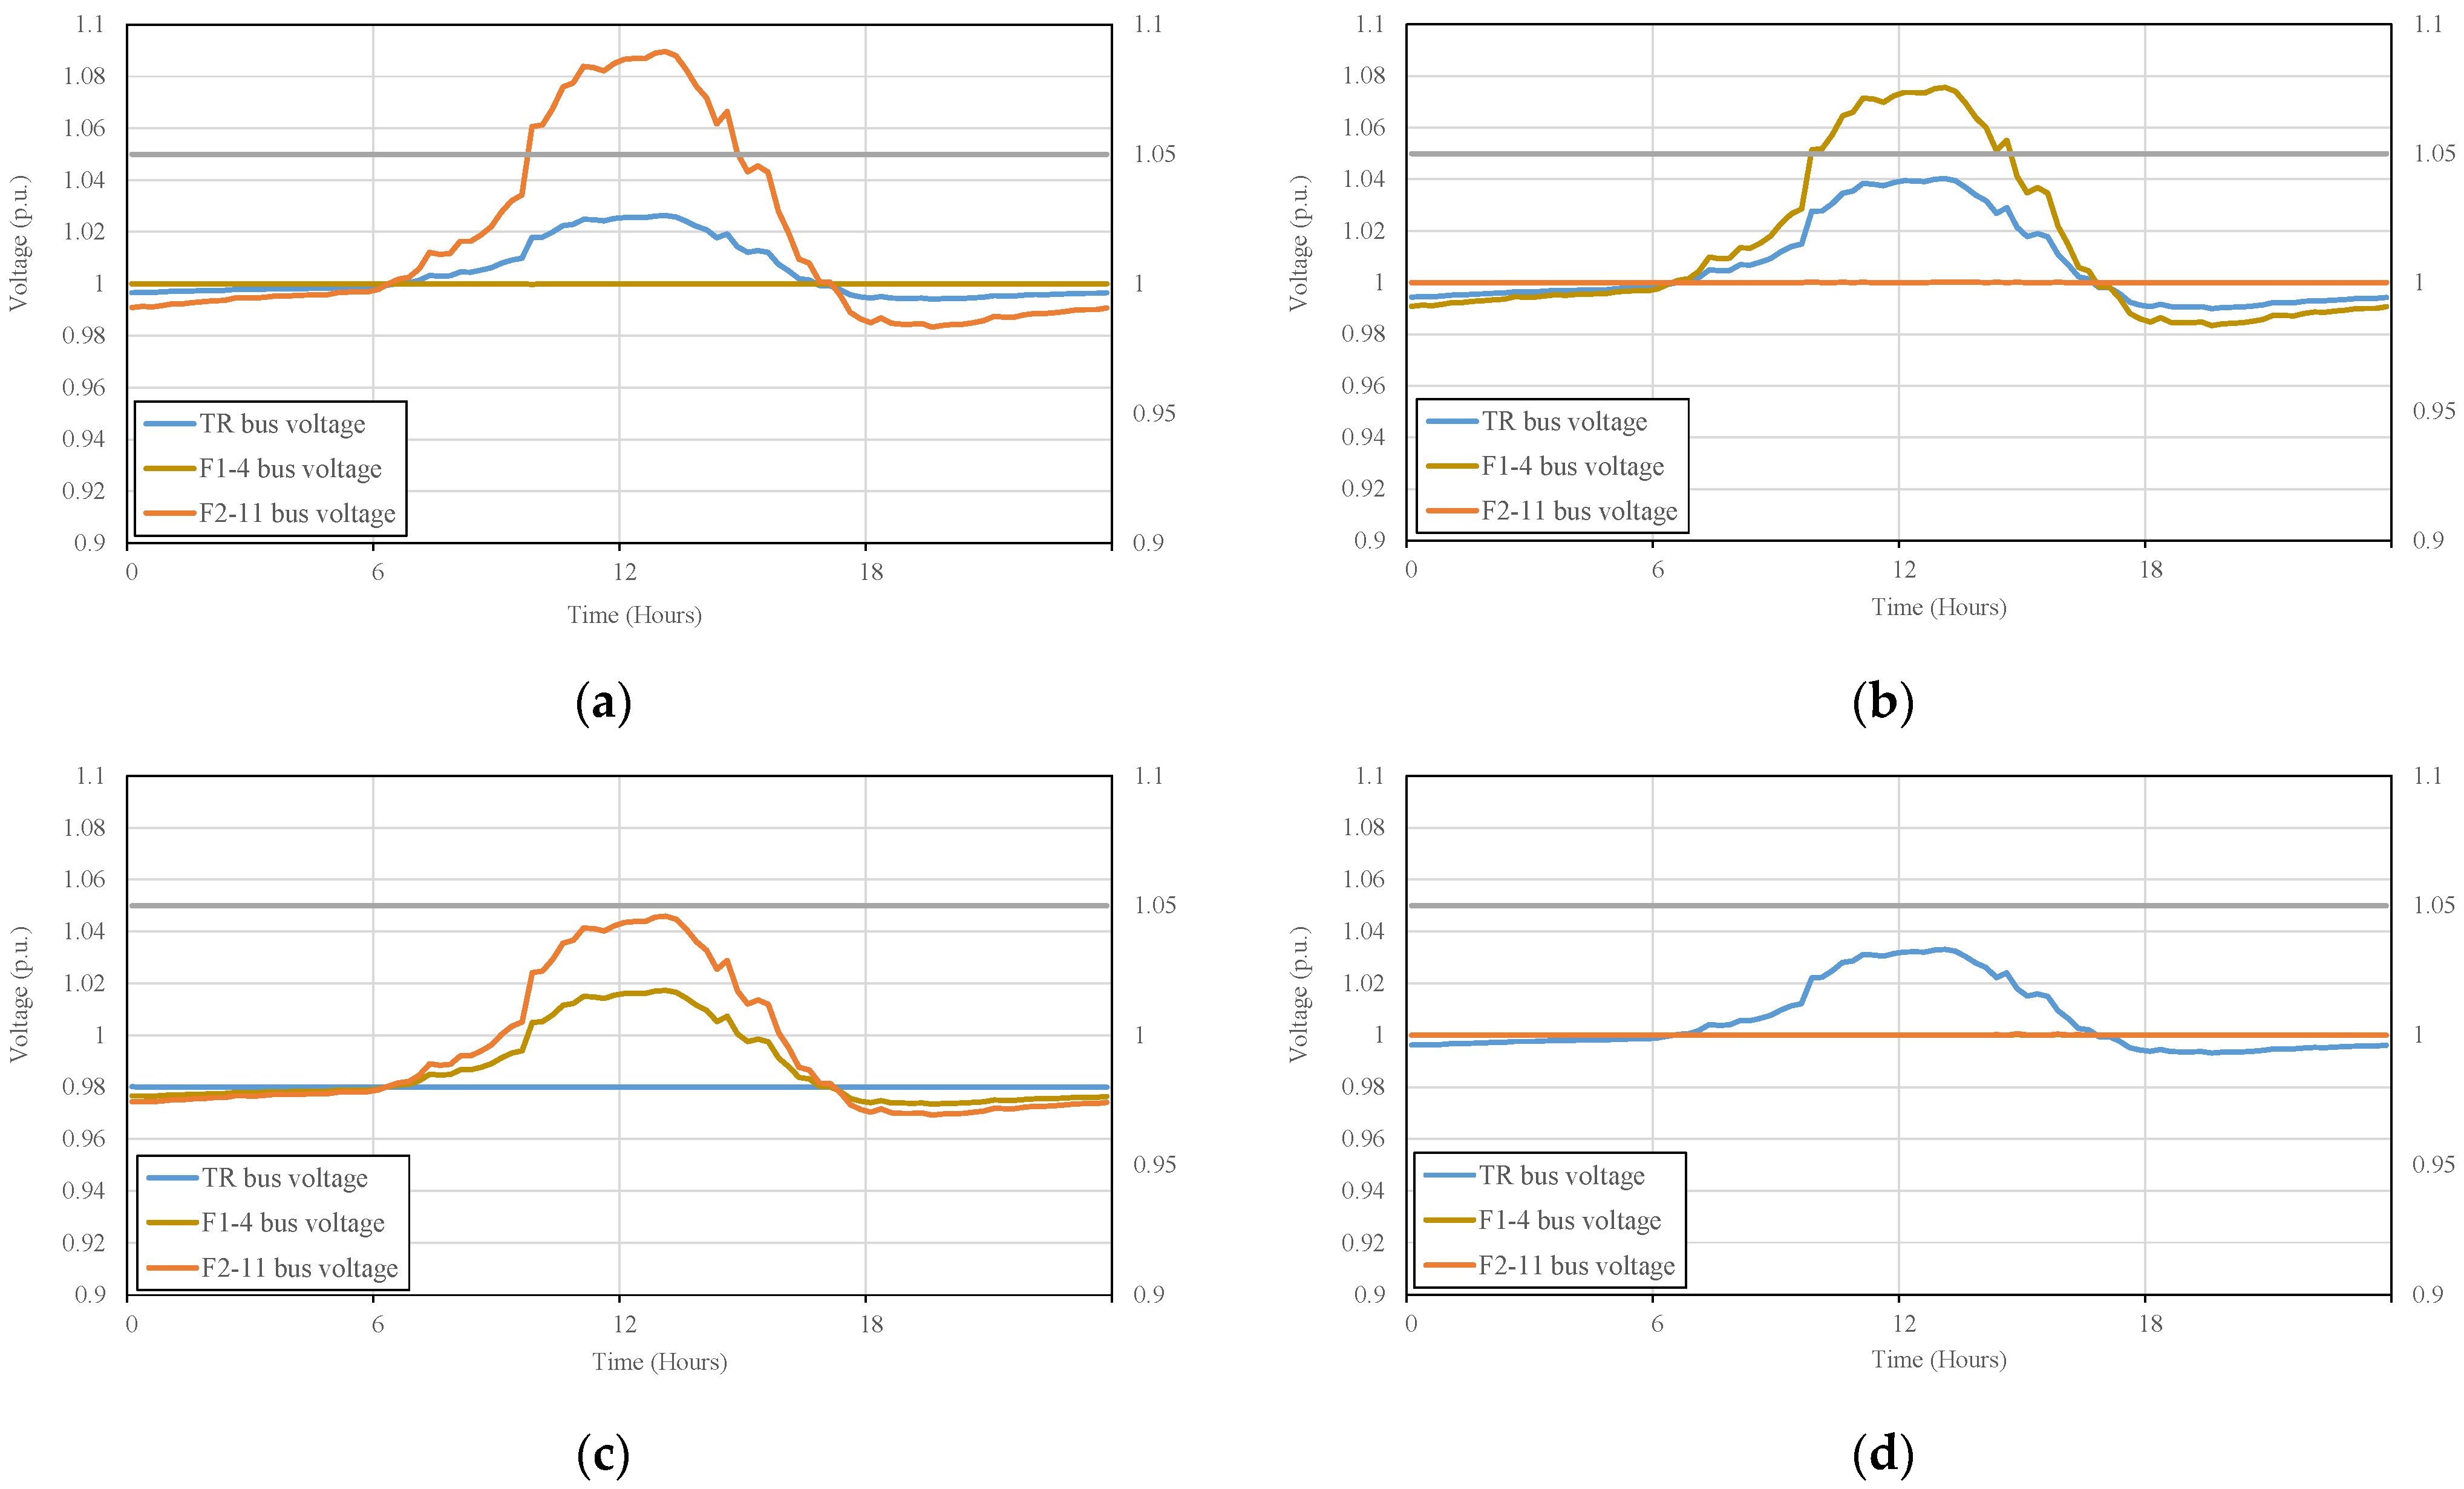
3.1. Scenario 1 (Summer/Weekends)

The simulation study results for Scenario 1 (operations on weekends during summer) are presented in Figure 9, where the voltage profiles for BESS sited at TR bus, F1–4, and F2–11 are shown in separate graphs.
The voltage profile could be managed within the 5% limitation by its charge/discharge and P, Q control, whether the BESS was installed at the TR bus, or at the feeders (F1–4 or F2–11). The optimal size of the BESS when installed at the TR bus was 542.5 kWh/407.0 kW. For installation at F1–4/F2–11, the suitable battery capacity was 264.8 kWh/196.3 kW at F1–4. At F2–11, the suitable battery capacity was 280.4 kWh/184.9 kW (see Table 5).
The voltage profiles in Figure 9a,b show that a Decentralized Storage (DS) installation of BESS at the end of individual feeder could not support the voltage level along the network due to the network characteristic and load location. When the battery storage was installed at F1–4, the voltage level at F2–11 was still high and vice versa.
When the BESS was installed at F1–4, the grid voltage was constant at about 1.000 p.u. At the TR bus, the grid voltage rose to a maximum of about 1.022 p.u. At F2–11, the grid voltage rose to a maximum value of about 1.090 p.u. that was over the limit. During nighttime, when there was no PV power production, the grid voltage dropped to the lowest at about 0.980 p.u., at the busbar of F2–11 (Figure 9a).
Figure 9b shows that when the BESS was installed at F2–11, the grid voltage was constant at about 1.000 p.u. The grid voltage profile behavior was the inverse of the behavior of the voltage profile of the previous installation that was located at F1–4. It rose to a maximum voltage of about 1.075 p.u., which was above the limit and then dropped to a minimum voltage of about 0.980 p.u. in the nighttime. At the TR bus, the grid voltage rose to a maximum of about 1.040 p.u. The maximum grid voltage, at the TR bus, was higher by about 2% compared with Figure 9a. This was reasonable due to the lower load demand of feeder 2 (lower customer 5% and shorten feeder 17%).
However, with a Centralized Storage (CS), the voltage level was controlled within the limit consistent with values found in the literature [7,8,12,13,14,18] as shown in Figure 9c. It was found that, with the BESS, the active/reactive power and the voltage level were controlled within the range required. When the BESS was at the TR bus, the grid voltage was constant at about 0.980 p.u. for the whole day. At F1–4, the grid voltage rose to a maximum of about 1.018 p.u. At the F2–11, the grid voltage rose to a maximum of about 1.045 p.u.
The grid voltage level was maintained within the range by installing the DS at the end of individual feeder. This is also in line with the findings cited in the references [7,9,10,11,12,15,16,17,19], as presented in Figure 9d. When at the TR bus, the grid voltage rose to a maximum of about 1.030 p.u. during the daytime, while when at F1–4 and F2–11, the grid voltage remained stable at about 1.000 p.u. for the whole day (Figure 9d, the brown line of F1–4 was cover with the orange line of F2–11). Generally, the different methods and control strategies used in the previous studies were additionally implemented to increase the preciseness and accuracy of the BESS solutions [7,8,9,10,11,12,13,14,15,16,17,18,19].

3.2. Scenario 2 (Summer/Weekdays)

The installation of BESS, in either CS or DS mode, could efficiently support voltage regulation or management along the network, but the capacity and power of the BESS could be different, depending on the excess solar PV power generation.
Under the simulation studies for Scenario 2 (operations on weekdays during summer), the size of BESS installed at the TR bus was 513.5 kWh/407.0 kW. This was suitable for the voltage profile support for this scenario. However, the voltage profile problem was also manageable when the BESS was installed at the end of each feeder. The BESS installed was a 253.8 kWh/197.4 kW battery at F1–4 and a 264.8 kWh/186.0 MW battery at F2–11 (see Table 5). The results of the voltage profiles for this scenario are shown in Figure 10.
The voltage behavior of each case in Scenario 2 was consistent with that of Scenario 1 (summer/weekends scenario). According to Figure 3 and Figure 4, these graphs show that the voltage profiles of both cases were almost similar, and there was no significant difference between Scenarios 1 and 2. Based on the sizes of the BESS shown on Table 6, the average difference in the BESS energy content (kWh) was about 5%, and there was no significant variation in power (kW) for both CS and DS installations. Thus, the voltage profile was maintained within the limits.
A greater energy capacity was required for Scenario 1 due to the higher demand of customers on weekends. This was generally caused by the residential load profile when people stayed at home during this time, leading to more energy consumption compared with weekdays. The capacity (kWh) to power (kW) ratio of BESS could also be determined. The CS capacity to power ratio was about 5.0:4.0, and, for the DS, it was about 2.5:2.0. Hence, as determined in this case study, two units of BESS at end of either feeders were equivalent to a single unit of BESS at the TR bus.

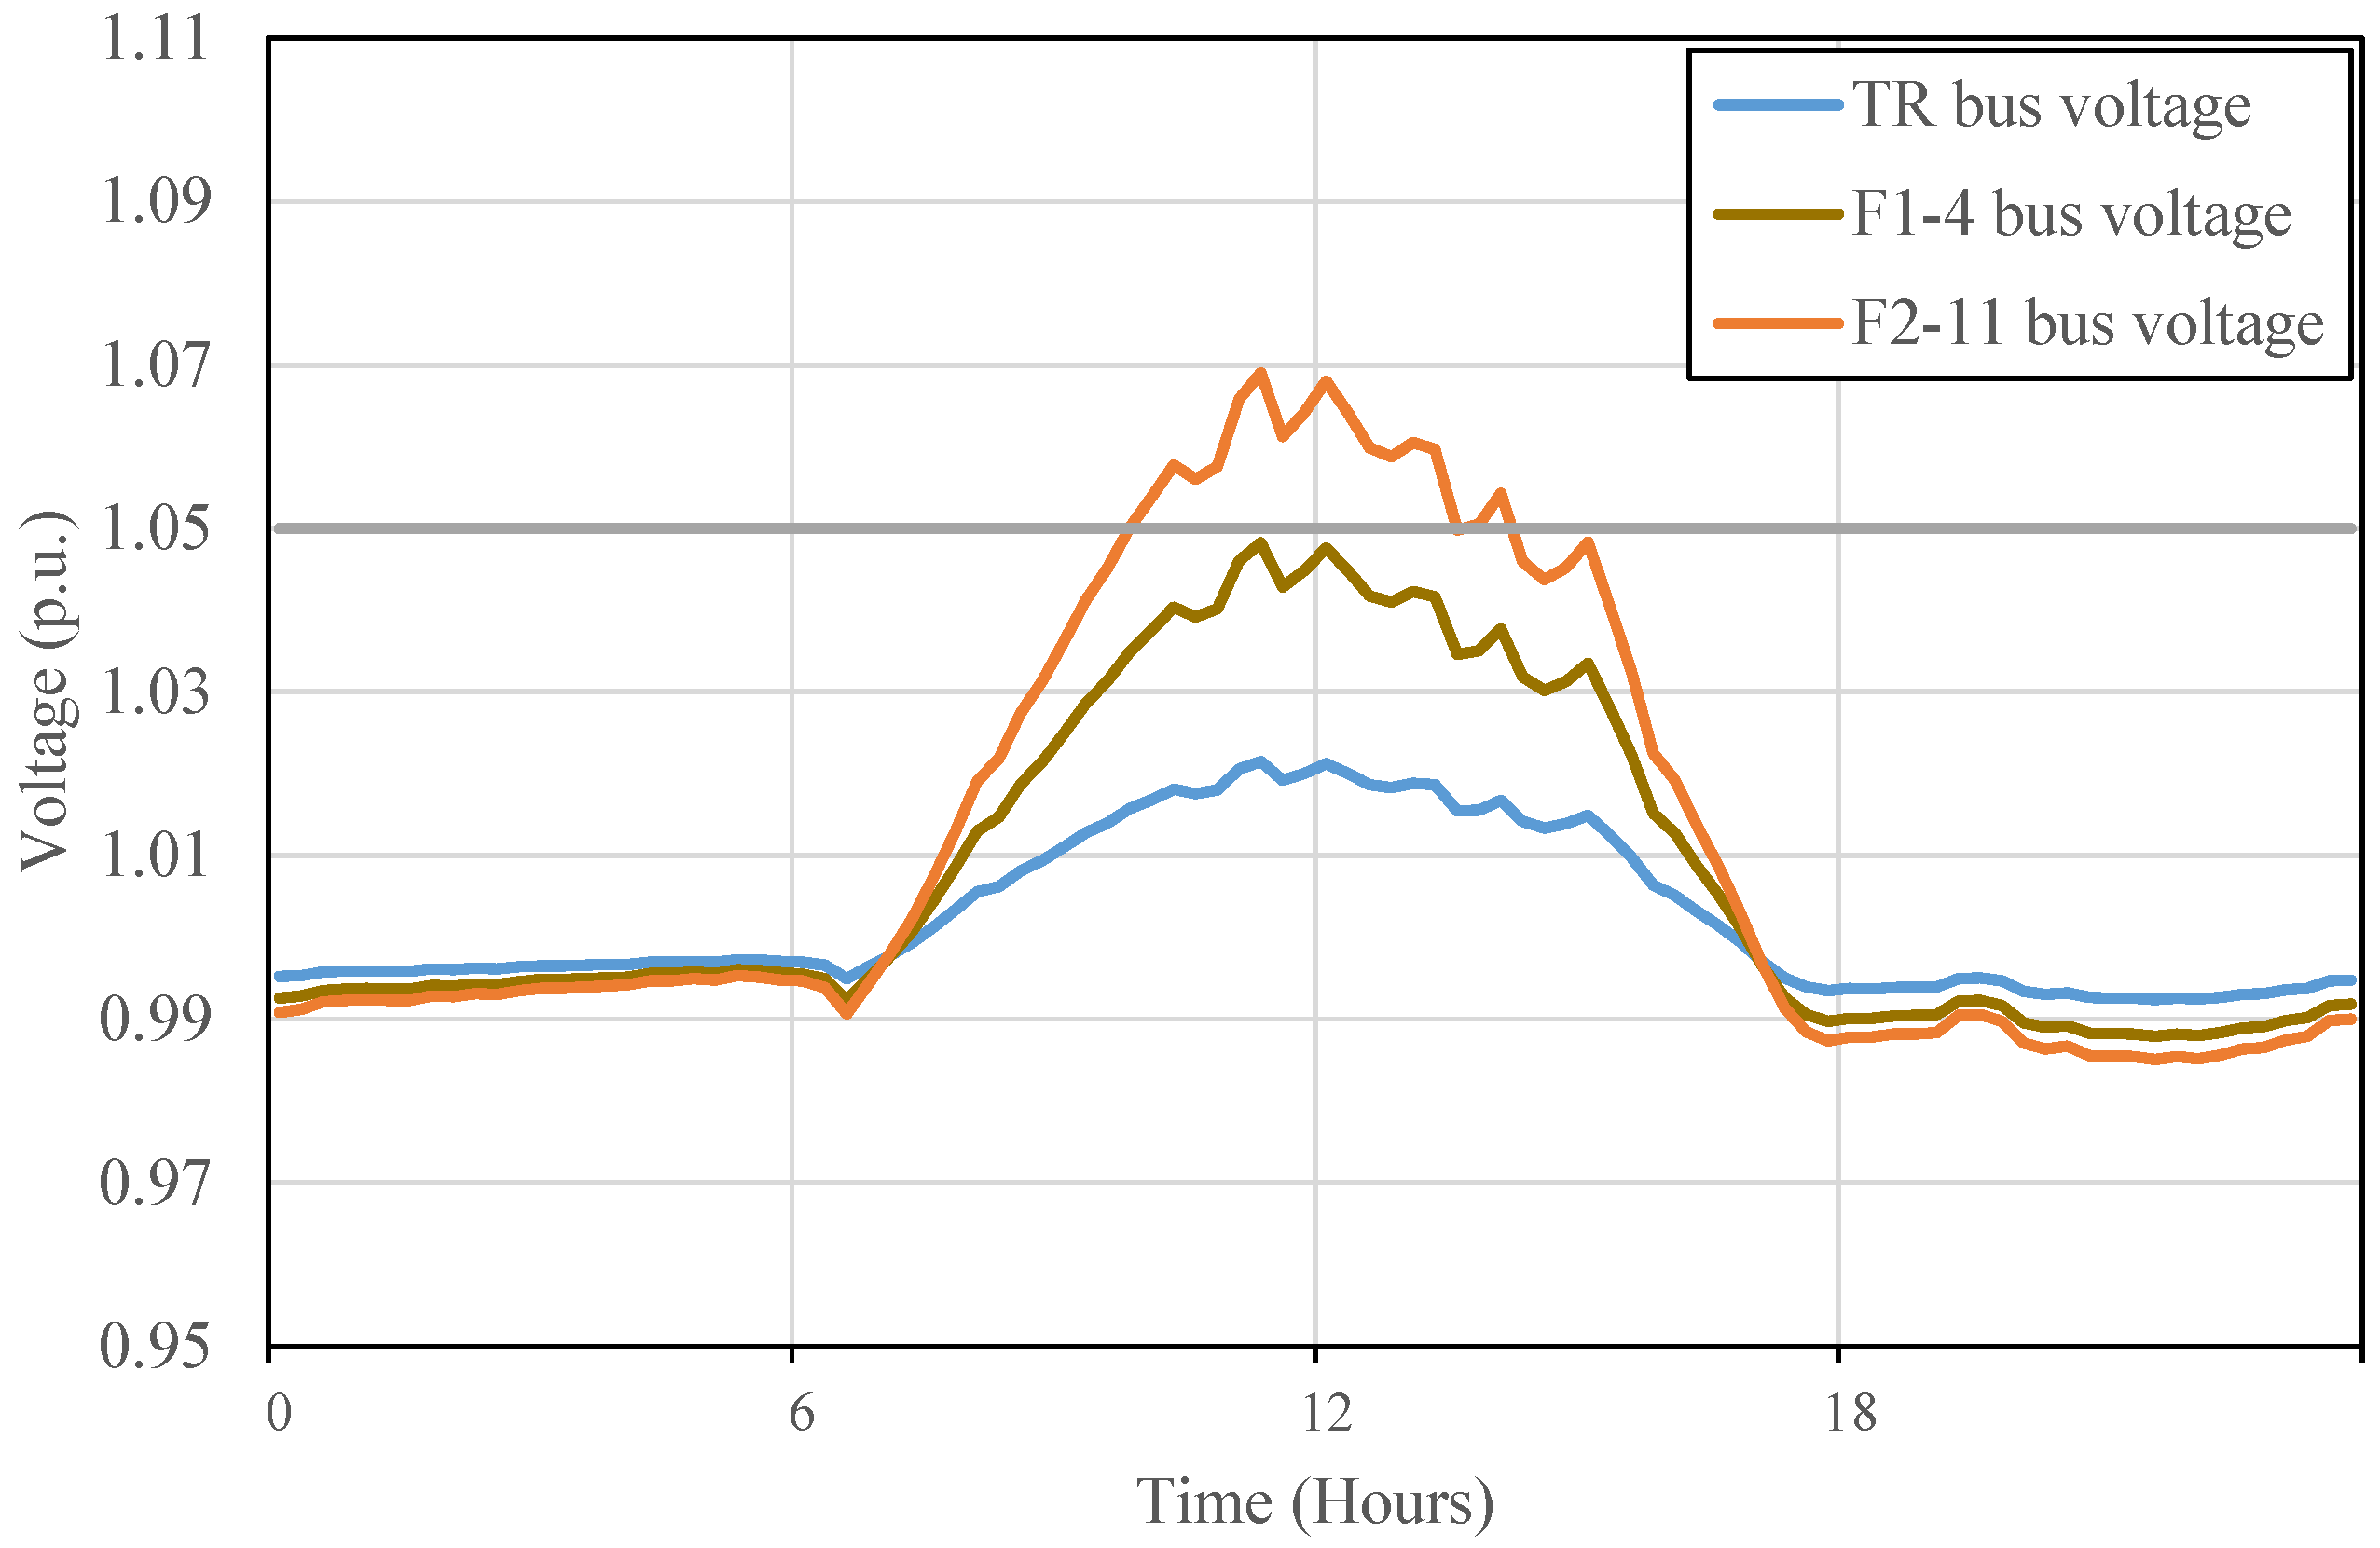
3.3. Scenario 3 (Winter/Weekends)

Under the simulation studies for Scenario 3 (operations on weekends during winter), the optimal capacity (capacity to power ratio) of the BESS that prevented voltage rise in the whole network was 469.6 kWh/302.3 kW when the BESS was installed at the TR bus. To maintain the grid voltage within the limits, the optimum battery capacity was 224.9 kWh/142.8 kW when installed at F1–4, and was 240.4 kWh/134.5 kW when installed at F2–11 (see Table 5). Thus, the BESS required the maximum power to compensate for that high voltage level. There were simulations of the dynamic load flow for 24 h, and all points of the grid voltage profile for the whole day were considered. The results are presented in Figure 11.
Figure 11a presents the grid voltage profile of the LV network under Scenario 3 where the BESS was installed at F1–4; the grid voltage rose to a maximum of about 1.000 p.u. Compared at the TR Bus, the grid voltage rose to maximum of 1.020 p.u.; and at F1–4, the grid voltage rose to a maximum 1.070 p.u. During the nighttime when there was no PV power production, the grid voltage dropped to its lowest at about 0.990 p.u. at the busbar F2–11.
Figure 11b shows a BESS installed at F2–11, where the grid voltage was constant at about 1.000 p.u. The grid voltage profile behavior was inverse compared with that at the previous location of the installation. At F1–4, the voltage rose to a maximum of about 1.055 p.u., which was above the limit, while the lowest voltage was about 0.985 p.u., occurring in nighttime. At the TR bus, the maximum grid voltage was about 1.030 p.u. At F1–4, the maximum grid voltage was higher than the limit by only 0.5%. This can be assumed to be not a significant voltage profile problem. In this scenario (winter/weekends), it was determined that a BESS installed only at F2–11 (237.4 kWh, 130.2 kW) had enough capability to eliminate the voltage problem for this network. This was consistent with the load profile behavior during the winter season when both the ambient temperature and solar radiation were lower compared with summer, referring again to Figure 2. From the characteristic of the weekend voltage profile patterns presented in Figure 5 and Table 4, the lower maximum was about 1.0671. The BESS at the TR bus and at the end of F1–4 and F2–11 had similar results to the previous scenario.

3.4. Scenario 4 (Winter/Weekdays)

For this scenario (weekday operations on winter), the simulation studied a BESS of the size 382.1 kWh/310.0 kW installed at TR bus. A BESS of the size of 185.1 kWh/153.9 kW was installed at F1–4, and a BESS of the size 195.3 kWh/177.8 kW was installed at F2–11 (see Table 5). This scenario showed the case for the smallest BESS power capacity due to lower solar PV generation during winter and lesser load consumption on weekdays. The voltage profiles after BESS installation are shown in Figure 12. BESS at the end of both F1–4 and F2–11 presented ideal voltage profiles for the whole day operation, especially in daytime because of the optimization of load demand for solar power generation.
From the BESS sizes shown in Table 7, to maintain the voltage profile within limits for DS installation, the average difference in percent between Scenarios 3 and 4 for the BESS capacity value (kWh) was about 20% and about 8% for power (kW). There was also about 20% difference in capacity for CS installation at TR, but only 2.5% of BESS power difference was required. This confirmed the difference in energy demand between weekends and weekdays during the winter season. The capacity-to-power ratio of DS was about 2.0:1.5 and 4.0:3.0 for CS. This was similar to the summer season scenario, where two units of BESS at the end of both feeders were equivalent to a single unit of BESS at the TR bus, as found in this case study.
The results of the simulation studies demonstrated that the “Bisection method and sizing algorithm for optimization of BESS solution” can bring out appropriate solutions for every scenario. This is consistent with Kumar et al. [20], mentioned in Section 1.1, who also used the bisection method to meet the estimation of BESS capacity in their study.
The application of P, Q control in BESS, in accordance with charge/discharge operation, kept the voltage profile within the limits. However, the individual BESS installation at the end of each feeder was not able to manage the voltage rise across to another side. This is because the transformer bus, which was implied as an external source, absorbed the power flowing from the PV in the individual feeder. As such, the voltage at the end of another feeder was still high. On the other hand, the BESS at the end of the feeder absorbed the excess power from PV and varied the reactive power (Q) along the feeder that supported the power and voltage levels within limits. Therefore, the best cases for BESS installation were either at the end of individual feeder near where the voltage rise occurred, or at the transformer bus.
The optimal size of the BESS can be expressed by the sizing ratio approach. The relationship between the BESS capacity (kWh) and power (kW) can be plotted using data from Table 6 and Table 7 (Figure 13). In this study, a ratio of capacity 5.0 kWh to power 4.0 kW with a CS installed at the TR bus supported every scenario (red dashed lines). On the other hand, a BESS sizing ratio of capacity 2.5 kWh to power 2.0 kW installed at F1–4 and F2–11 was the best option for DS (blue dashed lines).
The size of a BESS installed at the beginning transformer was about twice the size of individually installed batteries (DS) at the end of each feeder. The sizing ratio of the BESS (capacity-to-power) was a linear relation (Figure 13) and can be applied to estimate the size of batteries for other PEA networks that have similar conditions.
Bianco, G. et al. [18] reported that “…BESS dispatching service strategy is possible to mitigate intermittent VRE generation rather than to use only voltage regulation, by association with the system load forecast and energy exchange profile. When BESS is implemented, there are many issues that should be considered compared to theoretical simulation”. The results in Table 7 show that the commercial BESS products available in the market can be selected by sizing in terms of capacity (kWh) to power (kW) ratio, as this brings out over- or under-sizing. However, what type of BESS to use becomes the next question. Carpinelli, G. et al. [19] addressed in their study that there is the need for an economic study to back up the technical decisions. Thus, future studies will be conducting an analysis of the cost of BESS in addressing the problem of controlling or managing the grid voltage in exchange for the benefits of PV energy generation.

4. Conclusions

The installation of BESS can help to prevent grid voltage profile problems due to the increasing penetration of solar PV generation in low voltage distribution networks. This study proposed and demonstrated the use of an algorithm to determine the optimal battery size and location that can keep the voltage levels within limits.
The algorithm can be used to control the voltage level at 1 p.u. by controlling Q at the focus point and to determine the size of the battery capacity by considering the excess power generation from the solar PV and the Q profile with the battery at SOC working level. The bisection method implemented in this study is basically a numerical method and is a less simulation time-consuming technique. This method is simply a program that varies the constraints and is comparable to linear programming [7,8,9,15] or other optimization algorithms [9,13,15]. Therefore, this method can be practically implemented to preliminarily assess the battery storage system installation in other cases of PEA networks with less effort.
The results of the simulations conducted in this study showed that the best practice to solving voltage rise using a BESS installation was either to install a centralized storage (CS) BESS at the initial distribution transformer or a distributed storage (DS) at the end of the feeders. The size of the BESS installed at the beginning transformer was almost twice the size of individual installed batteries at the end of each feeder. The simulation showed that the highest size of the BESS needed was for the case of the summer/weekend scenario when excess solar PV generation was the highest, and the number of load characteristics was also high. The sizing ratio of BESS, given as the ratio between capacity (kWh) and power (kW), has a linear relation. This can be a simple option to determine the size of the battery in other PEA areas that have a similar network environment.
Finally, the other factors, such as possible installation area, appropriate battery cost in the case of separated small-sized batteries versus big-sized ones, and the number of customers who are willing to participate in the project, should be taken into consideration in conducting a full battery storage system investment evaluation.

Author Contributions

Conceptualization, P.K. and N.K.; methodology, P.K. and N.K.; software, P.K.; validation, P.K., N.K., T.S. and M.K.; formal analysis, P.K., N.K., T.S. and M.K.; writing—original draft preparation, P.K. and N.K.; writing—review and editing, N.K., T.S. and M.K.; visualization, P.K. and N.K.; supervision, N.K. All authors have read and agreed to the published version of the manuscript.

Funding

This research was funded by Provincial Electricity Authority (PEA), Thailand.

Data Availability Statement

Not applicable.

Acknowledgments

The authors would like to thank Provincial Electricity Authority (PEA), Thailand, for financial support as well as the necessary facilities and studied information.

Conflicts of Interest

The authors declare no conflict of interest. The funders had no role in the design of the study; in the collection, analyses, or interpretation of data; in the writing of the manuscript; or in the decision to publish the results.

References

  1. International Renewable Energy Agency (IRENA). REmap: Roadmap for a Renewable Energy Future. 2016 Edition. Available online: http://www.irena.org/publications/2016/Mar/REmap-Roadmap-for-A-Renewable-Energy-Future-2016-Edition (accessed on 23 November 2021).
  2. International Renewable Energy Agency (IRENA). Renewable Power Generation Costs in 2020. Available online: https://www.irena.org/publications/2021/Jun/Renewable-Power-Costs-in-2020 (accessed on 23 November 2021).
  3. Department of Alternative Energy Development and Efficiency (DEDE). Thailand Alternative Energy Development Plan 2018–2037 (AEDP 2018). 2019. Available online: https://policy.asiapacificenergy.org/node/4351 (accessed on 10 December 2021). (In Thai)
  4. Department of Alternative Energy Development and Efficiency (DEDE). Thailand Alternative Energy Situation 2019. Available online: https://www.dede.go.th/download/stat63/Thailand%20Alternative%20Energy%20Situation%202019.pdf (accessed on 10 December 2021). (In Thai)
  5. European Association for Storage of Energy (EASE) and European Energy Research Alliance (EERA). European Energy Storage Technology Development Roadmap, 2017 Update. Available online: https://ease-storage.eu/wp-content/uploads/2017/10/EASE-EERA-Storage-Technology-Development-Roadmap-2017-HR.pdf (accessed on 10 November 2021).
  6. Wei, J.; Zhang, Y.; Wang, J.; Wu, L.; Zhao, P.; Jiang, Z. Decentralized Demand Management Based on Alternating Direction Method of Multipliers Algorithm for Industrial Park with CHP Units and Thermal Storage. J. Mod. Power Syst. Clean Energy 2022, 10, 120–130. [Google Scholar] [CrossRef]
  7. Habib, A.H.; Disfani, V.R.; Kleissl, J.; de Callafon, R.A. Optimal energy storage sizing and residential load scheduling to improve reliability in islanded operation of distribution grids. In Proceedings of the 2017 American Control Conference (ACC), Seattle, WA, USA, 24–26 May 2017; pp. 3974–3979. [Google Scholar] [CrossRef]
  8. Dominguez, O.D.M.; Kasmaei, M.P.; Lavorato, M.; Mantovani, J.R.S. Optimal siting and sizing of renewable energy sources, storage devices, and reactive support devices to obtain a sustainable electrical distribution system. Energy Syst. 2018, 9, 529–550. [Google Scholar] [CrossRef] [Green Version]
  9. Babacan, O.; Torre, W.; Kleissl, J. Siting and sizing of distributed energy storage to mitigate voltage impact by solar PV in distribution systems. Sol. Energy 2017, 146, 199–208. [Google Scholar] [CrossRef]
  10. Ma, Y.; Azuatalam, D.; Power, T.; Chapman, A.C.; Verbic, G. A novel probabilistic framework to study the impact of photovoltaic-battery systems on low-voltage distribution networks. Appl. Energ. 2019, 254, 113669. [Google Scholar] [CrossRef]
  11. Zeraati, M.; Golshan, M.E.H.; Guerrero, J.M. Distributed control of battery energy storage systems for voltage regulation in distribution networks with high PV penetration. IEEE T. Smart Grid. 2018, 9, 3582–3593. [Google Scholar] [CrossRef] [Green Version]
  12. Marra, F.; Fawzy, Y.T.; Bülo, T.; Blažic, B. Energy storage options for voltage support in low-voltage grids with high penetration of photovoltaic. In Proceedings of the 2012 3rd IEEE PES Innovative Smart Grid Technologies Europe (ISGT Europe), Berlin, Germany, 14–17 October 2012; pp. 1–7. [Google Scholar] [CrossRef]
  13. Khaboot, N.; Chatthaworn, R.; Siritaratiwat, A.; Surawanitkun, C.; Khunkitti, P. Increasing PV penetration level in low voltage distribution system using optimal installation and operation of battery energy storage. Cogent Eng. 2019, 6, 1641911. [Google Scholar] [CrossRef]
  14. Katsanevakis, M.; Stewart, R.A.; Lu, J. Energy storage system utilisation to increase photovoltaic penetration in low voltage distribution feeders. J. Energy Storage 2017, 14, 329–347. [Google Scholar] [CrossRef]
  15. Jannesar, M.R.; Sedighi, A.; Savaghebi, M.; Guerrero, J.M. Optimal placement, sizing, and daily charge/discharge of battery energy storage in low voltage distribution network with high photovoltaic penetration. Appl. Energy 2018, 226, 957–966. [Google Scholar] [CrossRef] [Green Version]
  16. Yang, Y.; Li, H.; Aichhorn, A.; Zheng, J.; Greenleaf, M. Sizing strategy of distributed battery storage system with high penetration of photovoltaic for voltage regulation and peak load shaving. IEEE Trans. Smart Grid. 2014, 5, 982–991. [Google Scholar] [CrossRef]
  17. Teja, S.C.; Yemula, P.K. Energy management of grid connected rooftop solar system with battery storage. In Proceedings of the 2016 IEEE Innovative Smart Grid Technologies—Asia (ISGT-Asia), Melbourne, Australia, 28 November–1 December 2016; pp. 1195–1200. [Google Scholar] [CrossRef]
  18. Bianco, G.; Noce, C.; Sapienza, G. Enel Distribuzione projects for renewable energy sources integration in distribution grid. Electr. Power Syst. Res. 2015, 120, 118–127. [Google Scholar] [CrossRef]
  19. Carpinelli, G.; Mottola, F.; Noce, C.; Russo, A.; Varilone, P. A new hybrid approach using the simultaneous perturbation stochastic approximation method for the optimal allocation of electrical energy storage systems. Energies 2018, 11, 1505. [Google Scholar] [CrossRef] [Green Version]
  20. Kumar, N.; Kumar, T.; Nema, S.; Thakur, T. A comprehensive planning framework for electric vehicles fast charging station assisted by solar and battery based on Queueing theory and non-dominated sorting genetic algorithm-II in a co-ordinated transportation and power network. J. Energy Storage 2022, 49, 104180. [Google Scholar] [CrossRef]
  21. Oxford Reference. Bisection method. In The Concise Oxford Dictionary of Mathematics, 4th ed.; Oxford University Press: Oxford, UK, 2009; Available online: https://www.oxfordreference.com/view/10.1093/oi/authority.20110803095508396 (accessed on 16 March 2021).
  22. Go, S.-I.; Yun, S.-Y.; Ahn, S.-J.; Choi, J.-H. Voltage and Reactive Power Optimization Using a Simplified Linear Equations at Distribution Networks with DG. Energies 2020, 13, 3334. [Google Scholar] [CrossRef]
  23. Sechilariu, M. Intelligent Energy Management of Electrical Power Systems. Appl. Sci. 2020, 10, 2951. [Google Scholar] [CrossRef] [Green Version]
  24. Abuagreb, M.; Beleed, H.; Johnson, B.K. Energy Management of a Battery Combined with PV Generation. In Proceedings of the 2019 North American Power Symposium (NAPS), Wichita, KS, USA, 13–15 October 2019; pp. 1–6. [Google Scholar] [CrossRef]
  25. DIgSILENT Power System Solution. Available online: https://www.digsilent.de/en/powerfactory.html (accessed on 6 February 2023).
  26. Provincial Electricity Authority (PEA). Provincial Electricity Authority’s Regulation on the Power Network System Interconnection Code, B.E.2559. 2016. Available online: https://www.pea.co.th/Portals/0/Document/vspp/PEA%20Interconnection%20Code%202016.pdf (accessed on 10 July 2021).
  27. ASEAN Centre for Energy (ACE); Deutsche Gesellschaft für Internationale Zusammenarbeit (GIZ) GmbH. Recommendation Report: Technical Requirements for Renewable Energy Generation Connected to the Distribution Grids in Indonesia, Malaysia and Thailand. 2018. Available online: http://go.aseanenergy.org/kMlGb (accessed on 10 July 2021).
  28. Kitworawut, P.; Ketjoy, N. The analysis framework for high penetration PV rooftop in LV distribution network: Case study provincial electricity authority. GMSARN Int. J. 2021, 15, 326–330. [Google Scholar]
  29. Tomic, S.; Beko, M. A bisection-based approach for exact target localization in NLOS environments. Signal Process. 2018, 143, 328–335. [Google Scholar] [CrossRef] [Green Version]
  30. Chatzivasileiadi, A.; Ampatzi, E.; Knight, I. Characteristics of electrical energy storage technologies and their applications in buildings. Renew. Sustain. Energy Rev. 2013, 25, 814–830. [Google Scholar] [CrossRef]
Figure 1. Studied low voltage distribution network (transformer 160 kVA, 22 kV/400 V, 88 customers in two main feeders F1–4 and F2–11).
Energies 16 02469 g001
Figure 2. Normalized load and solar PV profile.
Energies 16 02469 g002
Figure 3. Summer/weekend with 5 kW PV rooftop.
Energies 16 02469 g003
Figure 4. Summer/weekday with 5 kW PV rooftop.
Energies 16 02469 g004
Figure 5. Winter/weekend with 5 kW PV rooftop.
Energies 16 02469 g005
Figure 6. Winter/weekday with 5 kW PV rooftop.
Energies 16 02469 g006
Figure 7. Battery sizing algorithm.
Energies 16 02469 g007
Figure 8. Battery capacity calculation process.
Energies 16 02469 g008
Figure 9. Scenario 1 voltage profile after BESS installation at (a) F1–4; (b) F2–11; (c) TR bus and (d) F1–4 and F2–11.
Energies 16 02469 g009
Figure 10. Scenario 2 voltage profile after BESS installation at (a) F1–4; (b) F2–11; (c) TR bus and (d) F1–4 and F2–11.
Energies 16 02469 g010
Figure 11. Scenario 3 voltage profile after BESS installation at (a) F1–4; (b) F2–11; (c) TR bus and (d) F1–4 and F2–11.
Energies 16 02469 g011aEnergies 16 02469 g011b
Figure 12. Scenario 4 voltage profile after BESS installation at (a) F1–4; (b) F2–11; (c) TR bus and (d) F1–4 and F2–11.
Energies 16 02469 g012
Figure 13. BESS energy (kWh) and power (kW) sizing ratio.
Energies 16 02469 g013
Table 1. Overview of BESS application in LV network PV penetration.
RefMax PV/VRE%Limiting FactorSiting ConceptMethodNetwork CharacteristicsObjectives
[7]40% of average loadVoltageDS 1/CS 2Simulation: scheduling based on MILPRadial (10 residential PV rooftop)Increase the reliability
[8]-Voltage
(1.05–0.95 p.u.)
CSSimulation: planning framework on MINLP, MILP implemented in the mathematical language AMPLRadial (135-node)Power quality and economic view
[9]10–50% of loadVoltage (1.00 p.u.)DSSimulation: GA base bi-level and LPRadial (IEEE 8500-Node test feeder)Voltage regulation and economic view
[10]50–100% of loadVoltage (1.05–0.95 p.u.)DSSimulation: probabilistic framework on MCUrbanVoltage regulation, power flow, phase unbalance
[11]-Voltage (1.05–0.95 p.u.)DSSimulation: local droop-based control with Matlab/SimulinkRadial (33 customer with 9 residential PV rooftop)Voltage regulation
[12]0–22% of loadVoltage (1.10–1.00 p.u.)DS/CSSimulation: Matlab/SimulinkRadialVoltage regulation
[13]0–130% of loadVoltage (1.10–0.95 p.u.)CSSimulation: GARadialEMS and economic view
[14]0–70% of loadVoltage (1.06–0.94 p.u.)CSSimulation: DIgSILENT programming language (DPL) scriptsRadialVoltage regulation, transformer loading and economic view
[15]0–93% of loadVoltage (1.04–0.95 p.u.)DSSimulation: GA performed in DIgSILENT and LP run in MATLABRadial (137 residential with 4 PV system)Voltage regulation, reverse power flow and economic view
[16]30–70% of loadVoltage (1.05–0.95 p.u.)DSSimulation: distribution system model in MATLABRadial Voltage regulation, peak shaving and economic view
[17]-PowerDSSimulation: MATLABUrbanEMS and economic view
[18]-PowerCSField implementationRadialVoltage regulation, DG dispatching (energy exchange)
[19]-VoltageDSSimulation: SPSA method and inner algorithm, GARadial (IEEE unbalanced 34-bus test system)Voltage unbalance and economic view
1 DS = Distributed Storage; 2 CS = Centralized Storage.
Table 2. Distribution network information.
NoDistribution Transformer ParametersNameRatedVector GroupPhase
1Distribution Transformer 22 kV/400 VMT3610D160 kVADyn113
NoFeeder and Customer DetailsNo. CustomerOverall Length (km)
1Feeder 1450.7736
2Feeder 2430.6513
NoLine ParameterPhaseIrate (kA)Z (ohm)R (ohm)X (ohm)
1UEL330.10.8740.86640.1149
2UL3H95W30.2350.50640.38530.3286
3UL3H50W30.1530.84660.7710.3498
4UL2H50W20.1530.84060.77080.3353
Table 3. Load and PV inverter configurations.
NoComponentModePower Factor
1LoadP, cos φ0.90
2PV inverterP, cos φ0.95
Table 4. The studied scenarios.
ScenariosConditionMaximum Voltage Profile Excess (p.u.)
TR BusEnd of Feeder 1End of Feeder 2
1Summer/Weekend1.02691.06251.0897
2Summer/Weekday1.02711.06281.0902
3Winter/Weekend1.02081.04691.0671
4Winter/Weekday1.02151.04831.0690
Note: Summer is in April, winter is in December. Weekends are Saturday and Sunday; weekdays are Monday to Friday.
Table 5. Optimal battery storage.
ScenariosOptimal Battery Storage Size (kWh, kW) and Location Installation
F1–4F2–11TR busF1–4/F2–11
1264.8 kWh, 191.9 kW280.4 kWh, 178.3 kW542.5 kWh, 407.0 kW264.8 kWh, 196.3 kW/
280.4 kWh, 184.9 kW
2253.8 kWh, 193.0 kW266.7 kWh, 179.4 kW513.5 kWh, 407.0 kW253.8 kWh, 197.4 kW/
264.8 kWh, 186.0 kW
3224.9 kWh, 139.8 kW237.4 kWh, 130.2 kW469.6 kWh, 302.3 kW224.9 kWh, 142.8 kW/
240.4 kWh, 134.5 kW
4185.1 kWh, 143.4 kW196.0 kWh, 133.8 kW382.1 kWh, 310.0 kW185.1 kWh, 153.9 kW/
195.3 kWh, 177.8 kW
Table 6. Absolute percentage difference and ratio of BESS size between Scenario 1 and 2.
ScenariosOptimal Battery Storage Size (kWh, kW) and Location Installation
F1–4F2–11TR busF1–4/F2–11
1264.8 kWh, 191.9 kW280.4 kWh, 178.3 kW542.5 kWh, 407.0 kW264.8 kWh, 196.3 kW/
280.4 kWh, 184.9 kW
2253.8 kWh, 193.0 kW266.7 kWh, 179.4 kW513.5 kWh, 407.0 kW253.8 kWh, 197.4 kW/
264.8 kWh, 186.0 kW
Difference (%)4.2, 0.65.0, 0.65.5, 0.04.2, 0.6/
5.7, 0.6
Capacity (kWh) to power (kW) ratio2.6:1.92.7:1.85.3:4.12.6:2.0/
2.7:1.9
Table 7. Absolute percent different and ratio of BESS size between Scenarios 3 and 4.
ScenariosOptimal Battery Storage Size (kWh, kW) and Location Installation
F1–4F2–11TR busF1–4/F2–11
3224.9 kWh, 139.8 kW237.4 kWh, 130.2 kW469.6 kWh, 302.3 kW224.9 kWh, 142.8 kW/
240.4 kWh, 134.5 kW
4185.1 kWh, 143.4 kW196.0 kWh, 133.8 kW382.1 kWh, 310.0 kW185.1 kWh, 153.9 kW/
195.3 kWh, 177.8 kW
Difference (%)19.4, 2.519.1, 2.720.5, 2.519.4, 7.5/
20.7, 27.7
Capacity (kWh) to power (kW) ratio2.1:1.42.2:1.34.3:3.12.1:1.5/
2.2:1.6
Disclaimer/Publisher’s Note: The statements, opinions and data contained in all publications are solely those of the individual author(s) and contributor(s) and not of MDPI and/or the editor(s). MDPI and/or the editor(s) disclaim responsibility for any injury to people or property resulting from any ideas, methods, instructions or products referred to in the content.

