Article

A Study on the Control System of Electric Water Heaters for Decarbonization

Department of Mechanical Engineering, Marmara University, Istanbul 34840, Turkey
Energies 2023, 16(5), 2439; https://doi.org/10.3390/en16052439
Submission received: 26 January 2023 / Revised: 21 February 2023 / Accepted: 28 February 2023 / Published: 3 March 2023
(This article belongs to the Special Issue Integrated Energy Systems: Design and Operation Optimization)

Abstract

:
Greenhouse gas (GHG) emissions have significantly increased in recent years as a result of population rise and the increase in the number of residences, with high levels of energy use in homes and household appliances. It is crucial to move the housing industry away from high-carbon sources and toward low-carbon sources in order to minimize greenhouse gas emissions as a precaution. One of the most crucial systems that needs to be provided in order to achieve energy efficiency is the electric water heater (EWH), as they rank among the top electricity consumers. In this study, a double-tank EWH model was developed and simulated at various tank sizes (100 L, 200 L, 300 L and 400 L) and power ratios (1 kW, 2 kW, 3kW and 4 kW) in order to demonstrate energy efficiency. To obtain information for the simulation analysis of the tanks, the hourly water usage of 25 houses was measured. The single-tank and the double-tank models created for this study were both run in the Matlab/Simulink environment with an on-off controller applied, and their energy consumption was compared. Amounts were also determined based on how much energy both tanks consumed. It has been noted that the amount of GHG emissions is also reduced because the double tank uses less energy than the single tank does. The simulation showed that compared to the single tank, the dual tank produced 46.62% less GHG emissions at 45 W power and 47.51% less GHG emissions at 80 W.

Graphical Abstract

1. Introduction

In every area of the economy, there is a significant focus on decreasing energy use and the associated GHG emissions. Every country’s attempts to reduce energy consumption are centered on both the residential and building sectors because they consume a significant amount of energy globally [1]. To evaluate the techno-economic effects of adopting energy efficiency and renewable energy technologies suited for residential applications, comprehensive models are required because the energy consumption characteristics of the residential sector are complicated and interrelated. Because they produce both direct and indirect emissions, buildings have a significant impact on global GHG emissions. Future energy demand and hourly demand profiles may be considerably impacted by climate change and growing electrification of space and water heating in buildings, which will have an impact on the capacity and GHG emissions of the electric system [2]. Similarly, a study on demand-side decarbonization and electrification is presented in [3]. Researchers concentrated on demand-side decarbonization and examined the final energy mix needed for Japan to achieve 80% GHG reductions by 2050. The model’s findings indicate that in order to reduce emissions by 80%, the share of electricity in final energy usage (also known as the electrification rate) must increase to 37–66% in 2050 from 26% in 2010. The increase in electrification is mostly attributable to the switching from fossil fuel end-use technologies (i.e., oil water heaters, oil stoves and combustion-engine vehicles) to electricity end-use technologies (i.e., heat pump water heaters and electric vehicles). The results of this study [3] indicate that large reductions in CO2 emissions are required on both the supply and demand sides in order to meet the long-term reduction objective. In this modeling comparison, the demand-side emissions are reduced by around 70% under the scenario that is consistent with Japan’s Nationally Determined Contribution and the mid-century approach.
Residential energy consumption accounts for 16–50% of total national energy consumption and 30% of global energy consumption on average. In Turkey, the residential sector accounts for 31% of total energy consumption [4]. Although a multifaceted strategy is necessary to completely decarbonize our societies, it is commonly agreed that the energy supply sector must play a significant role. Not just because it is the biggest source of GHG emissions in the European Union (EU) [5], but more so because of its exceptional capacity to replace fossil fuels with renewable alternatives for the production of power. The severe negative effects of conventional energy use from fossil fuels on the physical and social spheres have sped up the deployment of low-carbon and renewable energy sources. The primary force behind the decarbonization of the building sector, according to the International Energy Agency (IEA), is electrification [6]. However, in 2018, fossil fuels accounted for 47.55% of total home energy use in the EU-28. Therefore, it is necessary to apply existing technology widely and immediately to increase building electrification. The power consumption of home appliances and continuous energy usage of residential structures have become major issues in recent years due to the increasing load density in the housing industry. By using either decarbonized electricity sources alone or in combination with natural gas sources as fuel, there is a lot of potential for building decarbonization [7,8,9].
Buildings consume around 40% of the energy used in their construction, operation, and use and contribute more than one-third of the equivalent direct and indirect GHG emissions [10]. According to another study, one of the biggest energy consumers in a typical domestic household are EWHs. Water heating accounts for 14%, 18% and 23% of the total residential load in nations such as the EU, the United States (US) and Australia, respectively [11]. Utilizing energy-efficient or renewable energy technology, for putting on objective water heating, may contribute to reducing the magnitude of the energy crisis. Therefore, this will result in lower energy costs and consumption, lessening the impact of rising energy prices on consumers. Building electrification has received attention from several researchers as a potential decarbonization strategy [7,12,13,14,15], with an emphasis on electric heat pump technologies [12,15] and electric resistances [16,17,18]. Research has focused much more on the former than the latter, particularly on the heating service [2,15] as opposed to water heating in homes [16,17,18,19] up to the present. Resistance water heaters were the least expensive options, coming in second to oil-fueled technologies, according to an examination of tankless and storage EWHs at the household level in [19]. Nevertheless, only one water heater configuration was employed in the investigation and changing power rates were disregarded. On the other hand, M. Casanovas-Rubio and J. Armengou [17] included fluctuating power rates in the research and came to similar conclusions for EWHs. In this study, a single water heater setup and occupant behavior were examined. In a study [20], a review of advancements and research into various water heating devices is presented. EWHs, passive and active solar water heating systems, heat pumps, geothermal water heating systems, photovoltaic/thermal water heating systems, gas-fired tankless water heating systems, biomass water heating systems and oil-fired water heating systems are some of these technologies. Electric water tanks were the lowest performers, according to a cradle-to-cradle analysis of various different water heating methods by Liu et al. [16]. However, the authors noted that the large proportion of fossil fuels in the electrical combination was to blame for such bad environmental outcomes. In fact, compared to other options, electric water tanks were shown to have the lowest end-of-life environmental effect on material and product use.
Approximately half of the energy used by a typical household may be used by conventional water heaters. This excessive energy usage is mostly caused by old, inefficient electric storage tank water heating systems as well as a lack of energy-efficient activities. The majority of the elements related to energy management and design have been the subject of research and development on new, more energy-efficient water heating systems. The energy consumption and load management of these water heating systems have also undergone considerable changes as a result of studies on heat loss reduction and optimization [20]. Geglio et al. [21] calculate how much residential energy and water use contributes to overall water use and greenhouse gas emissions. To determine the net GHG emission levels represented as carbon dioxide equivalent (CO2e) and water consumption levels of home appliances for various supply- and demand-side scenarios, they create an extensive spreadsheet-based input-output model. According to their estimates using the national average emission factor for the US, using a baseline EWH would result in annual CO2 emissions savings of 1443 kg compared to using a baseline natural gas water heater of 13 kg. The difference between natural gas and total electricity was close to the findings of a prior study, which indicated annual CO2 reductions of 105 kg per family in California. A comprehensive simulation study of aggregate EWH load is reported in a paper by Nehrir et al. [22]. According to simulation studies, the voltage provided to the EWHs can be significantly reduced without noticeably degrading customer service. This would reduce the overall peak power consumption for EWHs. Peak power reduction could also be attained by regulating the EWH element power during peak-load hours by raising the resistance of the heating element or by briefly turning the element off. The simulation findings show that reducing the heating element power of the EWHs can reduce (or restrict) their power usage during peak-load hours.
On the other hand, consumers want to use less energy so they can cut costs while maintaining user comfort (water being hot when needed) [23]. Water heaters compete for access to the heating medium in the load-spreading strategy proposed by Roux et al. [23]. Moreover, individual user comfort, grid load limits, real-time temperature readings, water usage trends and heater meta-data are all taken into account by the suggested smart grid solution. The programmer only turns on the heaters with the highest demand but limits the number of heaters turned on to ensure that the mains load remains below a certain limit for a certain period of time. The approach is assessed using simulations for a range of load restrictions and heater set temperature levels, and it is contrasted with ripple control and real consumption data from a field study involving 34 water heaters. By using the suggested algorithm, the load is decreased from 62 kW to 20, 30, 40 and 50 kW (vs. 106 kW for full ripple control). The total energy from a user-optimized natural experiment is reduced by 14%, and the number of undesirable cold events is less than for ripple control and hardly more than for no control. Xiang et al. [24] developed a control method that is proposed to control domestic electric water heaters (DEWHs) without temperature information. Based on the patterns of DEWHs, a time-varying weight matrix is created, and the weight matrix and states of the DEWHs can be used to estimate their temperatures. A customer satisfaction prediction index is created using the weight matrix and heating times and can be used as a guide during direct load control. To ensure end-user comfort, the index can be utilized to decide which DEWHs to switch off or back on. Only the on-off states of DEWHs, which are already present in practice, are required for the suggested technique. Results from simulations show that the suggested strategy can successfully lower peak demand without compromising end-user comfort.
The literature has a wide variety of models and experimental data that attempt to characterize EWHs. A physics-based, one- and two-node transitioning model for EWHs was presented by Diao et al. in [25]. The one-node (or single mass) model from Dolan et al. [26] and the two-node (or two-mass) model from Kondoh et al. [27] are two additional models that are included. The single-node model assumes that the entire body of water inside the tank is at a homogeneous temperature. The two-node model separates the total tank volume into two independent isothermal volumes—the higher, warmer epilimnion and the lower, cooler hypolimnion. The thermocline is a layer that separates them. When a significant water withdrawal event takes place, the transitional model switches from the one-node model to the two-node model and forecasts the vertical position of the thermocline. This attempts to simulate the impact of thermal stratification to some extent. A comparable one- and two-node transitioning model was utilized by Engelbrecht et al. [28] to establish the ideal scheduling and heating control solutions. In their two-node model, Kondoh et al. [27] focus on the direct control of EWHs to adjust their power consumption to follow regulation signals. First, an energy balance-aware simulation model of a dual-element EWH was created. The measured average load profile was then used to estimate the hot water demand for each EWH. The control strategy for EWHs for regulation was then put out. The next step involved numerically simulating the operation of EWHs and evaluating their controllable power usage. The findings showed that 33,000 EWHs are needed for the suggested control scheme in order for the whole day (24 h) regulation to apply to 2 MW bi-directional regulatory signals. The regulation’s bottleneck occurs between 0:00 and 6:00 when there is the least amount of energy use. The other 18 h regulation will need 20,000 EWHs if the regulation throughout the period is not necessary. To simulate the transient behavior of a vertical EWH at various tank areas, Xu et al. [29] created a partial differential equation model. A total of 250 h of experimental data were collected using a setup with six digital sensors: two at the inlet and outflow and four uniformly spaced throughout the tank (from top to bottom). These data were used to validate the model. Additionally, the ambient temperature and water flow rate were measured. According to the validation results, the proposed model performs superbly and serves as a useful benchmark for simulating a sizable population of EWHs for the testing of demand response controls. Tahiri et. al. [30], in order to lower the return temperatures in domestic hot water tanks with a circulation loop, developed two new control approaches that are presented in this study. With measured data from a residential structure in Hillerod, Denmark, the authors constructed and verified a dynamic model and examined the effectiveness of the control principles using real domestic hot water tapping profiles. Finally, the phased control technique was put to the test in the field by the authors, who then compared the outcome to a standard conventional control. The results signified from the analysis of the new charging control confirm that the implementation of the new charging concept resulted in 7 °C lower district heating return temperatures on average and district heating flow savings of 23.6%.
The novelty and objectives of the study are as follows:
(i)
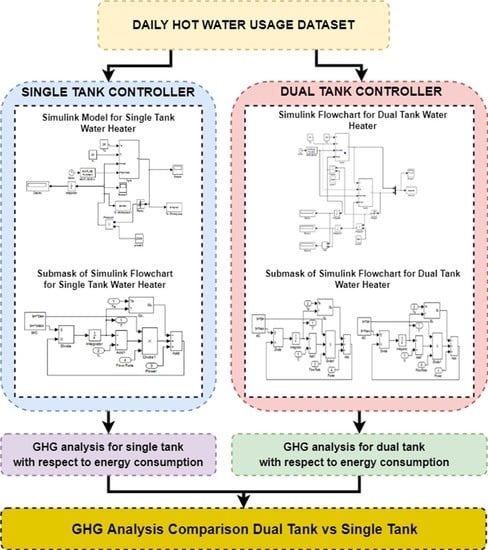
A comprehensive hot water consumption profile in terms of time and number of participants was used in the simulation of the single- and dual-tank models;
(ii)
Dual-tank and single-tank energy consumptions are calculated at different tank sizes and power ratios and the energy consumptions of the dual tank and single tank are compared;
(iii)
GHG emissions of tanks were calculated and compared using dual-tank and single-tank energy consumptions.

2. Materials and Methods

2.1. Hot Water Use Profile

Water consumption models that illustrate the daily hot water use of households by hour are necessary for assessing the effectiveness of EWHs. There are several studies that offer a substantial amount of information on home hot water usage trends [31,32,33,34]. According to statistical research, the daily range of hourly averages for hot water usage is rather large [35,36]. To compare and develop water heaters for best energy efficiency, analyzed and defined data are used [37].
In this study, data were collected by measuring the hourly water consumption of households to be used in the simulation analysis of the tanks. The 24 h hot water consumption data of 25 households were recorded for 6 months between October and March, covering the fall and winter seasons. In Figure 1, the data collected throughout the day for 6 months are averaged to obtain a water consumption profile showing the average hot water consumption which consists of 3 family members (nuclear family) around the clock. The water consumption profile was used in simulation studies of tank models in the MATLAB/Simulink platform.
Two significant consumption peaks may be seen in the daily home hot water consumption profile, which typically happen in the morning and evening. This is due to the fact that people often use more water in the morning when they wake up, in the afternoon when they go home from work or school and in the evening before going to bed.

2.2. Single-Tank and Dual-Tank Modeling and Control

In this study, as shown in Figure 2, the single-tank EWH was modeled as a homogenous tank with a single electric heating part.
These EWHs were modeled as steel tanks with 50 mm of fiber glass insulation on the outside and 2 mm thick fiber glass walls inside [38]. The relationship between the outer surface area and volume for each tank was roughly calculated as Equation (1).
A = 6   V 2 / 3
By assuming that the height to diameter ratio is 2 and expecting a 10% increase in the outer surface area due to the thickness of the insulation.
Then, the heat loss from the tank surface is calculated using Equation (2) [39].
Q l o s s = U A T T a
In this equation, U is the total heat transfer coefficient, A is the surface area of the tank, T is the temperature of the hot water in the relevant section inside the tank and T a is the ambient air temperature, which was used as 20 °C [40,41]. The incoming water temperature was used as 15 °C in the calculations.
Then, the energy change and its calculation are given in Equation (3) [39,40,41].
ρ V C p d T d t = P + m ˙ C p T i T A U T T a
In Equation (3), where ρ is the water density, V is the volume of the tank, C p is the specific heat of the water under constant pressure, T is the temperature of hot water in the tank, t is time, m ˙ is the hot water flow rate, T i and T a are the temperatures of the incoming cold water and ambient temperature, respectively [40,41].
In this study as shown in Figure 3, the dual-tank EWH was two tanks connected in series. The dual tank has identical total volume capacities and power ratings equivalent to single-tank EWHs.
To obtain the overall EWH volumes and power ratings ( V = V 1 + V 2 and P = P 1 + P 2 ), the two tanks’ individual volumes and power ratings were added. Each tank’s volume and power rating were adjusted for maximal hot water delivery and the greatest possible energy-saving arrangement. For the first and second tanks, the transient energy balances are given in Equations (4) and (5).
ρ V 1 C p d T 1 d t = P 1 + m ˙ C p T i T 1 A 1 U T 1 T a
ρ V 2 C p d T 2 d t = P 2 + m ˙ C p T 1 T 2 A 2 U T 2 T a
where m ˙ is the hot water flow rate, T 1 and T 2 are the hot water tank sections 1 and 2’s respective temperatures, A 1 and A 2 are the corresponding surface areas of the sections. It should be underlined that the second tank is the tank where hot water is provided. Therefore, the second tank temperature, T 2 , is crucial.
The total tank sizes for the simulation EWHs’ single tank and dual tank were determined to be 100, 200, 300 and 400 L. During optimization, power ratings of 1, 2, 3 and 4 kW were applied to each tank.
In order to determine the maximum daily amount of hot water that can be produced for each tank volume and power rating, parametric optimization was carried out on single-tank EWHs.
For the dual tank consisting of two sections, the volume of the upper section was chosen as 25% of the total volume, and the power of the upper heater was chosen as 75% of the total power.
The temperature of the hot water in the heater was accepted as 60 °C at the start of each optimization and it was kept between 60 and 65 °C during the optimization according to ANSI standards. The temperatures were kept in this range using an on-off thermostatic controller.

2.3. Emission Calculation Using Electricity Consumption

In order to compare the greenhouse gas emissions of single- and dual-tank water heaters, it is necessary to calculate the carbon emission using energy consumption amounts. For the electricity required to run any appliance, there is the amount of GHG emitted during electricity generation from fossil fuels. To estimate the amount of this greenhouse gas, the emission factors and the characteristics of each type of fuel mixture (coal, gas, oil, etc.) are used. The rate of electricity it generates must be taken into account [4]. The carbon dioxide and other emissions per unit of electricity generation also depend on the characteristics of the fuel and the power plant and are offered on a country-specific basis. In their study, Ureden and Ozden [42] gave the equation used in the calculation of emissions from electricity consumption. In this study, the emission amount for EWHs is estimated based on this equation. The formula used for calculating the amount of emissions from electricity consumption is given in Equation (9) [43,44,45,46].
E k g C O 2 y e a r = F V k W h y e a r × E F k g C O 2 k W h × T & D L % + F V k W h y e a r × E F k g C O 2 k W h
where: E k g C O 2 y e a r is Emission kg of carbon dioxide ( k g C O 2 y e a r ), FV is activity data (kWh/year) total amount of electricity consumed per year, EF is Emission Factor (kg CO2/kWh) (taken as 0.6488 kg CO2/kWh for Turkey and detailed information is obtained from TEİAŞ annual reports) [45,46].
T&DL is transmission and distribution losses (13.8%) (taken as 13.8% on average for Turkey and detailed information is obtained from TEİAŞ annual reports) [45,46].
It is noteworthy to mention that since the FV (kWh/year) data in Equation 1 are used as kWh/day data, the emission amount is calculated as E kg CO2/day in this study.

3. Results

3.1. Tank Simulation and Energy Consumption

Energy consumption results for the single tank were accomplished by implementing the previously given in the equations (2.2. Single-Tank and Dual-Tank Modeling and Control) and distributing the hourly hot water production according to the daily total hot water consumption pattern.
The energy required to provide the desired amount of hot water outputs for single and dual tanks was calculated and is shown in Figure 4 for various tank volumes and power ratings.
Figure 4 shows that even for the same power value and the same hot water output, the energy required per liter of hot water increases with the tank size in a single-tank simulation. Less energy is needed per liter of hot water in smaller tanks, but the amount of hot water produced is lower.
In the dual tank, the required energy per liter of hot water decreases with tank size, even for the same power rating and hot water output, as seen in Figure 4. Smaller tanks provide less hot water for everyday use and consume more energy per liter of heated water.
The dual-tank EWH compared to the single-tank EWH with on-off control performed an average of 12.4% at 1 kW, an average of 6.2% at 2 kW, an average of 4.1% at 3 kW and an average of 3% at 4 kW lower energy consumption. Especially for lower power rates and a tank volume of 400 L, the dual-tank EWH produced more hot water. In the dual-tank EWH with on-off control, the energy consumption is very low, except for a tank size of 100 L. In particular, at a power rating of 1 kW with a 400 L tank size, the dual tank consumed 24% less energy than the single tank.

3.2. Energy Analyses during Heating Period

According to the mentioned control mechanisms, heaters are controlled at time ‘t’ according to the flow rate at time ‘t + 1’ and the possible temperature values at time ‘t + 1’ are checked. When both heaters are “on” at time “t,” if the water temperature in the second tank “T” is below 65 °C at time “t + 1,” the heaters stay “on”. The first heater, which has a lower power rating, turns off first and the second heater heats the tank if the temperature at time t + 1 tends to rise above 65 °C. The second heater with the higher power rating turns “off” and the first heater heats the tank if the temperature at time t + 1 is higher than 65 °C. This process continues until the second tank achieves a temperature of 65 °C.
The heaters start cooling again when the water in the second tank reaches a temperature higher than 65 °C. We once again examine the temperature change at t + 1 to ensure that the cooling and water flow are optimized. Both heaters stay “on” if the temperature tends to drop even when they are both turned on. The second heater stays “on” even though the first heater, which has a lower power rating, turns “off” if the water temperature inside the tank does not drop.
If the temperature does not drop, the first heater stays “on” this time, while the second heater with the greater power ratio turns “off.” The heaters stay in the indicated state even if cooling occurs. If not, the tank is permitted to cool while both heaters are turned “off”. As a result, even though the water temperature can drop, it does so gradually. However, this led to a significant rise in energy consumption and had little to no impact on the flow rate. Stratification is crucial at this point. Water and energy will be wasted while waiting for the output temperature to reach 62.5 °C because it will take some time for the water to warm up. This is an energy waster. Transient analysis on ANSYS Fluent was carried out to see how long it took for the outlet water temperature to reach 62.5 °C in order to reduce this energy loss.

3.3. Estimation of Greenhouse Gas Emission

The total energy consumption and greenhouse gas emission value (E kg CO2/day) calculated by operating the single tank and dual tank at ideal power ratios are given in Table 1 and Table 2. The tank size used in the simulation studies is 100 L. As the tank size and liter capacity increase, the water consumption also increases. In addition, as the size of the tank increases, the area to be covered increases. Hence, the experimental studies were carried out on a minimum size of 100 L. Daily greenhouse gas emission (CO2 equivalent) values were calculated according to Equation 1 using the daily energy consumption of the tanks.
Single-tank and dual-tank GHG emission values are compared in Table 3. At all power values, the dual tank has lower GHG emission values than the single tank. This shows that the use of dual tanks in the EWH model can provide a transition from high carbon emission to low carbon emission. In particular, according to the simulation result operated at a power rate of 80 W, the dual tank emitted 47.5% less greenhouse gas emissions than the single tank.
Since the energy consumption is lower in the dual tank model with a 100 L tank size and 45, 50, 65, 75 and 80 W power values compared to the single tank model, the dual-tank GHG emission is also less, hence dual tanks are recommended for decarbonization.

4. Discussion

Figure 4 indicates the energy consumption per liter of hot water of the dual-tank water heater as compared to the single-tank water heater. According to Figure 4, dual-tank water heaters are not more effective than single-tank water heaters for small sizes (100 L or less). The energy consumption for 1 kW power input at 100 L tank size increased by 1.2% for the dual tank compared to the single tank, while the energy consumption of the 400 L tank decreased by 24%. Hence, single-stank EWHs underwent a 23% lower performance compared to dual-tank EWHs with on-off control. However, for an electric power input of 4 kW, the reductions in energy consumption increase by 0.5% at a 100 L tank size and decrease by 6% at a 400 L tank size. The 400 L dual-tank EWHs with on/off control produced more hot water, especially at lower power rates. This indicates that for dual-tank water heaters, a larger tank size with a lower electrical power rating is recommended. At all power ratings, dual-tank EWHs consumed lower energy as well, with the exception of tanks larger than 100 L.
In addition to 100 L, simulations can be carried out at 200, 300 and 400 L at 45, 50, 65, 75 and 80 W.
In the hot water consumption profile used in the study, the average daily water usage amounts cover the months of October–March, that is, the autumn and winter seasons in Turkey. If the water usage amounts for the summer and spring months were added, a slightly different profile would emerge from the current water usage profile. For this reason, a more accurate profile is planned to cover annual consumption as a future study.

5. Conclusions

In this study, the optimum design for an EWH storage type (single-dual tank) model is developed to reduce carbon use and achieve energy efficiency. EWH tank models are simulated with typical daily household use and their energy consumption is compared. Single- and dual-tank EWHs of various tank sizes and power ratings are analyzed using an average hourly hot water usage profile. In order to obtain the optimum design for dual tank EWHs, a model is used where the size of the second tank is 25% of the total tank volume and the power rating is 75% of the total power rating [40]. Single-tank and dual-tank models of the EWH were created and energy consumption amounts were calculated and compared in the simulation environment. When the dual-tank EWH is compared to the single tank water heater, it is found that the dual-tank model provides more hot water per day and consumes less energy throughout the day.
The greenhouse gas emission carbon dioxide equivalent was analyzed and evaluated using the energy consumed by the tanks, the total amount of water consumption and the type of energy source (electricity). According to the calculations, it was found that the dual-tank model emits less carbon dioxide than the single-tank water heater model. According to the simulation results, at all power rates, the dual tank realized 47.1% less greenhouse gas emissions on average than the single tank. The analysis provided an assessment of the carbon footprint and showed that the use of the dualtank model is an effective and economically viable solution to reduce greenhouse gas emissions.

Funding

This research received no external funding.

Data Availability Statement

In this study, hot water heater usage profile data were obtained from Ahmet Feyzioglu’s doctoral thesis study at Marmara University, Institute of Pure and Applied Sciences, Department of Mechanical Engineering.

Conflicts of Interest

The author declares no conflict of interest.

References

  1. Swan, L.G.; Ugursal, V.I. Modeling of end-use energy consumption in the residential sector: A review of modeling techniques. Renew. Sustain. Energy Rev. 2009, 13, 1819–1835. [Google Scholar] [CrossRef]
  2. Tarroja, B.; Chiang, F.; AghaKouchak, A.; Samuelsen, S.; Raghavan, S.V.; Wei, M.; Sun, K.; Hong, T. Translating climate change and heating system electrification impacts on building energy use to future greenhouse gas emissions and electric grid capacity requirements in California. Appl. Energy 2018, 225, 522–534. [Google Scholar] [CrossRef] [Green Version]
  3. Sakamoto, S.; Nagai, Y.; Sugiyama, M.; Fujimori, S.; Kato, E.; Komiyama, R.; Matsuo, Y.; Oshiro, K.; Silva Herran, D. Demand-side decarbonization and electrification: EMF 35 JMIP study. Sustain. Sci. 2021, 16, 395–410. [Google Scholar] [CrossRef]
  4. Saidur, R.; Masjuki, H.H.; Jamaluddin, M.; Ahmed, S. Energy and associated greenhouse gas emissions from household appliances in Malaysia. Energy Policy 2007, 35, 1648–1657. [Google Scholar] [CrossRef]
  5. Greenhouse Gas Emissions by Aggregated Sector. Available online: https://www.eea.europa.eu/data-and-maps/daviz/ghg-emissions-by-aggregated-sector-5#tab-dashboard-02 (accessed on 27 December 2022).
  6. Agency, I.E. Net Zero by 2050 a Roadmap for the Global Energy Sector; International Energy Agency: Paris, France, 2021. [Google Scholar]
  7. Dennis, K. Environmentally beneficial electrification: Electricity as the end-use option. Electr. J. 2015, 28, 100–112. [Google Scholar] [CrossRef] [Green Version]
  8. Munuera, L.; Bradford, J.; Kelly, N.; Hawkes, A. The Role of Energy Efficiency in Decarbonising Heat via Electrification. In Proceedings of the ECEEE 2013 Summer Study on Energy Efficiency, Toulon, France, 3–8 June 2013; pp. 1159–1164. [Google Scholar]
  9. Wei, M.; Nelson, J.H.; Greenblatt, J.B.; Mileva, A.; Johnston, J.; Ting, M.; Yang, C.; Jones, C.; McMahon, J.E.; Kammen, D.M. Deep carbon reductions in California require electrification and integration across economic sectors. Environ. Res. Lett. 2013, 8, 014038. [Google Scholar] [CrossRef]
  10. European Parliament, Council of the European Union. Directive 2010/31/EU of the European Parliament and of the Council of 19 May 2010 on the Energy Performance of Buildings. 2010. Available online: https://eur-lex.europa.eu/legal-content/EN/ALL/?uri=CELEX%3A32010L0031 (accessed on 25 January 2023).
  11. Yildiz, B.; Bilbao, J.I.; Roberts, M.; Heslop, S.; Dore, J.; Bruce, A.; MacGill, I.; Egan, R.J.; Sproul, A.B. Analysis of electricity consumption and thermal storage of domestic electric water heating systems to utilize excess PV generation. Energy 2021, 235, 121325. [Google Scholar] [CrossRef]
  12. Deason, J.; Borgeson, M. Electrification of buildings: Potential, challenges, and outlook. Curr. Sustain. /Renew. Energy Rep. 2019, 6, 131–139. [Google Scholar] [CrossRef]
  13. Leibowicz, B.D.; Lanham, C.M.; Brozynski, M.T.; Vázquez-Canteli, J.R.; Castejón, N.C.; Nagy, Z. Optimal decarbonization pathways for urban residential building energy services. Appl. Energy 2018, 230, 1311–1325. [Google Scholar] [CrossRef]
  14. Mancini, F.; Nastasi, B. Energy retrofitting effects on the energy flexibility of dwellings. Energies 2019, 12, 2788. [Google Scholar] [CrossRef] [Green Version]
  15. Thomaßen, G.; Kavvadias, K.; Navarro, J.P.J. The decarbonisation of the EU heating sector through electrification: A parametric analysis. Energy Policy 2021, 148, 111929. [Google Scholar] [CrossRef]
  16. Liu, W.; Chen, C.; Wu, H.; Guo, C.; Chen, Y.; Liu, W.; Cui, Z. Environmental life cycle assessment and techno-economic analysis of domestic hot water systems in China. Energy Convers. Manag. 2019, 199, 111943. [Google Scholar] [CrossRef]
  17. Del Mar Casanovas-Rubio, M.; Armengou, J. Decision-making tool for the optimal selection of a domestic water-heating system considering economic, environmental and social criteria: Application to Barcelona (Spain). Renew. Sustain. Energy Rev. 2018, 91, 741–753. [Google Scholar] [CrossRef]
  18. Raghavan, S.V.; Wei, M.; Kammen, D.M. Scenarios to decarbonize residential water heating in California. Energy Policy 2017, 109, 441–451. [Google Scholar] [CrossRef] [Green Version]
  19. Keinath, C.M.; Garimella, S. An energy and cost comparison of residential water heating technologies. Energy 2017, 128, 626–633. [Google Scholar] [CrossRef]
  20. Hohne, P.; Kusakana, K.; Numbi, B. A review of water heating technologies: An application to the South African context. Energy Rep. 2019, 5, 1–19. [Google Scholar] [CrossRef]
  21. Geglio, T.; Bradley, T.; Williams, T.; Zhou, S.; Watkins, D.; Minakata, D. Water-and Energy-Efficient Appliances for Circular Water Economy: Conceptual Framework Development and Analysis of Greenhouse Gas Emissions and Water Consumption. ACS EST Eng. 2021, 2, 409–422. [Google Scholar] [CrossRef]
  22. Nehrir, M.H.; Jia, R.; Pierre, D.A.; Hammerstrom, D.J. Power management of aggregate electric water heater loads by voltage control. In Proceedings of the 2007 IEEE Power Engineering Society General Meeting, Tampa, FL, USA, 24–28 June 2007; IEEE: New York, NY, USA, 2007; pp. 1–6. [Google Scholar]
  23. Roux, M.; Apperley, M.; Booysen, M. Comfort, peak load and energy: Centralised control of water heaters for demand-driven prioritisation. Energy Sustain. Dev. 2018, 44, 78–86. [Google Scholar] [CrossRef] [Green Version]
  24. Xiang, S.; Chang, L.; Cao, B.; He, Y.; Zhang, C. A novel domestic electric water heater control method. IEEE Trans. Smart Grid 2019, 11, 3246–3256. [Google Scholar] [CrossRef]
  25. Diao, R.; Lu, S.; Elizondo, M.; Mayhorn, E.; Zhang, Y.; Samaan, N. Electric water heater modeling and control strategies for demand response. In Proceedings of the 2012 IEEE Power and Energy Society General Meeting, San Diego, CA, USA, 22–26 July 2012; IEEE: New York, NY, USA, 2012; pp. 1–8. [Google Scholar]
  26. Dolan, P.; Nehrir, M.; Gerez, V. Development of a Monte Carlo based aggregate model for residential electric water heater loads. Electr. Power Syst. Res. 1996, 36, 29–35. [Google Scholar] [CrossRef]
  27. Kondoh, J.; Lu, N.; Hammerstrom, D.J. An evaluation of the water heater load potential for providing regulation service. In Proceedings of the 2011 IEEE Power and Energy Society General Meeting, Detroit, MI, USA, 24–29 July 2011; IEEE: New York, NY, USA, 2011; pp. 1–8. [Google Scholar]
  28. Engelbrecht, J.; Ritchie, M.J.; Booysen, M. Optimal schedule and temperature control of stratified water heaters. Energy Sustain. Dev. 2021, 62, 67–81. [Google Scholar] [CrossRef]
  29. Xu, Z.; Diao, R.; Lu, S.; Lian, J.; Zhang, Y. Modeling of electric water heaters for demand response: A baseline PDE model. IEEE Trans. Smart Grid 2014, 5, 2203–2210. [Google Scholar] [CrossRef]
  30. Tahiri, A.; Smith, K.M.; Thorsen, J.E.; Hviid, C.A.; Svendsen, S. Staged control of domestic hot water storage tanks to support district heating efficiency. Energy 2023, 263, 125493. [Google Scholar] [CrossRef]
  31. ANSI/ASHRAE Standard 90.2-1993; Energy Efficient Design of Low-Rise Residential Buildings. In Section 8.9.4, Hourly Domestic Hot Water Fraction and Table 8-4, Daily Domestic Hot Water Load Profile; American Society of Heating, Refrigerating and Air-Conditioning Engineers: Atlanta, GA, USA, 1993; pp. 53–54.
  32. Becker, B.; Stogsdill, K. A domestic hot water use database. ASHRAE J. 1990, 32, 21–25. [Google Scholar]
  33. Bouchelle, M.P.; Parker, D.S.; Anello, M. Factors Influencing Water Heating Energy Use and Peak Demand in a Large Scale Residential Monitoring Study; Texas A&M University: College Station, TX, USA, 2000. [Google Scholar]
  34. Perlman, M.; Mills, B. Development of residential hot water use patterns. ASHRAE Trans. 1985, 91, 657–679. [Google Scholar]
  35. Ahmed, K.; Pylsy, P.; Kurnitski, J. Hourly consumption profiles of domestic hot water for different occupant groups in dwellings. Sol. Energy 2016, 137, 516–530. [Google Scholar] [CrossRef]
  36. Fuentes, E.; Arce, L.; Salom, J. A review of domestic hot water consumption profiles for application in systems and buildings energy performance analysis. Renew. Sustain. Energy Rev. 2018, 81, 1530–1547. [Google Scholar] [CrossRef]
  37. Fairey, P.; Parker, D. A Review of Hot Water Draw Profiles Used in Performance Analysis of Residential Domestic Hot Water Systems; Florida Solar Energy Center: Cocoa, FL, USA, 2004; Volume 2. [Google Scholar]
  38. Abdi Hejazi, S. Sizing a storage type water heating system. ASHRAE J. 1989, 31, 35–41. [Google Scholar]
  39. Mínguez, J.M. Water-heaters in series. Int. J. Energy Res. 1987, 11, 145–151. [Google Scholar] [CrossRef]
  40. Feyzioglu, A.; Kar, A.K. Development of Control Strategies and Implementation to Electrical Water Heaters for Energy Conservation. Cybern. Inf. Technol. 2016, 16, 98–112. [Google Scholar] [CrossRef] [Green Version]
  41. Feyzioglu, A. Development of Control Strategies and Implementation to Electrical Water Heaters for Energy Conservation. Ph.D. Thesis, Marmara University, Istanbul, Turkey, 2012. [Google Scholar]
  42. Ureden, A.; Ozden, S. Kurumsal karbon ayak izi nasıl hesaplanır: Teorik bir çalışma. Anadolu Orman Araştırmaları Derg. 2018, 4, 98–108. [Google Scholar]
  43. Holloway, S.; Makoto Akai, A.K.U.; Pipatti, R.; Rypdal, K. 2006 IPCC Guidelines for National Greenhouse Gas Inventories. In Chapter 5 Carbon Dioxide Transport, Injection and Geological Storage; Institute for Global Environmental Strategies (IGES) for the IPCC: Hayama, Japan, 2006. [Google Scholar]
  44. The Greenhouse Gas Protocol; World Business Council for Sustainable Development, World Resources Institute: Washington, DC, USA, 2015.
  45. Türkiye Elektrik Üretim-İletim İstatistikleri. Available online: https://www.teias.gov.tr/turkiye-elektrik-uretim-iletim-istatistikleri (accessed on 17 October 2022).
  46. Türkiye Ulusal Elektrik Şebekesi Emisyon Faktörü; T.C. Enerji ve Tabii Kaynaklar Bakanlığı, Enerji Verimliliği ve Çevre Dairesi Başkanlığı: Ankara, Turkey, 20 September 2022.
Figure 1. Hourly hot water use profile.
Energies 16 02439 g001
Figure 2. Model of a single-tank water heater showing flow rate, energy, temperature and volume.
Energies 16 02439 g002
Figure 3. Model of a dual-tank water heater showing flow rate, energy, temperature and volume.
Energies 16 02439 g003
Figure 4. Energy consumption curves per liter of hot water for different power rates.
Energies 16 02439 g004
Table 1. GHG analysis for the single tank with respect to energy consumption.
Power
Rating (W)
Time WaitedEnergy Consumption (J)Power Consumption (kWh)GHG Emission
(kgCO2/Day)
459.501704.744.74 × 10−47.31 × 10⁻⁴
509.151688.274.69 × 10−47.24 × 10⁻⁴
658.191632.844.54 × 10−47 × 10−4
757.601591.794.42 × 10−46.83 × 10⁻⁴
807.321570.304.36 × 10−46.74 × 10⁻⁴
Table 2. GHG analysis for the dual tank with respect to energy consumption.
Power
Rating (W)
Time WaitedEnergy
Consumption (J)
Power
Consumption (kWh)
GHG Emission
(kgCO2/Day)
455.51910.072.53 × 10−43.90 × 10⁻⁴
505.28899.412.50 × 10−43.86 × 10⁻⁴
654.66863.862.40 × 10−43.71 × 10⁻⁴
754.29837.822.33 × 10−43.59 × 10⁻⁴
804.12824.272.29 × 10−43.54 × 10⁻⁴
Table 3. Dual tank compared to single tank.
Power Rating (W)Dual Tank Compared to Single Tank
4546.62% less
5046.73% less
6547.09% less
7547.37% less
8047.51% less
Disclaimer/Publisher’s Note: The statements, opinions and data contained in all publications are solely those of the individual author(s) and contributor(s) and not of MDPI and/or the editor(s). MDPI and/or the editor(s) disclaim responsibility for any injury to people or property resulting from any ideas, methods, instructions or products referred to in the content.

