Abstract
In recent years, photovoltaic energy has become a popular alternative to traditional fossil fuels due to its renewable and sustainable nature, and the incentives provided by countries to encourage research and development in this field have accelerated the implementation of photovoltaic roofs. One important factor in maximizing the efficiency of solar panels is their orientation to harness maximum irradiation with minimum roof area. In this article, an optimizer-supported east–west-oriented solar power plant installation is experimentally presented to utilize more solar energy with less area compared to wide-area south orientation. Furthermore, an analysis of different angle placements is simulated by PVSOL and PVGIS to test the robustness of the presented approach, and the pros/cons of the features of the east–west and south orientation are discussed comparatively. The obtained results are promising for the ideal placement of solar systems along with the use of optimizers to further enhance their performance, and for the minimization of the economic return of such an investment.
1. Introduction
It is a scientific fact that energy demand is increasing rapidly with the developing technology and increasing population worldwide, and it is a scientific fact that existing resources can only meet this demand for a very short time. In addition, the increase in emissions due to increasing population density and energy demand causes air pollution and climate change [1]. If this environmental impact continues, temperatures around the world will increase, glaciers will melt and sea level rises will occur. In order to avoid such environmental effects and to meet the ever-increasing energy demand around the world, the use of environmentally friendly and clean renewable energy sources has become almost a necessity [2,3,4].
Solar energy is the basis of renewable energy sources. Thanks to the radiation from the sun, electricity is produced in photovoltaic panels [5]. Environmentally friendly and clean renewable energy can be produced with solar panels, and a solar panel is an environmentally friendly piece of equipment since it does not contain any waste and does not contain any harmful substances. In addition, since it is a static piece of equipment, that is, it does not contain moving or rotating parts in its structure, the operating and maintenance costs after installation are very low [6,7,8,9,10].
In recent years, photovoltaic roof applications have gained speed with the increase in the awareness of solar energy and the incentives. Due to factors such as the chimney, antenna, luminous, etc., located in the roof areas, space losses occur [11]. In solar energy systems, the highest efficiency is obtained with the installation in the south orientation. However, in the rooftop solar energy systems installed in the south orientation, the production is low in the first and last hours of the sun [12,13,14,15,16]. In addition, in places where the roof area is limited, a solar energy system with more installed power can be installed in the east–west orientation for the same roof area compared to the south orientation. East–west-oriented systems have been increasing rapidly in recent years in order to increase the power plant installed power in limited roof areas and the production in the first and last hours of the sun [17,18,19,20,21].
Apama Sankar and Anish Kalathil investigated the performance of east–west- and south-oriented photovoltaic systems under the influence of different variables such as season, sun angle, sunshine duration and weather conditions. They compared the real-time data taken every 15 min for the months of March, June, September and December. They found that the east–west-oriented system produced approximately 6% more production in the said months than the south-oriented system. They also revealed that energy production was higher in the morning and afternoon hours in the east–west-oriented system, while it was greater in the middle of the day in the south-oriented system. In this way, they revealed that east–west systems matched the load profile for working longer and better during the day [22].
Christy Etukudor et al. carried out a study to determine the optimum slope and azimuth angles in photovoltaic solar energy systems in South West Nigeria. To see the results of the photovoltaic solar panel at different inclinations and azimuth angles, they set up an experimental setup on the roof of the Department of Electrical and Computer Engineering of Covenant University in Ota, Nigeria. In the measurements made, it was observed that the maximum efficiency was obtained with 49.06 W at 13:00 at 20° inclination and south orientation. As a result, they revealed that the optimum energy efficiency for a photovoltaic solar energy system installation in this region is obtained in the south orientation with a 20° tilt angle [23].
Suman Chowdhury et al. carried out a study to reveal the variation in the performance of building integrated photovoltaic applications with slope and azimuth angle in Bangladeshi geographical conditions. The performance of the simulated building integrated photovoltaic system was investigated by keeping the azimuth angle constant at 0° and changing the inclination angle between 10° and 50° with an angle of 5 degrees. As a result, they found in their study that the performance of building integrated photovoltaic systems is dependent on the angle of inclination rather than the azimuth angle [24].
Amir Asgharzadeh et al. conducted a study on the performance of the use of bifacial panels in horizontal and vertical positions in photovoltaic systems, in multiple locations with different latitudes and weather conditions. In addition, the effects of parameters such as albedo, tilt angle and height on the performance of bifacial photovoltaic systems were investigated. Bifacial photovoltaic panel simulations were made in horizontal and vertical positions using Radiance light tracking software. The losses due to pollution in the bifacial panels were not taken into account during the said study [25].
Taeyon Hwang et al. studied the effect of slope, orientation and shading distance between panels on electricity production in building integrated solar energy systems. Considering the shadow effect of the solar panels on each other and the shading caused by the surrounding buildings, analyses were conducted at different slopes in horizontal and vertical positions. They concluded that the ratio between the distance between the panels and the length of the panels between 1 and 3 provided the maximum efficiency in terms of production [26].
Oprea Roxana et al. carried out an experimental evaluation of the optimum tilt angle for fixed photovoltaic modules. They carried out an experimental study at Gheorghe Asachi Technical University in Iasi, Romania, by setting up an experimental setup to evaluate the performance of a solar energy system established in Iasi. As a result, the best performance was obtained at 50° in March, April and September, and 40° in May and August, considering the geographical conditions specified. They also revealed that maximum performance was achieved between 30° and 20° inclination angles in June and July [27].
In this study, the power generation profile of the east–west-oriented solar energy system installed in Istanbul Metropolitan Municipality Hidayet Turkoglu Sports Complex is evaluated by comparing it with the south-oriented system. The installed system is important for determining the solar potential in the borders of Istanbul province and determining the energy production status in the case of different placement configurations. The installed system comprises 650 polycrystalline solar panels rated at 260 W each. Due to the high power rating of these panels, the east–west orientation is chosen as it is more economically feasible compared to other orientations. The system is equipped with an optimizer to monitor and maximize the power output of each panel, thus minimizing energy loss. In comparison to a south-oriented system, a higher power system is installed within the same area. The system’s energy production is monitored through a web portal and inverter output using a data logging and remote monitoring system. The production values of the east–west-oriented system are compared to those of a south-oriented system with the same power rating and to a system with maximum power output that could be installed within the same roof area. The major contributions can be listed as follows:
- 1.
- A new implementation approach including an optimizer-supported real solar energy system with east–west orientation is analyzed on a monthly basis, and comparison between the east–west orientation and the south orientation is presented in an attempt to decide ideal placement.
- 2.
- Efficient management of a solar system is crucial for maximizing the utilization of solar irradiation. However, in the case of uncertain solar generation or maintenance issues, all strings may be affected, leading to a system-wide outage. To address this challenge, a multi-functional optimizer, which enables real-time monitoring of the system status and provides maximum operational efficiency, is integrated with each panel.
- 3.
- The robustness of the presented experimental approach is tested by simulating different angle configurations using PVSOL and PVGIS software, and a comparative analysis of the pros/cons of east–west and south orientation is conducted to determine the ideal investment.
In the organization of the remaining parts of this study, the mathematical approaches and methods applied in the study are discussed in the methodology section in Section 2. In Section 3, the simulation and experimental results of the system are analyzed. In the last section, conclusions and recommendations are discussed.
2. Methodology
2.1. General Structure of the System
The materials used in the east–west-oriented photovoltaic solar power plant and the installation details of the materials are as follows.
- -
- Solar panel: 650 polycrystalline solar panels with 260 Wp power,
- -
- Inverter: 25 3-phase solar inverters with 8 kW power,
- -
- Optimizer: 650 optimizers for panel-based monitoring and panel-based maximum power tracking,
- -
- Switchboards and switchgear: DC collection panel for solar panel input and output connections, panel for AC output and grounding,
- -
- Carrier construction and stabilizing ballast concrete: carrier system with strength and properties suitable for solar panel system,
- -
- Cables: PV cables and power cables,
- -
- Connector: MC4 connector,
- -
- Solar radiation: sensor to detect solar radiation (pyranometer),
- -
- Temperature measurement: ambient and module temperature sensors,
- -
- Wind measurement: wind detection sensor (anemometer),
- -
- Data storage and remote access system: remote monitoring software, data recording and installation,
- -
- Information display (Kiosk): 23″ inch screen and PC module.
2.1.1. 260 Wp Photovoltaic Solar Panel
In the east–west-oriented system, solar panels were selected as polycrystalline type with 260 Wp power. With 650 of these solar panels, a total installed power of 169 kWp is obtained. The technical specifications of the solar panels to be used under standard test conditions (irradiance 1000 W/m2, A.M (Air Mass) 1.5, cell temperature 25 °C) are shown in Table 1. The panels are placed on the construction in east–west orientation. Thanks to the east–west orientation of the system, solar panels are utilized more during sunrise and sunset hours.

Table 1.
The 260 Wp photovoltaic solar panel technical specifications.
2.1.2. Optimizer
The optimizer is a DC/DC (buck–boost) circuit that communicates with the inverter via the power cable. With the arrival of sunlight on the solar panels, voltage is generated at the optimizer terminals. When this voltage exceeds the specified limit value, a signal is sent by the optimizers to the inverter via the existing solar cable and the inverter works by leaving the night mode. When the inverter is activated, the optimizers leave the safety mode, switch to production mode and start to increase their output voltage. When the increased voltage level reaches the inverter operating voltage range, the inverter controls the grid parameters and starts to generate power. The generated power data are transmitted to the inverter every 5 min.
In photovoltaic systems, each solar panel has its own maximum power point. With the optimizer, the maximum power point is monitored on the basis of the solar panel, thus increasing the efficiency and producing more electrical energy. Thanks to this feature, even if there is no shadow, the effect caused by the mismatch difference between the panels is eliminated.
In a system with an array inverter, when a panel is shaded for any reason, that is, when energy production decreases, the other panels in the array produce as much energy as the panel whose energy production decreases. The fact that the other panels in the series produce as much as the panel with the lowest production causes serious losses. In an optimized system, each panel produces maximum energy and the other panels in the array are not affected by the loss of production from any panel. In addition, in an array inverter system, the use of panels with different inclination, orientation and power in the same series adversely affects the system, while in an optimized system, the use of panels with different inclination, orientation and power in the same series does not adversely affect the system. Figure 1 shows the shadow effect on the system with optimizer and string inverter.
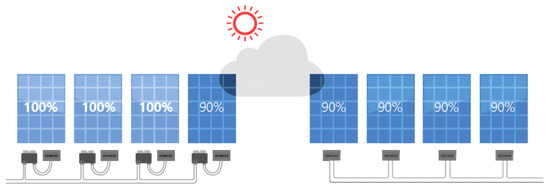
Figure 1.
Shadow effect on the system with optimizer and string inverter.
Another feature of the optimizer is that it enables panel-based monitoring. With the cloud-based remote monitoring system, current (A), voltage (V) and power (W) information of solar panels can be obtained instantaneously. In this way, the performance and fault conditions of the solar panel can be monitored instantaneously. A visual of the panel-based monitoring is given in Figure 2. In addition, the technical specifications of the optimizer used in the study are shown in Table 2.
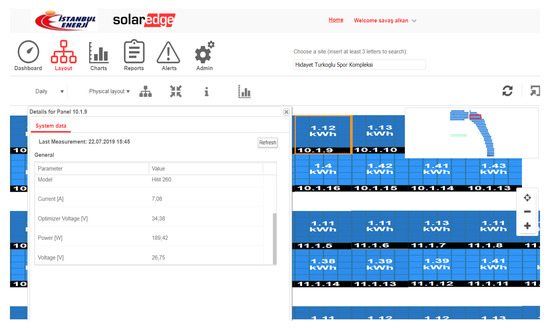
Figure 2.
Panel-based monitoring visualization.
Table 2.
Technical specifications of the optimizer.
2.1.3. Inverter
An inverter is a device that converts direct current into alternating current and at the same time regulates the frequency in the circuit and has a single or three-phase operating system.
The technical specifications of the inverters selected for the system with 200 kWe output power are shown in Table 3. The DC voltage generated by the solar panels is converted to AC voltage through the inverter and transferred to the transformer center of the sports complex selected as the pilot region. The power received through the inverter is used for the self-consumption of the sports complex. The electrical data of the inverter measuring 540 × 315 × 260 mm3, weighing 33.2 kg, IP65 protection class, without transformer, at −20/60 °C operating temperature are shown in Table 3.
Table 3.
Technical specifications of Solar Edge 8 kW inverter.
The energy consumption of the inverters used in the solar power plant installed in the Sports Complex in the night mode is maximum 2.5 W, which is quite low. Since inverters are electronic equipment, their efficiency decreases with temperature. In order to minimize this situation, a cabin was built for inverters on the roof of the complex. Figure 3 shows the visuals of the inverter cabin.
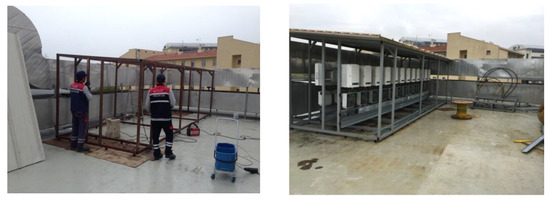
Figure 3.
Images of the inverter cabinet.
2.2. System Design
The location information of the Hidayet Turkoglu Sports Complex, where an optimized solar power plant with an installed power of 169 kWp with east–west orientation was installed on the roof, the electricity consumption data of the complex and the suitability of the solar energy system installed on the roof of the complex to the designed system were examined and the criteria considered when selecting the materials were explained.
2.2.1. Location of the Complex
The Hidayet Turkoglu Sports Complex, which was selected as the pilot site, is located at Yıldırım Mahallesi, Sehit Kamil Balkan Cad. Bayrampasa Istanbul, Turkey. In addition, the area is located between the coordinates 41.06530750, 28.88433391, the slice center meridian is 27 and the slice width is 6°. The map image of the Sports Complex is shown in Figure 4.
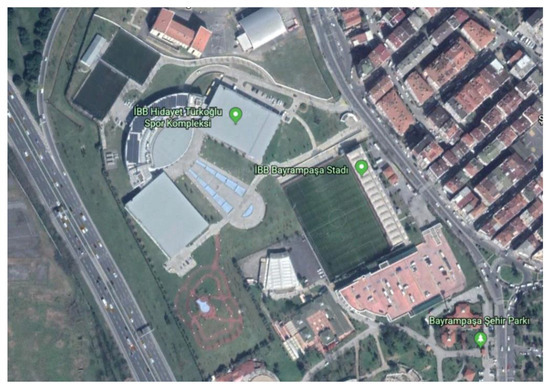
Figure 4.
Hidayet Turkoglu Sports Complex map image.
2.2.2. Information on the Sports Complex
The Hidayet Turkoglu Sports Complex was opened for use in 2010. The facility was built on a surface area of 57,081 m2. The sports complex includes an indoor sports hall (with a capacity of 1306 spectators), a swimming pool (with a capacity of 280 spectators), a swimming pool with a diving tower, an aqua swimming pool, fitness centers, a step aerobics and Pilates center, a Far East sports center, a table tennis center, two pitches, administrative units and two cafeterias.
In the Hidayet Turkoglu Sports Complex, the solar energy system is installed on the crescent-shaped roof area in the center. The roof area where the solar energy system was installed is approximately 1500 m2. The roof slope is 0° and the floor is made of flat concrete. The roof area has ventilation ducts, chimneys and parapets on the sides. For this reason, there was a loss of space and the entire roof area could not be used for the solar energy system installation. The installed roof area is shown in Figure 5 and the 3D visualization of the facility is shown in Figure 6.
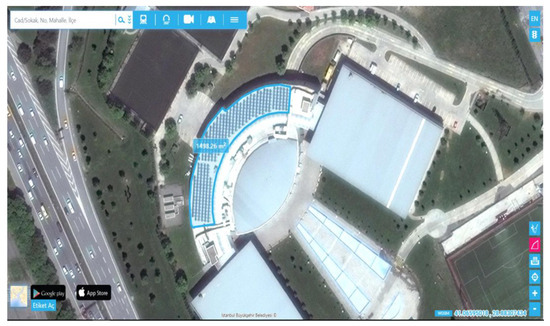
Figure 5.
Hidayet Turkoglu Sports Complex roof area where solar energy system is installed.
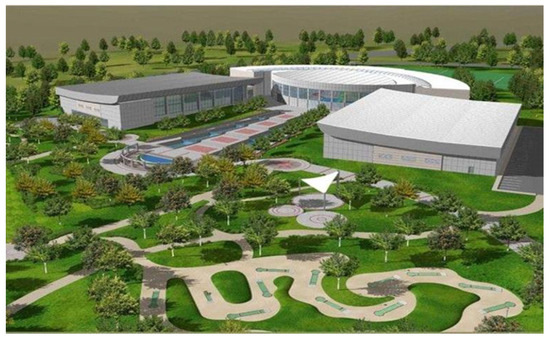
Figure 6.
Three-dimensional visualization of Hidayet Turkoglu Sports Complex.
Hidayet Turkoglu Sports Complex, which is a medium voltage single-time commercial subscriber, is in the category of eligible consumer and purchases electricity from CK Boğaziçi Electricity Retail Sales Inc. The installed power of Sports Complex is 3200 kW and the contract power is 2000 kW. Hidayet Turkoglu Sports Complex consumed 3,579,868 kWh of electricity in 2021 and the total annual electricity bill amount is TRY 1,783,371.61 including VAT. Monthly consumption data of the complex are shown in Table 4.
Table 4.
Hidayet Turkoglu Sports Complex 2021 monthly consumption data.
2.2.3. Compatibility of the Material Used with the System Designed for the Complex
The most important feature of the east–west-oriented optimized solar power plant is that it allows the installation of more installed power than a south-oriented plant to be installed in the same area. In this way, renewable energy is utilized more and carbon (CO2) emissions are further reduced. The system design maximizes the utilization of solar radiation during sunrise and sunset. In south-oriented applications, the sun’s rays fall perpendicular to the panels only for a certain period of time. In the east–west system, although there is less production when the sun is in the south direction, more energy can be produced in the time period when the sun is rising and setting. At the same time, more solar energy systems can be installed in the same area with the east–west system. If a 30° south-oriented installation had been placed on the same roof area, a system with an installed power of 110.5 kWp would have been installed instead of 169 kWp.
There are two important factors in rooftop solar power plant installations. These are roof statics (load carrying capacity) and roof insulation. The extra loads on the roof due to the solar power plant to be installed were analyzed with static calculations and were deemed appropriate in terms of roof statics. However, it was observed that there was an insulation problem on the roof and water was leaking to the lower floors. This situation had to be remedied before the installation of the power plant. Before the solar power plant was installed, insulation work was carried out on the roof of the complex and the problem was eliminated. In this application, the construction system was made of aluminum, which has high corrosion resistance and long life. In addition, in order to not damage the newly constructed roof insulation, a weight system was selected and no drilling was performed on the roof surface.
A total of 650 polycrystalline photovoltaic panels with 260 Wp power were used in the east–west-oriented solar power plant with 169 kWp installed power. Since the panels purchased for the solar power plant were manufactured by a local manufacturer, the cost–performance ratio was quite high. Polycrystalline panels can be supplied quickly as their production processes are simple due to their structure. Framed-type solar panels were preferred due to their low cost. This contributed to further shortening the return on investment period.
In order to obtain maximum energy from the solar panels and to monitor the panels instantly, a total of 650 optimizers were used, one for each solar panel. Thanks to the optimizer, when one of the solar panels in the power plant loses production for any reason, only the production of the relevant panel decreases and the other panels in the series are not affected. In this way, maximum energy production is achieved. If the optimizer had not been used, the other panels in the series would have produced no more than the least productive panel due to shadowing, resulting in a serious loss in production. Although the DC voltage generated by the panels in series varies with the number of panels in series, it is generally at 800–1500 Vdc levels. The optimizer mounted on the solar panels provides protection from the 800–1500 Vdc voltage level formed in the arrays by giving 1 volt output when it does not communicate with the inverter or when there is an open circuit. In this way, the electric shock situation that may occur during the maintenance and repair of the power plant is prevented. In addition, thanks to panel-based monitoring with the optimizer, system performance and fault conditions can be monitored instantly, minimizing operation and maintenance costs. Optimizer DC/DC converter is an electronic circuit. Although the optimizer has many advantages, there is an energy loss of 0.5% when it is an electronic circuit. Optimizer efficiency is 99.5%.
In the 169 kWp solar power plant installed at the Hidayet Turkoglu Sports Complex, 25 pieces of 8 kW inverters were used. Total inverter output power was 200 kWe. The 169 kWp DC installed power corresponds to 200 kWe inverter output power. The inverter power and number selected here are not suitable for system performance. Under ideal conditions, the DC installed power should be 5–15% higher than the inverter output power because the electricity generated in solar panels will experience losses until it reaches the inverter AC output side. These losses include temperature losses, cable losses, optimizer losses, inverter losses, etc. In addition, a small number of inverters with high power should be selected for better system performance. When the inverter power is selected low, a large number of inverters are required, and this situation creates disadvantages such as increased cost, increased failure point, increased losses, etc. The selected inverter has an efficiency of 98% and the value is quite good under market conditions. In this way, the power received from the inverter output is at maximum level. Since the inverter is an electronic device, it is one of the most common failure points in solar power plants. Therefore, inverter quality is very important. In addition, it is very important that the maintenance team that will provide technical support in case of failure is within the borders of Istanbul.
For the 169 kWp rooftop solar power plant, the inverter used in the system has RS 485, Ethernet, Wi-Fi communication ports and Modbus communication protocol. Thanks to this feature, all data of the solar power plant can be transferred to any portal or monitored on the inverter manufacturer’s own web portal. In this application carried out at the Sports Complex, which is heavily used by the people of Istanbul, the data received from the solar power plant were reflected on the information screen at the entrance of the complex. In this way, it was aimed at increasing public awareness of renewable energy sources. One meteorological station was used in the system to receive solar radiation, wind speed, ambient and module temperature information. Thanks to these data, the performance of the system was monitored.
2.3. Using Simulation Programs
There are many photovoltaic simulation programs on the market. The main ones are PVSOL, PVSyst, PVGIS, PVWats, Sunny Design, Archelios, HelioScope programs, etc. There are also many programs belonging to inverter manufacturers. Before the installation of the solar power plant, it needs to be simulated in order to make a correct design. Such programs enable the determination of the installed power and production estimates of the power plant and its economic analysis.
The solar panels to be used in the solar power plant are connected in series to form different numbers of arrays as voltage generators. When determining the number of series and series of solar panels, it should be determined in a way that is compatible with the operating ranges of the inverter. Each solar inverter has a different MPP input range on the DC input side. In addition, the input current and voltage of each solar inverter are limited. For possible designs, the arrangement and tilt of solar panels are estimated and evaluated with simulation programs. In addition to design support, shading analysis, efficiency analysis, energy production and emission savings, drawing of plant circuit diagrams and economic analysis can be performed with these programs and output as a report. The programs used in this study are described below.
2.3.1. PVSOL
The PVSOL database contains climate data for 8000 locations around the world. The solar power plant installed at the Sports Complex was simulated with the PVSOL program. With the program, system planning and optimization and annual energy production values were simulated. Two-dimensional and three-dimensional designs of the complex were made with the irradiation data and the material library used for the installation. In addition, various simulation results such as monthly and annual energy production values were obtained. In addition, shading analysis was performed by using solar radiation and simulating the position of the sun. By-Pass diode is used to protect the module by redirecting the current when the voltage across a substring is negative, to prevent individual cells from damage due to over-current. By-Pass diode circuits in solar panels and sun position are taken into account and shading analysis is performed on solar panel basis. In most of the other programs, shading analysis can be performed on the entire system or on an array basis. By using the sun’s position over time (such as altitude, latitude, azimuth, etc.), the points where the energy production of the system is maximum can be determined.
2.3.2. PVGIS
PVGIS is a web-based program offered by the European Commission with regional irradiance values based on Europe and Africa. The web-based program PVGIS receives irradiance data from two different satellites. For the irradiance results obtained from PVGIS, the production of the east–wt–west-oriented solar energy system and the south-oriented solar energy system can be compared. According to the irradiance data of the location of the complex, energy production values can be seen on a monthly and annual basis. The longest night, the longest day and the irradiances falling on the horizontal plane can be seen in the graph depending on the sun angle.
2.3.3. Meteonorm
Meteonorm interpolates data from approximately 1700 meteorological stations around the world and calculates the irradiance values of the specified location. Therefore, it is a solar radiation data pool consisting of radiation data from 1700 meteorological stations. Meteonorm can provide hourly data upon request. Meteonorm data are generally from solar power plants. Thanks to this feature, irradiance accuracy is known to be more reliable than other meteorological sources or sites.
2.3.4. Sketch-Up
Sketch-Up is a modeling program that provides three-dimensional images and pictures. It was used to show the layout of the solar power plant on the complex, i.e., to create a site plan.
3. Testing and Results
Simulation was performed during the design phase of the east–wt–west-oriented optimized photovoltaic system, and irradiance determination, production analysis and a cost study were carried out before the installation of the system. The aforementioned programs were used to model the solar power plant. The East–west-oriented plant and south-oriented plant are compared in terms of energy production, performance ratio and economic aspects. The irradiation gain, tilt and orientation-dependent power density of both plants are analyzed for the same installation area.
In order to compare the 169 kWp 11° east–west-oriented solar power plant, the 169 kWp 30° south-oriented solar power plant and 110.5 kWp 30° south-oriented solar power plant, the production and efficiency analysis are explained below.
3.1. Simulation of 169 kWp 11° East–West Oriented Solar Power Plant
The designed system was simulated based on PVSOL software, PVGIS Web Portal and Meteonorm weather data. The data from the east–west oriented solar power plant, solar radiation at the location of Sports Complex, solar panel and inverter behaviors were examined and system analysis was performed.
At the Hidayet Turkoglu Sports Complex, where the installation of the 169 kWp 11° east–west-oriented solar power plant is designed, the amount of radiation falling on the horizontal plane is 1386 kWh/m2. The installation of the solar power plant is designed in a 11° east–west direction, and when the negative effects of standard spectrum deviation and module reflection are included, the 11° inclination of the module surface in the east and west directions results in an average radiation loss of 109.13 kWh per m2 on the module. The total amount of radiation falling on the module is (1386 − 109.13) kWh/m2 = 1276.87 kWh/m2. Then, 1276.87 kWh/m2 × 1.057 m2 = 1349.65159 kWh is the energy equivalent of the amount of radiation falling on the power plant with a module area of 1.057 m2. In the PVSOL simulation program, the Fill Factor (FF) was calculated as 15.62% by using Equation (1) according to the panel’s technical specifications.
According to the simulation results of the 169 kWp 11° east–west-oriented photovoltaic system, considering the FF, 1349.65159 kWh × 15.62% = 210.81557 kWh electrical energy is produced annually. However, due to pollution on the module, deviation from the nominal module temperature, losses on the diode, inverter conversion rate, cable loss, voltage deviation and optimizer losses, the annual energy production is 192.829 kWh. This loss corresponds to approximately 8.53% of the total annual energy production. A loss of 8.53% occurs out of the 15.62% electrical energy production generated by the FF. For a system of this size and orientation, the loss rate is within the acceptable value range.
The energy production curve of the system, which produces 192.829 kWh annually, is shown in Figure 7. The specific power efficiency of the system with an installed power of 169 kWp, which expresses the annual electrical energy produced per installed power, 192.829 kWh/169 kWp = 1.141 kWh/kWp, was calculated with PVSOL.
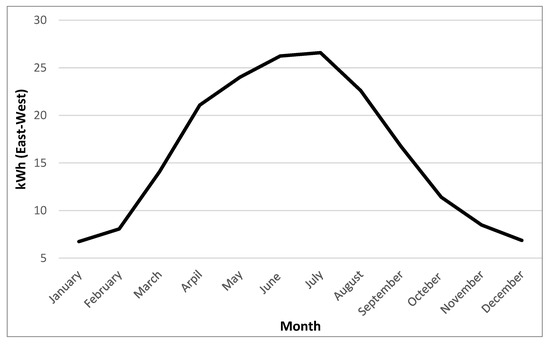
Figure 7.
Monthly energy production curve of 169 kWp 11° east–west-oriented system.
Table 5 compares PVSOL and PVGIS monthly production data for a 169 kWp solar PV system installation with 11° east–west orientation. PVSOL uses Meteonorm data, while PVGIS uses satellite data for simulation. When the monthly energy production values of the simulation results are compared, PVGIS shows 3.9% more production in total than PVSOL. When the monthly energy production values are analyzed, it is seen that the highest production is realized in July.
Table 5.
PVSOL-PVGIS energy production comparison (169 kWp 11° east–west).
The monthly performance values of the 169 kWp 11° east–west-oriented solar energy system are given in Table 5 and the graph of these data is shown in Figure 8. The system operates with an average performance rate of 83.92% per year. The system performance ratio is used to express the change in the performance of the system at the design stage according to the system parameters.
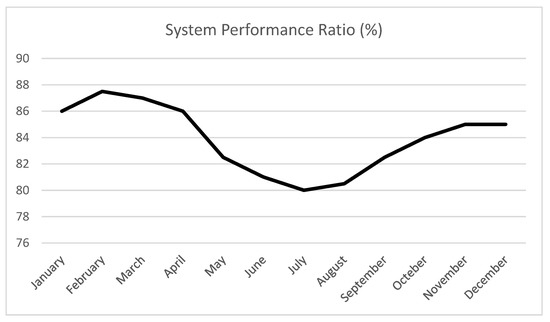
Figure 8.
169 kWp 11° east–west system operating performance (%).
With the 169 kWp 11° east–west system, a total of 192.829 kWh will be produced in the first year, and the approximate carbon footprint is 192.829 kWh/year × 0.52 kg = 100.27 tons of CO2 according to carbon emission data from TUIK (Turkish Statistical Institute) [28].
In addition, according to the data obtained from the Environmental Protection Agency (EPA) for the first year with the system installed, CO2 emissions equivalent to 100.27 tons of CO2/39 kg CO2 = 2571 trees planted will be prevented [29].
The 169 kWp 11° east–west photovoltaic system and its views on the plant were drawn with the Sketch-Up program and the visuals are shown in Figure 9.
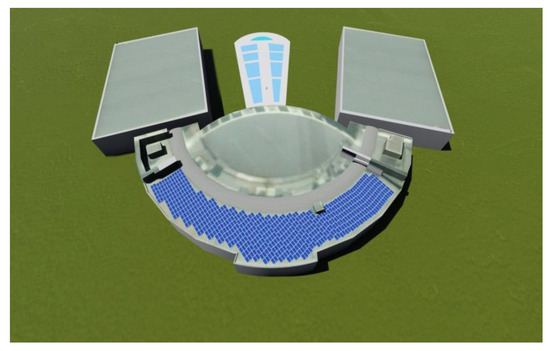
Figure 9.
The 169 kWp 11° east–west-oriented solar power plant visualization.
3.2. Simulation of 169 kWp 30° South-Oriented Solar Power Plant
The 169 kWp 30° south-oriented solar power plant cannot be installed on the existing roof area. For an installation of this power, a roof area of approximately 2300 m2 is required, provided that it has the same characteristics as the existing roof. Although such an installation cannot be made on the roof area in question, a 169 kWp south-oriented solar power system was simulated in order to analyze the production and efficiency.
The designed system was simulated based on the PVSOL software, PVGIS Web Portal and Meteonorm weather information. The system was analyzed by examining the data from the south-oriented solar power plant, solar radiation at the Sports Complex, the Solar Türk solar panel and Solar Edgesolar inverter behaviors.
At the Hidayet Turkoglu Sports Complex, where the installation of the 169 kWp 30° south-oriented solar power plant was designed, the amount of radiation falling on the horizontal plane is 1.386 kWh/m2. The installation of the SPP is designed in the 30° south direction, and when the negative effects of standard spectrum deviation and module reflection are included, an additional 66.68 kWh per m2 of radiation falls on the module due to the 30° inclination of the module surface in the east and west directions. The total amount of radiation falling on the module is (1386 + 66.68) kWh/m2 = 1452.68 kWh/m2, and 1452.68 kWh/m2 × 1.057 m2 = 1535.48276 kWh is the energy equivalent of the amount of radiation falling on the SPP with a module area of 1.057 m2. In the PVSOL simulation program, the FF is calculated as 15.62% by using Equation (2) according to the panel specifications.
According to the simulation results of the 30° south-oriented photovoltaic system, considering the FF, 1535.48276 kWh × 15.62% = 239.8424 kWh electrical energy is produced annually. However, due to pollution on the module, deviation from the nominal module temperature, losses on the diode, inverter conversion rate, cable loss, voltage deviation and optimizer losses, the annual energy production is 211.250 kWh. This loss corresponds to approximately 11.92% of the total annual energy production. A loss of 11.92% is generated from the 15.62% electrical energy production generated by the FF. For a system of this size, the loss rate is acceptable.
The energy production curve of the system, which produces 137.633 kWh per year, is shown in Figure 10. The specific power efficiency of the system with an installed power of 169 kWp, which expresses the annual electrical energy produced per installed power, 137.633/110.5 kWp = 1.245 kWh/kWp, is calculated with PVSOL.
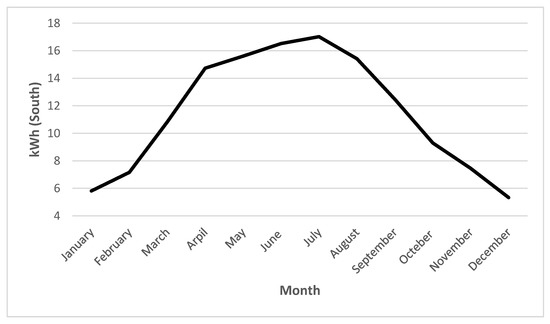
Figure 10.
Monthly energy production curve of 110.5 kWp 30° south orientation system.
Table 6 compares PVSOL and PVGIS monthly production data for the installation of a 110.5 kWp solar PV system with a 30° south orientation. PVSOL uses Meteonorm data, while PVGIS uses satellite data for simulation. When the monthly energy production values of the simulation results are compared, PVGIS shows 7.17% more production in total than PVSOL. When the monthly energy production values are analyzed, it is seen that the highest production is realized in July.
Table 6.
PVSOL-PVGIS energy production comparison (110.5 kWp 30° south).
The monthly performance values of the 110.5 kWp 30° south-oriented solar energy system are shown in Table 7 and the graph is shown in Figure 11. The system operates with an average performance rate of 81.9% per year. The system performance ratio is used to express the change in the performance of the system at the design stage according to the system parameters. This amount of change is calculated by subtracting the performance ratio from 1. This value shows the deviation of the actual values from the calculated values, independent of the efficiency.
Table 7.
Monthly operating performance of 110.5 kWp 30° south system (%).
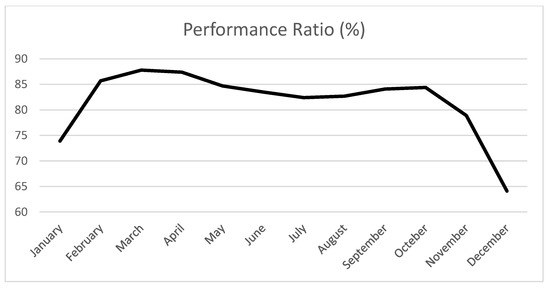
Figure 11.
Operating performance (%) of 110.5 kWp 30° south orientation system.
3.3. Comparison of 169 kWp 11° East–West Orientation System and 169 kWp 30° South Orientation System
The energy production values of the 11° east–west-oriented solar energy system with 169 kWp installed power and the 30° south-oriented solar energy system with 169 kWp power were calculated by using the PVSOL and PVGIS simulation programs. While performing these simulations, the aim was to reveal the difference in production and efficiency between the two systems with the same power and different orientations. In Table 8, the energy production values of the systems with 169 kWp power and 11° east–west and 30° south orientation are given comparatively according to the months.
Table 8.
Monthly energy production comparisons of 169 kWp 11° east–west- and 30° south-oriented systems using PVSOL and PVGIS.
According to the results of both simulation programs, July is the month with the highest production for both the east–west-oriented and south-oriented solar energy systems. In the simulation with PVSOL, as can be seen from the graph in Figure 12, electricity generation is higher in the east–west-oriented system in May, June, July and August when the sunshine duration is high. In other months, electricity generation is higher in the south-oriented system. In the simulation made with PVGIS, as can be seen from the graph in Figure 13, electricity generation is higher in the east–west-oriented system in May, June and July when the sunshine duration is high. In other months, electricity generation is higher in the south-oriented system.
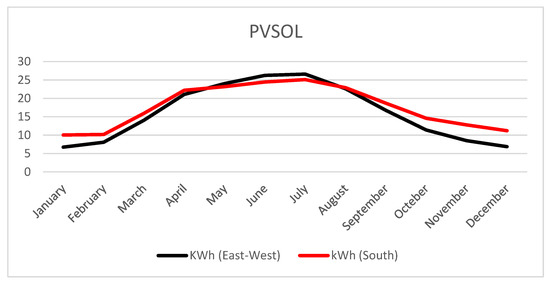
Figure 12.
Monthly energy production curves of 169 kWp systems oriented 11° east–west and 30° south using PVSOL.
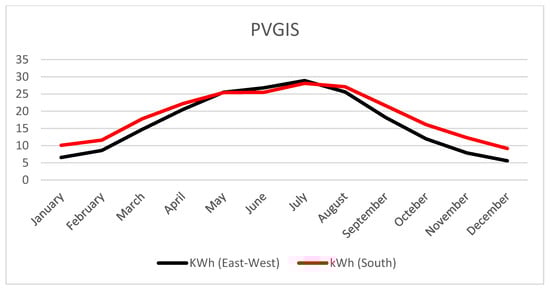
Figure 13.
Monthly energy production curves of a 169 kW solar power system with 11° east–west and 30° south orientation created using PVGIS.
In the simulation with PVSOL, the difference in the energy produced in the east–west- and south-oriented systems is less compared to PVGIS. The change in production values for the east–west-oriented system is similar on a monthly basis in both simulation programs. Looking at the change in production values for the south-oriented system, it is seen that PVGIS gives higher results at peak values. The difference between the simulation results with both programs is due to the different data sources they use.
3.4. Comparison of 169 kWp 11° East–West-Oriented System and 110.5 kWp 30° South-Oriented System That Can Be Installed on the Existing Roof Area
The energy production values of the 11° east–west-oriented solar energy system with an installed power of 169 kWp and the 30° south-oriented solar energy system with a power of 110.5 kWp were calculated by using PVSOL and PVGIS simulation programs. While performing these simulations, it was aimed to reveal the difference in production and efficiency between the systems with different power and orientations on the same roof area. In Table 9, the monthly energy production values of the systems oriented 11° east–west with 169 kWp power and 30° south with 110.5 kWp power are given comparatively.
Table 9.
Monthly energy production comparisons of 169 kWp 11° east–west- and 110.5 kWp 30° south-oriented systems created using PVSOL and PVGIS.
According to the results of both simulation programs, July is the month with the highest production for both the east–west-oriented and south-oriented solar energy systems. The results are shown in Figure 14 and Figure 15. In the simulation with PVSOL, the east–west-oriented solar system produces more energy throughout the year than the south-oriented system due to the power difference. In the simulation with PVGIS, it is seen that although the installed power of the east–west-oriented system is about 35% more than the south-oriented system, the south-oriented system produces more energy in January, November and December.
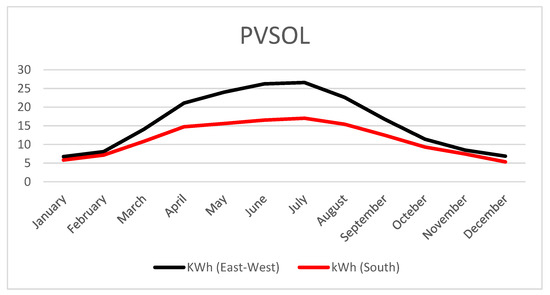
Figure 14.
Monthly energy production curves of 169 kWp 11° east–west-oriented solar energy system and 110.5 kWp 30° south-oriented solar energy system using PVSOL.
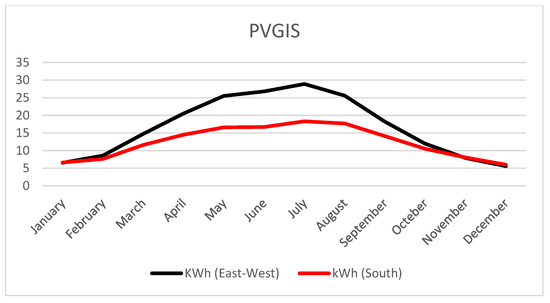
Figure 15.
Monthly energy production curves of 169 kWp 11° east–west-oriented solar energy system and 110.5 kWp 30° south-oriented solar energy system created using PVGIS.
3.5. Implementation of the East–West-Oriented Photovoltaic System
For the 169 kWp 11° rooftop east–west-oriented solar power plant, the production data in April, May, June and July were monitored both in the east–west-oriented system and in the south-oriented measurement setup by means of the monitoring system installed in the rooftop east–west-oriented solar power plant. Figure 16 and Figure 17 show the application image of the east–west-oriented solar power plant and the south-oriented measurement setup installed in the complex.
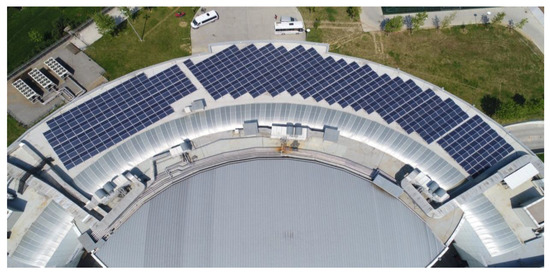
Figure 16.
East–west orientation application view 1.
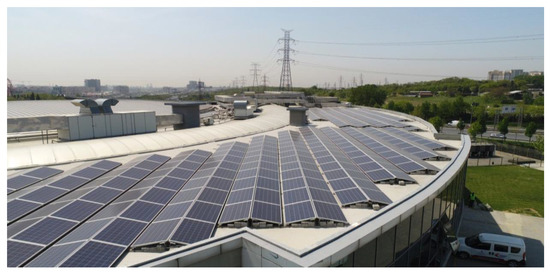
Figure 17.
East–west orientation application view 2.
3.5.1. Analysis of Simulation and Real-Time Production Data of 169 kWp 11° East–West-Oriented Solar Power Plant on Annual Basis
The real-time energy production and system performance data of the 169 kWp 11° rooftop east–west-oriented solar power plant installed in 2017 at the Hidayet Turkoglu Sports Complex of Istanbul Metropolitan Municipality were monitored on an annual basis. According to the real-time production data obtained from the monitoring system, 202.85 MWh of electricity was produced in the system and the system performance was 84.26%.
As can be seen from the real-time power generation graph in Figure 18, the highest generation was realized in July with 27.78 MWh and the lowest generation was realized in January with 5.75 MWh. It is also seen from the previous simulation results that July is the month with the highest electricity generation. Table 10 shows the monthly production values produced in the power plant.
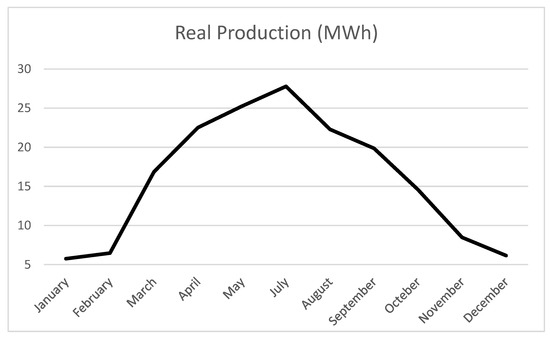
Figure 18.
The 169 kWp east–west-oriented solar power plant real-time energy production curve according to months.
Table 10.
Real-time energy production data of 169 kWp east–west-oriented solar power plant by month.
As can be seen from the real-time operation performance rate graph in Figure 19, the highest performance was realized in June with 89.9% and the lowest performance was realized in January with 77.9%. As can be seen from the energy production graph in Figure 18, although the highest production was realized in July with 27.78 MWh, the highest performance was realized in June with 89.9%. This can be explained by the fact that the average temperature of 23.8 °C in July is higher than the average temperature of 21.4 °C in June. The efficiency of solar panels decreases with increasing temperature. Losses caused by temperature are specified by solar panel manufacturers in their catalog values. Real-time data from the data logging storage and remote monitoring system, and simulation results with PVSOL and PVGIS, are compared and given in Figure 20.
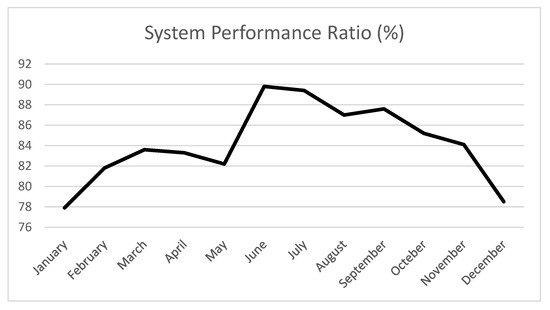
Figure 19.
Operating performance (%) of 169 kWp east–west-oriented solar power plant according to real-time months.
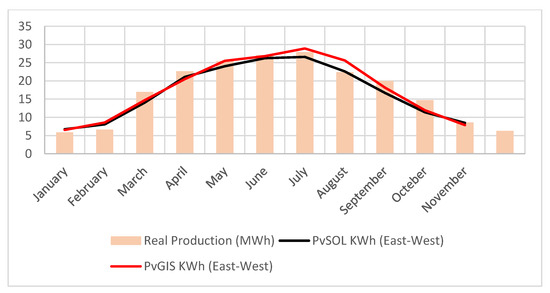
Figure 20.
PVSOL, PVGIS and real-time energy production curve of 169 kWp east–west-oriented solar power plant according to months.
The characteristic of the real-time energy production curve is similar to the production characteristic that emerged as a result of the simulation with PVSOL. The real-time energy production values are 5.16% higher than the simulation results made with the PVSOL program and 1.06% higher than the simulation results made with the PVGIS program. The received data reveal that the real data of the application system show higher production than the simulation data. When analyzed in terms of energy production values, it is seen that the real-time energy production values are closer to the production values obtained as a result of simulation with PVGIS.
3.5.2. Panel-Based Analysis of Real-Time Production Data
As can be seen from the energy production curve of the east–west- and south-oriented solar energy system graph in Figure 21, real-time production data in April, May, June and July were monitored on a panel basis by means of the data recording and remote monitoring system installed in the 169 kWp rooftop east–west-oriented solar power plant designed and installed for the Istanbul Metropolitan Municipality Hidayet Turkoglu Sports Complex. In addition, the real-time data obtained from the 30° south-oriented measurement experimental setup and the real-time data obtained from the east–west-oriented power plant were compared on a panel basis using two panels.
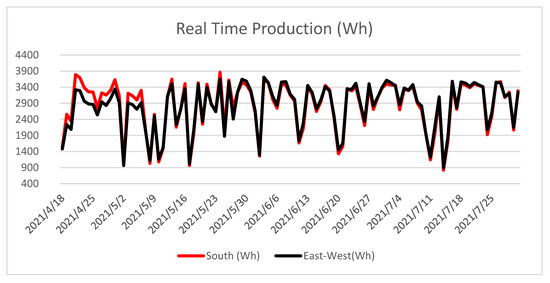
Figure 21.
Panel-based real-time energy production curve of the east–west- and south-oriented solar energy system in April, May, June and July.
In the light of these data, the advantages and disadvantages of the east–west-oriented solar energy system with 169 kWp installed power compared to the south-oriented solar energy system with 110.5 kWp installed power that can be installed in the same area are given below.
- Advantages:
- -
- There is 35% more installed power installed in the same unit area.
- -
- There is 40% more electricity generated in the first year.
- -
- There is longer and better matching with the load profile during the day.
- -
- More carbon emissions are prevented and more contribution is made to nature.
- -
- When the investment return period is completed, 47% more annual return is obtained.
- -
- When system costs decrease or electricity unit prices increase with the developing technology, the return on investment period will be shorter than the south-oriented installation in the same area.
- -
- In the summer months when the sunshine duration is high, it generates more energy than the south-oriented installation of the same power.
- Disadvantages:
- -
- Initial investment costs are high.
- -
- Investment return period is longer.
4. Discussion
A solution for utilizing more energy in the same area is proposed by installing a 169 kWp east–west-oriented solar system in place of a 110.5 kWp south-oriented solar system. In the light of the obtained results, although energy production with the 110.5 kWp south orientation is generally more than the 169 kWp east–west orientation in low irradiance seasons, the east–west orientation provides more production opportunity in high irradiance seasons compared to low irradiance ones. Thus, it is observed that the east–west structure has more advantages in total.
In solar systems, each solar panel has a unique maximum power point. The optimizer tracks the maximum power point of each solar panel individually, which helps eliminate power loss due to panel-to-panel shading and other factors. As a result, the system can generate more electrical energy overall. On the other hand, the optimizer also enables panel-based monitoring, which allows for real-time monitoring of the performance and failure conditions of individual solar panels. This feature provides a significant advantage in terms of operation and maintenance, as it helps to minimize additional costs. In this regard, 650 optimizers, which provide maximum power to the system, are integrated to each panel in order to both increase self-consumption of solar generation, and monitor the system status in real time. Furthermore, the results of the real implementation of the optimizer-supported solar system are also verified via the PVSOL and PVGIS software, which give significant feedback in the solar energy sector.
Finally, cost analysis between the inverter–optimizer structure and micro-inverter structure is shared in Table 11. The proposed optimizer-supported solar system gives a significant economic contribution compared to the micro-inverter usage. While the total cost of structure 1 is USD 50,433.25, the total cost of structure 2 is USD 61,100.00. Thus, the difference between the two structures is calculated as USD 10,666.75. In this regard, the optimizer-supported solar system also offers more economical investment as well as efficient operation.
Table 11.
Cost analysis between inverter–optimizer structure and micro-inverter structure.
5. Conclusions
This study presented a solution to maximize the utilization of solar energy per unit area by installing an optimizer-supported solar energy system with east–west orientation, which provides more installed power per unit area than the south-oriented system. The system was designed, simulated and implemented, and its production and efficiency were analyzed and compared to a south-oriented system using PVSOL software, PVGIS Web Portal, and Meteonorm weather information. The results indicated that the east–west-oriented solar energy system provides more installed power per unit area than the south-oriented system. Thanks to the capability of the optimizer in the system, high powers could be installed, and solar energy could be utilized at the maximum level. The east–west-oriented solar energy system is recommended for regions with high sunshine duration, such as those close to the equator. In terms of our country, as the electricity unit prices rise and installation costs decrease, it is recommended that more solar energy investments are conducted in the northern parts of the southern regions. As a future study, determination of the optimal azimuth angle for such a system will be realized considering the availability of optimizer support.
Author Contributions
Conceptualization, S.A. and Y.A.; literature studies, S.A. and Y.A.; research methodology, Y.A.; research and data analysis, S.A.; writing—original draft preparation, S.A. and Y.A.; writing—review and editing, S.A. and Y.A. All authors have read and agreed to the published version of the manuscript.
Funding
This research received no external funding.
Data Availability Statement
Not applicable.
Acknowledgments
This research was carried out as part of the master’s thesis named “The East-West Oriented of Optimized Solar Energy Power Plant Pilot Application on the Roof and the Economic Analysis and Production Evaluation of the South-Oriented Solar Power Plant”.
Conflicts of Interest
The authors declare no conflict of interest.
References
- Muneer, T.; Gul, M.S.; Alam, M. Modelling of a Large Solar PV Facility: England’s Mallard Solar Farm Case Study. Energies 2022, 15, 8609. [Google Scholar] [CrossRef]
- Diniz, F.L.J.; Vital, C.V.P.; Gómez-Malagón, L.A. Parametric analysis of energy and exergy efficiencies of a hybrid PV/T system containing metallic nanofluids. Renew. Energy 2022, 186, 51–65. [Google Scholar] [CrossRef]
- Shah, R.; Mithulananthan, N.; Bansal, R.; Ramachandaramurthy, V. A review of key power system stability challenges for large-scale PV integration. Renew. Sustain. Energy Rev. 2015, 41, 1423–1436. [Google Scholar] [CrossRef]
- Park, C.-Y.; Hong, S.-H.; Lim, S.-C.; Song, B.-S.; Park, S.-W.; Huh, J.-H.; Kim, J.-C. Inverter Efficiency Analysis Model Based on Solar Power Estimation Using Solar Radiation. Processes 2020, 8, 1225. [Google Scholar] [CrossRef]
- Ko, J.-S.; Huh, J.-H.; Kim, J.-C. Overview of Maximum Power Point Tracking Methods for PV System in Micro Grid. Electronics 2020, 9, 816. [Google Scholar] [CrossRef]
- Energy Prosumers in Europe. Citizen Participation in the Energy Transition. EEA Report No 1/2022. Available online: https://www.eea.europa.eu/publications/the-role-of-prosumers-of (accessed on 1 October 2022).
- Mark, L.; Legget, W.; Ball, A. The implication for climate change and peak fossil fuel of the continuation of the current trend in wind and solar energy production. Energy Policies 2022, 41, 610–617. [Google Scholar] [CrossRef]
- Hamidpour, H.; Aghaei, J.; Pirouzi, S.; Dehghan, S.; Niknam, T. Flexible, reliable, and renewable power system resource expansion planning considering energy storage systems and demand response programs. IET Renew. Power Gener. 2019, 13, 1862–1872. [Google Scholar] [CrossRef]
- Zhuo, Z.; Zhang, N.; Yang, J.; Kang, C.; Smith, C.; O’Malley, M.J.; Kroposki, B. Transmission Expansion Planning Test System for AC/DC Hybrid Grid With High Variable Renewable Energy Penetration. IEEE Trans. Power Syst. 2019, 35, 2597–2608. [Google Scholar] [CrossRef]
- Havrlík, M.; Libra, M.; Poulek, V.; Kouřím, P. Analysis of Output Signal Distortion of Galvanic Isolation Circuits for Monitoring the Mains Voltage Waveform. Sensors 2022, 22, 7769. [Google Scholar] [CrossRef]
- Diahovchenko, I.; Petrichenko, L. Comparative Analysis of Power Distribution Systems with Individual Prosumers Owing Photovoltaic Installations and Solar Energy Communities in Terms of Profitability and Hosting Capacity. Energies 2022, 15, 8837. [Google Scholar] [CrossRef]
- Agathokleous, R.A.; Kalogirou, S.A. PV roofs as the first step towards 100% RES electricity production for Mediterranean islands: The case of Cyprus. Smart Energy 2021, 4, 100053. [Google Scholar] [CrossRef]
- Ceran, B.; Jurasz, J.; Mielcarek, A.; Campana, P.E. PV systems integrated with commercial buildings for local and national peak load shaving in Poland. J. Clean. Prod. 2021, 322, 129076. [Google Scholar] [CrossRef]
- Ota, Y.; Araki, K.; Nagaoka, A.; Nishioka, K. Facilitating vehicle-integrated photovoltaics by considering the radius of curvature of the roof surface for solar cell coverage. Clean. Eng. Technol. 2022, 7, 100446. [Google Scholar] [CrossRef]
- Polo, J.; Martín-Chivelet, N.; Sanz-Saiz, C.; Alonso-Montesinos, J.; López, G.; Alonso-Abella, M.; Battles, F.J.; Marzo, A.; Hanrieder, N. Modeling soiling losses for rooftop PV systems in suburban areas with nearby forest in Madrid. Renew. Energy 2021, 178, 420–428. [Google Scholar] [CrossRef]
- Libra, M.; Petrik, T.; Poulek, V.; Tyukhov, I.I.; Kourim, P. Changes in the Efficiency of Photovoltaic Energy Conversion in Temperature Range with Extreme Limits. IEEE J. Photovolt. 2021, 11, 1479–1484. [Google Scholar] [CrossRef]
- Feng, C.; Zheng, H.; Wang, R.; Yu, X.; Su, Y. A novel solar multifunctional PV/T/D system for green building roofs. Energy Convers. Manag. 2015, 93, 63–71. [Google Scholar] [CrossRef]
- Jahanfar, A.; Drake, J.; Gharabaghi, B.; Sleep, B. An experimental and modeling study of evapotranspiration from integrated green roof photovoltaic systems. Ecol. Eng. 2020, 152, 105767. [Google Scholar] [CrossRef]
- Anang, N.; Azman, S.S.N.; Muda, W.; Dagang, A.; Daud, M.Z. Performance analysis of a grid-connected rooftop solar PV system in Kuala Terengganu, Malaysia. Energy Build. 2021, 248, 111182. [Google Scholar] [CrossRef]
- Lammert, G.; Premm, D.; Ospina, L.D.P.; Boemer, J.C.; Braun, M.; van Cutsem, T. Control of Photovoltaic Systems for Enhanced Short-Term Voltage Stability and Recovery. IEEE Trans. Energy Convers. 2019, 34, 243–254. [Google Scholar] [CrossRef]
- Dolara, A.; Leva, S.; Manzolini, G.; Simonetti, R.; Trattenero, I. Outdoor Performance of Organic Photovoltaics: Comparative Analysis. Energies 2022, 15, 1620. [Google Scholar] [CrossRef]
- Sankar, A.; Kalathil, A. Qualitative validation of empirically observed higher generation in East-West orientated PV arrays over conventional South orientation. In Proceedings of the 2014 IEEE Region 10 Humanitarian Technology Conference (R10 HTC), Chennai, India, 6–9 August 2014; pp. 25–28. [Google Scholar] [CrossRef]
- Etukudor, C.; Orovwode, H.; Wara, S.; Agbetuyi, F.; Adozhe, A.; Obieje, B.O.; Oparaocha, C.N. Optimum Tilt and Azimuth Angles for Solar Photovoltaic Systems in South-West Nigeria. In Proceedings of the 2018 IEEE PES/IAS PowerAfrica, Cape Town, South Africa, 28–29 June 2018; pp. 348–353. [Google Scholar] [CrossRef]
- Chowdhury, S.; Al-Amin, M.; Ahmad, M. Performance variation of Building integrated photovoltaic application with tilt and azimuth angle in Bangladesh. In Proceedings of the 2012 7th International Conference on Electrical and Computer Engineering, Dhaka, Bangladesh, 20–22 December 2012; pp. 896–899. [Google Scholar] [CrossRef]
- Asgharzadeh, A.; Deline, C.; Stein, J.; Toor, F. A comparison study of the performance of south/north-facing vs east/west-facing bifacial modules under shading condition. In Proceedings of the 2018 IEEE 7th World Conference on Photovoltaic Energy Conversion (WCPEC) (A Joint Conference of 45th IEEE PVSC, 28th PVSEC & 34th EU PVSEC), Waikoloa, HI, USA, 10–15 June 2018; pp. 1730–1734. [Google Scholar] [CrossRef]
- Hwang, T.; Seokyoun, K.; Kim, J.T. Optimization Of The Building Integrated Photovoltaic System In Office Buildings-Focus On The Orientation, Inclined Angle And Installed Area. Energy Build. 2012, 46, 92–104. [Google Scholar] [CrossRef]
- Roxana, O.; Marcel, I.; Dragos, M.; Ravan, B. Experimental Evaluation of the Optimum Tilt Angle for Fixed Photovoltaic Modules. In Proceedings of the 2018 International Conference and Exposition on Electrical And Power Engineering (EPE), Iasi, Romania, 18–19 October 2018; pp. 0594–0598. [Google Scholar] [CrossRef]
- TUIK. 2019. Available online: http://tuik.gov.tr/PreTabloArama.do?metod=search&araType=hb_x (accessed on 8 May 2019).
- Environmental Protection Agency (EPA). Available online: https://www.epa.gov/energy/greenhouse-gases-equivalencies-calculator-calculations-and-references (accessed on 6 July 2019).
Disclaimer/Publisher’s Note: The statements, opinions and data contained in all publications are solely those of the individual author(s) and contributor(s) and not of MDPI and/or the editor(s). MDPI and/or the editor(s) disclaim responsibility for any injury to people or property resulting from any ideas, methods, instructions or products referred to in the content. |
© 2023 by the authors. Licensee MDPI, Basel, Switzerland. This article is an open access article distributed under the terms and conditions of the Creative Commons Attribution (CC BY) license (https://creativecommons.org/licenses/by/4.0/).