Article

Employing Bibliometric Analysis to Identify the Current State of the Art and Future Prospects of Electric Vehicles

1
Transportation Engineering College, Dalian Maritime University, Dalian 116026, China
2
Department of Business and Administration, ILMA University, Karachi 75190, Pakistan
3
Intelligent Transportation Systems Research Center, Wuhan University of Technology, 1040 Heping Avenue, Wuchang District, Wuhan 430063, China
4
National Engineering Research Center for Water Transport Safety, Wuhan 430063, China
5
Engineering Research Center for Transportation Safety, Ministry of Education, Wuhan 430063, China
6
Department of Civil Engineering and Architecture, University of Catania, 95123 Catania, Italy
7
Transportation and Traffic Engineering Department, College of Engineering, Imam Abdulrahman Bin Faisal University, P.O. Box 1982, Dammam 31451, Saudi Arabia
*
Author to whom correspondence should be addressed.
Co-first author, these authors contributed equally to this work.
Energies 2023, 16(5), 2344; https://doi.org/10.3390/en16052344
Submission received: 21 January 2023 / Revised: 19 February 2023 / Accepted: 21 February 2023 / Published: 28 February 2023
(This article belongs to the Special Issue Recent Advancement in Electric Vehicles)

Abstract

:
Electric vehicles (EVs) are rapidly becoming a sustainable and viable mode of future transportation due to their multitude of advantages, such as reduced CO2 emissions, local air pollutants, and vehicular noise. This study aims to identify and analyze the scientific literature using bibliometric analysis to determine the main topics of authors, their sources, and the most-cited articles, countries, journals, and institutes in the literature on EVs. This bibliometric analysis included scientific work that was published from 2011 to 2022 to provide a thorough analysis of EVs, which will assist researchers and policymakers in understanding the most current global EV advancements. This analysis extracted all bibliometric information about EVs from the Scopus database, collecting 17,150 articles published between 2011 and 2022. The data were sorted for analysis by publication year, document type, author, institute, country, cited author, keyword, and keyword co-occurrence of the EVs. The VOSviewer software was employed to examine the sorted data due to its excellent analysis and visualization capabilities. We used VOSviewer to graphically represent the density, co-occurrence, trends, and linkage of the aforementioned data comprehensibly. The publishing patterns of EVs indicate that the research field is evolving, with a yearly increase in the number of publications. The analysis showed that China, the United States, and the United Kingdom are leading in EV research and large-scale applications. Furthermore, China is the leading country in terms of research institutions and authors involved in EVs. The journal Energies is the most prominent publication periodical. Keyword analysis revealed that during the past decade, EV research has concentrated on battery-management systems, energy storage, charging infrastructure, environmental concerns, etc. The bibliometric study offered pertinent details on the main themes explored concerning EVs and current technological developments.

1. Introduction

1.1. Background

Electric vehicles (EVs) have emerged as a potential alternative to fossil-fuel-powered vehicles for future transportation [1,2]. Transportation relies heavily on fossil fuels and is responsible for 37% of carbon dioxide (CO2) emissions [3,4,5]. EVs have the potential to reduce CO2 emissions and contribute to climate change mitigation. However, developing a sustainable future requires effort in numerous different areas. To be fully effective, EVs must be powered by sustainable and renewable energy sources [6,7,8]. Growing energy demand, exhaustion of fossil fuels, and CO2 emissions are the main hazards of the 21st century [9,10,11,12]. Furthermore, it has been revealed that by 2035, the transport sector’s oil consumption will rise to 54% [13,14].
Moreover, it is stated that an increase in CO2 emissions from road transport in 2015 was mainly due to a 4.1% upsurge in diesel consumption [15,16,17]. Previous studies have shown that the transport sector is one of the main factors of CO2 emissions [18,19,20]. As part of the contribution of the transport sector to reducing greenhouse gas emissions (GHG), the 21st century has witnessed the traditional internal combustion engine vehicles (ICEVs) being replaced by EVs [16,21,22,23]. EVs’ growth is characteristic of the early 21st century, and the global automotive market has reintroduced EVs. Battery electric vehicles (BEVs) and plug-in hybrid electric vehicles (PHEVs), communally known as EVs, reduce or completely avoid diesel or gas use in the car itself by integrating with the electric grid [24,25,26]. There are many reasons for the re-emergence of EVs, including improvements in air quality standards, battery technologies, and heightened government vehicle efficacy [27,28,29]. EVs are an emerging technology that helps to reduce CO2 emissions, local air pollutants, and vehicular noise [13,30]. To obtain these benefits, states all over the world are setting targets for EV adoption. Currently, they make up a portion of the transportation sector, mainly in developed countries where their market production has risen quickly [31,32,33].
Globally, the number of EVs increased by 2 million in 2018, reaching 5.1 million. The EV market share increased by 2 million in China, 1.2 million in Europe, and 1.1 million in the USA (Figure 1) [34]. China has the world’s highest EV sales, followed by the United States and Europe (Figure 2). After a decade of rapid growth, in 2020, the number of EVs sold worldwide reached 10 million, an increase of 43% over 2019 and a 1% stock share. In 2020, BEVs made up two-thirds of the stock and all new EV registrations. China has the largest fleet with 4.5 million EVs, but in 2020, Europe had the most significant annual rise to reach 3.2 million. The economic repercussions of the COVID-19 pandemic significantly affected the overall car market. In the first quarter of 2020, compared to 2019, fewer new cars were registered. There was a 16% reduction year over year overall, while more substantial activity in the second half somewhat offset this. Notably, the EV sale share increased globally by 70% to a record 4.6% in 2020, despite a decline in conventional and total new car registrations [35].
EVs have become a promising universal alternative to solve numerous environmental problems by reducing CO2 emissions, which helps reduce air pollutants in cities [36,37]. Compared with conventional vehicles, EVs have become more and more beneficial from an environmental and economic perspective [38,39,40,41,42]. To encouraging the adoption of EVs, governmental investments, incentives, and regulations are being established [43,44]. Many large car manufacturers have shown an interest in EVs and must develop commercial and passenger vehicles [45]. If most of the electricity used by EVs comes from nuclear power plants or renewable sources, EVs have the potential to reduce GHG from the transport sector. This has inspired many countries to encourage the usage of EVs in private and public transport. Lower operating and maintenance costs and low noise are some additional benefits of using EVs [44,46,47]. EVs are equipped with a transmission system using any predetermined renewable energy, while the conventional engine needs gaseous or liquid fuel [48]. Instead of ICEVs, EVs will significantly reduce heat dissipation to help solve the serious problem of global warming [49]. Proposed adequate planning and incentives for the development of charging stations will improve the living atmosphere and increase the use of EVs [21]. Establishing charging stations means an increased load demand on the utility grid, which leads to an increased highest demand and reduced reserve margin.
Scholars employ bibliometric analysis for various purposes, including discovering trends in article and journal performance, research topics, and collaboration patterns, and investigating the intellectual structure of a certain area in the existing literature [50]. Bibliometric analysis is frequently coupled with network visualization software, which spans from graphical-user-interface-based software such as VOSviewer to software with no graphical user interface [51,52]. Other well-known bibliometric software includes Bibexcel, Gephi, Pajek, Sci2, SciMat, and UCINET [50]. Manual reviews are insufficient for establishing a clear and significant connection between various components of the extant literature. Scientific mapping and network visualization between bibliographic coupling, co-occurrence, and co-citations are currently the most challenging parts of modern research [53]. The bibliometric analysis can handle massive volumes of data without additional difficulties, overcoming the fundamental constraints of previous manual reviews. In this study, in addition to the conventional review, a bibliometric analysis was performed to address the fundamental constraints of conventional reviews. Specifically, the author’s synergy, article, keyword co-occurrence, co-citations, and visualization of active countries conducting research in the field of the fracture properties of EVs were comprehensively investigated.

1.2. EVs’ Role in Urban/Sustainable Transportation

The use of fossil fuels in transportation is harmful for the climate and the local air quality. This occurs because of harmful air pollutants such nitrogen oxides, particulate matter, and CO2 exhaust emissions [22]. A major contributor to noise in cities is also unquestionably the road traffic. Indeed, introducing electric transportation to the fleet can greatly reduce the overall GHG emissions and air pollution, especially if the electricity is generated from renewable sources [28]. However, switching to EVs can still be advantageous for urban environments even when electricity is produced using fossil fuels due to the lower local noise and air pollution levels. Electric transportation can contribute to sustainable urban mobility by improving vehicle energy efficiency while encouraging public transportation and active mobility. Electric mobility enhances mobility options in the cities by introducing a new generation of lightweight EVs, such as electric bicycles and kick e-scooters, that can act as a catalyst for behavioral change [46]. By proactively integrating these small EVs as feeders into mass transit, we can encourage a shift away from private cars and strengthen public transportation’s role as the backbone of the urban mobility system. Furthermore, electrification can catalyze investments in clean public transport and new bus fleets, which can increase the attractiveness of public transportation through modern and more silent vehicles. In recent years, a research trend toward adopting EVs in smart cities has been observed, as EVs permit the reduction of urban CO2 emissions [54]. As a result, few studies have been conducted to improve citizens’ flexible and efficient mainstream integration of EVs. In one of these studies, the author used an enterprise architecture approach to facilitate the digital transformation of EVs for electro mobility toward sustainable mobility [55]. The author aimed to integrate data on electric mobility solutions from various stakeholders and systems involved in urban mobility services. Da Silva and Santiago used a modeling approach for plug-in hybrid EVs to investigate the optimal electricity trading policy for solar-powered microgrids [56]. The study emphasized the importance of battery management in promoting the widespread integration of microgrid-connected EVs.

1.3. Taxonomy of EVs

EVs, among other developed technologies, have attracted much attention as an alternative mode of transportation that is becoming a part of the modern transportation system. Depending on the technology used in the engines, there are various types of EVs, which are classified into five categories (Figure 3):
  • Battery Electric Vehicles (BEVs): BEVs are vehicles that run solely on electricity stored in rechargeable batteries. They are powered by an electric motor, which drives the wheels, and do not have any internal combustion engines. Instead of gasoline, they rely on energy stored in batteries, which can be recharged from an external power source. A typical BEV ranges from 160 to 250 km, though some can travel up to 500 km on a single charge. The Nissan Leaf is an example of this type of vehicle. It is 100% electric and currently has a 62 kWh battery that allows users to travel 360 km on a single charge.
  • Plug-In Hybrid Electric Vehicles (PHEVs): PHEVs are vehicles that combine a conventional internal combustion engine with an electric motor and a rechargeable battery. They can be powered by either the internal combustion engine or the electric motor, or a combination of both. The Mitsubishi Outlander PHEV has a 12 kWh battery, allowing it to travel 50 km solely on electricity. However, it is worth noting that PHEVs’ fuel consumption is higher than manufacturers’ estimates.
  • Hybrid Electric Vehicles (HEVs): (HEVs) are vehicles that use both a conventional internal combustion engine and an electric motor to power the vehicle. The electric motor assists the internal combustion engine, providing extra power when needed, such as during acceleration, and captures energy normally lost during braking to recharge the battery. The internal combustion engine and electric motor work together to power the vehicle, with the electric motor providing additional power when needed and the internal combustion engine providing range and power for longer trips. The Toyota Prius (4th generation) hybrid model includes a 1.3 kWh battery, which theoretically enabled it to travel up to 25 km in all-electric mode.
  • Fuel-cell Electric Vehicles (FCEVs): FCEVs are vehicles that use a fuel cell to generate electricity to power an electric motor. The fuel cell generates electricity through a chemical reaction between hydrogen and oxygen, producing only water as a byproduct. FCEVs have a similar driving experience to battery electric vehicles, with instant torque and quiet operation, but have a much longer driving range between refuelings. The Hyundai Nexo FCEV can travel 650 km without refueling.
  • Extended-range EVs (EREVs): (EREVs) are vehicles that have a small internal combustion engine that is used to recharge the battery, extending the driving range of the vehicle. The vehicle operates primarily on electricity stored in the battery, with the internal combustion engine kicking in when the battery is depleted to extend the driving range. The BMW i3 is an example of this type of vehicle, with a 42.2 kWh battery that provides 260 km of autonomy in electric mode and an additional 130 km in extended-range mode.

1.4. Significance, Objectives, and Structure of the Study

EVs have significantly increased mobility in order to fulfill demand and adapt to the mobility needs of a continuously growing global population. This fact, along with promoting sustainable mobility, has boosted the significance of EVs. Since 2010, EVs have received significant attention, and associated research has grown exponentially [57]. The number of publications about EVs has grown significantly in the last ten years. According to a search on the Web of Science (WoS) and Scopus databases, the number of publications on EVs has grown from around 2000 in 2011 to over 20,000 in 2021. This represents a tenfold increase in the number of publications in just ten years. The growth in publications about EVs is reflective of the increasing interest and investment in the field. Governments, automakers, and researchers around the world are working to advance EV technology and infrastructure to support their widespread adoption. The increase in publications on EVs has also led to a greater understanding of the technology and its potential benefits and drawbacks. This growth is driven by the increasing popularity of EVs and the growing recognition of their potential to reduce GHG emissions and improve energy independence. Researchers have explored various aspects of EVs, including their design and performance, battery technology, charging infrastructure, and the environmental and economic impacts of their widespread adoption. As a result, there has been a significant increase in the amount of research and development related to EVs, which is reflected in the growing number of publications on the topic.
However, most of these articles overview the reliability and technical perspective instead of a bibliometric overview. Some studies used bibliometric analysis, such as that of Ramirez et al. who conducted a study based on research articles on EVs from 2007 to 2016 [58]. Zhang et al. quantitatively and qualitatively analyzed energy management strategies for HEVs [59]. They revealed the essential characteristics and latest developing trends of these strategies and provided the emphasis and orientation of future study. Secinaro et al. conducted a study to overview the business models for EVs [60]. The study dendrogram identified two evolving strands of discussion: innovative technologies and resource optimization, and electricity management system and product life cycle. Miah et al. analyzed energy management schemes related to EV applications. The study identified the highest-impact articles in this field of research [61]. Overall, the growth in publications about EVs is a positive sign for the future of electric transportation. As research and development continue to advance the technology, we can expect to see continued growth in the number of publications, as well as a greater understanding of the potential benefits and challenges associated with the widespread adoption of EVs.
This study was motivated by the recent increase in EV research publications to assess its trends and developments. This bibliometric analysis’s timeline included scientific work published from 2011 to 2022. There are several reasons for focusing on the timeline of scientific work related to EVs published from 2011 to 2022:
Recent Advances: This timeline covers the most recent advances in EV technology and provides an up-to-date picture of the current state of the field. The years between 2011 and 2022 have seen significant advancements in EV development, making this a relevant and important period to focus on.
Increased Interest: There has been a growing interest in EVs in recent years due to increasing concerns about the environment and energy security. As a result, the number of scientific studies and publications related to EVs has increased, making it important to focus on this specific period.
Data Availability: The availability of data and information is another factor that may influence the decision to focus on the period from 2011 to 2022. This time period has a large number of studies and publications available, making it easier to analyze and draw meaningful conclusions.
Focusing on the scientific work related to EVs published between 2011 and 2022 provides a comprehensive and up-to-date view of the current state of the field, which is relevant and valuable in light of the growing interest in electric vehicles and their impact on the environment and energy security.
This study could be beneficial for policymakers and stakeholders of the 2030 Sustainable Development Goals agenda of the United Nations in terms of countries’ adaptation, progress, applications, and implementation of EVs, particularly Goal 7: Improving Vehicle Energy Efficiency and Goal 13: Climate Action for a Low-Carbon Future.
In addition, the bibliometric analysis is an important contribution to the progress of research because it provides a systematic protocol that aims to reduce potential errors and biases when selecting studies on a particular topic of interest, as well as an in-depth description of independent research efforts to identify potential gaps and highlight the limits of knowledge [62]. The first phase in bibliometric research is selecting a suitable and credible database that enables the analysis to be conducted. There has recently been a debate regarding the comparability and integrity of the statistical data acquired from the two main databases, WoS and Scopus [63,64,65]. Despite the considerable overlap between the WoS and Scopus databases, Scopus is the most extensive citation database for the peer-reviewed literature in various disciplines [66]. These databases are closely related to each other [67,68]. Scopus, according to Elsevier, is the most extensive database of citations and summaries of the peer-reviewed literature used by numerous scholars for bibliometric analysis in various research fields. Scopus is a multidisciplinary database with around 69 million records; additionally, it indexes more journals than the WoS [69].
Therefore, the current study employs the Scopus database to incorporate as many articles as possible that may not be included in WoS or addressed in earlier research. In order to investigate the history and trends of EVs, we focus on the following research questions:
(1)
What are the article distribution trends in EV research from 2011 and 2022?
(2)
What contributions have eminent researchers, leading countries, and the most-active academic institutions made?
(3)
What are the most common keywords, research fields, and top journals?
(4)
Which nation is dominant in terms of large applications, sales, and market of EVs?
We used the VOSviewer software, which has superior analytical and visualization capability to graphically show the density, co-occurrence, trends, and their interconnections.
The rest of this paper is organized as follows. The next section describes the data and methods. Then, the results are presented to illustrate the EV literature from 2011 to 2022, and to visualize the interconnections of the literature in terms of active countries, organization, co-authorships, co-citations, and co-occurring keywords in order to reveal the emerging trends, popular domains, and research frontiers. Lastly, a summary of the main findings and potential study directions is provided.

2. Methods and Data Collection

2.1. Bibliometric Overview Method

Bibliometric analysis is a widely used and robust technique for examining and analyzing vast volumes of scientific literature. A bibliometric method is a valuable approach to finding out the emerging patterns and rapid change in a research field. It includes various quantitative methods for studying the academic literature and developing the distribution patterns or internal relations for a particular subject, field, institution, or region. Many bibliometric research tools, such as VOSviewer, HistCite, Network WorkBench, DIVA, and citeSpace, are used to visualize the statistical analysis of the distributions of the journals, authors, papers, institutes, countries, and keywords [50]. This paper uses the VOSviewer to examine the research results due to its excellent analysis and visualization capabilities. VOSviewer has become one of the most widely recommended literature tools for mapping and visualization; it is also free to access. Figure 4 presents the flow chart of the proposed methods.

2.2. Publication Count

The first phase in bibliometric research is selecting a suitable and credible database to conduct the analysis. Scopus was applied in the current study to extract all bibliometric information about EVs. Due to their superior compatibility and current bibliometric data, the authors chose Scopus compared to WoS and Google Scholar. The authors searched for articles “Electric vehicles” in the title; the title “Electric vehicles” is a broad and inclusive term that encompasses all types of electric vehicles, including cars, buses, trucks, and motorcycles. It is a neutral and straightforward title that accurately reflects the content of the article, which is focused on electric vehicles as a whole rather than a specific type of electric vehicle. Other similar titles, such as “Electric cars” or “Electric vehicle,” may not be as inclusive or neutral and may not accurately reflect the content of the article. The search years were from 2011 to 2022 (Figure 5). A total of 17,150 articles relevant were published from 2011 to 2022. The annual number of publications increased year by year. In terms of document types, only research articles and review articles were considered. This analysis did not include conference papers, book chapters, notes, errata, editorials, short surveys, conference reviews, books, letters, retracted, data papers, or reports. Duplicate articles found in the process were also identified and removed.

3. Results and Discussion

The research protocol was explained in the above Section 2.1 and Figure 4. This study used VOSviewer software to analyze the articles published on EVs. The collected 17,150 articles were sorted and graphically displayed by publication year, document type, author, institute, country, cited author, keyword, and keyword co-occurrence of the EVs.

3.1. Countries Active in Research on EVs

Table 1 lists the top 15 countries contributing to the research of EVs. It was noted that China exhibited the highest impact, with 70,685 citations for 5933 documents, followed by the United States and the United Kingdom, which had citation counts of 59,679 and 16,336, respectively, making them the most influential countries in the research on EVs. The number of documents, number of citations, and total link strength demonstrate a country’s influence on the development of a study domain. The total link strength represents the influence of a country’s publications on other nations involved in this research. China, the United States, and the United Kingdom were the top three countries in terms of total link strength. The highest number of publications in this table as published in China (42.72%), the United States (13.62%), India (7.09%), and the United Kingdom (5.54%). This can be attributed to China’s ambition to achieve a carbon-neutral peak by 2030 and zero carbon emissions by 2060. In addition, the United States and the United Kingdom are the two largest nations listed in the Sustainable Development Goal 2030 agenda. Goals 11 and 13 of this agenda relate to sustainable mobility and climate change, which EVs have the potential to reduce to a great extent [70]. The research in this field is quite promising. On the other hand, Sweden and the Netherlands published fewer studies. Figure 6 displays the visualization network and density of countries based on citations. The circle size represents the country’s contribution to the particular field of research. The graphical representation of contributing countries could assist future researchers in establishing research collaborations, developing joint ventures, and exchanging innovative technologies and ideas. Figure 7 depicts the countries’ co-occurrence, visualization, connectivity to each other, and density proportional to the link strength. The size of a country node indicates how often that country publishes documents, but the country’s location indicates how often it appears together in publications.

3.2. Leading Organizations Scientific Analysis

The number of its publications can reflect an institution’s strengths and fields of expertise in a particular topic. The Scopus database was retrieved to determine the top 15 institutes with the highest EV citations. Table 2 lists these institutions. The highest number of documents was published by Chinese institutes, as seen in Table 2. The first institute, “State Key Laboratory of Automotive Safety and Energy, Tsinghua University, Beijing, 100084, China,” published 121 documents and was cited 2421 times in the subject domain, followed by “School of Mechanical Engineering, Beijing Institute of Technology, 100081, China,” and “School of Automotive Studies, Tongji University, Shanghai, 201804, China” with 89 and 73 documents, respectively, while their respective citation numbers were 620 and 417. Figure 8 depicts the most prominent institutes’ connection based on citations in the current study field. It is fascinating to examine the connections between the institution’s contributions to the subject of EVs.

3.3. Co-Authorship Scientific Mapping

The citation numbers of a researcher denote the level of influence of a researcher on a specific field [71]. The authors with the highest number of citations on the subject of EVs, as extracted from the Scopus database, are displayed in Table 3. The maximum number of documents published by each author in the topic domain is also shown in Table 3. The average number of citations for each author was obtained by dividing the number of citations by the number of documents. Li Y. had the most published documents (241), whereas Li J. had the highest amount of citations (4491 citations). Measuring the quantitative efficiency of an individual researcher would be difficult. Nevertheless, the author’s ranking was attainable by comparing each aspect individually or in connection with their synergy. Based on the overall number of citations, the top three authors are Li J. with 4491 citations, Xiong R. with 4112 citations, and Wang J. with 3972 citations. Moreover, by comparing the number of papers, it was determined that Li Y. had 241 documents, Wang Y. had 240 documents, Zhang Y. had 240 documents, and Zhang X. had 224 documents. Figure 9 depicts the connection between the most influential authors based on citations in the current field of study. It is fascinating to examine the connection between the authors’ contributions to the subject of EVs.

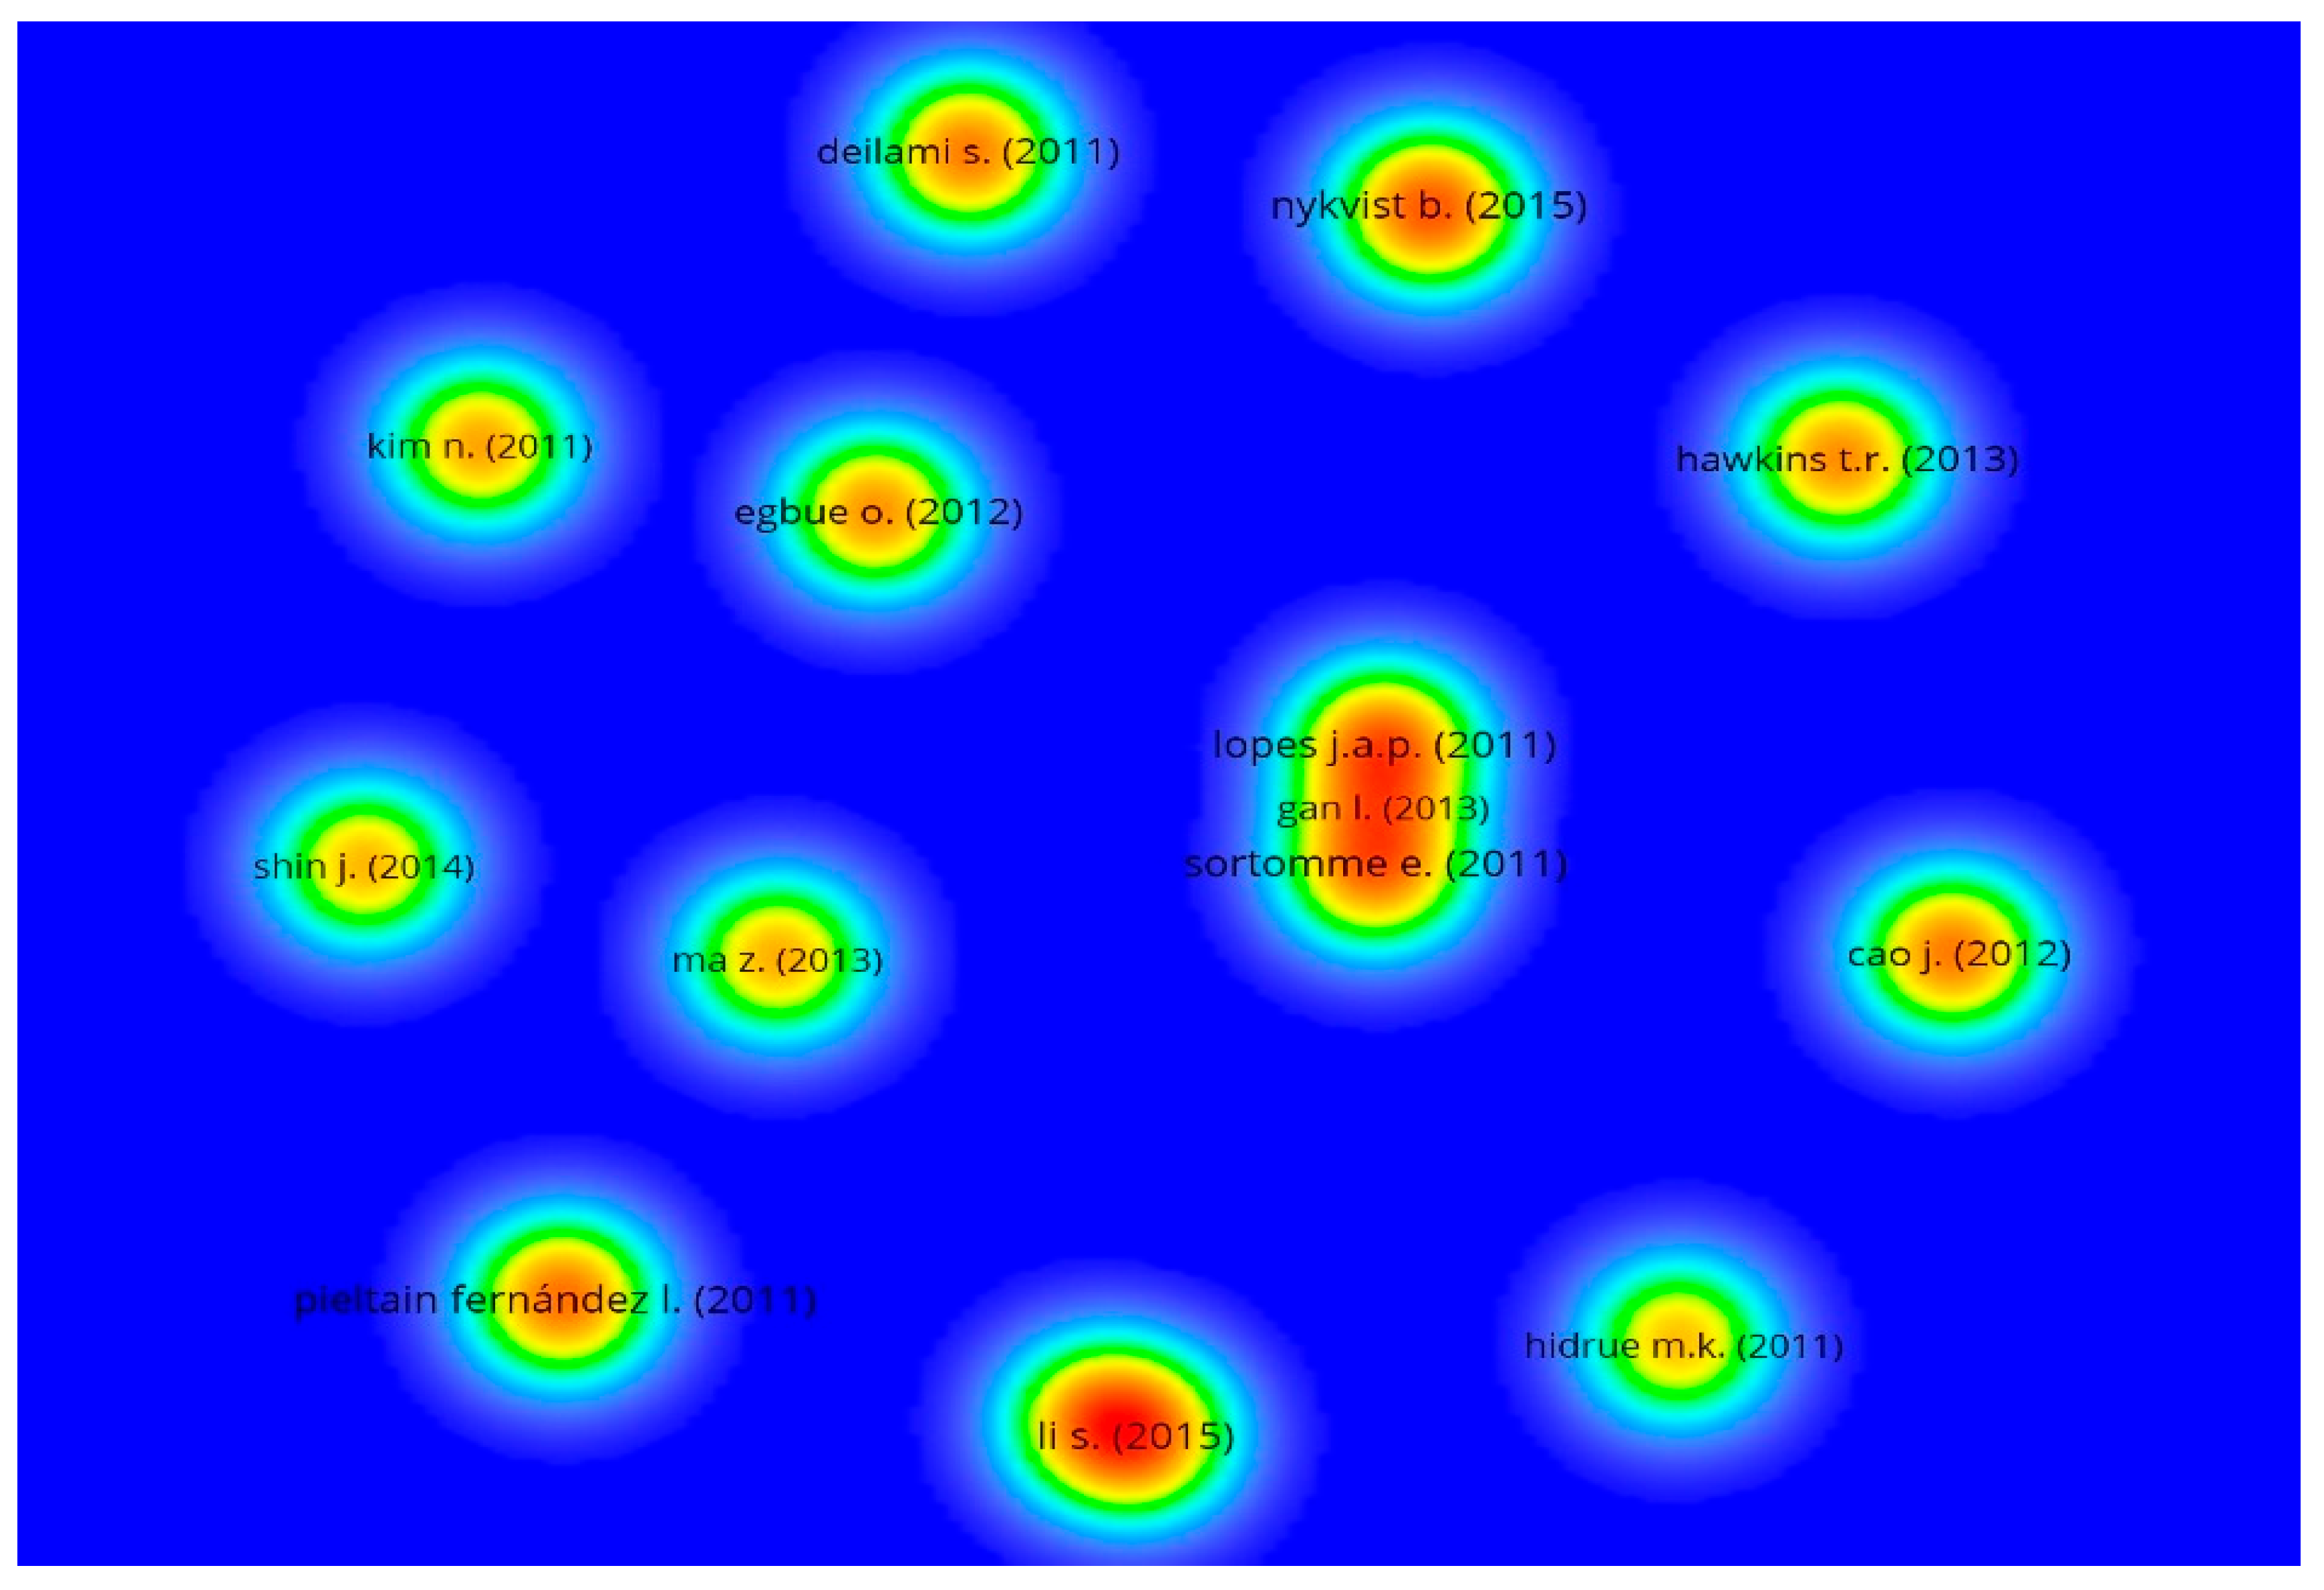
3.4. Bibliographic Coupling Network Analysis

The number of citations of a research article demonstrates the article’s influence in a particular research field. According to Donthu et al. articles with a high number of citations may be measured milestones in the study field [50]. Table 4 displays the most-frequently cited articles, their authors, and the year of publication. The article (Nykvist et al. 2015) was discovered to have the most citations, with 933. However, the article (Li S et al. 2015) was found to have 930 citations, while the article (Lopes et al. 2011) was found to have 894 citations. Figure 10 is a visualization of the authors with the most article citations, with a minimum of 489 citations, and the top related articles in the present study field were identified. The network demonstrated that the majority of articles were not related through citations. In the density visualization (shown in Figure 11), terms with higher and lower densities are distinguished by unique hues. The order of colors are red, yellow, green, and blue, with red representing the highest density and blue the lowest. As depicted in Figure 11, the density of Lopes, Gan, and Sortomme have the highest linkage.

3.5. Scientific Mapping of Journals

The scientific mapping of journal papers reflects the journal’s specialization and significance in the given topic. The Scopus database was queried to compile a list of the 15 journals with the highest number of citations and publications on the subject of EVs. Table 5 also displays the journals with the highest number of publications in the topic domain. The highest number of published documents was in Energies (925 documents), while Applied Energy received the most citations (14,831 citations). It would be difficult to quantify a journal’s productivity. Applied Energy, with 14,831 citations, IEEE Transactions on Smart Grid, with 13,348 citations, and Journal of Power Sources, with 11,239 citations, were revealed to be the three most-cited journals overall. In addition, by comparing the number of papers, it was determined that the top three journals were Energies with 925 documents, Applied Energy with 423 documents, and IEEE Access with 404 documents. Figure 12 depicts the most prominent journals’ linkages based on citations in the current study field. It is fascinating to examine the connection between the journals that contribute to the subject of EVs. In the density visualization (shown in Figure 13), journals with higher and lower densities are distinguished by unique colors.

3.6. Keyword Co-Occurrence Scientific Mapping

Keywords are an essential component of research since they indicate and represent the fundamental subject area of a study domain [86]. Table 6 displays the keywords utilized in this study that were found to appear most frequently in the research publications. Electric vehicles, Energy storage, and secondary batteries were discovered to be the top three most popular search terms. Figure 14 depicts the term co-occurrence network, including its visualization, connectivity, and density proportional to their link strength. The size of the keyword node indicates the keyword’s frequency, while the keyword position indicates its co-occurrence in articles. Electric vehicles (18.52%), energy storage (6.98%), and secondary batteries (4.37%) have larger nodes, indicating that these were determined to be the most significant keywords in the study of EVs. In the network, multiple keywords are represented by varied colors that indicate keyword co-occurrence in different articles. Figure 14 identifies four keyword clusters, each representing a distinct hue (blue, red, yellow, and green). Red nodes represent the keywords with the most recurrent co-occurrence, such as electric vehicles, energy storage, and charging stations. It was noticed that all of these terms frequently appeared in publications about EVs. In the density visualization (shown in Figure 15), terms with higher and lower densities are distinguished by unique colors. The order of the colors are red, and blue, with red representing the highest density and blue is the lowest. In the future, authors will be able to more readily retrieve published data in a certain domain owing to this finding.
In addition, a filter was applied to the 50 selected keywords in order to map the ten most popular keywords from 2011 to 2022, as depicted in Figure 16. The radius of the circle represents the frequency of occurrence, whereas the line joining two circles represents the occurrence of words concurrently. A greater incidence rate is indicated by a larger circle or a thicker line. Each of the three colors in Figure 16 represents a cluster.

4. Conclusions and Future Perspectives

The objective of this study was to investigate specific publications from the field of EVs in order to categorize and compare the principal factors and their relationships used by other researchers in this field. This study provides a bibliometric analysis of the EV-related literature published from 2011 to 2022. The published literature was extracted from the Scopus database, analyzed, and categorized according to predetermined criteria such as publication year, document type, author, institute, country, cited author, keyword, and keyword co-occurrence of the EV. A total of 17,150 articles published between 2011 and 2022 was retrieved. This study used the VOSviewer software to examine the above-sorted data due to its excellent analysis and visualization capabilities. With VOSviewer, we graphically represented the density, co-occurrence, trends, and linkage of the aforementioned data. The publishing patterns of EVs indicate that the research field is evolving, with a yearly increase in the number of publications. The trend is a steady increase in EV-related publications each year, which shows that this topic has been gaining popularity. This study indicated that bibliometric analysis is a scientific method that can be helpful for both experienced and aspiring scholars who seek to explore a retrospective of large and prolific fields in EV research.
The analysis indicated that China is leading in EV research and large-scale applications. China currently stands out as the country with the most publications (42.72%) on EVs, corresponding to worldwide publications. In addition, the ten top institutions in terms of numbers of articles and citations belong to China. Energies is the leading journal, having published more articles than other journals. Generally, the research studies were published in interdisciplinary or multidisciplinary journals.
Regarding the most-used keywords the analysis revealed that battery management systems, energy storage, and charging infrastructure are the main themes studied in EVs. Studies were focused on the optimization of energy storage and battery management systems. Another barrier to the growth of EVs is charging infrastructure. Charging infrastructure is rapidly expanding worldwide, but there are still areas where charging stations are not widely available. As the global fleet of EVs grows, new charging solutions are being developed. Furthermore, fast charging, inductive charging methods, and wireless power transfer are future technologies, and numerous studies have used them as a foundation.
EVs are now a reality, and they have a bright future. Several governments have backed the implementation of transport electrification, prompting nearly all automakers to invest in EVs. The findings of this study indicate that extensive research into the battery management system, energy storage, and charging infrastructure is required, for example, improvements in EV performance, particularly in the energy-storage system; enhancing security and autonomy; charging-system optimization, resulting in faster and easier charging; and development of charging networks to fulfill EV demand. As a result, it is essential to intensify the research and development efforts to address the technological and economic constraints related to EVs. The driving force for this escalation can fulfill the Sustainable Development Goals of the United Nations. The agreement’s purpose is to limit global warming through the management of GHG emissions, the availability of renewable energy, inclusive economic growth, sustainable cities, and responsible production and consumption.

Author Contributions

Conceptualization, I.U. and M.S.; methodology, I.U. and M.S.; software, I.U.; validation, M.S., A.J. and J.Z.; formal analysis, I.U., M.S. and A.J.; investigation, J.Z. and A.S.; writing—original draft preparation, I.U. and M.S.; writing—review and editing, A.J., J.Z. and A.S.; visualization, I.U., M.S., A.J. and J.Z.; supervision, J.Z. and A.S.; project administration, J.Z. and A.S.; funding acquisition, A.S. All authors have read and agreed to the published version of the manuscript.

Funding

This research received no external funding.

Data Availability Statement

Not applicable.

Acknowledgments

Thanks to the editors and reviewers for their constructive comments and suggestions.

Conflicts of Interest

The authors declare no conflict of interest.

References

  1. Walters, J.G.; Marsh, S.; Rodrigues, L. A Rural Transport Implementation Index for Connected, Autonomous and Electric Vehicles. Future Transp. 2022, 2, 753–773. [Google Scholar] [CrossRef]
  2. Graham, J.D.; Brungard, E. Consumer Adoption of Plug-In Electric Vehicles in Selected Countries. Future Transp. 2021, 1, 303–325. [Google Scholar] [CrossRef]
  3. Hussain, I.; Wang, H.; Safdar, M.; Ho, Q.B.; Wemegah, T.D.; Noor, S. Estimation of Shipping Emissions in Developing Country: A Case Study of Mohammad Bin Qasim Port, Pakistan. Int. J. Environ. Res. Public Health 2022, 19, 11868. [Google Scholar] [CrossRef] [PubMed]
  4. Ullah, I.; Liu, K.; Yamamoto, T.; Zahid, M.; Jamal, A. Electric Vehicle Energy Consumption Prediction Using Stacked Generalization: An Ensemble Learning Approach. Int. J. Green Energy 2021, 18, 896–909. [Google Scholar] [CrossRef]
  5. Ullah, I.; Liu, K.; Yamamoto, T.; Al Mamlook, R.E.; Jamal, A. A Comparative Performance of Machine Learning Algorithm to Predict Electric Vehicles Energy Consumption: A Path towards Sustainability. Energy Environ. 2021, 33, 1583–1612. [Google Scholar] [CrossRef]
  6. Bhardwaj, S.; Mostofi, H. Technical and Business Aspects of Battery Electric Trucks—A Systematic Review. Future Transp. 2022, 2, 382–401. [Google Scholar] [CrossRef]
  7. Makeen, P.; Ghali, H.A.; Memon, S. A Review of Various Fast Charging Power and Thermal Protocols for Electric Vehicles Represented by Lithium-Ion Battery Systems. Future Transp. 2022, 2, 281–299. [Google Scholar] [CrossRef]
  8. Gezmish, M.; Truong, L.T. Estimating the Potential of Electric Vehicles for Travelling to Work and Education in Melbourne, Victoria. Future Transp. 2021, 1, 737–746. [Google Scholar] [CrossRef]
  9. Wang, Z.; Safdar, M.; Zhong, S.; Liu, J.; Xiao, F. Public Preferences of Shared Autonomous Vehicles in Developing Countries: A Cross-National Study of Pakistan and China. J. Adv. Transp. 2021, 2021, 5141798. [Google Scholar] [CrossRef]
  10. Safdar, M.; Jamal, A.; Al-Ahmadi, H.M.; Rahman, M.T.; Almoshaogeh, M. Analysis of the Influential Factors towards Adoption of Car-Sharing: A Case Study of a Megacity in a Developing Country. Sustainability 2022, 14, 2778. [Google Scholar] [CrossRef]
  11. Ullah, I.; Liu, K.; Vanduy, T. Examining Travelers’ Acceptance towards Car Sharing Systems—Peshawar City, Pakistan. Sustainability 2019, 11, 808. [Google Scholar] [CrossRef] [Green Version]
  12. Ullah, I.; Jamal, A.; Subhan, F. Public Perception of Autonomous Car: A Case Study for Pakistan. Adv. Transp. Stud. 2019, 49, 145–154. [Google Scholar]
  13. Brady, J.; O’Mahony, M. Travel to Work in Dublin. The Potential Impacts of Electric Vehicles on Climate Change and Urban Air Quality. Transp. Res. Part D Transp. Environ. 2011, 16, 188–193. [Google Scholar] [CrossRef]
  14. Ogunkunbi, G.A.; Al-Zibaree, H.K.Y.; Meszaros, F. Evidence-Based Market Overview of Incentives and Disincentives in Electric Mobility as a Key to the Sustainable Future. Future Transp. 2021, 1, 290–302. [Google Scholar] [CrossRef]
  15. Olivier, J.G.; Schure, K.M.; Peters, J. Trends in Global CO2 and to Tal Greenhouse Gas Emissions. Summary of the 2017 Report; PBL Report; PBL Netherlands Environmental Assessment Agency: The Hague, The Netherlands, 2017. [Google Scholar]
  16. Liu, K.; Wang, J.; Yamamoto, T.; Morikawa, T. Exploring the Interactive Effects of Ambient Temperature and Vehicle Auxiliary Loads on Electric Vehicle Energy Consumption. Appl. Energy 2018, 227, 324–331. [Google Scholar] [CrossRef]
  17. Liu, K.; Wang, J.; Yamamoto, T.; Morikawa, T. Modelling the Multilevel Structure and Mixed Effects of the Factors Influencing the Energy Consumption of Electric Vehicles. Appl. Energy 2016, 183, 1351–1360. [Google Scholar] [CrossRef]
  18. Wang, Z.; Yang, L. Delinking Indicators on Regional Industry Development and Carbon Emissions: Beijing–Tianjin–Hebei Economic Band Case. Ecol. Indic. 2015, 48, 41–48. [Google Scholar] [CrossRef]
  19. Wang, Q.; Li, R.; Jiang, R. Decoupling and Decomposition Analysis of Carbon Emissions from Industry: A Case Study from China. Sustainability 2016, 8, 1059. [Google Scholar] [CrossRef] [Green Version]
  20. Blesl, M.; Das, A.; Fahl, U.; Remme, U. Role of Energy Efficiency Standards in Reducing CO2 Emissions in Germany: An Assessment with TIMES. Energy Policy 2007, 35, 772–785. [Google Scholar] [CrossRef]
  21. Deb, S.; Tammi, K.; Kalita, K.; Mahanta, P. Review of Recent Trends in Charging Infrastructure Planning for Electric Vehicles. Wiley Interdiscip. Rev. Energy Environ. 2018, 7, e306. [Google Scholar] [CrossRef] [Green Version]
  22. Liu, K.; Yamamoto, T.; Morikawa, T. Impact of Road Gradient on Energy Consumption of Electric Vehicles. Transp. Res. Part D Transp. Environ. 2017, 54, 74–81. [Google Scholar] [CrossRef]
  23. Liu, K.; Gao, H.; Wang, Y.; Feng, T.; Li, C. Robust Charging Strategies for Electric Bus Fleets under Energy Consumption Uncertainty. Transp. Res. Part D Transp. Environ. 2022, 104, 103215. [Google Scholar] [CrossRef]
  24. Behr, P. MIT Panel Says a Charging Infrastructure May Be a Bigger Roadblock for Electric Vehicles than Technology; Environment & Energy Publishing, LLC.: Washington, DC, USA, 14 January 2011. [Google Scholar]
  25. Mitra, P.; Venayagamoorthy, G.K. Intelligent Coordinated Control of a Wind Farm and Distributed Smartparks. In Proceedings of the 2010 IEEE Industry Applications Society Annual Meeting, Houston, TX, USA, 3–7 October 2010; IEEE: Piscataway, NJ, USA, 2010; pp. 1–8. [Google Scholar]
  26. Tulpule, P.; Marano, V.; Rizzoni, G. Effects of Different PHEV Control Strategies on Vehicle Performance. In Proceedings of the 2009 American Control Conference, St. Louis, MO, USA, 10–12 June 2009; IEEE: Piscataway, NJ, USA, 2009; pp. 3950–3955. [Google Scholar]
  27. Coffman, M.; Bernstein, P.; Wee, S. Electric Vehicles Revisited: A Review of Factors That Affect Adoption. Transp. Rev. 2017, 37, 79–93. [Google Scholar] [CrossRef]
  28. Ullah, I.; Liu, K.; Yamamoto, T.; Shafiullah, M.; Jamal, A. Grey Wolf Optimizer-Based Machine Learning Algorithm to Predict Electric Vehicle Charging Duration Time. Transp. Lett. 2022, 1–18. [Google Scholar] [CrossRef]
  29. Wang, J.; Liu, K.; Yamamoto, T. Improving Electricity Consumption Estimation for Electric Vehicles Based on Sparse GPS Observations. Energies 2017, 10, 129. [Google Scholar] [CrossRef] [Green Version]
  30. Hawkins, T.R.; Singh, B.; Majeau-Bettez, G.; Strømman, A.H. Comparative Environmental Life Cycle Assessment of Conventional and Electric Vehicles. J. Ind. Ecol. 2013, 17, 53–64. [Google Scholar] [CrossRef]
  31. Sojoudi, S.; Low, S.H. Optimal Charging of Plug-in Hybrid Electric Vehicles in Smart Grids. In Proceedings of the 2011 IEEE Power and Energy Society General Meeting, Detroit, MI, USA, 24–29 July 2011; IEEE: Piscataway, NJ, USA, 2011; pp. 1–6. [Google Scholar]
  32. Pang, C.; Dutta, P.; Kim, S.; Kezunovic, M.; Damnjanovic, I. PHEVs as Dynamically Configurable Dispersed Energy Storage for V2B Uses in the Smart Grid. In Proceedings of the 7th Mediterranean Conference and Exhibition on Power Generation, Transmission, Distribution and Energy Conversion (MedPower 2010), Ayia Napa, Cyprus, 7–10 November 2010. [Google Scholar]
  33. Kefayati, M.; Caramanis, C. Efficient Energy Delivery Management for PHEVs. In Proceedings of the 2010 First IEEE International Conference on Smart Grid Communications, Gaithersburg, MD, USA, 4–6 October 2010; IEEE: Piscataway, NJ, USA, 2010; pp. 525–530. [Google Scholar]
  34. D’Adamo, I.; Rosa, P. A Structured Literature Review on Obsolete Electric Vehicles Management Practices. Sustainability 2019, 11, 6876. [Google Scholar] [CrossRef] [Green Version]
  35. Introduction–Global EV Outlook 2021–Analysis. Available online: https://www.iea.org/reports/global-ev-outlook-2021/introduction (accessed on 8 February 2023).
  36. Ahn, Y.; Yeo, H. An Analytical Planning Model to Estimate the Optimal Density of Charging Stations for Electric Vehicles. PloS ONE 2015, 10, e0141307. [Google Scholar] [CrossRef]
  37. Adornato, B.; Patil, R.; Filipi, Z.; Baraket, Z.; Gordon, T. Characterizing Naturalistic Driving Patterns for Plug-in Hybrid Electric Vehicle Analysis. In Proceedings of the 2009 IEEE Vehicle Power and Propulsion Conference, Dearborn, MI, USA, 7–11 September 2009; pp. 655–660. [Google Scholar]
  38. Faria, R.; Moura, P.; Delgado, J.; De Almeida, A.T. A Sustainability Assessment of Electric Vehicles as a Personal Mobility System. Energy Convers. Manag. 2012, 61, 19–30. [Google Scholar] [CrossRef]
  39. Abdelaty, H.; Al-Obaidi, A.; Mohamed, M.; Farag, H.E. Machine Learning Prediction Models for Battery-Electric Bus Energy Consumption in Transit. Transp. Res. Part D Transp. Environ. 2021, 96, 102868. [Google Scholar] [CrossRef]
  40. Bolovinou, A.; Bakas, I.; Amditis, A.; Mastrandrea, F.; Vinciotti, W. Online Prediction of an Electric Vehicle Remaining Range Based on Regression Analysis. In Proceedings of the 2014 IEEE International Electric Vehicle Conference (IEVC), Florence, Italy, 17–19 December 2014; IEEE: Piscataway, NJ, USA, 2014; pp. 1–8. [Google Scholar]
  41. Dörr, D.; Grabengiesser, D.; Gauterin, F. Online Driving Style Recognition Using Fuzzy Logic. In Proceedings of the 17th International IEEE Conference on Intelligent Transportation Systems (ITSC), Qingdao, China, 8–11 October 2014; IEEE: Piscataway, NJ, USA, 2014; pp. 1021–1026. [Google Scholar]
  42. Anwar, A.; Siddique, M.; Dogan, E.; Sharif, A. The Moderating Role of Renewable and Non-Renewable Energy in Environment-Income Nexus for ASEAN Countries: Evidence from Method of Moments Quantile Regression. Renew. Energy 2021, 164, 956–967. [Google Scholar] [CrossRef]
  43. Skerlos, S.J.; Winebrake, J.J. Targeting Plug-in Hybrid Electric Vehicle Policies to Increase Social Benefits. Energy Policy 2010, 38, 705–708. [Google Scholar] [CrossRef]
  44. Graham-Rowe, E.; Gardner, B.; Abraham, C.; Skippon, S.; Dittmar, H.; Hutchins, R.; Stannard, J. Mainstream Consumers Driving Plug-in Battery-Electric and Plug-in Hybrid Electric Cars: A Qualitative Analysis of Responses and Evaluations. Transp. Res. Part A Policy Pract. 2012, 46, 140–153. [Google Scholar] [CrossRef]
  45. Lieven, T.; Mühlmeier, S.; Henkel, S.; Waller, J.F. Who Will Buy Electric Cars? An Empirical Study in Germany. Transp. Res. Part D Transp. Environ. 2011, 16, 236–243. [Google Scholar] [CrossRef]
  46. Høyer, K.G. The History of Alternative Fuels in Transportation: The Case of Electric and Hybrid Cars. Util. Policy 2008, 16, 63–71. [Google Scholar] [CrossRef]
  47. Teixeira, A.C.R.; Sodré, J.R. Simulation of the Impacts on Carbon Dioxide Emissions from Replacement of a Conventional Brazilian Taxi Fleet by Electric Vehicles. Energy 2016, 115, 1617–1622. [Google Scholar] [CrossRef]
  48. Kampman, B.; Leguijt, C.; Bennink, D.; Wielders, L.; Rijkee, X.; Buck, A.D.; Braa, W. Green Power for Electric Cars. Development of Policy Recommendations to Harvest the Potential of Electric Vehicles; CE Delft: Delft, The Netherlands, 2010. [Google Scholar]
  49. Li, C.; Cao, Y.; Zhang, M.; Wang, J.; Liu, J.; Shi, H.; Geng, Y. Hidden Benefits of Electric Vehicles for Addressing Climate Change. Sci. Rep. 2015, 5, 9213. [Google Scholar] [CrossRef] [Green Version]
  50. Donthu, N.; Kumar, S.; Mukherjee, D.; Pandey, N.; Lim, W.M. How to Conduct a Bibliometric Analysis: An Overview and Guidelines. J. Bus. Res. 2021, 133, 285–296. [Google Scholar] [CrossRef]
  51. Donthu, N.; Kumar, S.; Pattnaik, D. Forty-Five Years of Journal of Business Research: A Bibliometric Analysis. J. Bus. Res. 2020, 109, 1–14. [Google Scholar] [CrossRef]
  52. Van Eck, N.; Waltman, L. Software Survey: VOSviewer, a Computer Program for Bibliometric Mapping. Scientometrics 2010, 84, 523–538. [Google Scholar] [CrossRef] [Green Version]
  53. Ahmad, W.; Khan, M.; Smarzewski, P. Effect of Short Fiber Reinforcements on Fracture Performance of Cement-Based Materials: A Systematic Review Approach. Materials 2021, 14, 1745. [Google Scholar] [CrossRef] [PubMed]
  54. Anthony Jnr, B. Integrating Electric Vehicles to Achieve Sustainable Energy as a Service Business Model in Smart Cities. Front. Sustain. Cities 2021, 3, 685716. [Google Scholar] [CrossRef]
  55. Anthony Jnr, B. Smart City Data Architecture for Energy Prosumption in Municipalities: Concepts, Requirements, and Future Directions. Int. J. Green Energy 2020, 17, 827–845. [Google Scholar] [CrossRef]
  56. Silva, H.B.d.; Santiago, L.P. Optimal Energy Trading Policy for Solar-Powered Microgrids: A Modeling Approach Based on Plug-in Hybrid Electric Vehicles. In Smart and Digital Cities; Springer: Berlin/Heidelberg, Germany, 2019; pp. 251–273. [Google Scholar]
  57. Muratori, M.; Alexander, M.; Arent, D.; Bazilian, M.; Cazzola, P.; Dede, E.M.; Farrell, J.; Gearhart, C.; Greene, D.; Jenn, A. The Rise of Electric Vehicles—2020 Status and Future Expectations. Prog. Energy 2021, 3, 022002. [Google Scholar] [CrossRef]
  58. Ramirez Barreto, D.A.; Ochoa Guillermo, E.V.; Peña Rodriguez, A.; Cardenas Escorcia, Y.d.C. Bibliometric Analysis of Nearly a Decade of Research in Electric Vehicles: A Dynamic Approach. ARPN J. Eng. Appl. Sci. 2018, 13, 17. [Google Scholar]
  59. Zhang, P.; Yan, F.; Du, C. A Comprehensive Analysis of Energy Management Strategies for Hybrid Electric Vehicles Based on Bibliometrics. Renew. Sustain. Energy Rev. 2015, 48, 88–104. [Google Scholar] [CrossRef]
  60. Secinaro, S.; Brescia, V.; Calandra, D.; Biancone, P. Employing Bibliometric Analysis to Identify Suitable Business Models for Electric Cars. J. Clean. Prod. 2020, 264, 121503. [Google Scholar] [CrossRef]
  61. Miah, M.S.; Hossain Lipu, M.S.; Meraj, S.T.; Hasan, K.; Ansari, S.; Jamal, T.; Masrur, H.; Elavarasan, R.M.; Hussain, A. Optimized Energy Management Schemes for Electric Vehicle Applications: A Bibliometric Analysis towards Future Trends. Sustainability 2021, 13, 12800. [Google Scholar] [CrossRef]
  62. Tranfield, D.; Denyer, D.; Smart, P. Towards a Methodology for Developing Evidence-Informed Management Knowledge by Means of Systematic Review. Br. J. Manag. 2003, 14, 207–222. [Google Scholar] [CrossRef]
  63. Salmerón-Manzano, E.; Manzano-Agugliaro, F. Worldwide Scientific Production Indexed by Scopus on Labour Relations. Publications 2017, 5, 25. [Google Scholar] [CrossRef] [Green Version]
  64. Ihsanullah, I.; Jamal, A.; Ilyas, M.; Zubair, M.; Khan, G.; Atieh, M.A. Bioremediation of Dyes: Current Status and Prospects. J. Water Process Eng. 2020, 38, 101680. [Google Scholar] [CrossRef]
  65. Ihsanullah, I.; Alam, G.; Jamal, A.; Shaik, F. Recent Advances in Applications of Artificial Intelligence in Solid Waste Management: A Review. Chemosphere 2022, 309, 136631. [Google Scholar] [CrossRef] [PubMed]
  66. Al-Khoury, A.; Hussein, S.A.; Abdulwhab, M.; Aljuboori, Z.M.; Haddad, H.; Ali, M.A.; Abed, I.A.; Flayyih, H.H. Intellectual Capital History and Trends: A Bibliometric Analysis Using Scopus Database. Sustainability 2022, 14, 11615. [Google Scholar] [CrossRef]
  67. Karchegani, M.R.; Sofian, S.; Amin, S.M. The Relationship between Intellectual Capital and Innovation: A Review. Int. J. Bus. Manag. Stud. 2013, 2, 561–581. [Google Scholar]
  68. Tjahjadi, B.; Soewarno, N.; Astri, E.; Hariyati, H. Does Intellectual Capital Matter in Performance Management System-Organizational Performance Relationship? Experience of Higher Education Institutions in Indonesia. J. Intellect. Cap. 2019, 20, 533–554. [Google Scholar]
  69. Briones-Bitar, J.; Carrión-Mero, P.; Montalván-Burbano, N.; Morante-Carballo, F. Rockfall Research: A Bibliometric Analysis and Future Trends. Geosciences 2020, 10, 403. [Google Scholar] [CrossRef]
  70. Raza, A.; Safdar, M.; Zhong, M.; Hunt, J.D. Analyzing Spatial Location Preference of Urban Activities with Mode-Dependent Accessibility Using Integrated Land Use–Transport Models. Land 2022, 11, 1139. [Google Scholar] [CrossRef]
  71. Acedo, F.J.; Barroso, C.; Casanueva, C.; Galán, J.L. Co-Authorship in Management and Organizational Studies: An Empirical and Network Analysis. J. Manag. Stud. 2006, 43, 957–983. [Google Scholar] [CrossRef]
  72. Nykvist, B.; Nilsson, M. Rapidly Falling Costs of Battery Packs for Electric Vehicles. Nat. Clim. Chang. 2015, 5, 329–332. [Google Scholar] [CrossRef]
  73. Li, S.; Mi, C.C. Wireless Power Transfer for Electric Vehicle Applications. IEEE J. Emerg. Sel. Top. Power Electron. 2014, 3, 4–17. [Google Scholar]
  74. Lopes, J.A.P.; Soares, F.J.; Almeida, P.M.R. Integration of Electric Vehicles in the Electric Power System. Proc. IEEE 2010, 99, 168–183. [Google Scholar] [CrossRef] [Green Version]
  75. Sortomme, E.; El-Sharkawi, M.A. Optimal Charging Strategies for Unidirectional Vehicle-to-Grid. IEEE Trans. Smart Grid 2010, 2, 131–138. [Google Scholar] [CrossRef]
  76. Fernandez, L.P.; San Román, T.G.; Cossent, R.; Domingo, C.M.; Frias, P. Assessment of the Impact of Plug-in Electric Vehicles on Distribution Networks. IEEE Trans. Power Syst. 2010, 26, 206–213. [Google Scholar] [CrossRef]
  77. Cao, J.; Emadi, A. A New Battery/Ultracapacitor Hybrid Energy Storage System for Electric, Hybrid, and Plug-in Hybrid Electric Vehicles. IEEE Trans. Power Electron. 2011, 27, 122–132. [Google Scholar]
  78. Deilami, S.; Masoum, A.S.; Moses, P.S.; Masoum, M.A. Real-Time Coordination of Plug-in Electric Vehicle Charging in Smart Grids to Minimize Power Losses and Improve Voltage Profile. IEEE Trans. Smart Grid 2011, 2, 456–467. [Google Scholar] [CrossRef]
  79. Egbue, O.; Long, S. Barriers to Widespread Adoption of Electric Vehicles: An Analysis of Consumer Attitudes and Perceptions. Energy Policy 2012, 48, 717–729. [Google Scholar] [CrossRef]
  80. Budhia, M.; Boys, J.T.; Covic, G.A.; Huang, C.-Y. Development of a Single-Sided Flux Magnetic Coupler for Electric Vehicle IPT Charging Systems. IEEE Trans. Ind. Electron. 2011, 60, 318–328. [Google Scholar] [CrossRef]
  81. Kim, N.; Cha, S.; Peng, H. Optimal Control of Hybrid Electric Vehicles Based on Pontryagin’s Minimum Principle. IEEE Trans. Control. Syst. Technol. 2010, 19, 1279–1287. [Google Scholar]
  82. Gan, L.; Topcu, U.; Low, S.H. Optimal Decentralized Protocol for Electric Vehicle Charging. IEEE Trans. Power Syst. 2012, 28, 940–951. [Google Scholar] [CrossRef] [Green Version]
  83. Ma, Z.; Callaway, D.S.; Hiskens, I.A. Decentralized Charging Control of Large Populations of Plug-in Electric Vehicles. IEEE Trans. Control. Syst. Technol. 2011, 21, 67–78. [Google Scholar] [CrossRef]
  84. Shin, J.; Shin, S.; Kim, Y.; Ahn, S.; Lee, S.; Jung, G.; Jeon, S.-J.; Cho, D.-H. Design and Implementation of Shaped Magnetic-Resonance-Based Wireless Power Transfer System for Roadway-Powered Moving Electric Vehicles. IEEE Trans. Ind. Electron. 2013, 61, 1179–1192. [Google Scholar] [CrossRef]
  85. Hidrue, M.K.; Parsons, G.R.; Kempton, W.; Gardner, M.P. Willingness to Pay for Electric Vehicles and Their Attributes. Resour. Energy Econ. 2011, 33, 686–705. [Google Scholar] [CrossRef] [Green Version]
  86. Bramer, W.M.; De Jonge, G.B.; Rethlefsen, M.L.; Mast, F.; Kleijnen, J. A Systematic Approach to Searching: An Efficient and Complete Method to Develop Literature Searches. J. Med. Libr. Assoc. JMLA 2018, 106, 531. [Google Scholar] [CrossRef] [PubMed] [Green Version]
Figure 1. Electric passenger car stock in the major markets in EVI countries [35].
Energies 16 02344 g001
Figure 2. EV sales and market share in EVI countries and Europe [35].
Energies 16 02344 g002
Figure 3. EV classification according to their engine technology and setting.
Energies 16 02344 g003
Figure 4. Proposed methods workflow.
Energies 16 02344 g004
Figure 5. The annual published articles in the field of EVs (Scopus database).
Energies 16 02344 g005
Figure 6. Leading countries mapping and their linkage based on citations.
Energies 16 02344 g006
Figure 7. Density visualization of leading-countries-wise network.
Energies 16 02344 g007
Figure 8. Leading organizations’ linkage based on citations.
Energies 16 02344 g008
Figure 9. Researcher co-authorship linkage based on citations.
Energies 16 02344 g009
Figure 10. Articles’ linkage based on citations.
Energies 16 02344 g010
Figure 11. Author linkage based on citation density visualization.
Energies 16 02344 g011
Figure 12. Journal linkage based on citations.
Energies 16 02344 g012
Figure 13. Journal-based citation density visualization.
Energies 16 02344 g013
Figure 14. Network based on all keywords’ linkages.
Energies 16 02344 g014
Figure 15. Density visualization of keywords.
Energies 16 02344 g015
Figure 16. Network based on ten keywords’ linkage.
Energies 16 02344 g016
Table 1. Top 15 leading active research countries based on documents and citations.
CountryDocumentsCitationsCountry ContributionsTotal Link Strength
China593370,68542.72%26,725
United States189159,67913.62%22,148
India98541717.09%5390
United kingdom76916,3665.54%9455
South Korea69511,8225.00%4507
Germany67311,9324.85%5732
Canada59714,5104.30%6636
Iran43872913.15%4134
Australia43210,0323.11%5333
Iltaly38774302.79%3474
France37966242.73%2698
Spain18841771.35%2790
Denmark18642441.34%2632
Sweden17050661.22%2583
Netherlands16650051.20%2561
Table 2. Top 15 leading organizations based on citations and documents.
OrganizationDocumentsCitationsOrganization ContributionTotal Link Strength
State Key Laboratory of Automotive Safety and Energy, Tsinghua University, Beijing, 100084, China121242116.95%169
School Of Mechanical Engineering, Beijing Institute of Technology, Beijing, 100081, China8962012.46%127
School of Automotive Studies, Tongji University, Shanghai, 201804, China7341710.22%39
National Engineering Laboratory for Electric Vehicles, Beijing Institute of Technology, Beijing, 100081, China6413298.96%143
State Key Laboratory of Automotive Simulation and Control, Jilin University, Changchun, 130022, China593378.26%37
School of Electrical Engineering, Southeast University, Nanjing, 210096, China535197.42%9
School of Automotive and Traffic Engineering, Jiangsu University, Zhenjiang, 212013, China433016.02%81
National Engineering Laboratory for Electric Vehicles, School of Mechanical Engineering, Beijing Institute of Technology, Beijing, 100081, China3813275.32%102
Collaborative Innovation Center of Electric Vehicles in Beijing, Beijing Institute of Technology, Beijing, 100081, China3711095.18%123
Automotive Engineering Research Institute, Jiangsu University, Zhenjiang, 212013, China363185.04%92
College of Electrical Engineering, Zhejiang University, Hangzhou, 310027, China357924.90%6
State Key Laboratory of Automotive Safety and Energy, Tsinghua University, Beijing 100084, China2711193.78%78
Faculty of Transportation Engineering, Kunming University of Science and Technology, Kunming, 650500, China242033.36%104
State Key Laboratory Of Mechanical Transmissions, Department of Automotive Engineering, Chongqing University, Chongqing, 400044, China83951.12%40
Advanced Vehicle Engineering Centre, Cranfield University, Cranfield, United Kingdom75720.98%62
Table 3. Top 15 Authors with highest number of citations and documents.
AuthorDocumentsCitationsAverage CitationsTotal Link Strength
Li Y.241235910449
Wang Y.24021069412
Zhang Y.240245810595
Zhang X.224324514546
Wang J.223397218473
Li J.214449121676
Liu Y.19413327528
Wang X.174205212404
Zhang J.165159610415
Zhang L.157230915363
Zhang H.141262619367
Chen Z.124242520648
Ouyang M.70332347428
Hu X.65369457483
Xiong R.59411270467
Table 4. Top 15 articles with most citations.
DocumentCitationsLinksReferences
Nykvist, B.; Nilsson, M. (2015), Rapidly falling costs of battery packs for electric vehicles. Nature climate change, 9330[72]
Li, S.; Mi, C.C. (2015), Wireless Power Transfer for Electric Vehicle Applications9301[73]
Lopes, J.A.P.; Soares, F.J.; Almeida, P.M.R. (2011), Integration of Electric Vehicles in the Electric Power System8941[74]
Sortomme, E.; El-Sharkawi, M.A. (2011), Coordinated Charging of Plug-In Hybrid Electric Vehicles to Minimize Distribution System Losses8181[75]
Fernandez, L.P.; San Román, T.G.; Cossent, R.; Domingo, C.M.; Frias, P. (2011), Assessment of the Impact of Plug-in Electric Vehicles on Distribution Networks8010[76]
Cao, J.; Emadi, A. (2012), A New Battery/UltraCapacitor Hybrid Energy Storage System for Electric, Hybrid, and Plug-In Hybrid Electric Vehicles7520[77]
Deilami, S.; Masoum, A.S.; Moses, P.S.; Masoum, M.A. (2011), Real-Time Coordination of Plug-In Electric Vehicle Charging in Smart Grids to Minimize Power Losses and Improve Voltage Profile7390[78]
Hawkins, T.R.; Singh, B.; Majeau-Bettez, G.; Strømman, A.H. (2013), Comparative Environmental Life Cycle Assessment of Conventional and Electric Vehicles6730[30]
Egbue, O.; Long, S. (2012), Barriers to widespread adoption of electric vehicles: An analysis of consumer attitudes and perceptions6510[79]
Budhia, M.; Boys, J.T.; Covic, G.A.; Huang, C.-Y. (2013), Development of a Single-Sided Flux Magnetic Coupler for Electric Vehicle IPT Charging Systems6141[80]
Kim, N.; Cha, S.; Peng, H. (2011), Optimal Control of Hybrid Electric Vehicles Based on Pontryagin’s Minimum Principle5790[81]
Gan, L.; Topcu, U.; Low, S.H. (2013), Optimal decentralized protocol for electric vehicle charging5632[82]
Ma, Z.; Callaway, D.S.; Hiskens, I.A. (2013), Decentralized Charging Control of Large Populations of Plug-in Electric Vehicles5440[83]
Shin, J.; Shin, S.; Kim, Y.; Ahn, S.; Lee, S.; Jung, G.; Jeon, S. -J.; Cho, D.-H. (2014), Design and Implementation of Shaped Magnetic-Resonance-Based Wireless Power Transfer System for Roadway-Powered Moving Electric Vehicles5140[84]
Hidrue m.k. (2011), Willingness to pay for electric vehicles and their attributes4890[85]
Table 5. Top 15 journals based on citations and documents.
SourceDocumentsCitationsDocument ContributionsCitation ContributionsTotal Link Strength
Energies925753322.62%7.01%2794
Applied Energy42314,83110.34%13.81%2967
IEEE Access40424179.88%2.25%1241
Energy39189609.56%8.34%2197
IEEE Transactions on Vehicular Technology34911,0558.53%10.29%1249
Transportation Research Part D: Transport And Environment22658645.53%5.46%1985
IEEE Transactions on Smart Grid22213,3485.43%12.43%1486
Sustainability (Switzerland)22112165.40%1.13%1107
Journal of Cleaner Production20836205.09%3.37%1195
Journal of Power Sources20411,2394.99%10.46%1197
Energy Policy15572843.79%6.78%1558
IEEE Transactions on Industrial Electronics14978603.64%7.32%418
IEEE Transactions on Power Systems7367981.78%6.33%765
Transportation Research Part C: Emerging Technologies7127741.74%2.58%680
Transportation Research Part A: Policy And Practice6926181.69%2.44%883
Table 6. Keyword co-occurrences.
KeywordOccurrences% AgeTotal Link StrengthKeywordOccurrences% AgeTotal Link Strength
Electric vehicles661518.52%20,947Lithium-ion batteries5391.51%2204
Energy storage 24946.98%11,069Matlab4621.29%2197
Secondary batteries15624.37%7624Vehicle wheels4501.26%2000
Hybrid vehicles15004.20%5836Hybrid electric vehicle4411.23%1521
Energy management7792.18%3706Vehicle performance4411.23%1953
Electric automobiles12663.54%4893Permanent magnets4401.23%1442
Electric machine control11963.35%5811Energy storage4341.22%2028
Optimization10883.05%5019Charging station4001.12%1666
Traction motors9832.75%4140Control strategies4001.12%1793
Electric power transmission networks8852.48%4598Commerce3991.12%1645
Battery management systems8152.28%4127Electric drives3981.11%1664
Energy utilization7312.05%3233Torque3871.08%1752
Costs6991.96%3263Scheduling3821.07%1753
Electric batteries6991.96%4094Wheels3771.06%1636
Vehicle-to-grid6481.81%3175Stochastic systems3751.05%1710
Electric vehicle charging6301.76%2779Dc-dc converters3681.03%1406
Energy efficiency6241.75%2875Electric power distribution3681.03%1726
Battery electric vehicles6181.73%2695Plug in hybrid electric vehicles3681.03%2059
Controllers6091.70%2592Automotive batteries3581.00%1367
Plug-in electric vehicles5991.68%2322Vehicle transmissions3530.99%1413
Plug-in hybrid vehicles5901.65%3052Genetic algorithms3460.97%1614
Fuel economy5811.63%2609Smart grid3450.97%1622
Energy management strategies3380.95%1857Greenhouse gases3390.95%1454
Disclaimer/Publisher’s Note: The statements, opinions and data contained in all publications are solely those of the individual author(s) and contributor(s) and not of MDPI and/or the editor(s). MDPI and/or the editor(s) disclaim responsibility for any injury to people or property resulting from any ideas, methods, instructions or products referred to in the content.

