Article

Slow Pyrolysis of Specialty Coffee Residues towards the Circular Economy in Rural Areas

by
Josefa Fernández-Ferreras
1,*,
Tamara Llano
1,
María K. Kochaniec
2 and
Alberto Coz
1
1
Department of Chemistry and Process & Resources Engineering, ETSIIT, Universidad de Cantabria, Av. Los Castros, 39005 Santander, Spain
2
Faculty of Chemistry, Warsaw University of Technology, Noakowskiego 3, 00-664 Warsaw, Poland
*
Author to whom correspondence should be addressed.
Energies 2023, 16(5), 2300; https://doi.org/10.3390/en16052300
Submission received: 7 February 2023 / Revised: 17 February 2023 / Accepted: 23 February 2023 / Published: 27 February 2023
(This article belongs to the Special Issue Advanced Bioenergy and Biorefinery Process)

Abstract

:
Coffee, as one of the most consumed beverages, generates a wide variety of waste materials that can be used as biofuels and bio-products. Conventional pyrolysis can be used in rural areas, improving the circular bioeconomy of these places. In this work, the characterization and slow pyrolysis of specialty coffee residues, coffee silverskin (CSS), and spent coffee (SC) were conducted at temperatures from 300 to 600 °C. Physico-chemical and thermal analysis were carried out. In addition, the quantification of individual compounds as acetic, formic, and levulinic acids, caffeine, and other minor compounds was performed. The results indicate the differences between both waste materials in the obtained pyrolysis fractions. The biochar fraction for SC is lower at all temperatures and the liquid fraction higher, reaching maximum values of 62 wt.% in the liquid at 600 °C compared to 47% in CSS. The higher yield in the liquid fraction of SC corresponds to the higher contents of hemicellulose and extractives and the lower ash content. The calculated calorific value for the pyrolysis solid fractions reaches 21.93 MJ/kg in CSS and 26.45 MJ/kg in SC. Finally, biorefinery options of major components of the liquid fraction were also presented.

1. Introduction

Coffee is the second-largest commodity after crude oil and one of the most consumed beverages worldwide, especially in European countries [1,2], and its production is continuously increasing. The largest coffee importers are, in descending order, Europe and the United States, which represent more than 85% of global imports [1]. Regarding producers in 2018, there was the production of over 9.5 million tons. The largest producers were Brazil, Vietnam, and Colombia.
Coffee production generates a wide variety of by-products, which have potential uses in the food sector (i.e., leaves, stems, twigs, and wood) [3]. The coffee industry can process the cherry into green beans through two different pathways, the so-called dry and wet processes. In the dry method, the cherries are mechanically de-husked and the cascara is removed from the beans. The cascara, which is also known as coffee husks, comprises nearly 45% of the coffee cherry [3,4] and contains the skin, pulp, mucilage, parchment, and a part of silverskin. In the wet processing, the skin and pulp covering the beans are removed by the de-pulping process. Then, the mucilage is removed by fermentation (22% of the coffee cherry) and, finally, the fermented coffee beans are washed, dried, and dehulled giving coffee parchment as the last by-product (39% of the coffee cherry). The coffee-consuming countries import and store green beans for roasting. Consequently, the aforementioned by-products are only generated in coffee-producing countries. Coffee silverskin (CSS) is the only by-product of the coffee roasting industry. Apart from CSS, the only coffee residues formed in coffee-consuming countries are the spent coffee grounds (SC) produced when the roasted beans are grounded and the coffee beverage is prepared. SC is a solid residue of fine particles with a dark-brownish color and high moisture content [5,6]. Among all the coffee by-products described previously, this research focuses on the two (CSS and SC) generated in coffee-consuming countries.
Coffee wastes contain phytotoxic and/or antinutrient compounds such as caffeine, tannins, and polyphenols. These components constitute a source of contamination that can limit their direct use in soil or feed applications [7,8].
The circular economy package includes the EU Directive 2018/851, which contains some amendments to the Waste Directive 2008/98 and introduces changes in waste management, collection, and valorization. Concerning organic wastes, the new Directive promotes the “cascade pyramidal biorefinery hierarchy”, where the recovery of valuable biomolecules for pharmaceutical, chemical, cosmetic, and agronomic applications, and the production of value-added compounds are prioritized [9].
To date, CSS has mainly been used as direct fuel, for composting and soil fertilization [7], whereas SC has been the most frequently studied for biofuel production mainly in the form of bioethanol [10]. Nevertheless, by using a thermal treatment such as pyrolysis, not only can the solid fraction be used as a fuel or as adsorbent for wastewater treatment, but the components of the liquid fraction (carboxylic acids and caffeine) can also have very promising applications. SC can also be used for pellet production due to its high calorific value (around 20 MJ/kg) [11]. The chemical composition of CSS and SC is based on cellulose, hemicelluloses, proteins, fat, polyphenols, minerals, and different products formed by the Maillard reaction during the roasting process such as melanoidin [11]. The change in paradigm suggested in the new circular economy package has motivated several innovative approaches essentially based on its richness in antioxidant bioactive compounds such as chlorogenic acid, caffeine, dietary fiber, phenolic compounds, and melanoidins with putative health benefits [7,12,13].
Among the processing of these waste materials, conventional pyrolysis of biomass can be a good alternative in a wide range of application areas for decreasing or ceasing the use of fossil fuels, which is crucial considering the energy crisis caused after one year of the Ukrainian war. Pyrolysis of such residues for energy production can be important in remote rural areas where the access to other energy sources is not possible [14]. In addition, pyrolysis products can be gasified and the products can be used for alternative fuel production [15]. In previous works, authors have studied conventional pyrolysis of sewage sludge [16] and sawdust [17,18], and there has been a preliminary study of the slow pyrolysis of CSS and SC grounds [19]. CSS and SC have shown high energy content in combination with low ash and low sulfur content, and therefore, they are both challenging alternatives for energy production, biofuels, and bio-products [20]. The aim of this research is to comprehensively study the two coffee residues, CSS and SC, proposing an integral valorization of the solid and liquid fractions. There are few studies of such coffee residues and none of them have quantified the composition of the liquid fraction of pyrolysis. Conventional pyrolysis experiments are performed in a semi-continuous lab scale plant at different temperatures (300, 400, 500, and 600 °C) and at two particle sizes: 0.5 mm in the case of CSS, and its original size in the CSS and SC, seeking to determine the influence of temperature and particle size on the distribution of solid, liquid, and gaseous fractions and its relationship with the chemical characterization of the raw material. The characterization of the solid and liquid fractions make it possible to compare the potential of CSS and SC and to compare them with another biomass waste. In addition, the integral recovery of such waste from a circular economy perspective is also carried out.

2. Materials and Methods

2.1. Materials

SC and CSS were provided by “Cafetería Primos de Origen”, a coffee shop in Santander (Spain) that imports specialty green beans from El Salvador, Ethiopia, Rwanda, Brazil, and Indonesia. Specialty coffee is a culture, a coffee philosophy in which many producers, harvesters, roasters, baristas, educators, and organizations, among other actors, are involved, with the common goal of honoring the coffee plant and guaranteeing a product where quality is far more important than quantity. At a technical level, specialty coffee itself has a score based on aspects such as flavor, aroma, and the level of absence of defects in the grain because of the picking method in the harvesting, giving more importance to the social issues in rural areas. In addition, specialty coffee is highly related to a fair trade coffee, increasing the social issues within a more sustainable point of view.
CSS was ground in a cutting mill, using a fraction smaller than 0.5 mm, in addition to the original fraction. SC was used as a powder in the original size received but dried at room temperature on filter paper, turning it over every day for a week until a dry appearance was observed.

2.2. Pyrolysis Methodology

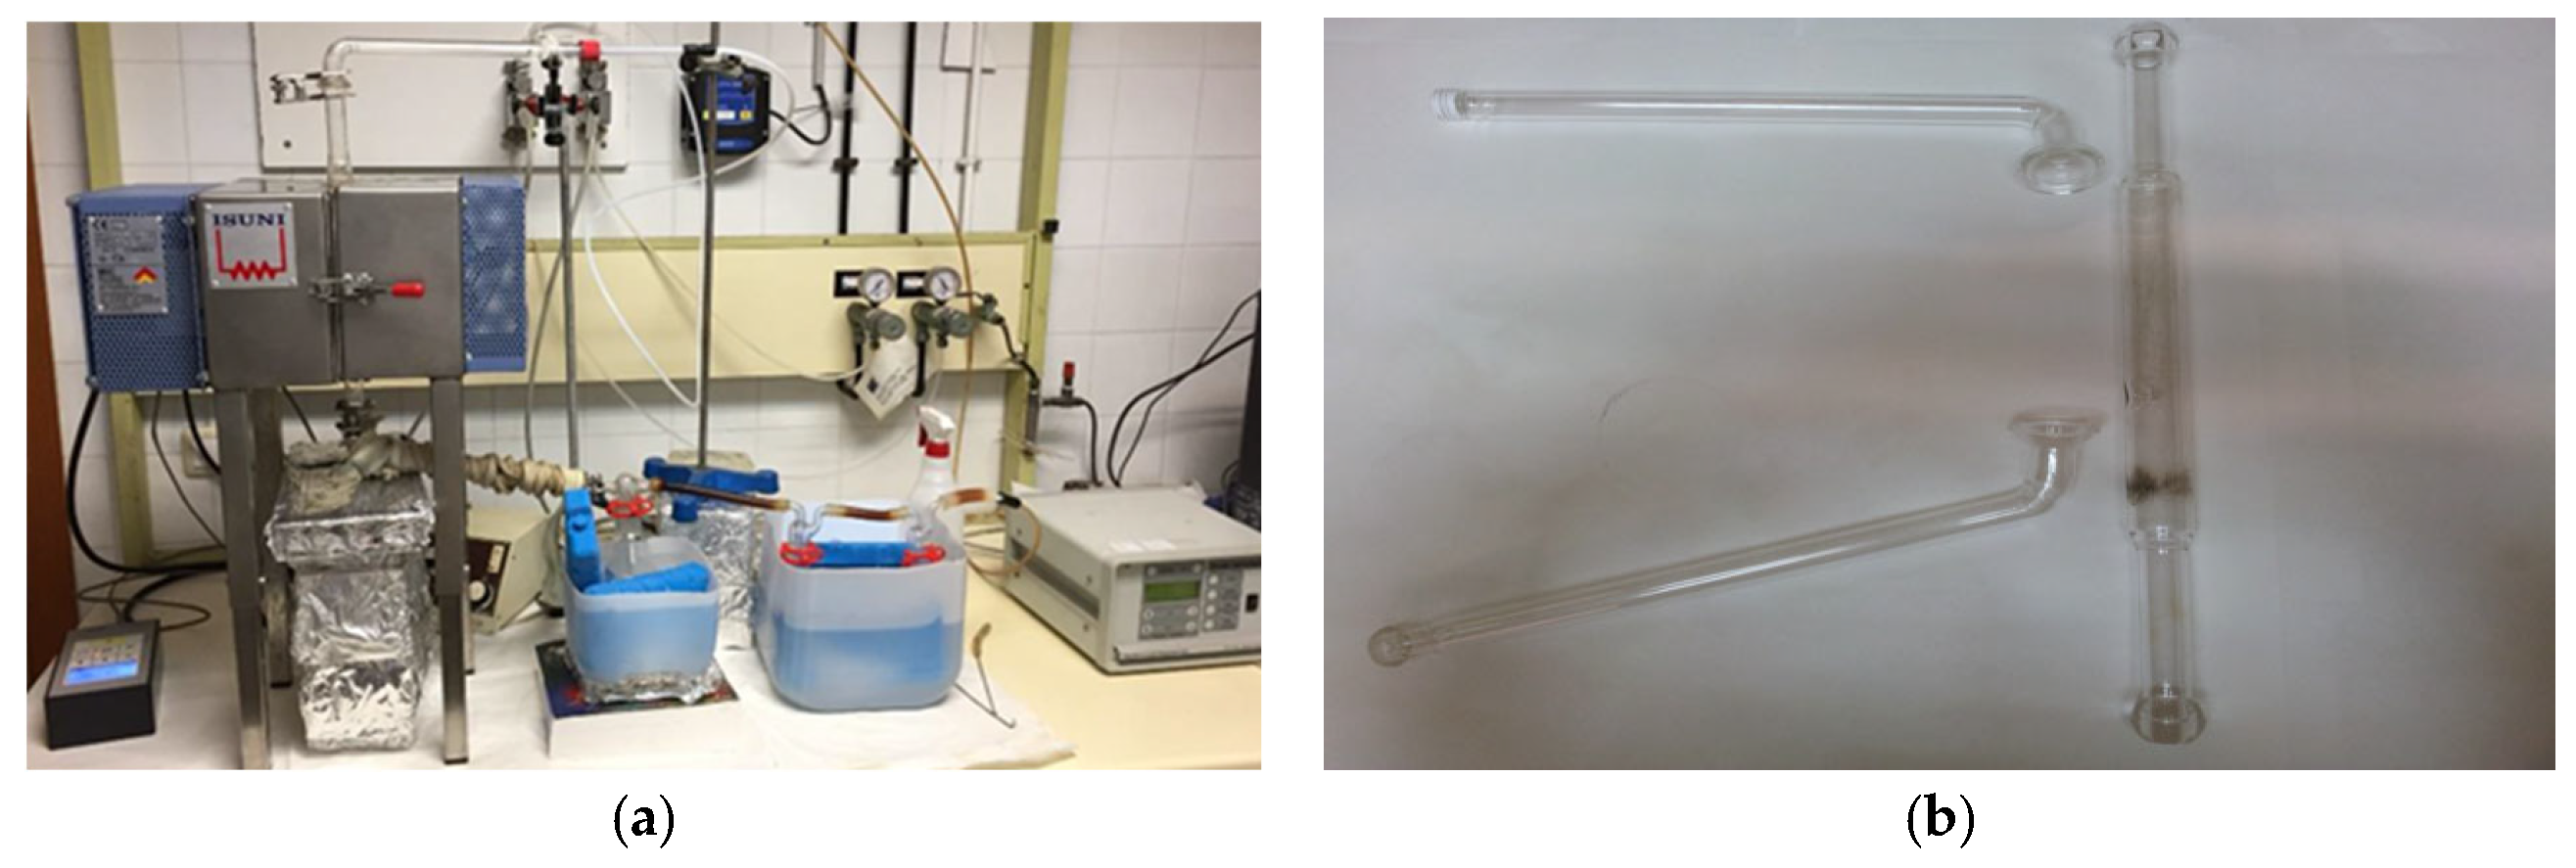
Conventional pyrolysis was performed in a semi-continuous lab scale plant (Figure 1a). The plant consists of an “ISUNI” electric oven that can reach temperatures of up to 1000 °C, with a PID controller. Inside, a quartz reactor is inserted vertically (Figure 1b). Special glass wool is placed for high temperatures acting as a support, and the sample is deposited. The upper and lower parts of the reactor are connected by spherical ground joints (Figure 1b), which are lubricated with high vacuum silicone grease (Grease Dow Corning R). A heating mantle covers the lower elbow to maintain the temperature. The recuperation system consists of three flasks in series for the condensation of volatile liquids, connected using silicone tubes and submerged in cooling baths.
Experiments at a heating rate of 15 °C/min were carried out in triplicate to 3 g of original CSS (the maximum content that could be introduced in the reactor because of its low density) and 6 g CSS less than 0.5 mm and SC in the vertical fixed-bed quartz reactor in nitrogen flow (300 cm3/min), heated at 300, 400, 500, and 600 °C during one hour. The solid and liquid fractions were obtained by weighing and the gaseous fraction by difference.
Figure 1. The experimental installation used (a) and detail of the quartz reactor and joints (b).
Energies 16 02300 g001

2.3. Characterization of CSS, SC, and Pyrolysis Fractions

2.3.1. Particle Size Distribution

Particle size distribution of raw materials was carried out with a CISA brand sieve and eight sieves with different mesh sizes (3500 µm, 630 µm, 400 µm, 300 µm, 150 µm, 112 µm, 63 µm, and the tray).

2.3.2. pH and Density of the Pyrolysis Liquid Fractions

The pH of the pyrolysis liquid fractions at all the temperatures, measured without dilution, was determined by using a CRISON (Barcelona, Spain) pH meter and calibrated solutions of pH 4 and 7, and density was also determined by using 5 cm3 volumetric flasks.

2.3.3. Chemical Characterization

The content of cellulose, hemicellulose, and lignin in CSS and SC was assessed through the Van Soest approach [21] applied to agricultural biomass samples [22]. The method consists of successive extractions to determine the composition of a vegetable sample. The raw materials were crushed and sieved through a 1 mm mesh. Before starting with the Van Soest methodology, extractives were removed using acetone in a Soxhlet apparatus [23]. Then 1 g of free extractives coffee residue went in contact with 100 mL of Neutral Detergent Fiber (NDF) at 100 °C for 1 h. The remaining fraction was merged with Acid Detergent Fiber (ADF) solution at 100 °C for 1 h, to remove hemicellulose. The third extraction was realized with Acid Detergent Lignin (ADL) solution with 72% sulfuric acid at 20 °C for 4 h. The acid solubilizes the cellulose leaving only lignin and minerals. After each extraction, porous bags were rinsed in water and then in acetone and then dried overnight at 105 °C. Then, the calcination of samples at 550 °C for 3 h was performed to determine the ash content [21,22].
CSS and SC pyrolysis liquids were chemically characterized by liquid chromatography. The HPLC system used was a Shimadzu Prominence (Izasa Scientific, Madrid, Spain) low-pressure gradient system equipped with a CMB-20A control system, a DGU-20-A5 inline degasser channel, an LC20AD isocratic pump, an SIL-20AHT autosampler with thermostatic cooling (samples held at 4 °C), and a CTO-20ASVP column oven. Caffeine, levulinic acid, acetic acid, formic acid, furfural, and 5-hydroxymethyl furfural were quantified by a high-performance liquid chromatography system equipped with SPD-M20A photodiode array detector and RID-10A refractive index detector, both coupled in series (HPLC-DAD/RID).
Following some published recommendations for caffeine in different matrices [23,24,25], the authors developed a new method for caffeine quantification in CSS and SC pyrolysis liquids. The analysis of caffeine was carried out by the HPLC-DAD described previously, using the Shimadzu (Izasa Scientific, Madrid, Spain) Shim-pack XR-ODS column (4.6 mm i.d. × 100 mm) at 30 °C. The flow rate was 0.8 mL/min giving a pressure of 3450 psi, and the injection volume was set at 20 µL. The mobile phase consisted of 60% v/v ultrapure water and 40% v/v methanol. Wavelengths were scanned from 190 up to 320 nm. Five caffeine standards, ranging from 0.15 g/L up to 10 g/L, and samples of pyrolysis liquids were quantified at 310 nm. The analysis of acetic acid, levulinic acid, formic acid, furfural, and 5-hydroxymethyl furfural (HMF) was conducted following a previously published methodology [26]. The analysis was carried out by HPLC-RID using the Shodex (Waters, Barcelona, Spain) SH 1011 column (8 mm i.d. × 300 mm) at 60 °C using 5 mM of H2SO4 as mobile phase, operating at 0.5 mL/min of mobile phase flow reaching pressures of 233 psi. The sample injection volume was set to 20 µL. Samples in all cases were ten times diluted and two replicates were analyzed.

2.3.4. Proximate Analysis and Evolved Gas Analysis (EGA)

Thermograms (TG) were obtained on a SETARAM thermal analyser, model SETSYS-1700. The samples of approximately 10 mg were heated in platinum crucibles under a nitrogen or air atmosphere, at a total flow rate of 50 mL·min−1, with a heating rate of 10 °C min−1 and a final temperature of 900 °C. All the TG measurements were blank curve corrected. Each experiment was repeated twice to check for consistency. According to the bibliography [27], for the proximate analysis, moisture and ash content were considered as the loss of mass observed between 25 and 110 °C and the residual mass at 900 °C, respectively, in the TG curves obtained under air atmosphere. Volatile material (VM) was considered the mass between 110 °C and 900 °C in the TG curve in the nitrogen atmosphere. Fixed carbon (FC) was determined as the percentage difference between volatile material in air and nitrogen, respectively. Ash, volatile material, and fixed carbon contents were indicated on a dry basis.
Simultaneous TG-MS curves were retrieved for evolved gas analysis (EGA). The TG instrument was coupled to a Balzers Thermostar/OmniStar mass spectrometer (Pfizer vacuum, Madrid, Spain). Quadrupole mass spectrometer model was QMS 200. The m/z signals are selected within the interval of 1–100. TG-MS analysis provides only qualitative information about the measured samples.

2.3.5. FTIR Spectra

FTIR spectra of CSS, SC, solid, and liquid pyrolysis fractions obtained at 300, 400, 500, and 600 °C were recorded on a Jasco 4200LE spectrometer using KBr pressed disk technique in the wavenumber range of 400 cm−1 to 4500 cm−1, at room temperature, with a resolution of 4 cm−1 and using 264 scans.

2.3.6. Ultimate Analysis and Calorific Value

Ultimate analysis was carried out on a Thermo Flash Smart CHNSO, analyser (Thermo Fisher Scientic, La Coruña, Spain). The technique for CHNS determination is based on the oxidation of the sample by combustion in a pure oxygen environment, at an approximate temperature of 1000 °C. Combustion products (CO2, H2O, NOx, etc.) were transported through a reduction tube (N2) and then separated into columns to be thermally desorbed and measured with a thermal conductivity detector (TCD). In the determination of O2, the sample was weighed into silver capsules and pyrolyzed. The gases generated passed to a chromatographic column where they were separated and measured by TCD.
Ultimate analysis was carried out on both original CSS and SC, and on the pyrolyzed solids of the two raw materials at all the temperatures tested (300, 400, 500, and 600 °C).
High Heating Value (HHV) and Low Heating Value (LHV) were calculated in kcal/kg from the results of the ultimate analysis according to the modified Dulong formula [28], entering the results as per one and transforming results from kcal/kg to MJ/kg as follows in Equations (1) and (2):
HHV = 1 1000 · 0.24 · 8140 · C + 34 , 400 · H O 8 + 2220 · S
LHV = 1 1000 · 0.24 · 8140 · C + 29 , 000 · H O 8 + 2220 · S
where C, H, O, and S correspond to the elemental content of carbon, hydrogen, oxygen, and sulfur, respectively.

3. Results

3.1. Characterization of Raw Materials

3.1.1. Particle Size Distribution

Particle size is a very important parameter that controls the rate of drying and the primary pyrolysis processes, as well as the overlap of these processes during decomposition. Therefore, it has a great influence on the heating rate of the pyrolyzed material [29].
CSS was ground to improve its handling, seeking to study if the smaller particle size improved its behavior in pyrolysis.
Figure 2 shows the sieves’ cumulative distribution of the raw materials used in pyrolysis. The particle size distribution in ground CSS and SC is relatively similar, with 88% less than 500 µm in ground CSS and 86% in SC, whereas 96% of the unground CSS is greater than 500 µm.
In the case of SC, the equipment used for grinding can modify the size distribution obtained, but Atabani et al. [5] measured the average particle size of SC finding values of 291.1 and 314.2 μm. Go et al. [29] tested two samples of SC finding values of 430.5 ± 32.3 and 374.7 ± 8.3 μm, and according to Kang [30], 68.2% of dried SC particles have a size between 500 and 250 μm and 28% have a size between 250 and 100 μm. These sizes are approximately the same magnitude as the particle size used in this work.
CSS reported in other pyrolysis experiments had a particle size of 1 mm after crushing and sieving from briquette format [31] or 5 mm after crushing with a hammer crusher [32]. In other works, for chemical characterization, the particle size was less than 210 μm after milling and sieving through a 70 mesh sieve [2].
Results in the SC show that there is 5% of matter that does not pass through the 3500 µm sieve due to the presence of some coffee seeds, which were eliminated for the pyrolysis experiments. Despite the large differences in particle size in unground and ground CSS, the texture of unground CSS is fluffier and less dense. Considering this aspect, 3 g of CSS was used in the pyrolysis experiments that occupied the entire reactor in the case of the unground CSS, while in the ground CSS and SC, 6 g of initial solid was used.
Figure 2. Sieves’ cumulative particle size distribution for raw CSS, ground CSS, and SC.
Energies 16 02300 g002

3.1.2. Chemical Composition

CSS and SC chemical composition is shown in Table 1. In CSS the percentage of cellulose is double that in SC, and the ashes are also much higher. Furthermore, in SC, hemicelluloses predominate, with higher content of extractives and similar lignin content. These results agree with those found by other authors working with CSS who reported ash content of 8.34 and 7.52% depending on the method used [32], or working with SC grounds, where reports of cellulose content were about 10% and of hemicelluloses in the range of 30–40% by weight [33]. The results obtained in the literature for cellulose content are in the range of 17.8–23.8% for CSS and 8.6–12.4% for SC; hemicellulose is between 13.1 and 16.7% for CSS, and 36.7 and 39.1% for SC; and lignin is around 28.6% in CSS and around 23.9% in SC [34,35]. In this case, the cellulose and hemicellulose contents for CSS are out of the range that appeared in the literature, probably because of the complexity of these kinds of specialty coffee beans. Nevertheless, the higher cellulose content with respect to the hemicellulose in the CSS, which is also observed in the literature, is shown in the experimental results of Table 1. The behavior in the SC is the opposite to that stated in the literature; in this case, hemicellulose content is higher than the cellulose content.
Extractives in lignocellulosic material are substances easily separable through a solvent and come from the biological fluids of plants, such as sap. They include low molecular weight carbohydrates, aliphatic and aromatic acids, alcohols, waxes, alkaloids, etc. Among them is, therefore, caffeine, which is an alkaloid. Hemicelluloses are also more easily degradable in a thermal process than the crystalline structure of cellulose.
Table 1. Lignocellulosic components and extractive fractions, ash, and moisture in CSS and SC.
wt.%, Dry BasisCSSSC
Cellulose33.714.9
Hemicellulose4.741.1
Lignin33.133.3
Extractives15.822.8
Ash6.32.2
Moisture9.410.5
Caffeine is the only thermostable compound present in the composition of coffee, and therefore it is not altered by excessive roasting. The rest (fats, sugars, proteins), as the temperature increases, may be destroyed and transformed into reactive products [35]. This stability can be the reason for finding caffeine after pyrolysis in the liquid fraction.

3.1.3. Proximate Analysis and Evolved Gas Analysis (EGA)
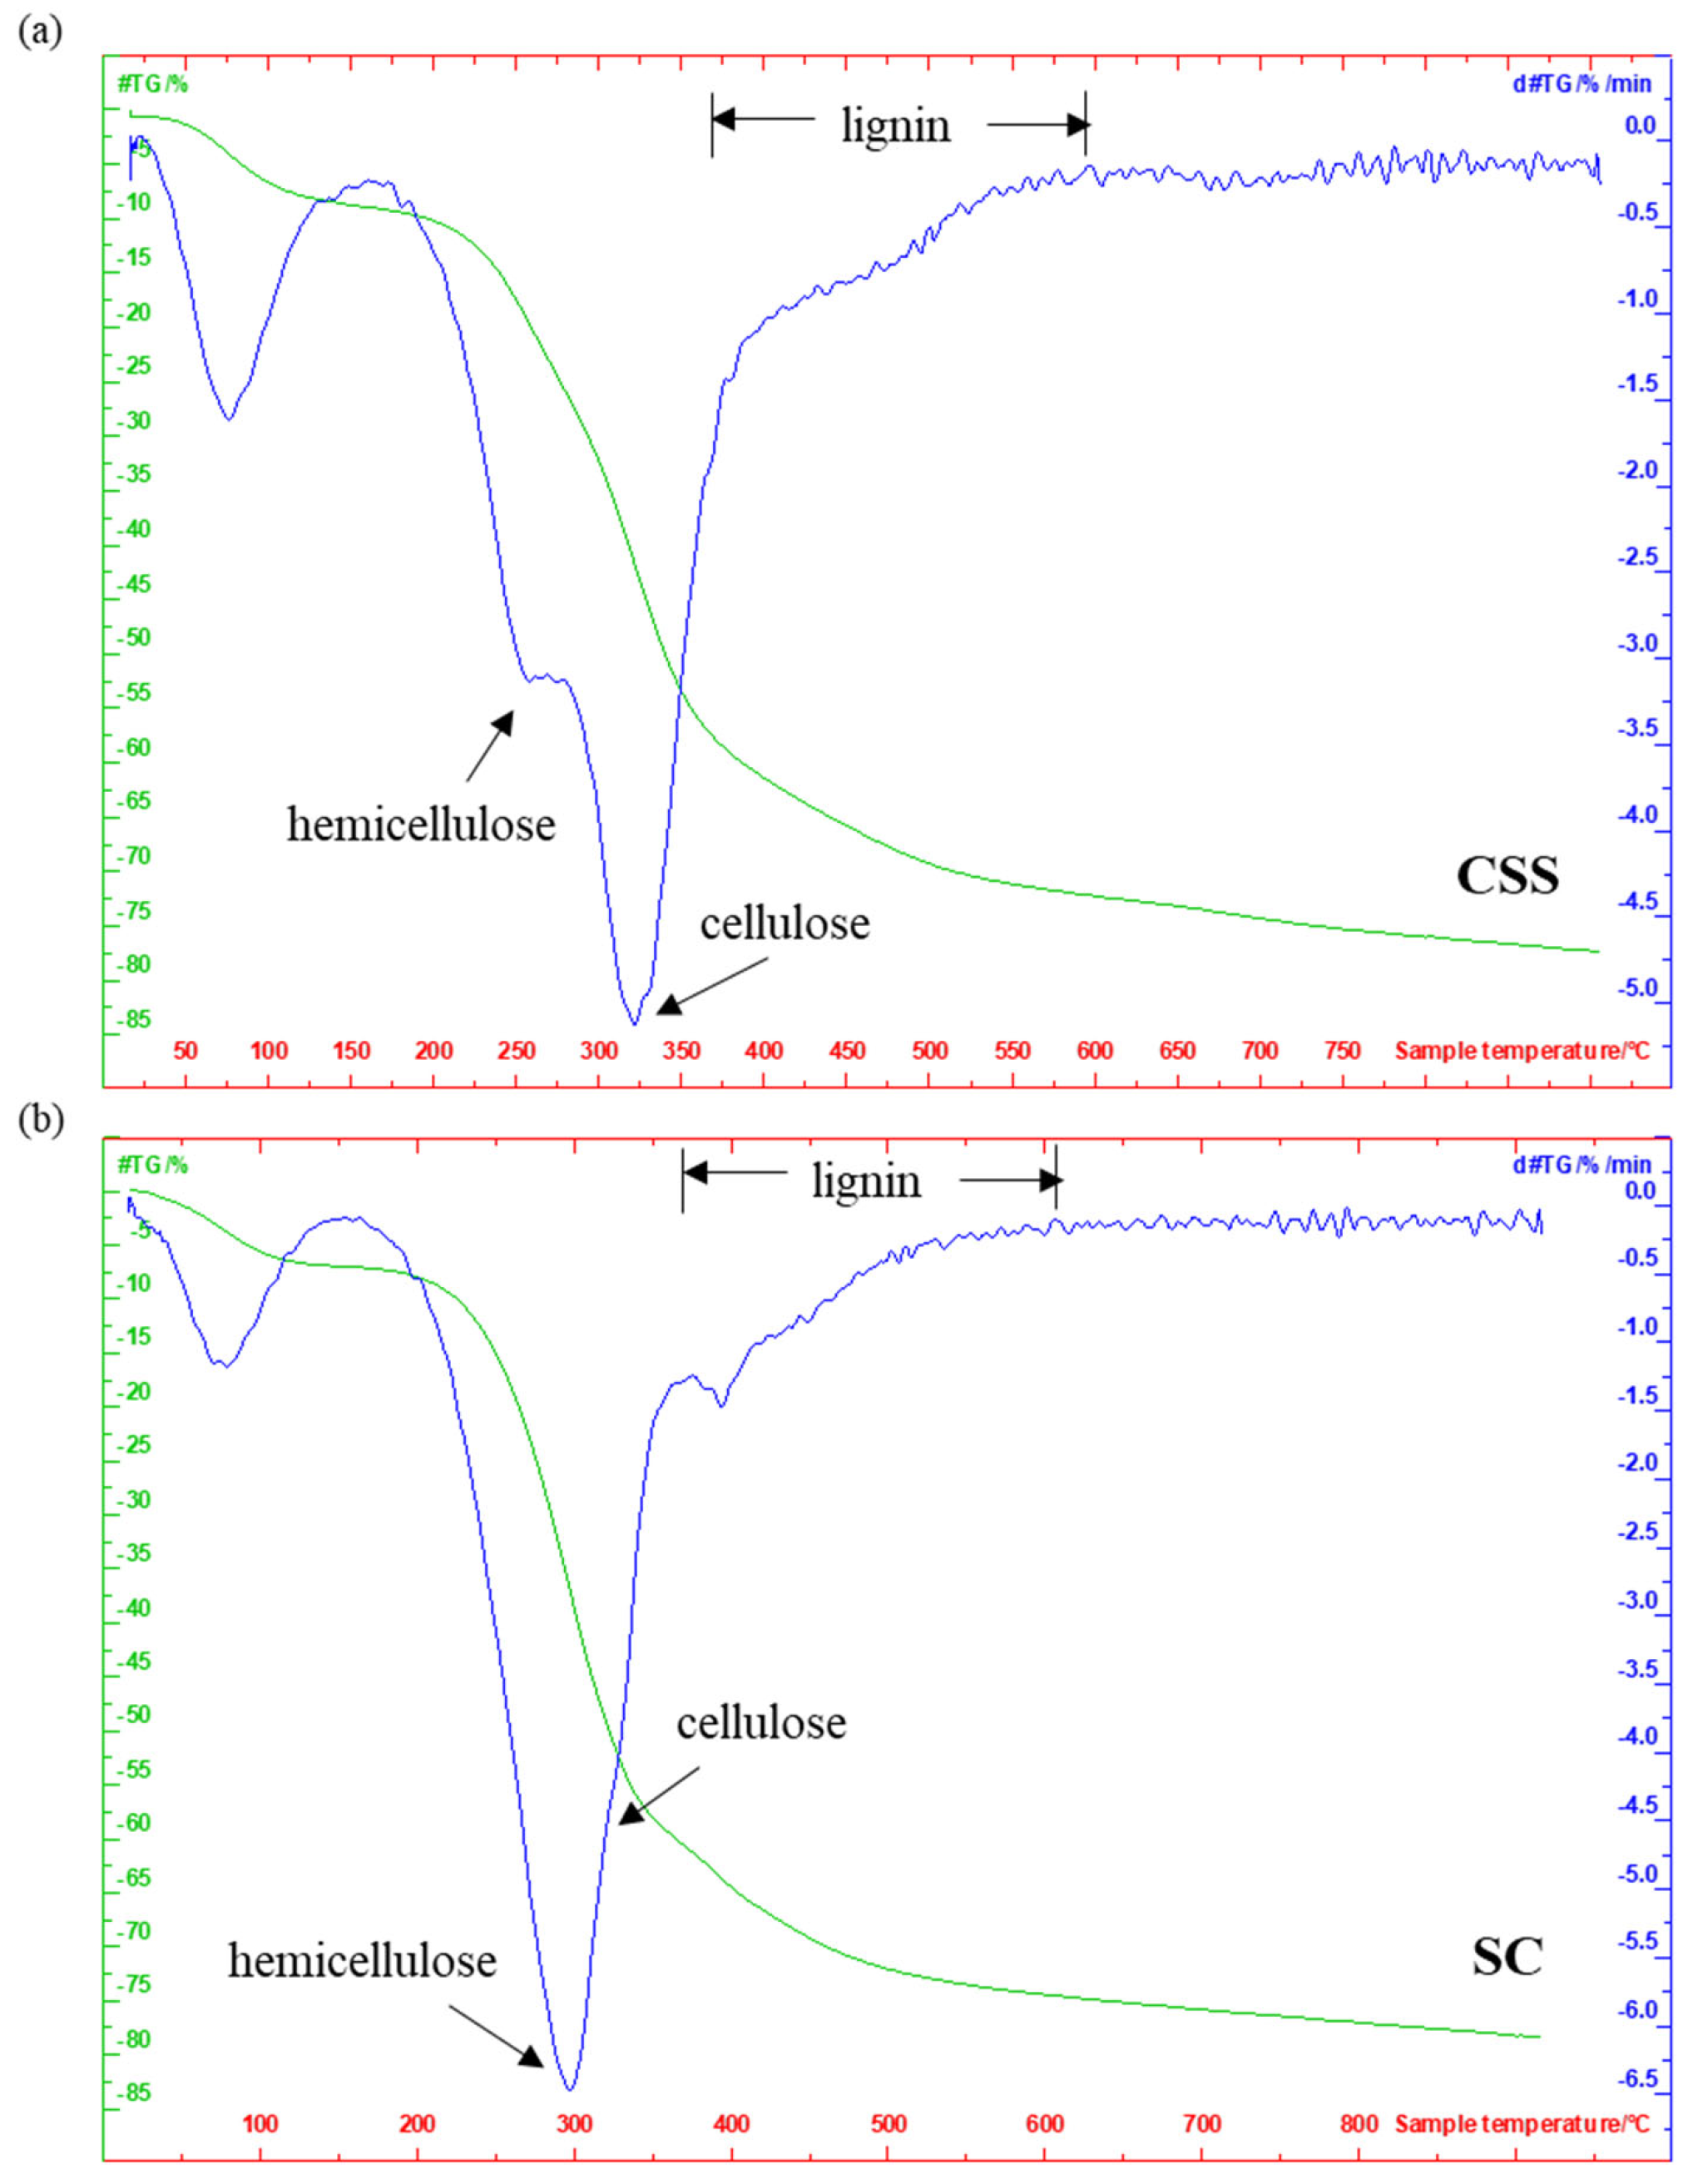
Thermogravimetric analysis (TGA) is a widely used technique to analyze the pyrolysis behavior of biomass [36,37]. TGA and DTG (differential thermogravimetry) results of the CSS and SC samples in nitrogen atmosphere are shown in Figure 3. Four relevant mass losses are observed, as other authors indicate for CSS [8,32] and wood/biomass samples [37]. Until approximately 150 °C, the mass loss can be assigned to water and extractives’ evaporation. The next is attributed to the degradation of hemicellulose, an amorphous polymer that can decompose at lower temperatures. According to Table 1, this content is much lower in CSS than in SC, which can be seen in the DTG band, which is lower in CSS (maximum rate of loss weight around 250 °C) and higher in SC (maximum rate of loss weight around 300 °C). The third loss is attributed to the degradation of cellulose, a crystalline homopolymer that requires a higher temperature (maximum loss weight rate around 325 °C in CSS and a shoulder can be observed around this temperature in SC, according to its low content). Due to the complex structure of the lignin, its degradation usually requires a wide temperature range, up to 550 °C. Polidoro et al. [8] also attributes the low thermal decomposition from 550 to 900 °C to the release of small volatiles from the charred material, representing the material remains at 900 °C of mainly ash and fixed carbon. According to the similar lignin content and higher ash in CSS versus SC, the mass loss obtained at 500 and 900 °C is slightly lower for CSS (Figure 3).
From the TG mass losses in N2 and air, and following the procedure indicated in Section 2, the obtained results (wt.%, on a dry basis) for the proximate analysis are indicated in Table 2.
Ash content is similar to that obtained in this work by wet chemical methods, with a higher percentage in CCS than in SC, being slightly higher in the volatile material (VM) and the fixed carbon (FC) in SC. Similar values were reported by del Pozo et al. [31] for CSS, with 7.52% ash, 76.4% VM, and 16.1% FC.
For coffee grounds (not SC), Choi et al. [38] reported values of 3.4% ash, 78.7% VM, and 16.9% FC, similar to the values found in this work despite differences that also depend on the variety of coffee, origin, etc. Ballesteros et al. [34] characterized both residues indicating ash values for CSS (5.36%) and SC (1.30%) as slightly lower but with the same trends as in the present work.
Figure 3. TG and DTG results of coffee residues: (a) CSS; (b) SC.
Energies 16 02300 g003
Table 3 shows the main m/z signals obtained by TG-MS using evolved gas analysis (EGA), their possible assignment, and the temperature at which maximum is found in the graphs, for CSS and SC.
Figure 4 details some of the graphs that compare the volatile compounds with molecular weight less than 100 amu, released during the pyrolysis of CSS and SC in TG-MS experiments. It can be observed that the same compounds are found in both residues, but the temperatures at which maximum emissions take place are generally lower for SC, with greater intensity in almost all the masses analyzed, qualitatively indicating a higher content of all the compounds released in SC.
It is worth mentioning the release of hydrogen, acetylene, formaldehyde, CO2, formic acid, ethanol, acetone, acetic acid, furan, benzene, phenol, furfural, toluene, and cyclopentanone, all of them at temperatures between 250 and 600 °C, and most of them with maximum release in the range of 300–400 °C, demonstrating that the selected range of temperature for pyrolysis in this work is suitable for obtaining them.
Table 3. TG-MS with an indication of m/z signals, possible assignment, and temperatures.
m/zAssignmentCSS (°C)SC (°C)
1H390350
2H2366314 and 418
12C336 and 480322 and 470
15CH3357 and 540331 and 531
16O366331
18H2O122 and 349131 and 322
26Acetylene, C2H2288, 375, and 505331, 418, and 488
28Ethylene C2H4400366
30Formaldehyde CH2O270 and 462322, 400, 436 and 497
42Propylene C3H6357 and 489322 and 418
44CO2288, 350, 453, and 723323 and 453
45-COOH340 and 480322 and 453
46Formic acid, ethanol350 and 470322 and 462
58Acetone357314 and 400
60Acetic acid, propanol350322
68Furan383340
78Benzene410418
82Pyran366340
84Cyclopentanone366 and 410331 and 418
92Toluene392410
93Aniline392410
94Phenol392357
96Furfural357314
Other authors found some of the gases described in CSS using other techniques, such as GC-MS, including H2, CO2, CH4, C2H4, C2H6, and C3H8 [31]. Research work that shows wood bio-oil’s typical composition described acids such as formic and acetic, and phenol or furfural [39]. In the bio-oil studied by del Pozo et al. [31,32], a semi-quantitative distribution of organic fraction compounds from CSS include phenols, nitrogenated compounds, saturated hydrocarbons, unsaturated and aromatic hydrocarbons, alcohols, ketones, carboxylic acids, esters, and others considered in this work from most to least abundant in terms of volume percentage. Most of them were identified by TG-MS in this work, but only qualitative information provides this technique. On the other hand, the liquids obtained in the pyrolysis process at all the temperatures for both studied residues are a heterogeneous mixture where the aqueous solution is the predominant phase, and according to it, chemical distribution will be different, with an increased abundance of water-soluble compounds.
According to Mohan et al. [37], decomposition of hemicellulose produces more volatiles, fewer tars, and fewer chars than cellulose. Most of the acetic acid liberated in the pyrolysis of wood is caused by the deacetylation of the hemicellulose. Cellulose degradation produces anhydrocellulose and levoglucosan that will probably decompose into other small molecules. Lignin is more difficult to dehydrate than cellulose or hemicelluloses and produces more residual char than does the pyrolysis of cellulose. Lignin pyrolysis produces phenols by cleavage of carbon−carbon and ether and linkages. Its decomposition in wood was reported from 280 °C to 450−500 °C, with a maximum rate in the range of 350−450 °C. Degradation of proteins at around 400 °C produces mainly nitrogenated compounds [32].
Figure 4. Thermograms of some selected released compounds during TGA (arbitrary units vs temperature in °C).
Energies 16 02300 g004

3.2. Results of Pyrolysis Experiments

Figure 5 shows the evolution of the solid fraction of raw CSS, ground CSS, and SC after pyrolysis at different temperatures. Carbonization is observed that increases with the increase in the pyrolysis temperature in all the residues tested.
The liquid fractions obtained at each temperature in the experiments carried out in triplicate are mixed, presenting a brownish color. These fractions appear as a heterogeneous mixture that includes tar and a small organic fraction mixed with water, the major component. The liquid has a very acidic pH as is usual in conventional pyrolysis of other biomass and it is analyzed in this form.
Figure 5. Original CSS (a), ground CSS (b), and SC (c), and the solid fractions obtained by pyrolysis at 300, 400, 500, and 600 °C.
Energies 16 02300 g005

3.2.1. Comparison of Grounded and Ungrounded CSS

Figure 6 shows medium values of the results obtained in triplicate at each temperature comparing unground and ground CSS, with the corresponding calculated standard deviation.
Despite the decrease in the particle size of the ground CSS, the yields of the solid, liquid, and gas pyrolysis fractions are similar to those of the raw CSS. This could be because the raw product is much fluffier with a much lower bulk density, which allows good transport and removal of volatile fractions and heat transfer, as in the case with smaller particle sizes. Thus, the smaller particle size does not appreciably favor obtaining the liquid and gaseous products of pyrolysis, as usual, since the differences were found to fall within the experimental error. Because of that, the averages obtained with all the experiments (ground and unground CSS) at each temperature (and the new standard deviation) were recalculated for comparing the pyrolysis data of SC grounds. On the other hand, the results also indicate that above 400 °C, the liquid fraction is in the majority.

3.2.2. Comparison of CSS and SC

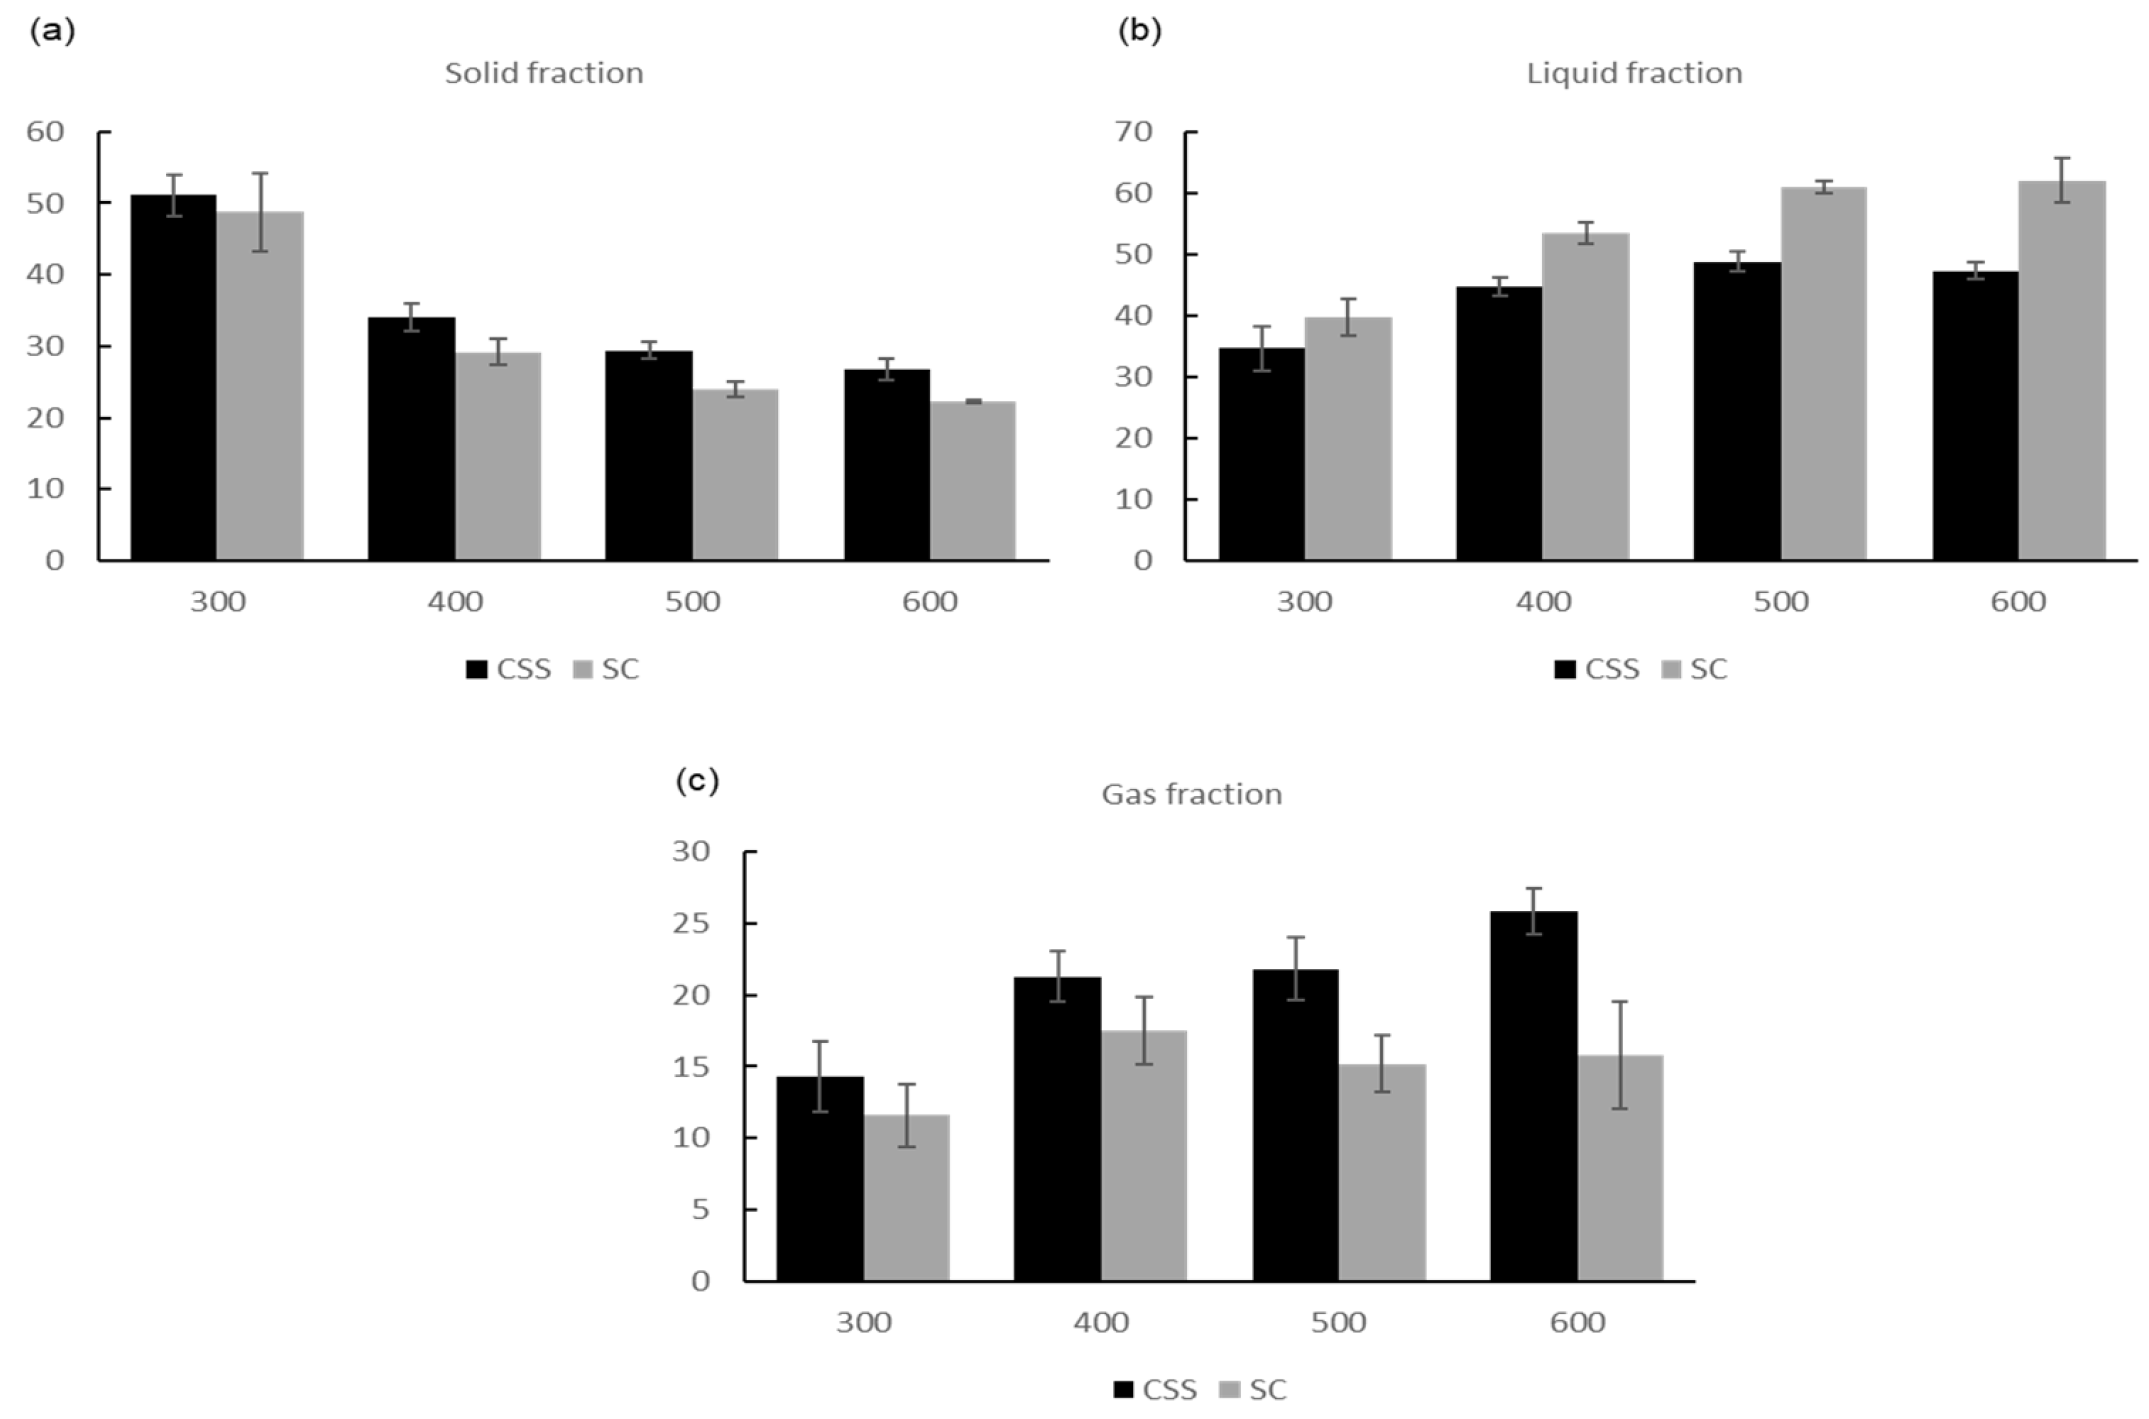
Figure 7 shows the comparison of the mean values and standard deviations of the solid, liquid, and gaseous fractions (weight percentage) obtained after pyrolysis of CSS and SC at different temperatures.
As expected, in all waste as the temperature increases, the percentage of solid obtained after pyrolysis decreases. In the case of the SC, the values found were lower than those found in CSS, which indicates that the coffee residue has more volatile compounds (which are transferred to the liquid and gaseous fractions), as the chemical composition also revealed (extractives’ content of 22.8%, see Table 1).
Figure 7. Comparison of solid, liquid, and gas fractions (wt.%) in the pyrolysis of CSS and SC at different temperatures (°C): (a) solid fraction; (b) liquid fraction; and (c) gas fraction.
Energies 16 02300 g007
Similar results were obtained in the case of the slow pyrolysis of sawdust. The same temperatures were tested (300, 400, 500, and 600 °C) as recommended by other authors [40,41,42]. Solid fraction yields descended from 51.0 to 21.7% as the temperature increased, while liquid and gas fractions increased. Liquid yields were in the range of 38.3 to 57.8%, whereas gas fraction yields varied from 10.7 to 21.8% [17,18]. The yields shown in Figure 7 are in the same order as the slow pyrolysis of sawdust since CSS, SC, and sawdust are all lignocellulosic residues with cellulose, hemicellulose, and lignin contents.
According to the results in Table 1 and Table 2, the higher ash content in CSS could justify the higher content of biochar (solid fraction obtained after pyrolysis) in the CSS compared to the SC.
Del Pozo et al. [31] reported slow pyrolysis yields in biochar for CSS at 280, 400, and 500 °C of 80.5, 40.5, and 31.5 wt.%, respectively, higher than those obtained in this work, but with a similar tendency. Differences that are mainly found in the experimental setup and also in this specific raw material can be the reason.
Ktori et al. [20] carried out fast pyrolysis of SC with a different setup, at a temperature ranging from 400 to 700 °C with a heating rate of 50 °C/s, and found decreasing char yields with pyrolysis temperature, starting from 43 wt.% at 400 °C and reaching the value of 26 wt.% at 600–700 °C pyrolysis temperature, similar to results found in this work for conventional pyrolysis in SC.
In the pyrolysis liquid fraction for both residues, it was observed that up to 500 °C, the percentage in liquid increased, stabilizing its content between 500 and 600 °C, as was also found up to 500 °C for CSS by del Pozo et al. [31] and for SC by Ktori et al. [20], although a maximum yield was found in this case and a different composition is expected in this liquid fraction (bio-oil) because fast pyrolysis achieves higher organic/hydrocarbon content.
The liquid fraction obtained in the pyrolysis of SC is greater than in the CSS. According to the composition data of both residues (Table 1), this result could be justified by the higher hemicellulose content, as well as the higher content of extractives in the SC, where the residual caffeine would be. These compounds as well as their degradation compounds, such as acetic and formic acid, are responsible for the low pH value of the pyrolysis liquid. Hemicellulose, as it is not crystalline and has a lower molecular weight than cellulose, will degrade more easily, and therefore the liquid content will be higher in SC. This difference in the liquid percentage of CSS and SC becomes 15% at 600 °C, achieving values of 62% in SC.
Pereira et al. reported SC yields of bio-oil between 55% and 85%, depending on the reaction conditions and moisture content that matched these results [43].
Finally, it can be seen that the percentage of gas increases as the temperature increases in the case of CSS. This increase is attributed to the fragmentation of the molecules and the reactions of the carbon of the biochar with the gases to decrease the solid and form more gases [31,44].
Pyrolysis of the SC produces lower gases than CSS, reaching a maximum at 400 °C. The decrease in the solid between 500 °C and 600 °C is small. As observed in Figure 7, the increase in the liquid fraction is higher than in the gas fraction. Therefore, it is found that in the case of the pyrolysis of SC, a temperature of 500–600 °C produces the highest amounts of liquid (61–62%) and less of the solid (22–24%) and gas (15%).

3.3. Results of Characterization of Pyrolysis Fractions

The liquid (wood vinegar) and solid fractions (biochar) resulting from the pyrolysis treatment of CSS and SC were studied focusing on their respective uses as chemical (liquid) and energy sources (solid), to achieve their integral valorization.

3.3.1. pH and Density of the Liquid Fraction

Table 4 shows the results obtained in the liquid fractions at the different pyrolysis temperatures, in CSS and SC.
According to Table 4, pH is in the range of 3.9 to 4.3 (for CSS), and 3.5 to 4.0 (for SC). These acid values correspond to the slow pyrolysis liquid fraction called wood vinegar or pyroligneous acid in lignocellulosic materials [45]. It is therefore due to the content of organic acids present in the pyrolysis liquid (such as acetic and formic, identified by TG-MS). As the pyrolysis temperature increases, the pH increases very slightly, which indicates that these acids are released at low pyrolysis temperatures (maximum between 322 and 470 °C according to EGA results in Table 3). Caffeine content that goes to the liquid fraction as part of the extractives can also have an influence on these values [31]. The pH is slightly higher in the pyrolysis liquid of CSS than in SC, which can be related to a higher amount of the alkaloid caffeine and to a lower content of these organic acids in CSS than in SC, as results of TG-MS have pointed out.
As can be seen, the density increases minimally as the temperature increases for both residues, being higher in SC. Densities range from 1.00 to 1.05 g/cm3. These values so close to the density of water indicate that the aqueous phase is the most abundant, with the organic compounds being dissolved in it. The density of acetic acid (1.05 g/cm3), formic acid (1.22 g/cm3), acetone (0.792 g/cm3), methanol (0.792 g/cm3), ethanol (0.789 g/cm3), and propanol (0.803 g/cm3) show that the mixture of these products could have a density close to 1 g/cm3. Increasing density with pyrolysis temperature could indicate a different content of acids or other compounds such as caffeine.
Table 4. Results of pH and density of liquid fractions at different pyrolysis temperatures for CSS and SC.
Temperature (°C)CSSSC
pHDensity (g/cm3)pHDensity (g/cm3)
3003.9 ± 0.11.0015 ± 0.00033.5 ± 0.11.0037 ± 0.0002
4003.9 ± 0.11.0027 ± 0.00013.8 ± 0.11.0118 ± 0.0003
5004.2 ± 0.11.0177 ± 0.00064.0 ± 0.11.0360 ± 0.0009
6004.3 ± 0.11.0185 ± 0.00073.7 ± 0.11.0581 ± 0.0005

3.3.2. FTIR of Liquid and Solid Fractions

FTIR of CSS and SC (provided in the Supplementary Material, Figures S1 and S2) showed bands corresponding mainly to -OH of alcoholic or phenolic groups (a broad peak around 3400 cm−1), C-H from aldehydes or alkanes (peaks around 2850–2900 cm−1), -C=O of carbonyl groups (around 1730 cm−1), C=C of alkene and aromatic groups (around 1650 cm−1), and the characteristic for C-O-C and C-O groups corresponding to ether mainly in cellulose (around 1100 cm−1). Both residues present similar bands, but with a higher intensity at 1100 cm−1 in CSS due to the higher cellulose content, and a higher C-H band in the case of SC according to the higher aliphatic content.
Qualitatively, the evolution of FTIR spectra for solid and liquid fractions (in the Supplementary Material, Figures S3–S18) with the increase in pyrolysis temperature is also similar in both residues. In general, as the pyrolysis temperature increases, the polar functional groups (-OH of alcohols and phenols) as well as the aliphatic C-H bonds and the -C=O and C-O-C bands, are eliminated in the solid, while aromatic structures appear. The polar groups (-OH band) that disappear in the solid go to the liquid fraction. In this liquid fraction, at all temperatures, the OH band is observed, which widens between 2300 and about 3600 cm−1 as the pyrolysis temperature increases, which is attributed to the presence of OH from carboxylic acids and not only from alcohols, phenols, or H2O. Bands corresponding to acid C=O also appear (around 1750 cm−1). Stronger bands at 1350 and 1096 cm−1, of -CH2 and C-O bonds of alcohols or acids, also indicate an increase in aliphatic and acid content [31,33,46,47,48].

3.3.3. Ultimate Analysis and Calorific Value

The results of elemental analysis of the solid fractions obtained at different pyrolysis temperatures compared to raw CSS and SC can be seen in Table 5, also with the results of the calorific values obtained according to the Dulong formula. The sum of the CHSNO values is lower in the case of CSS than in SC according to its highest ash content and decreases in both as the pyrolysis temperature increases according to the expected increase in ash content.
Ktori et al. [20] compiled results of the ultimate analysis in different SC feedstock found in the bibliography. Values varied in the intervals 48.9–57.56% C, 6.95–7.9% H, 1.5–3.51% N, 0–0.1% S, and 32.1–40.1% O. The results reported in this work for SC are in these intervals except for the slightly lower carbon content, but there is no indication in the literature if the results are ash free.
The literature about elemental composition in CSS [32] showed similar results to those obtained in this work, with 42.3% C, 5.69% H, 2.97% N, 0.170% S, and 48.9% O but with higher N and O content, this last result because in the literature, it is estimated by difference and is not measured.
Table 5. Ultimate analysis and calorific values in raw CSS and SC and pyrolysis solid fractions.
% C% H% N% S% OHHV (MJ/kg)LHV (MJ/kg)
Raw CSS44.025.631.910.1536.1516.5416.29
CSS-300 °C56.94.922.790.1222.0622.4121.93
CSS-400 °C57.213.552.530.1219.2721.0520.80
CSS-500 °C60.632.372.310.0416.820.9520.89
CSS-600 °C64.681.632.50.0413.7821.8121.73
Raw SC47.117.051.890.1134.0819.9919.36
SC-300 °C62.635.723.320.0519.6625.9225.18
SC-400 °C69.563.953.370.0313.1626.8926.38
SC-500 °C72.762.73.210.019.8726.7826.45
SC-600 °C74.41.973.320.017.926.6426.42
The results in this work show that in both coffee wastes, the percentage of carbon increases in the biochar as the pyrolysis temperature increases with respect to the raw feedstock, and hydrogen decreases, according to the aromatization of the solid fraction found by FTIR. The percentage of sulfur is small in both cases and also decreases with the increase in temperature, probably going to the gaseous fraction.
As can be observed, for both CSS and SC, the N percentage in the char increases with respect to the feedstock, with slightly higher values in SC biochar. Other authors found a similar tendency in the C, H, and O content for biochar in CSS [32], but the increase in N was only at 280 °C.
Regarding the HHV of the raw materials, Caetano et al. [49] found a similar value, 19.3 MJ/kg for spent coffee, and del Pozo et al. [32] reported a higher value of 19.47 MJ/kg for CSS. Table 5 shows an increase in the HHV and LHV of the char obtained at all temperatures in both CSS and SC, with higher values at any pyrolysis temperature in the char obtained with spent coffee. The literature refers to values for CSS char at 280 °C of 22 MJ/kg similar to those obtained in this work for CSS char at 300 °C (21.9 MJ/kg) [32]. On the other hand, a study including more than 60 different biomass samples reported a minimum and maximum HHV of 15.29 and 26.7 MJ/kg, respectively, with an average of 18.90 MJ/kg [44]. These results highlight the high calorific value of the chars obtained with both residues, but especially those obtained by pyrolysis of SC, with values similar to bituminous coal (14.6–26.7 KJ/kg) [31].

3.3.4. HPLC Results of the Liquid Fraction

The results of CSS and SC pyrolysis liquids (in wt.%) obtained at four pyrolysis temperatures (300 °C, 400 °C, 500 °C, and 600 °C) are shown in Table 6. As can be seen, in all cases, minor compounds are hydroxymethylfurfural (HMF) (0.08–0.14%) and furfural (0.01–0.06%), whereas major compounds found in CSS and SC pyrolysis liquids are, in descending order, caffeine (2.18–4.98%), acetic acid (1.55–4.13%), levulinic acid (1.54–2.57%), and formic acid (0.51–1.62%).
The acid pH character of the pyrolysis liquids is caused due to the presence of low molecular weight carboxylic acids. Semi-quantitative GC-MS analysis of CSS pyrolysis liquids reported the presence of acetic acid [32]. Nevertheless, in this case, not only acetic acid but also formic and levulinic acids were detected and also quantified in CSS and SC pyrolysis liquids. The presence of formic is explained by the degradation that occurs during the hydrolysis of C5 sugars, whereas levulinic acid is a degradation product of C6 sugars [50]. Acetic acid is the one with the highest concentration in the pyrolysis liquid fraction of CSS and the second highest in the case of SC. The presence of acetic acid is explained by the side-reaction of hydrolysis of the acetyl groups in the hemicellulose, as a consequence of deacetylation of acetylated pentosane and also coming from the defragmentation of sugars [51]. Such a reaction occurs in parallel to the hydrolysis reactions of carbohydrates into sugars. Sugar standards of glucose, xylose, galactose, mannose, and arabinose were also prepared but there was no identified sugar content in the pyrolysis liquid because at the temperature of the experiment, sugars were completely degraded.
Additionally noteworthy is the higher caffeine content in the pyrolysis liquid in CSS at all temperatures compared to that found in SC. Its content is very important in this liquid fraction, and it can be considered a source of caffeine after its separation and purification.
Regarding caffeine, the biggest content of caffeine in CSS pyrolysates shown in a recent study was achieved at 400 °C of pyrolysis, reaching values of 2 mg caffeine per gram of CSS [31]. In this study, the highest caffeine content was also obtained at 400 °C giving values of 4.98 g of caffeine in 100 g of pyrolysis liquid.
There are no references for acids’ and furans’ concentrations in pyrolysis liquids of coffee wastes. Only qualitative analysis through GC/MS was found. Nevertheless, in the case of wood pyrolysis, the bio-oils content of acetic acid is in the range of 2.66–10.14% and formic acid between 0.1 and 3.1% [39].
Table 6. HPLC/RID/DAD analyses of the pyrolysis liquids.
SampleCaffeineFormicAceticLevulinicHMFFurfural
CSS T3004.76 ± 0.01%0.51 ± 0.04%4.13 ± 0.04%2.01 ± 0.02%0.10 ± 0.00%0.06 ± 0.00%
CSS T4004.98 ± 0.01%0.70 ± 0.03%3.94 ± 0.03%1.83 ± 0.03%0.12 ± 0.01%0.05 ± 0.00%
CSS T5004.25 ± 0.01%0.58 ± 0.04%3.54 ± 0.00%1.62 ± 0.00%0.11 ± 0.03%0.04 ± 0.00%
CSS T6004.01 ± 0.02%0.58 ± 0.04%3.32 ± 0.01%1.54 ± 0.01%0.09 ± 0.00%0.03 ± 0.01%
SC T3002.18 ± 012%1.04 ± 0.03%1.55 ± 0.04%1.99 ± 0.03%0.08 ± 0.00%0.02 ± 0.00%
SC T4002.47 ± 0.03%1.53 ± 0.08%1.96 ± 0.04%2.57 ± 0.00%0.14 ± 0.00%0.02 ± 0.00%
SC T5002.32 ± 0.09%1.62 ± 0.25%1.94 ± 0.18%2.52 ± 0.01%0.14 ± 0.00%0.02 ± 0.00%
SC T6002.23 ± 0.01%1.45 ± 0.04%1.69 ± 0.12%2.21 ± 0.04%0.12 ± 0.00%0.01 ± 0.00%
In Figure 8, the evolution of major and minor compounds with the temperature is shown, expressed in grams of compounds per liter of pyrolysis liquid. Looking at Figure 8a,b, in all cases, the concentration decreases as the pyrolysis temperature increases. The only exceptions were caffeine, formic acid, and HMF, which reached a maximum concentration at a pyrolysis temperature of 400 °C instead of 300 °C. In the case of SC, it can be observed in Figure 8c,d that the best two pyrolysis temperatures, in terms of acids and caffeine concentrations, were 400 and 500 °C.

3.3.5. Biorefinery Options of the Liquid Fractions
The emerging potential of coffee waste valorization in a biorefinery enables further selections for liquid and solid residue. Valorization of CSS, as well as SC, offers a platform to improve the waste management for a coffee-waste-based biorefinery leading to a circular economy with integrated waste for clean energy resources [52]. Comprehensive knowledge of the composition of CSS or/and SC is vital for their full utilization [53]. The recovery of fungicidal complexes for coffee business side-streams advocate prospective bio-derived stabilizers against wood-decaying fungus [54]. Here, as an example, the bio-bean company is a key supplier for valorizing the coffee waste into various biofuels and value-added products for practical needs. Another example is Ecobean, which is a technology company with a mission to help reduce coffee waste at the scale of business. Recently, a biorefinery approach was reported in line with the production of antioxidants from bio-oil and other compounds from CSS via pyrolysis. For the first time, the integrated valorization of CSS by intermediate pyrolysis coupled with a set of characterizations revealed CSS-derived biochar as a versatile energy source [32].
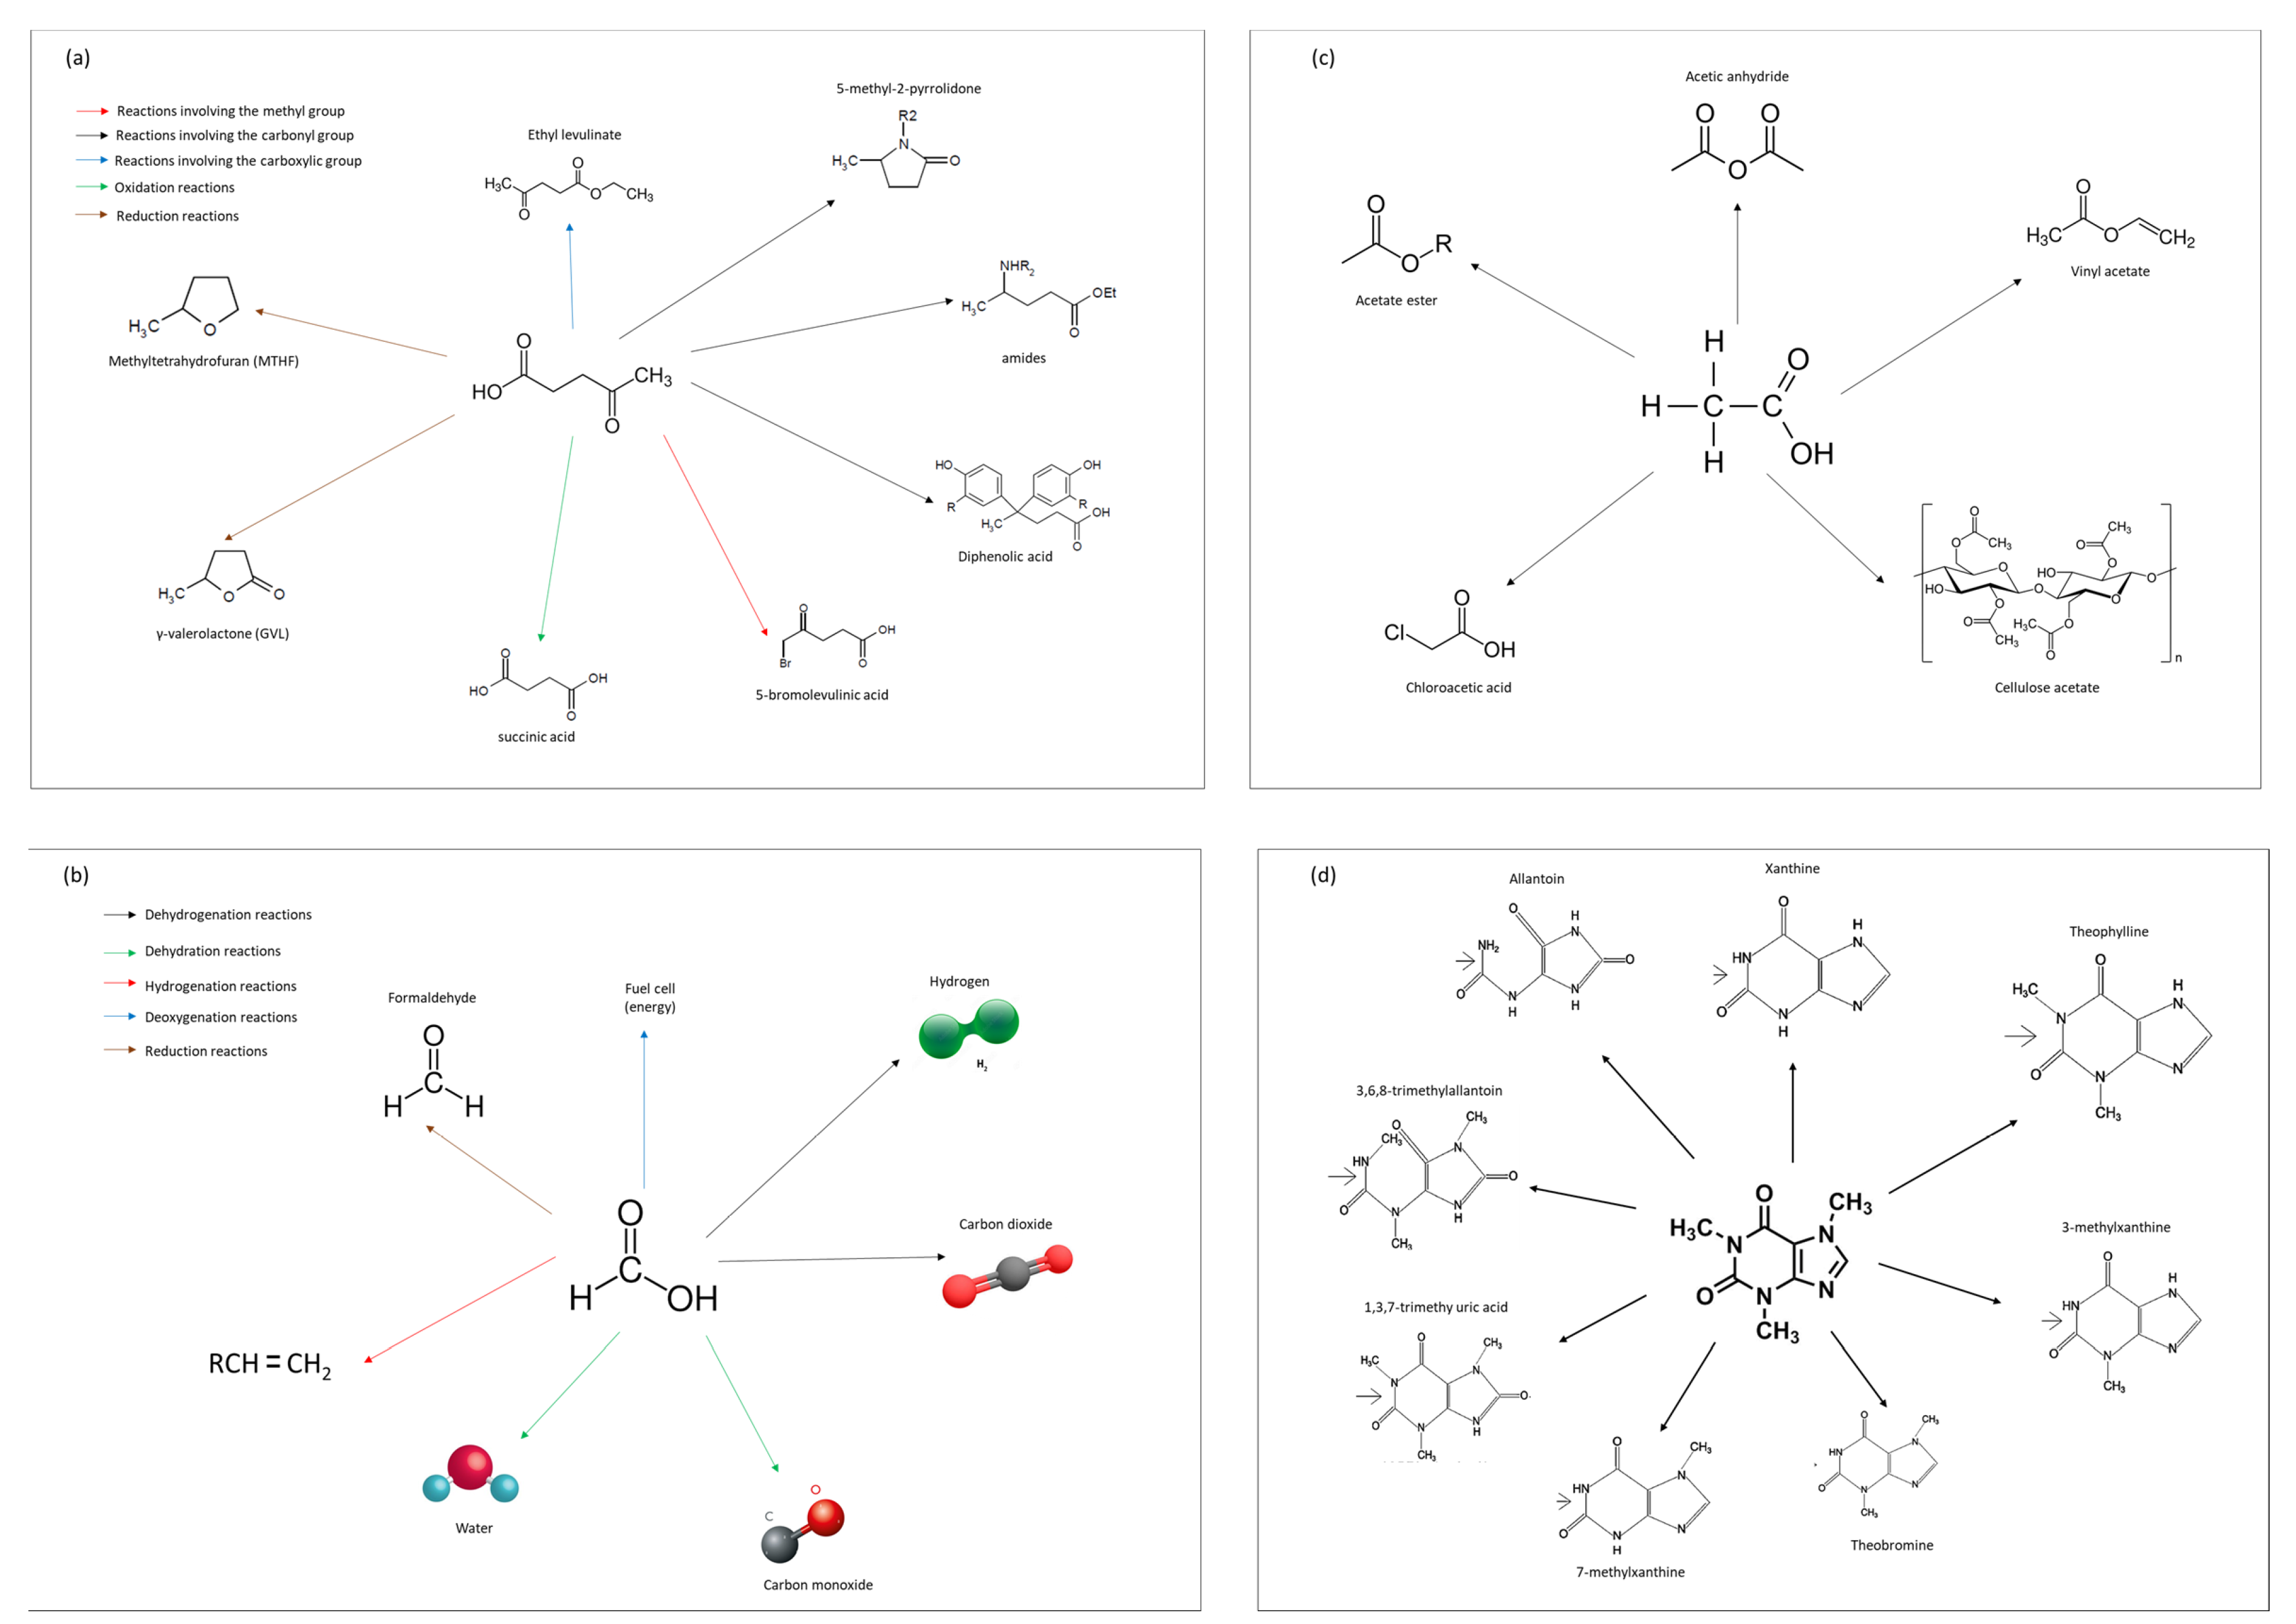
Major components of the pyrolysis liquids detected through HPLC-RID-DAD such as caffeine, acetic acid (AA), levulinic acid (LA), and formic acid (FA) serve as a platform for the synthesis of chemicals. LA works as a sustainable chemistry bridge between biomass and crude oil refining. As shown in Figure 9a, several LA by-products have been suggested for fuel objectives such as γ-valerolactone (GVL), ethyl levulinate, and methyl tetrahydrofuran (MTHF). LA may serve as gasoline and biodiesel additives by conversion to valerate esters-based compounds. LA chemicals are currently used in several industries such as solvents, resins, chemical intermediary products, polymers, batteries, and adsorbents, among others [55,56].
AA is employed in the printing, pigment, food, and pharmaceutical markets. AA solutions are used in the production of solvents and raw chemical substances such as acetic anhydride (Ac2O) and vinyl acetate (VA). Manufacturing of AA has risen from 13 Mt in 2015 to 18 Mt in 2020 and the worldwide AA market forecast is to achieve USD 11.4 billion through 2024 [57]. More than 65% of AA production turns into VA or cellulose-built polymers [58]. Other common end uses of AA, as appears in Figure 9c, are the manufacture of Ac2O, acetate esters, and monochloroacetic acid, and it being used as a solvent in the production of dimethyl terephthalate and terephthalic acid [59]. On one hand, VA is used in the manufacture of latex blend resins for paints, adhesives, paper coatings, and textiles. On the other hand, Ac2O is employed in the production of cellulose acetate textile fibers and cigarette filter tow, as well as cellulose plastics [59].
FA is the most simple organic carboxylic acid, characterized by a pungent smell and showing nice compatibility with water, ethanol, and ether, and frequently utilized as a chemical intermediate and additive, with activity against bacteria. Approximately 1.14 Mt of FA is delivered annually and its sales will expand by 3.74% from 2019 to 2024, directly for food additives [57]. FA has an important role as it is a chemical scene with many functions in chemical, agricultural, leather, pharmaceutical, and rubber manufacturing [60]. FA could replace selected inorganics in chemical operations as it is less corrosive. The FA demand is increasing because of its relatively harmless and rust-resistant assets and this enables its ease of use. In Figure 9b, some FA reactions can be seen. Hydrogen from FA decomposition can be accomplished in accordance with benign terms. FA has become a promising candidate for commercially feasible fuel cell raw material due to its convenient oxidation kinetics allowing low operation temperatures, high theoretical cell potential, and gentle fuel crossover issues [61,62]. FA is viewed as a propitious hydrogen energy carrier for so many reasons: (i) it is liquid at an ambient temperature so FA can be easily handled and deposited; (ii) it is less poisonous than hydrogen; (iii) it has a simple structure and only decays into a limited small fragments; (iv) it is used in direct formic acid fuel cells; and (v) it is recyclable and can provide a carbon-unbiased fuel cycle [63]. Alternatively, FA could be used for CO storage using strong liquid acids and solid catalysts such as zeolites or zirconia [61]. Looking at Figure 9b, FA can also be transformed into formaldehyde to be used as a preservative in food, paints, and cosmetics. FA has also been reported as a chemical livestock feed preservative since it is an efficient antibacterial agent versus Salmonella spp. and various other pathogens on in vitro model studies [64].
Finally, in Figure 9d, caffeine derivatives are shown. Caffeine, which is also present in SC and CSS, is a methylated xanthine that acts as a mild central nervous system stimulant. Caffeine is utilized in a range of cosmetics and can be managed topically and orally when inhaled or injected. Once eaten by people, caffeine accelerates central nervous systems, and, in moderation, boosts vigilance and diminishes tiredness. Caffeine and related methylxanthines serve as natural insecticides, protecting plants from insects and other predators. Additional potential explanations for the biosynthesis of caffeine regard the inhibition of plant matter and enhanced cross-pollination [65]. Caffeine and associated methylxanthines are applied in medicines as stimulating substance, diuretics, inhalers, and blood vessels, and in the therapy and/or avoidance of axial myopia, glaucoma, and macular degeneration, and caffeine derivatives have been demonstrated to have antiproliferative effects on human tumor cells [65,66,67]. Caffeine degradation products such as theophylline (Figure 9d) have been displayed as diminishing the prevalence of contrast-induced nephropathy, which is caused by kidney deficiency. Likewise, theophylline may be regarded as an option for the therapy of chronic obtrusive lung diseases [68]. Theobromine has been used to treat arteriosclerosis, angina pectoris, or high blood pressure, and as an antitussive agent [68].
Figure 9. Derivatives of major compounds found in the liquid pyrolysate: (a) LA; (b) FA; (c) AA; (d) caffeine.
Energies 16 02300 g009
Among all these alternatives of valorization and due to the importance of the use of slow pyrolysis in rural places according to the objectives of the CELISE project (https://celise.unican.es; accessed on 15 February 2023), the possible uses as biofuel, the use as soil amendment [69], the antifungal activities [54], and other natural properties, such as antioxidants, antitumoral, antiallergic, anti-inflammatory, and antimicrobial [70], can lead to good opportunities to improve the social progress in these areas. The use of coffee residues as SC directly in soils is well-known; however, the results of Cervera-Mata et al. [69] revealed that soil treatment of unprocessed SC gives unfavorable agronomical and ecological effects due to their high decomposition and amount of harmful combinations. However, the study reveals that the use of thermal processes such as pyrolysis in the SC can give more opportunities to use the obtained products as soil fertilizers and amendments.

4. Conclusions

Slow pyrolysis experiments were carried out at temperatures of 300, 400, 500, and 600 °C with two specialty coffee residues: CSS (in its original size and ground) and SC, as well as the characterization of the solid and liquid fractions obtained. In general, as the pyrolysis temperature increases, the amount of solid (biochar) decreases at the expense of the increase in liquid and gas. Higher ash content in CSS could justify the higher solid fraction content when pyrolysis is carried out in CSS with respect to SC.
The pyrolysis of SC leads to a more abundant liquid fraction being obtained at any temperature compared with the pyrolysis of CSS, with maximum values of 62% at 600 °C compared to 47% in CSS. This corresponds to its higher contents of hemicellulose and extractives (including caffeine) and lower ash.
Density, pH, FTIR, TG-MS, and HPLC analysis indicated that the pyrolysis liquid is an aqueous phase with a complex organic composition that includes ethanol, acetone, furan, benzene, phenol, furfural, HMF, toluene, and cyclopentanone, and acids such as formic, acetic, and levulinic, responsible for the low pH value of this liquid, with the presence also of caffeine as majority compound.
Char in both residues evolves with the increase in temperature towards an aromatic structure whose calorific value increases with respect to raw materials, reaching values of 21.93 KJ/kg for CSS and 26.45 KJ/kg for SC in the range of bituminous coal.
According to the HPLC analyses, there is a higher caffeine content in the pyrolysis liquid in CSS at all temperatures than in SC, and both can be considered a source of caffeine after its separation and purification. Major components of the pyrolysis liquids such as caffeine, AA, LA, and FA serve as a platform for the synthesis of chemicals. In addition, the use of conventional pyrolysis methods as a treatment of specialty and fair trade coffee residues can be a good opportunity not only at a large scale but also at a small scale, giving more sustainable opportunities in rural areas and increasing the possibilities to obtain biofuel, antifungal, good soil amendment, and natural additives.

Supplementary Materials

The following supporting information can be downloaded at: https://www.mdpi.com/article/10.3390/en16052300/s1, FTIR spectra of raw CSS and SC (Figures S1 and S2) and FTIR of solid and liquid fractions obtained after pyrolysis of CSS and SC at 300, 400, 500 and 600 °C (Figures S3–S18).

Author Contributions

Conceptualization, J.F.-F. and T.L.; methodology, M.K.K.; HPLC analysis, T.L.; investigation, J.F.-F. and A.C.; resources J.F.-F. and A.C.; data curation, M.K.K.; writing—original draft preparation, J.F.-F. and T.L.; writing—review and editing, M.K.K. and A.C.; supervision, J.F.-F.; funding acquisition, J.F.-F. and A.C. All authors have read and agreed to the published version of the manuscript.

Funding

This research was funded by EUROPEAN COMMISSION, Marie Sklodowska-Curie Actions—RISE, grant number 101007733 (CELISE project), by Solvay, under projects 3399 and 3824, and the European LignoCOST Action, number CA17128 https://lignocost.eu/, (accessed on 1 February 2023).

Data Availability Statement

Not applicable.

Conflicts of Interest

The authors declare no conflict of interest.

References

  1. Garcia, C.V.; Kim, Y.-T. Spent coffee grounds and coffee silverskin as potential materials for packaging: A review. J. Polym. Environ. 2021, 29, 2372–2384. [Google Scholar] [CrossRef]
  2. Behrouzian, F.; Amini, A.M.; Alghooneh, A.; Razavi, S.M.A. Characterization of dietary fiber from coffee silverskin: An optimization study using response surface methodology. Bioact. Carbohydrates Diet. Fibre 2016, 8, 58–64. [Google Scholar] [CrossRef]
  3. Oliveira, G.; Passos, C.; Ferreira, P.; Coimbra, M.; Gonçalves, I. Coffee by-products and their suitability for developing active food packaging materials. Foods 2021, 10, 683. [Google Scholar] [CrossRef]
  4. Iriondo-DeHond, A.; Iriondo-DeHond, M.; Del Castillo, M. Applications of compounds from coffee processing by-products. Biomolecules 2020, 10, 1219. [Google Scholar] [CrossRef]
  5. Atabani, A.E.; Mahmoud, E.; Aslam, M.; Naqvi, S.R.; Juchelková, D.; Bhatia, S.K.; Badruddin, I.A.; Khan, T.M.Y.; Hoang, A.T.; Palacky, P. Emerging potential of spent coffee ground valorization for fuel pellet production in a biorefinery. Environ. Dev. Sustain. 2022, 1–39. [Google Scholar] [CrossRef]
  6. González-Moreno, M.; Gracianteparaluceta, B.G.; Sádaba, S.M.; Urdin, J.Z.; Domínguez, E.R.; Ezcurdia, M.P.; Meneses, A.S. Feasibility of vermicomposting of spent coffee grounds and silverskin from coffee industries: A laboratory study. Agronomy 2020, 10, 1125. [Google Scholar] [CrossRef]
  7. Costa, A.S.; Alves, R.C.; Vinha, A.F.; Costa, E.; Costa, C.S.; Nunes, M.A.; Almeida, A.A.; Santos-Silva, A.; Oliveira, M.B.P. Nutritional, chemical and antioxidant/pro-oxidant profiles of silverskin, a coffee roasting by-product. Food Chem. 2018, 267, 28–35. [Google Scholar] [CrossRef]
  8. Polidoro, A.D.S.; Scapin, E.; Lazzari, E.; Silva, A.N.; dos Santos, A.L.; Caramão, E.B.; Jacques, R.A. Valorization of coffee silverskin industrial waste by pyrolysis: From optimization of bio-oil production to chemical characterization by GC × GC/qMS. J. Anal. Appl. Pyrolysis 2018, 129, 43–52. [Google Scholar] [CrossRef]
  9. Battista, F.; Barampouti, E.M.; Mai, S.; Bolzonella, D.; Malamis, D.; Moustakas, K.; Loizidou, M. Added-value molecules recovery and biofuels production from spent coffee grounds. Renew. Sustain. Energy Rev. 2020, 131, 110007. [Google Scholar] [CrossRef]
  10. Martinez, C.L.M.; Saari, J.; Melo, Y.; Cardoso, M.; de Almeida, G.M.; Vakkilainen, E. Evaluation of thermochemical routes for the valorization of solid coffee residues to produce biofuels: A Brazilian case. Renew. Sustain. Energy Rev. 2020, 137, 110585. [Google Scholar] [CrossRef]
  11. Jiménez-Zamora, A.; Pastoriza, S.; Rufián-Henares, J.Á. Revalorization of coffee by-products. Prebiotic, antimicrobial and antioxidant properties. LWT Food Sci. Technol. 2015, 61, 12–18. [Google Scholar] [CrossRef]
  12. Fernandez-Gomez, B.; Lezama, A.; Amigo-Benavent, M.; Ullate, M.; Herrero, M.; Martín, M.; Mesa, M.D.; del Castillo, M.D. Insights on the health benefits of the bioactive compounds of coffee silverskin extract. J. Funct. Foods 2016, 25, 197–207. [Google Scholar] [CrossRef] [Green Version]
  13. Mesías, M.; Navarro, M.; Martínez-Saez, N.; Ullate, M.; del Castillo, M.; Morales, F. Antiglycative and carbonyl trapping properties of the water soluble fraction of coffee silverskin. Food Res. Int. 2014, 62, 1120–1126. [Google Scholar] [CrossRef] [Green Version]
  14. Huang, Y.; Li, B.; Liu, D.; Xie, X.; Zhang, H.; Sun, H.; Hu, X.; Zhang, S. Fundamental advances in biomass autothermal/oxidative pyrolysis: A review. ACS Sustain. Chem. Eng. 2020, 8, 11888–11905. [Google Scholar] [CrossRef]
  15. Herdem, M.S. Performance investigation of a non-combustion heat carrier biomass gasifier for various reforming methods of pyrolysis products. Int. J. Green Energy 2021, 19, 62–71. [Google Scholar] [CrossRef]
  16. Fernández-Ferreras, J.; Rueda, C. Sewage sludge pyrolysis conditions assessment to maximize the liquid fraction for its valorization. In Proceedings of the 18th International Symposium on Waste Management and Sustainable Landfilling, Cagliari, Italy, 11–15 October 2021. [Google Scholar]
  17. Fernández-Ferreras, J.; Quesada-Rumayor, M.E.C.-A. Conventional pyrolysis of sawdust to obtain wood vinegar. In Proceedings of the 2019 International Conference on Green Energy and Environmental Technology GEET-19, Paris, France, 24–26 July 2019. [Google Scholar]
  18. Fernández-Ferreras, J.; Quesada-Rumayor, M.; Cuesta-Astorga, E. Valorisation of sawdust by conentional pyrolysis. Trends Chem. Eng. 2021, 19, 121–130. [Google Scholar]
  19. Fernández-Ferreras, J.; Sánchez-Fernández, N.; Llano, T.; Coz, A. Slow pyrolysis of coffee silverskin and spent coffee for its integral valorisation. In Proceedings of the 18th International Symposium on Waste Management and Sustainable Landfilling, Cagliari, Italy, 11–15 October 2021. [Google Scholar]
  20. Ktori, R.; Kamaterou, P.; Zabaniotou, A. Spent coffee grounds valorization through pyrolysis for energy and materials production in the concept of circular economy. Mater. Today Proc. 2018, 5, 27582–27588. [Google Scholar] [CrossRef]
  21. Van Soest, P.J.; McQueen, R.W. The chemistry and estimation of fibre. Proc. Nutr. Soc. 1973, 32, 123–130. [Google Scholar] [CrossRef] [Green Version]
  22. Viel, M.; Collet, F.; Lanos, C. Chemical and multi-physical characterization of agro-resources’ by-product as a possible raw building material. Ind. Crop. Prod. 2018, 120, 214–237. [Google Scholar] [CrossRef]
  23. ISO 14453:2014; Pulps-Determination of Acetone-Soluble Matter. International Organization for Standardization: Geneva, Switzerland, 2014.
  24. Pokhrel, P.; Shrestha, S.; Rijal, S.K.; Rai, K.P. A simple HPLC method for the determination of caffeine content in tea and coffee. J. Food Sci. Technol. Nepal 2016, 9, 74–78. [Google Scholar] [CrossRef] [Green Version]
  25. Patil, P.N. Caffeine in various samples and their analysis with HPLC—A review. Int. J. Pharm. Sci. Rev. Res. 2012, 16, 76–83. [Google Scholar]
  26. Llano, T.; Quijorna, N.; Andrés, A.; Coz, A. Sugar, acid and furfural quantification in a sulphite pulp mill: Feedstock, product and hydrolysate analysis by HPLC/RID. Biotechnol. Rep. 2017, 15, 75–83. [Google Scholar] [CrossRef] [PubMed]
  27. Malucelli, L.C.; Silvestre, G.F.; Carneiro, J.; Vasconcelos, E.C.; Guiotoku, M.; Maia, C.M.B.F.; Filho, M.A.S.C. Biochar higher heating value estimative using thermogravimetric analysis. J. Therm. Anal. Calorim. 2019, 139, 2215–2220. [Google Scholar] [CrossRef]
  28. Demirbaş, A.; Demirbaş, A.H. Estimating the calorific values of lignocellulosic fuels. Energy Explor. Exploit. 2004, 22, 135–143. [Google Scholar] [CrossRef]
  29. Go, A.W.; Conag, A.T.; Cuizon, D.E.S. Recovery of sugars and lipids from spent coffee grounds: A new approach. Waste Biomass Valorization 2016, 7, 1047–1053. [Google Scholar] [CrossRef]
  30. Kang, S.B.; Oh, H.Y.; Kim, J.J.; Choi, K.S. Characteristics of spent coffee ground as a fuel and combustion test in a small boiler (6.5 kW). Renew. Energy 2017, 113, 1208–1214. [Google Scholar] [CrossRef]
  31. Del Pozo, C.; Rego, F.; Yang, Y.; Puy, N.; Bartrolí, J.; Fàbregas, E.; Bridgwater, A.V. Converting coffee silverskin to value-added products by a slow pyrolysis-based biorefinery process. Fuel Process. Technol. 2021, 214, 106708. [Google Scholar] [CrossRef]
  32. Del Pozo, C.; Bartrolí, J.; Alier, S.; Puy, N.; Fàbregas, E. Production of antioxidants and other value-added compounds from coffee silverskin via pyrolysis under a biorefinery approach. Waste Manag. 2020, 109, 19–27. [Google Scholar] [CrossRef]
  33. Matrapazi, V.; Zabaniotou, A. Experimental and feasibility study of spent coffee grounds upscaling via pyrolysis towards proposing an eco-social innovation circular economy solution. Sci. Total. Environ. 2020, 718, 137316. [Google Scholar] [CrossRef]
  34. Ballesteros, L.F.; Teixeira, J.A.; Mussatto, S.I. Chemical, functional, and structural properties of spent coffee grounds and coffee silverskin. Food Bioproc. Technol. 2014, 7, 3493–3503. [Google Scholar] [CrossRef] [Green Version]
  35. Mussatto, S.I.; Machado, E.M.S.; Martins, S.; Teixeira, J.A. Production, composition, and application of coffee and its industrial residues. Food Bioprocess Technol. 2011, 4, 661–672. [Google Scholar] [CrossRef] [Green Version]
  36. Carvalho, W.S.; Oliveira, T.J.; Cardoso, C.R.; Ataíde, C.H. Thermogravimetric analysis and analytical pyrolysis of a variety of lignocellulosic sorghum. Chem. Eng. Res. Des. 2015, 95, 337–345. [Google Scholar] [CrossRef]
  37. Mohan, D.; Pittman, C.U., Jr.; Steele, P.H. Pyrolysis of wood/biomass for bio-oil: A critical review. Energy Fuels 2006, 20, 848–889. [Google Scholar] [CrossRef]
  38. Choi, Y.S.; Choi, S.K.; Kim, S.J.; Jeong, Y.W.; Soysa, R.; Rahman, T. Fast pyrolysis of coffee ground in a tilted-slide reactor and characteristics of biocrude oil. Environ. Prog. Sustain. Energy 2017, 36, 655–661. [Google Scholar] [CrossRef]
  39. Gholizadeh, M.; Hu, X.; Liu, Q. A mini review of the specialties of the bio-oils produced from pyrolysis of 20 different biomasses. Renew. Sustain. Energy Rev. 2019, 114, 109313. [Google Scholar] [CrossRef]
  40. Balmuk, G.; Videgain, M.; Manyà, J.J.; Duman, G.; Yanik, J. Effects of pyrolysis temperature and pressure on agronomic properties of biochar. J. Anal. Appl. Pyrolysis 2023, 169, 105858. [Google Scholar] [CrossRef]
  41. Lataf, A.; Jozefczak, M.; Vandecasteele, B.; Viaene, J.; Schreurs, S.; Carleer, R.; Yperman, J.; Marchal, W.; Cuypers, A.; Vandamme, D. The effect of pyrolysis temperature and feedstock on biochar agronomic properties. J. Anal. Appl. Pyrolysis 2022, 168, 105728. [Google Scholar] [CrossRef]
  42. Kazimierski, P.; Kardas, D. Influence of temperature on composition of wood pyrolysis products. Drv. Ind. 2017, 68, 307–313. [Google Scholar] [CrossRef] [Green Version]
  43. Pereira, L.G.G.; Pires, C.A.M. Bio-oil viscosity of sisal residue: Process and temperature influence. Energy Fuels 2018, 32, 5115–5124. [Google Scholar] [CrossRef]
  44. Neves, D.; Thunman, H.; Matos, A.; Tarelho, L.; Gómez-Barea, A. Characterization and prediction of biomass pyrolysis products. Prog. Energy Combust. Sci. 2011, 37, 611–630. [Google Scholar] [CrossRef]
  45. de Wild, P.; Reith, H.; Heeres, E. Biomass pyrolysis for chemicals. Biofuels 2011, 2, 185–208. [Google Scholar] [CrossRef]
  46. Li, O.L.; Qin, L.; Takeuchi, N.; Kim, K.; Ishizaki, T. Effect of hydrophilic/hydrophobic properties of carbon materials on plasma-sulfonation process and their catalytic activities in cellulose conversion. Catal. Today 2019, 337, 155–161. [Google Scholar] [CrossRef]
  47. Li, C.; Zhang, L.; Zhang, S.; Gholizadeh, M.; Hu, X. Impacts of temperature on hydrophilicity/functionalities of char and evolution of bio-oil/gas in pyrolysis of pig manure. Fuel 2022, 323, 124330. [Google Scholar] [CrossRef]
  48. Tóth, A.; Hoffer, A.; Pósfai, M.; Ajtai, T.; Kónya, Z.; Blazsó, M.; Czégény, Z.; Kiss, G.; Bozóki, Z.; Gelencsér, A. Chemical characterization of laboratory-generated tar ball particles. Atmos. Meas. Tech. 2018, 18, 10407–10418. [Google Scholar] [CrossRef] [Green Version]
  49. Caetano, N.S.; Silva, V.F.M.; Melo, A.C.; Martins, A.A.; Mata, T.M. Spent coffee grounds for biodiesel production and other applications. Clean Technol. Environ. Policy 2014, 16, 1423–1430. [Google Scholar] [CrossRef] [Green Version]
  50. Coz, A.; Llano, T.; Cifrián, E.; Viguri, J.; Maican, E.; Sixta, H. Physico-chemical alternatives in lignocellulosic materials in relation to the kind of component for fermenting purposes. Materials 2016, 9, 574. [Google Scholar] [CrossRef] [Green Version]
  51. Świątek, K.; Gaag, S.; Klier, A.; Kruse, A.; Sauer, J.; Steinbach, D. Acid hydrolysis of lignocellulosic biomass: Sugars and furfurals formation. Catalysts 2020, 10, 437. [Google Scholar] [CrossRef] [Green Version]
  52. Leong, H.Y.; Chang, C.-K.; Khoo, K.S.; Chew, K.W.; Chia, S.R.; Lim, J.W.; Chang, J.-S.; Show, P.L. Waste biorefinery towards a sustainable circular bioeconomy: A solution to global issues. Biotechnol. Biofuels 2021, 14, 1–15. [Google Scholar] [CrossRef]
  53. Narita, Y.; Inouye, K. Review on utilization and composition of coffee silverskin. Food Res. Int. 2014, 61, 16–22. [Google Scholar] [CrossRef] [Green Version]
  54. Barbero López, A. Recovery of antifungal compounds from wood and coffee industry side-streams and residues for wood preservative formulations. Diss. For. 2020. [Google Scholar] [CrossRef]
  55. Girisuta, B. Levulinic Acid from Lignocellulosic Biomass. Ph.D. Thesis, University of Groningen, Groningen, The Netherlands, 2007. [Google Scholar]
  56. Signoretto, M.; Taghavi, S.; Ghedini, E.; Menegazzo, F. Catalytic production of levulinic acid (LA) from actual biomass. Molecules 2019, 24, 2760. [Google Scholar] [CrossRef] [Green Version]
  57. Travália, B.M.; Forte, M. New proposal in a biorefinery context: Recovery of Acetic and formic acids by adsorption on hydrotalcites. J. Chem. Eng. Data 2020, 65, 4503–4511. [Google Scholar] [CrossRef]
  58. Isikgor, F.H.; Becer, C.R. Lignocellulosic biomass: A sustainable platform for the production of bio-based chemicals and polymers. Polym. Chem. 2015, 6, 4497–4559. [Google Scholar] [CrossRef] [Green Version]
  59. Vidra, A.; Németh, Á. Bio-produced acetic acid: A review. Period. Polytech. Chem. Eng. 2017, 62, 245–256. [Google Scholar] [CrossRef] [Green Version]
  60. Voß, D.; Kahl, M.; Albert, J. Continuous production of formic acid from biomass in a three-phase liquid–liquid–gas reaction process. ACS Sustain. Chem. Eng. 2020, 8, 10444–10453. [Google Scholar] [CrossRef]
  61. Bulushev, D.A.; Ross, J.R.H. Towards sustainable production of formic acid. ChemSusChem 2018, 11, 821–836. [Google Scholar] [CrossRef] [Green Version]
  62. Rees, N.; Compton, R.G. Sustainable energy: A review of formic acid electrochemical fuel cells. J. Solid State Electrochem. 2011, 15, 2095–2100. [Google Scholar] [CrossRef]
  63. Zhang, L.; Wu, W.; Jiang, Z.; Fang, T. A review on liquid-phase heterogeneous dehydrogenation of formic acid: Recent advances and perspectives. Chem. Pap. 2018, 72, 2121–2135. [Google Scholar] [CrossRef]
  64. Ricke, S.C.; Dittoe, D.K.; Richardson, K.E. Formic acid as an antimicrobial for poultry production: A review. Front. Veter. Sci. 2020, 7, 563. [Google Scholar] [CrossRef]
  65. Summers, R.M.; Mohanty, S.K.; Gopishetty, S.; Subramanian, M. Genetic characterization of caffeine degradation by bacteria and its potential applications. Microb. Biotechnol. 2015, 8, 369–378. [Google Scholar] [CrossRef]
  66. Andrs, M.; Muthna, D.; Rezacova, M.; Seifrtova, M.; Siman, P.; Korabecny, J.; Benek, O.; Dolezal, R.; Soukup, O.; Jun, D.; et al. Novel caffeine derivatives with antiproliferative activity. RSC Adv. 2016, 6, 32534–32539. [Google Scholar] [CrossRef]
  67. Singh, N.; Shreshtha, A.K.; Thakur, M.; Patra, S. Xanthine scaffold: Scope and potential in drug development. Heliyon 2018, 4, e00829. [Google Scholar] [CrossRef] [Green Version]
  68. Gummadi, S.N.; Bhavya, B.; Ashok, N. Physiology, biochemistry and possible applications of microbial caffeine degradation. Appl. Microbiol. Biotechnol. 2011, 93, 545–554. [Google Scholar] [CrossRef]
  69. Cervera-Mata, A.; Delgado, G.; Fernández-Arteaga, A.; Fornasier, F.; Mondini, C. Spent coffee grounds by-products and their influence on soil C–N dynamics. J. Environ. Manag. 2021, 302, 114075. [Google Scholar] [CrossRef]
  70. López-Linares, J.C.; García-Cubero, M.T.; Coca, M.; Lucas, S. A biorefinery approach for the valorization of spent coffee grounds to produce antioxidant compounds and biobutanol. Biomass Bioenergy 2021, 147, 106026. [Google Scholar] [CrossRef]
Figure 6. Comparison of solid, liquid, and gas fractions (wt.%) in the pyrolysis of ungrounded and grounded CSS at all the temperatures tested: (a) 300 °C; (b) 400 °C; (c) 500 °C; and (d) 600 °C.
Energies 16 02300 g006
Figure 8. Acids’ and furfurals’ concentrations of pyrolysis liquids at different pyrolysis temperatures: (a) major compounds in CSS; (b) minor compounds in CSS; (c) major compounds in SC; (d) minor compounds in SC.
Energies 16 02300 g008
Table 2. Proximate analysis in CSS and SC (wt.%, dry basis) obtained by TGA.
wt.%, Dry BasisCSSSC
Moisture9.410.5
VM74.476.7
Ash6.72.4
FC18.920.9
Disclaimer/Publisher’s Note: The statements, opinions and data contained in all publications are solely those of the individual author(s) and contributor(s) and not of MDPI and/or the editor(s). MDPI and/or the editor(s) disclaim responsibility for any injury to people or property resulting from any ideas, methods, instructions or products referred to in the content.