1. Introduction
Waste heat air-source heat pump water heater (WH-ASHPWH) systems are energy-saving devices that can make heat flow from a low-heat source to a high-heat source. They convert low-heat energy (such as industrial waste heat) into high-heat energy that can be used, thereby achieving the purpose of saving energy (such as coal, gas, oil, electricity, etc.). Research on air-source heat pump systems mainly focuses on compound heat pump (CHP) systems [
1,
2,
3,
4,
5,
6], two-stage air-source heat pump systems [
7,
8,
9], and the optimization of system components [
10,
11,
12]. However, reasonable operating conditions are also of great significance for the economical and efficient operation of heat pump systems, especially for systems that use industrial waste heat as a heat source. The main factors that affect operation performance are air-side heat transfer conditions and condensing heat transfer conditions. The former is related to waste heat temperature and air volume, while the latter is related to the state of the insulated water tank, mainly involving the hot water temperature setting and water flow. Taking different water heating modes as examples, one study found that the average coefficient of performance (COP) of the instantaneous heating mode was 25.6% higher than that of the cyclic heating mode [
13]. Therefore, it is necessary to carry out in-depth research on the influence of operating conditions on system operation.
At present, the influence of working conditions and environmental factors on air-source heat pump systems is mainly studied through mathematical model simulations and experiments. Tangwe et al. [
14] built and developed mathematical models correlating ambient conditions and electrical energy to the coefficient of performance (COP) of an air-source heat pump water heater. Wu et al. [
15] adopted NSGA-II technology to determine the optimal operating conditions for a novel air-source absorption heat pump. Wang et al. [
16] built a high-fidelity dynamical model of an air-source heat pump heating system using Dymola and proposed improvement of the coefficient of performance (COP) of the system by changing the working conditions of the circulating water circuit side. Qiu et al. [
17] determined the range of optimal working conditions of an integrated heating system with solar energy and air-source heat pumps through mathematical model simulation and a comparative study. Pei et al. [
13] established an experimental prototype of an air-source heat pump water heater (ASHPWH) system for a comparative study between instantaneous and cyclic heating modes. Lei et al. [
18] designed an instantaneous-heating air-source heat pump water heater with a temperature-stratified water tank and experimentally tested its operational performance under various conditions.
According to the above overview, mathematical model methods are more commonly used to study the influence of operating conditions on system performance. However, these mathematical models only consider the main components while ignoring the minor components, which does not reflect the complete heat pump cycle, and component materials, boundary conditions, and heat loss are usually simplified to varying degrees. In addition, there are few studies on the semiempirical parameters of WH-ASHPWH systems. In this study, the main objective was to describe and validate a global semiempirical parametric model of a WH-ASHPWH system using Amesim and determine the optimum operating range of the system. The innovations of this model are that it can take into account all the components and material properties in the cycle, the pressure drop of pipelines, the condenser, and the heat loss of the compressor; in addition, no complex modeling process is required. Taking the equipment of a pharmaceutical factory as an example, the heating performance of the system was compared and analyzed by simulating different waste heat temperatures, waste heat volumes, cooling water temperatures, and water flows. The model was verified by building an experimental platform, and the comparison results showed COP and heating capacity within small deviation ranges of each other, with a running time of less than 8 min.
2. Modeling
In order to make the most efficient use of waste heat in the heat pump system and analyze the performance of the system under variable conditions, we developed a model of the WH-ASHPWH system using Amesim (Siemens Software, Version: 2020.1). The software consists of available object-oriented libraries. The user can quickly build models and make corrections by setting the main parameters in the submodel and establishing the connections correctly. A detailed description of the main assumptions in this model is presented in the following subsections.
2.1. Compressor Model
The compressor is the main element of the waste heat air-source heat pump system; thus, it has a considerable effect on the overall system efficiency. A fixed displacement compressor was used in this model. Three parameters can be used to characterize the performance of the compressor: volumetric efficiency (Equation (1)), mechanical efficiency (Equation (2)), and isentropic efficiency (Equation (3)):
where
N is the rotary speed of the compressor; tau is the pressure ratio; h
dis, h
s, and h
d are isentropic discharge enthalpy, suction-specific enthalpy, and discharge-specific enthalpy, respectively (J/kg); h
inc is the difference between the discharge-specific enthalpy and suction-specific enthalpy; and d
m2 is the mass flow rate at the outlet port. The mass flow rate is obtained from volumetric efficiency (Equation (4)), which depends on the flow rate calculation:
where
ρsuc is the suction density (kg/m
3), and disp is the compressor displacement (m
3).
2.2. Heat Exchanger Models
2.2.1. Tube-in-Tube Condenser
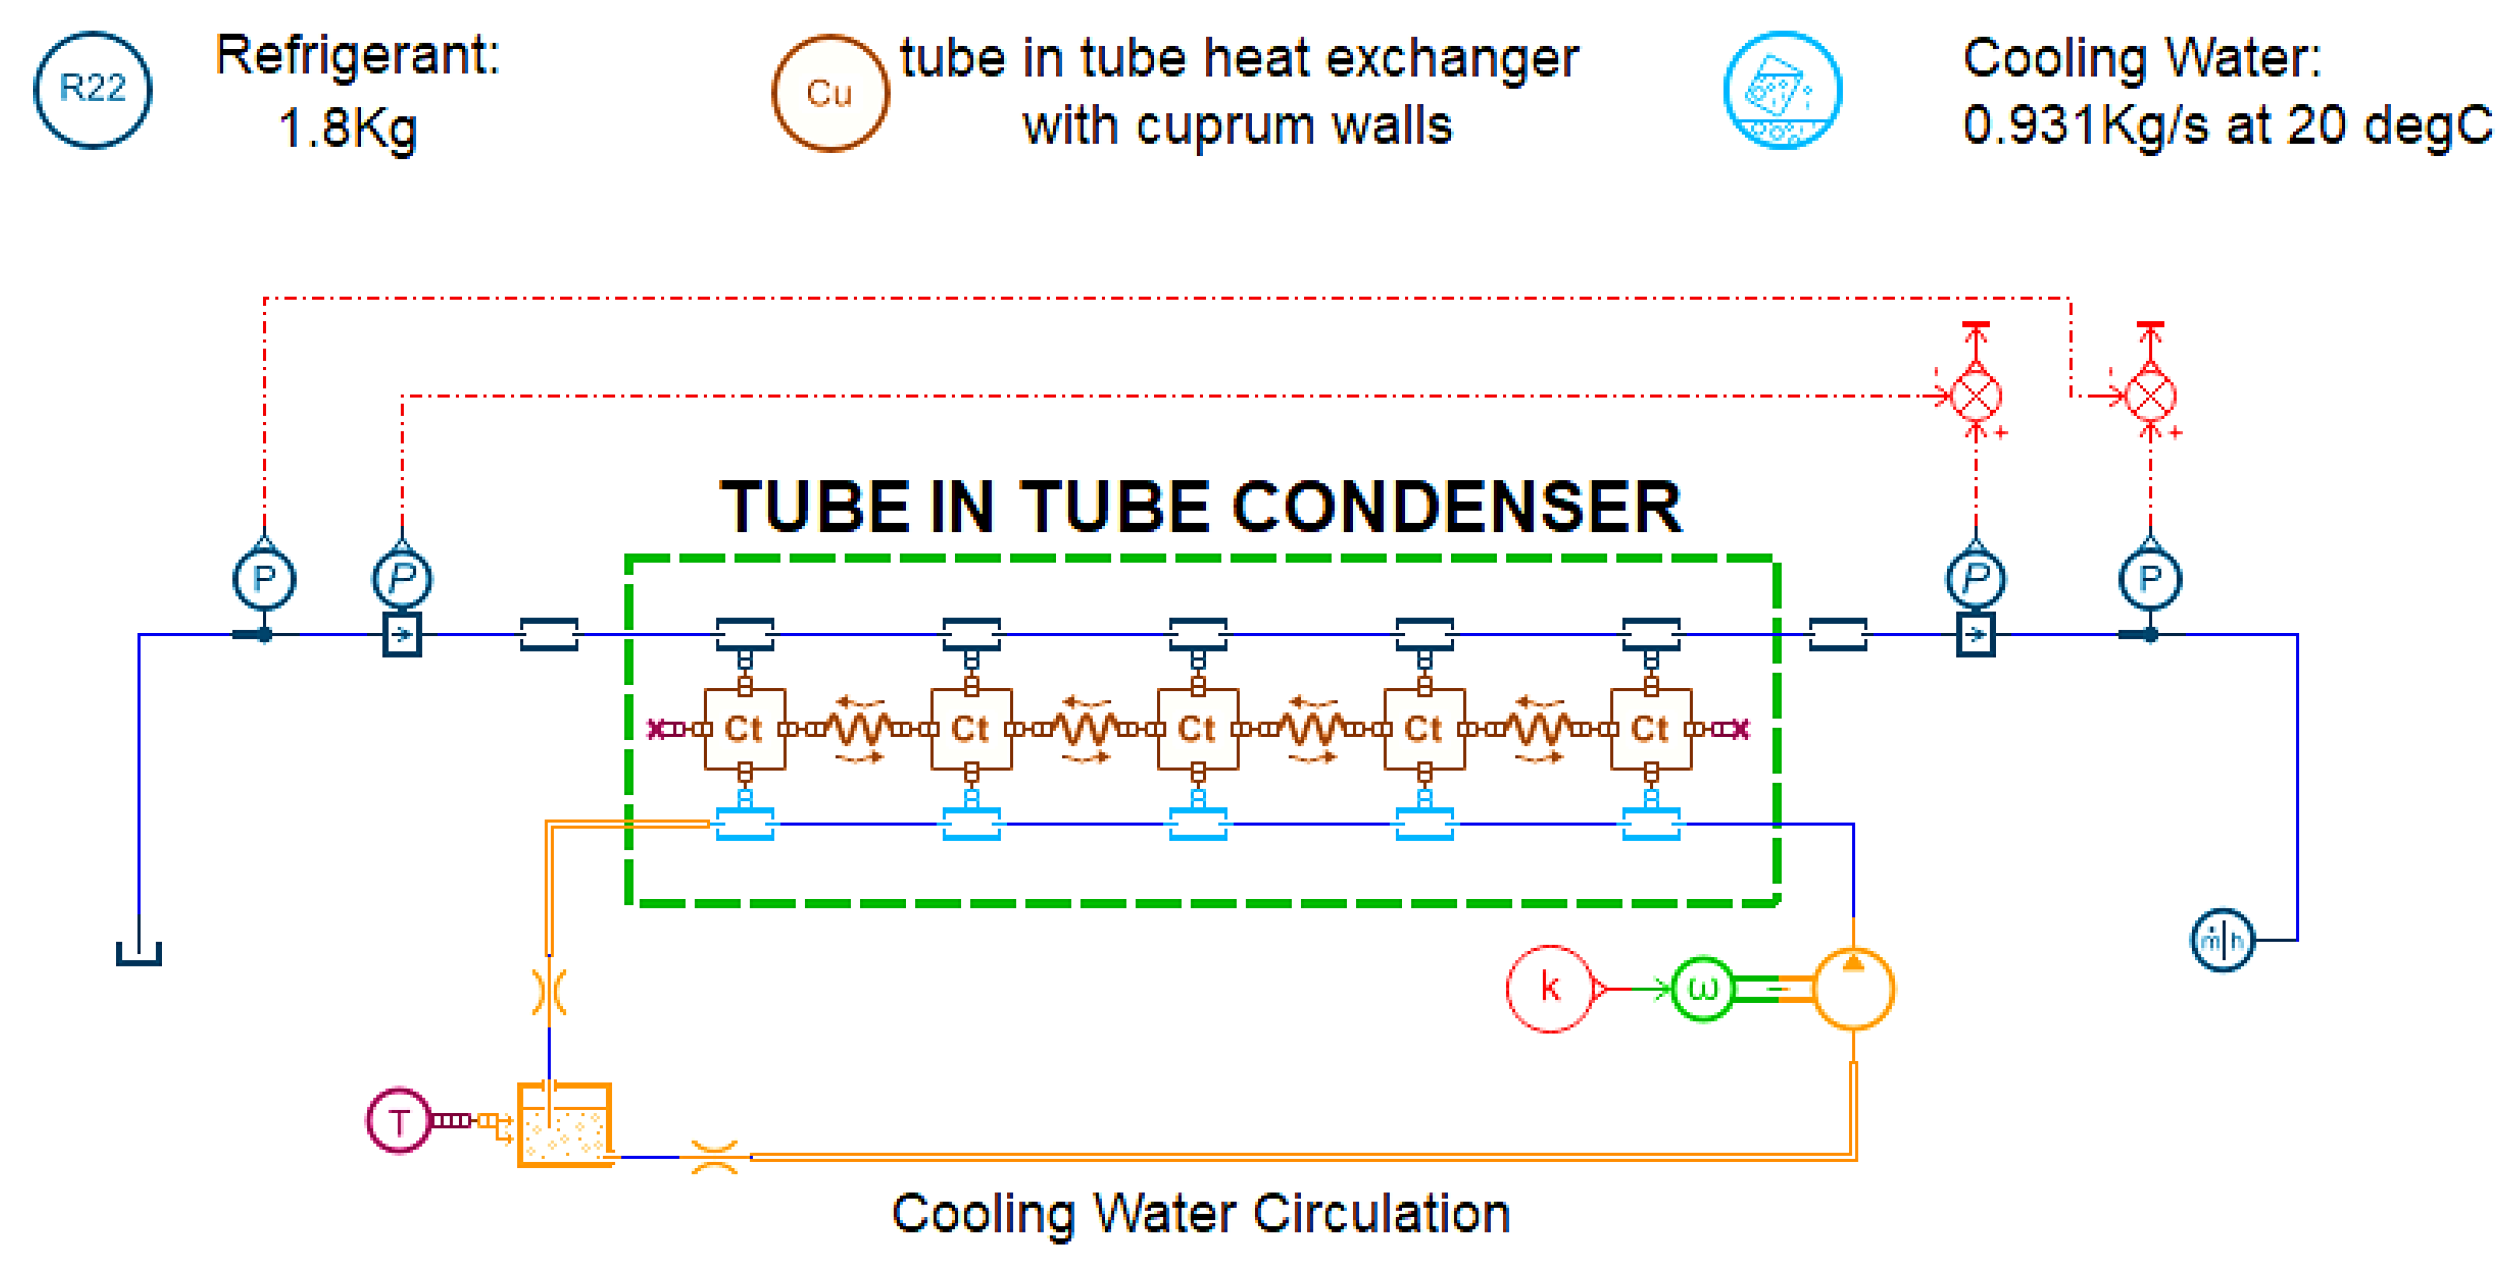
A new discrete model of a tube-in-tube condenser is presented in this paper. The fluids include coolant in the inner tube and refrigerant in the outer tube. A wall with a certain thickness separates the two fluids. The part of
Figure 1 framed by a green dashed line indicates the discrete model of the condenser along its length.
During the process of modeling, various discretization experiments were carried out in an attempt find the most suitable model. Discretization with 5 and 10 elements was compared with modeling without any discretization. The choice of discretization is one of compromise between the quality of results and CPU time. In these three cases, the difference in heat flow rate was small, at less than 1%. However, moving from no discretization to discretization with five elements led to a 40% difference in pressure drop, whereas the pressure drop changed by a mere 4.2% when moving from 5 to 10 elements; in addition, the more discrete elements, the longer the CPU time. Therefore, a discretization with five elements for this exchanger was a good modeling choice. The condenser was divided into five elements of the same volume, which, in global terms, exchanged the net thermal power of the global element. The heat exchange process included both convective (in the horizontal direction) and conductive (in the longitudinal direction) processes. Depending on the process (boiling or condensation), different correlations were implemented in Amesim. Shah correlation [
19] was used for the condensation process.
2.2.2. Evaporator
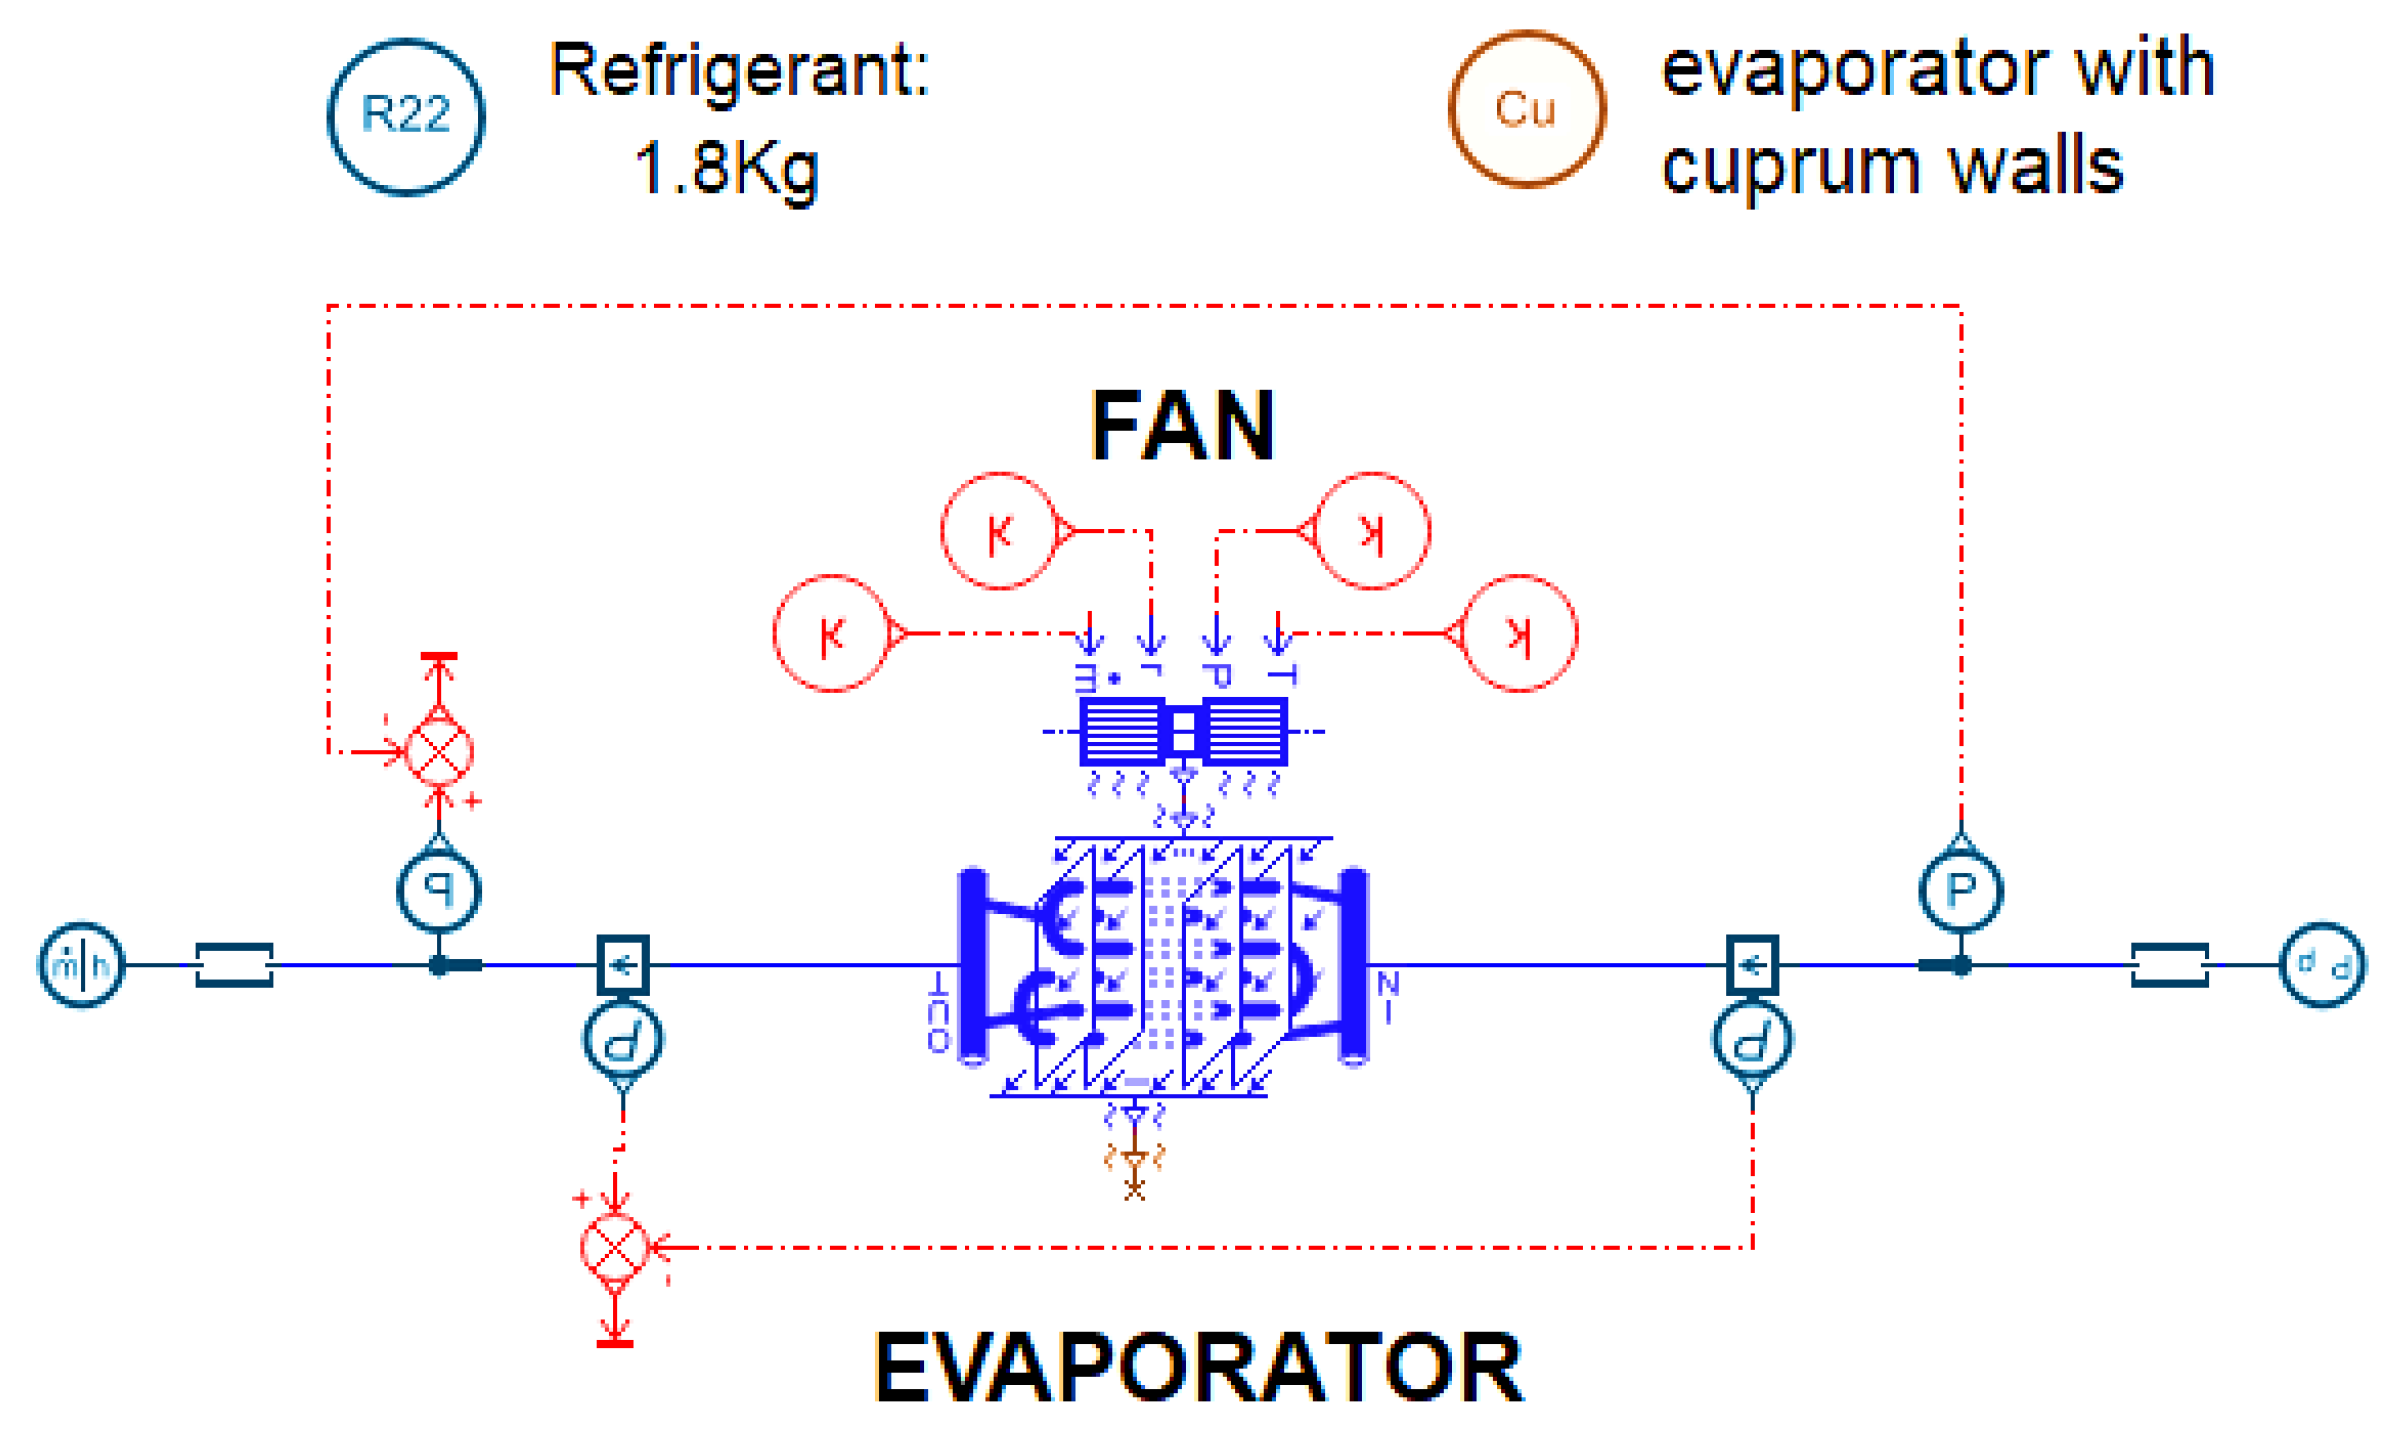
The evaporator in an air-source heat pump absorbs heat from the waste heat air into the working fluid based on fin and tube technology. There is a super-component in Amesim that can be used to create a detailed model of a fins-and-tubes heat exchanger. It enables piloting of the global geometric settings of the exchanger and the physical settings for all the tubes and moist air flow while generating a 3D sketch. It is convenient to set the channel and tube number according to the actual situation. Verein Deutscher Ingenieure (VDI) was used for horizontal tube correlation [
20] in the boiling process. The evaporator model is shown in
Figure 2.
2.3. Expansion Valve
As the throttling element of the heat pump system, the main function of the expansion valve is to provide a certain pressure difference, make the liquid cryogenic refrigerant flow into the evaporator, control the mass flow of the refrigerant, ensure that the evaporator works in a normal state, and prevent the liquid refrigerant from entering the compressor. In this work, the expansion valve was modeled as a two-phase flow-variable constraint. A dimensionless signal input was used to control the flow path area. It was limited to between 0 (orifice closed) and 1 (orifice fully open).
2.4. Other Components and Pipeline Pressure Drop
In many mathematical models [
21,
22,
23,
24,
25], only the main components are modeled for simplification reasons, and the mathematical models of other components are ignored. In this study, because of the availability of object-oriented libraries in Amesim, in addition to the main components of the heat pump system, a gas–liquid separator, liquid receiver, filter dryer, water tank, and other components could be connected to the system model, and the pipe parameters could be set. Since the modeling process was performed according to the main components, the modeling and correction of the gas–liquid separator was included in the compressor branch, while that of the desiccant and liquid storage tank was included in the expansion valve branch.
In order to accurately match an actual equipment, the hydraulic diameter and the sectional area of the connecting pipes were set in detail. The transformation process was assumed to be isenthalpic. In this type of process, the pressure drop is regular, and the friction coefficient depends on the flow pattern and the relative roughness of the pipe. In the single-phase flow (liquid or steam), the pressure drop was not considered. Under two-phase flow conditions, McAdams correlation [
26] was used to compute the regular friction coefficient. Using these elements, enthalpy flow and mass flow could be calculated.
2.5. Global Cycle Model
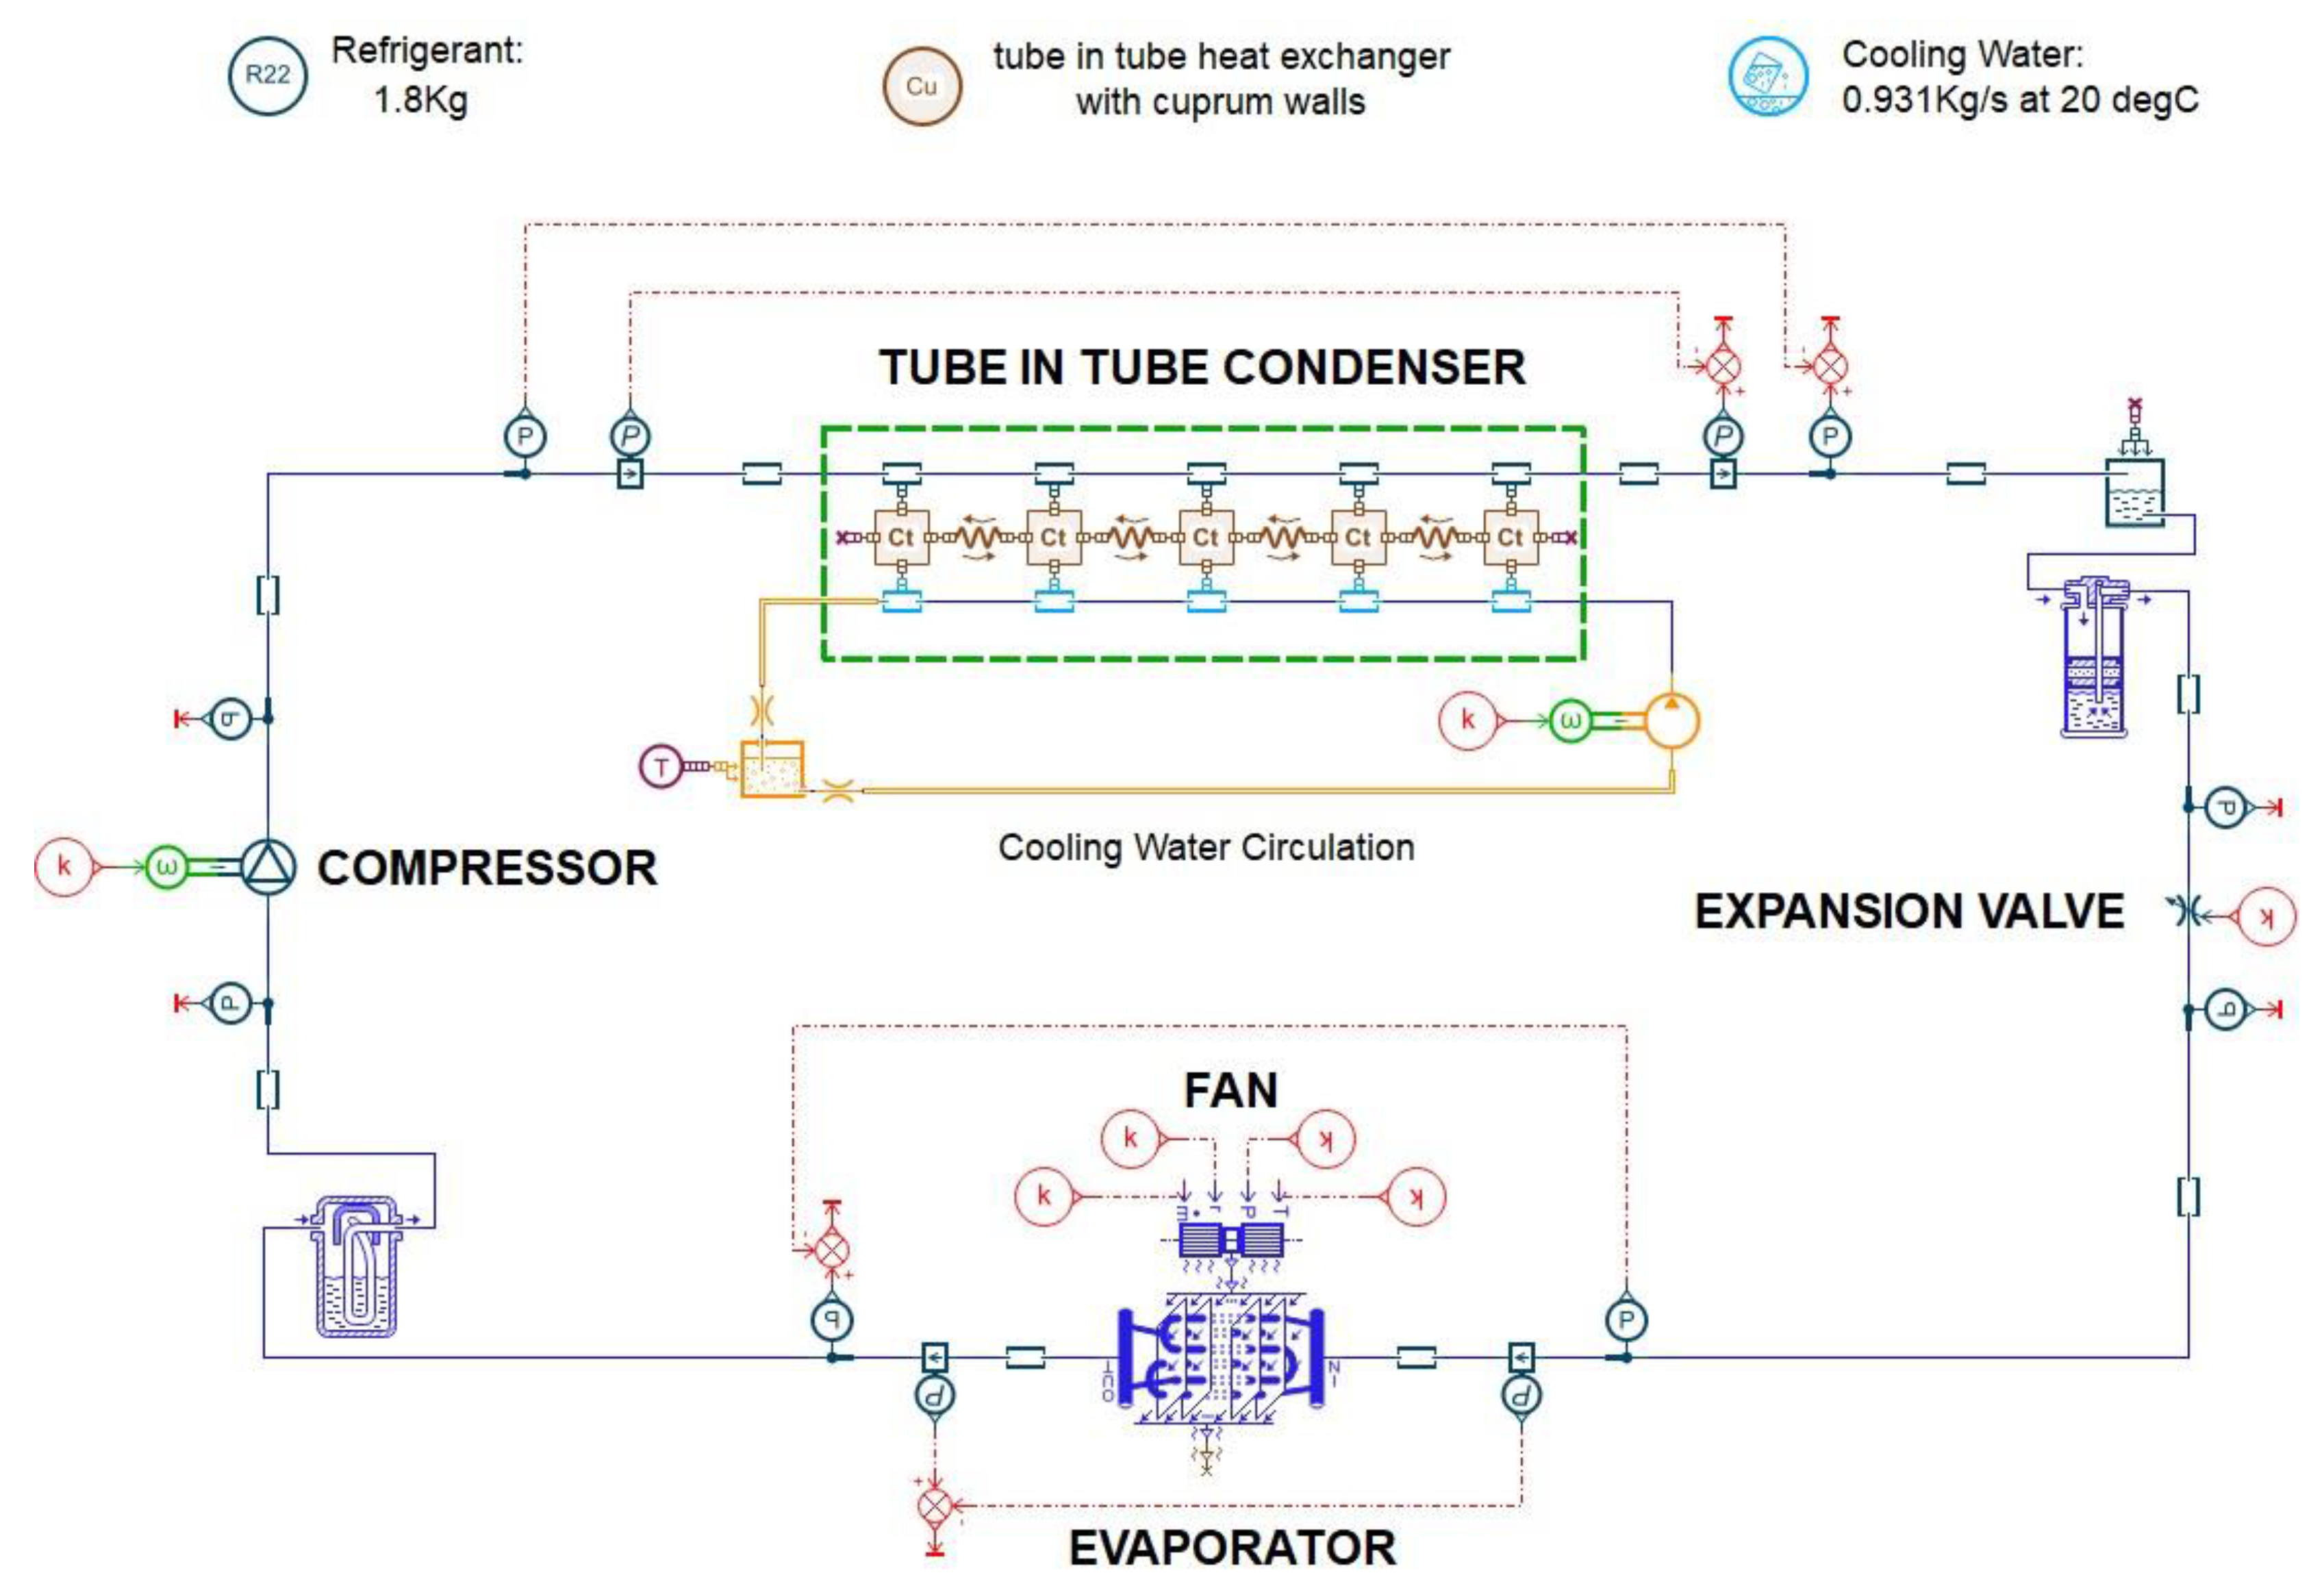
In the steps described above, component models that can run independently were created. In order to realize a working heat pump, each part must be connected to obtain the expected closed-loop model to finalize a complete model. Amesim provides built-in thermophysical property data for different fluids. Once a fluid has been selected, its thermodynamic and transport properties can be called up at program runtime.
Figure 3 shows the global cycle model of the WH-ASHPWH system.
3. Experiment Validation
3.1. Case and Experimental Platform
In order to verify the model, the actual equipment of a pharmaceutical factory was selected as a case study, and the relevant test platform was set up in the laboratory.
Figure 4 shows the schematic diagram of a fluidized bed drying composite system with an air-source heat pump water heater. The end part of the system is a waste heat air-source heat pump water heater system. The evaporator absorbs the waste heat of the air discharged from the drying system and transfers it to the refrigerant. The compressor compresses the low-temperature and low-pressure gaseous refrigerant into a high-temperature and high-pressure gaseous refrigerant. The cooling water in the condenser exchanges heat with the refrigerant and becomes hot water with a temperature of around 60 °C. The generated hot water can be used to clean the fluidized bed or other equipment, which not only reduces power consumption but also avoids the laying of hot water heating pipes.
Figure 5 shows a schematic diagram of the test platform built in our laboratory. Test points were arranged at the inlet and outlet of each component to verify the energy balance and power estimation and ensure the proper operation of all components. The measured parameters included temperature, pressure, and flow.
Table 1 summarizes the absolute uncertainties of all sensors installed in the model.
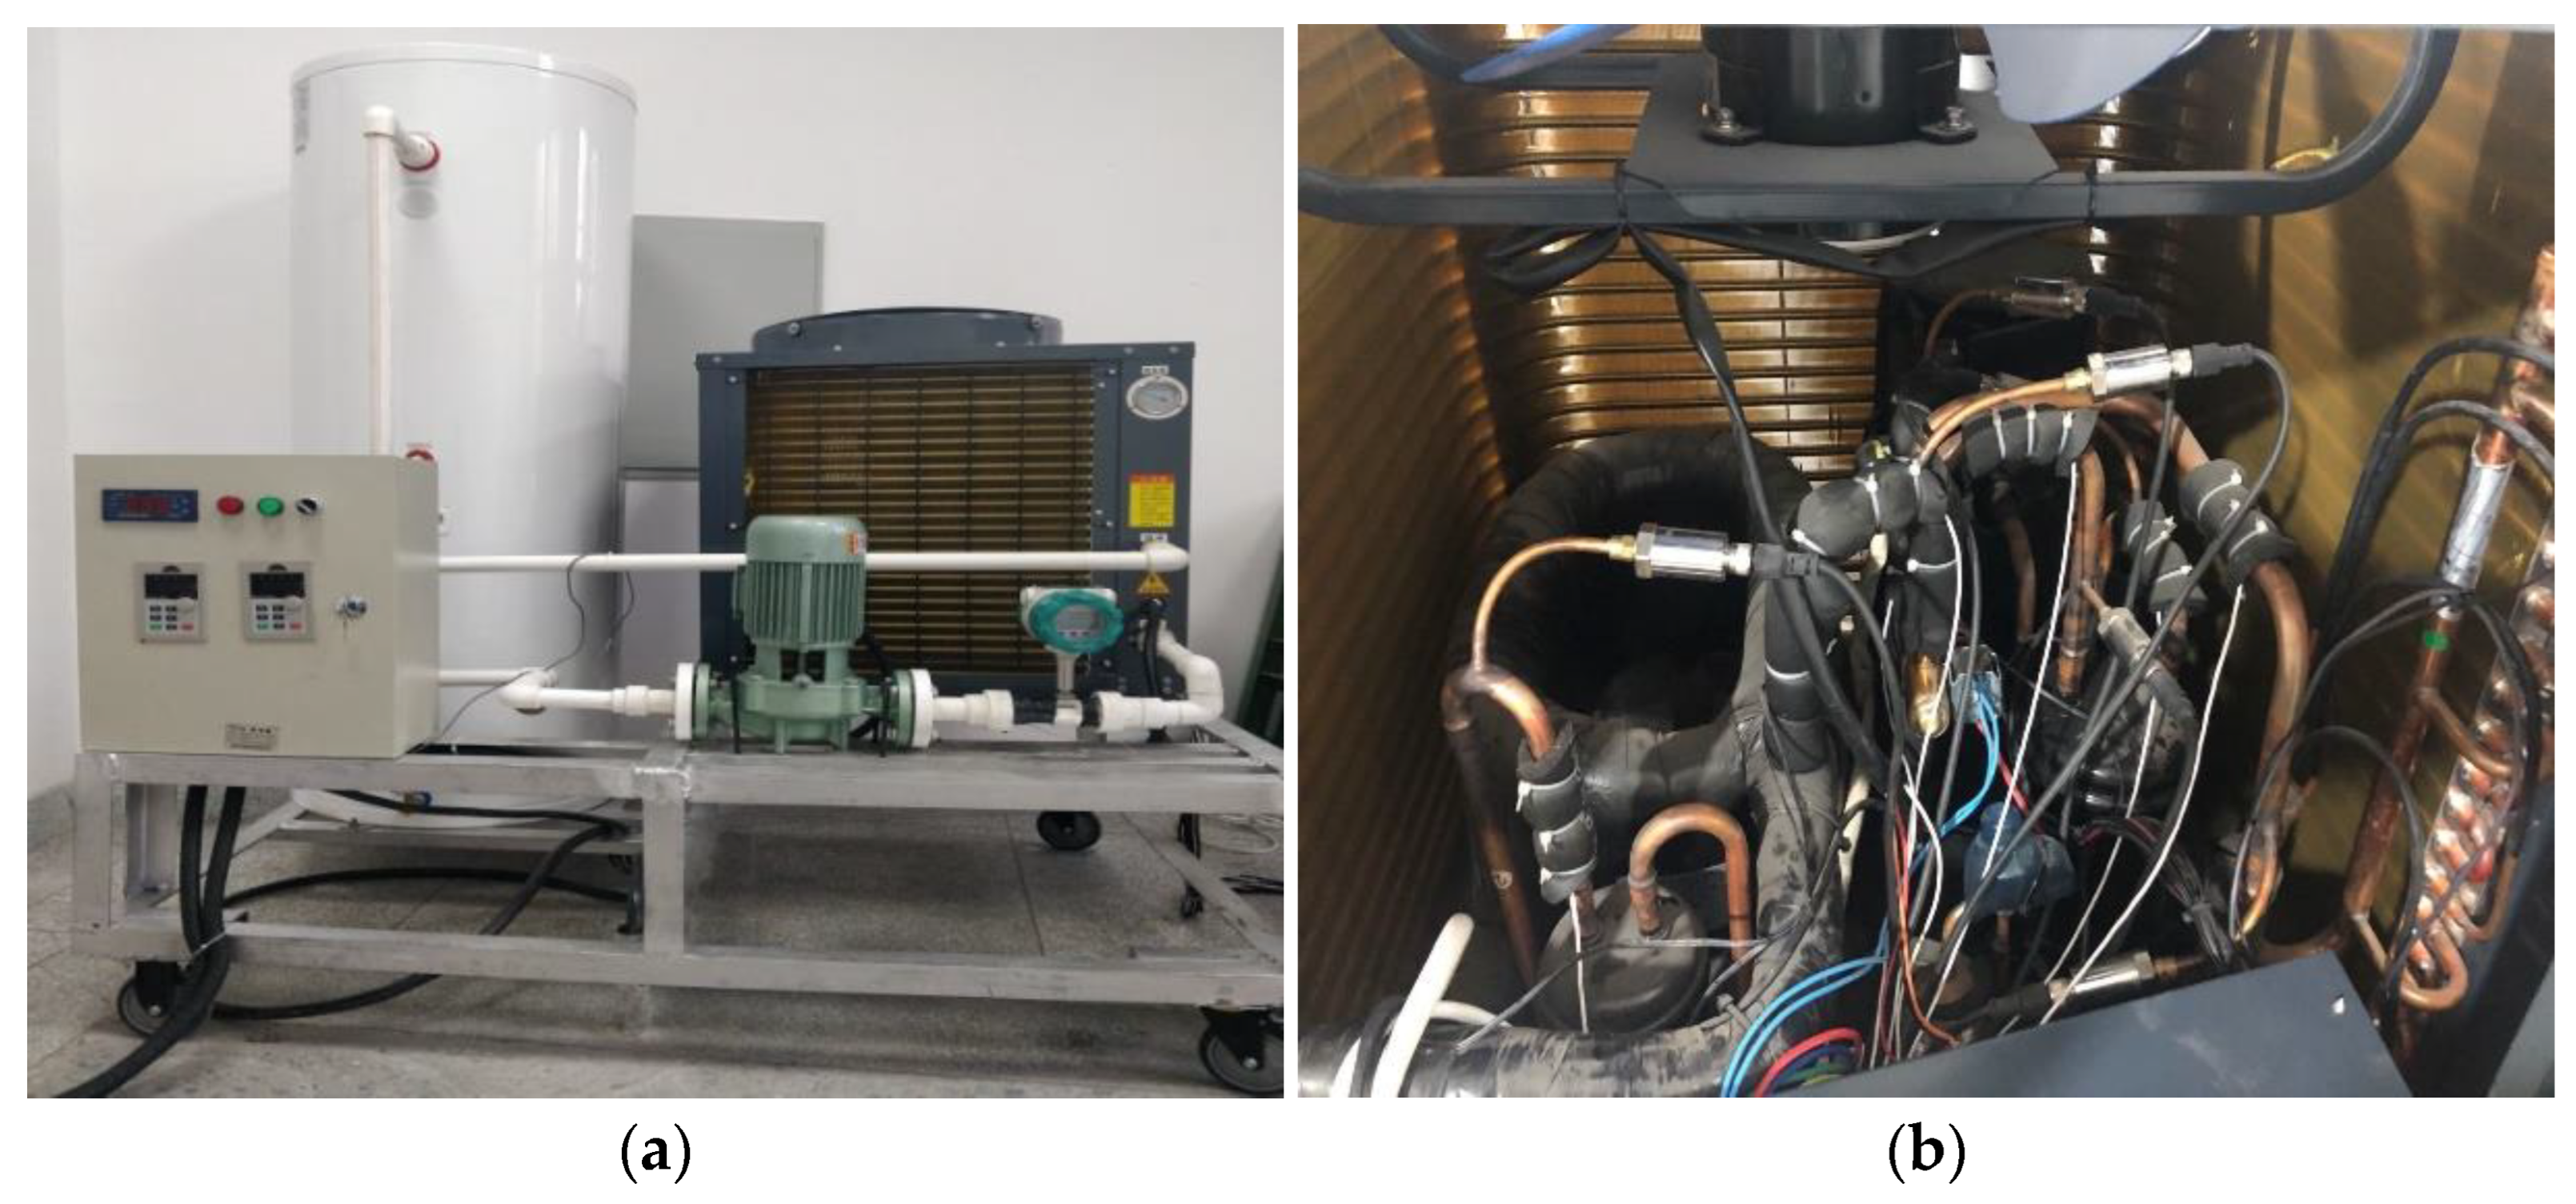
Figure 6 shows a set of photographs of the exterior and interior of the experimental setup.
The main parameters of the air-source heat pump system components used in this study are as follows. The waste heat was simulated by a variable-frequency fan (model: YVVFA-4400S-50IIDA0, Lanzhou Huiyang, China) with an air volume range of 0~8000 m3/h, a temperature range of 0–60 °C, and a frequency of 50 Hz. The evaporator (model: XJ-3HP, Lanzhou Huiyang, China) was a finned-tube evaporator consisting of 26 copper tubes arranged side by side, which were divided into 7 loops. The thickness of the fins was 0.15 mm, with a width of 19.05 mm; the spacing between fins was 1.4 mm, and the windward area was 0.75 m2. The condenser was an efficient tube-in-tube condenser. The outer diameter of the outer tube was 25 mm, and the wall thickness was 2.0 mm. The outer diameter of the inner tube was 16 mm, and the wall thickness was 2 mm. The radius of the curvature of the spiral casing was 100 mm. A scroll compressor (ZW34kATFP, Copeland Compressor) from Emerson (Suzhou, China) was used as the compressor. The rated input power of the scroll compressor was 2820 W, and the rated load was 6.4 A. The displacement of the scroll compressor was fixed at 46.2 cm3. An electronic expansion valve (model: DPF(O)2.4, Shanghai Sanhua Electric, China) with a hole diameter of 2.4 mm and a four-phase stepper motor drive with a pulse count of 2000 (on full) was used. A circular pressure-type thermal insulation water tank with a volume of 300 L and an outside polyurethane insulation layer was used.
3.2. Heat Exchanger Calibration
In order to determine the parameters that best match the equipment to obtain optimal heat transfer performance, it is necessary to calibrate the heat exchanger models. Because the pressure drop modifies the saturation pressure of the refrigerant, it has an impact on heat rejection. Inversely, heat rejection drives the state of the refrigerant flow (single-phase or two-phase) and, therefore, the friction that occurs. As a result, pressure drop and heat rejection are coupled phenomena. In this study, these parameters were determined by simultaneously modifying the gain in the internal heat exchange and the pressure drop gain on the refrigerant side.
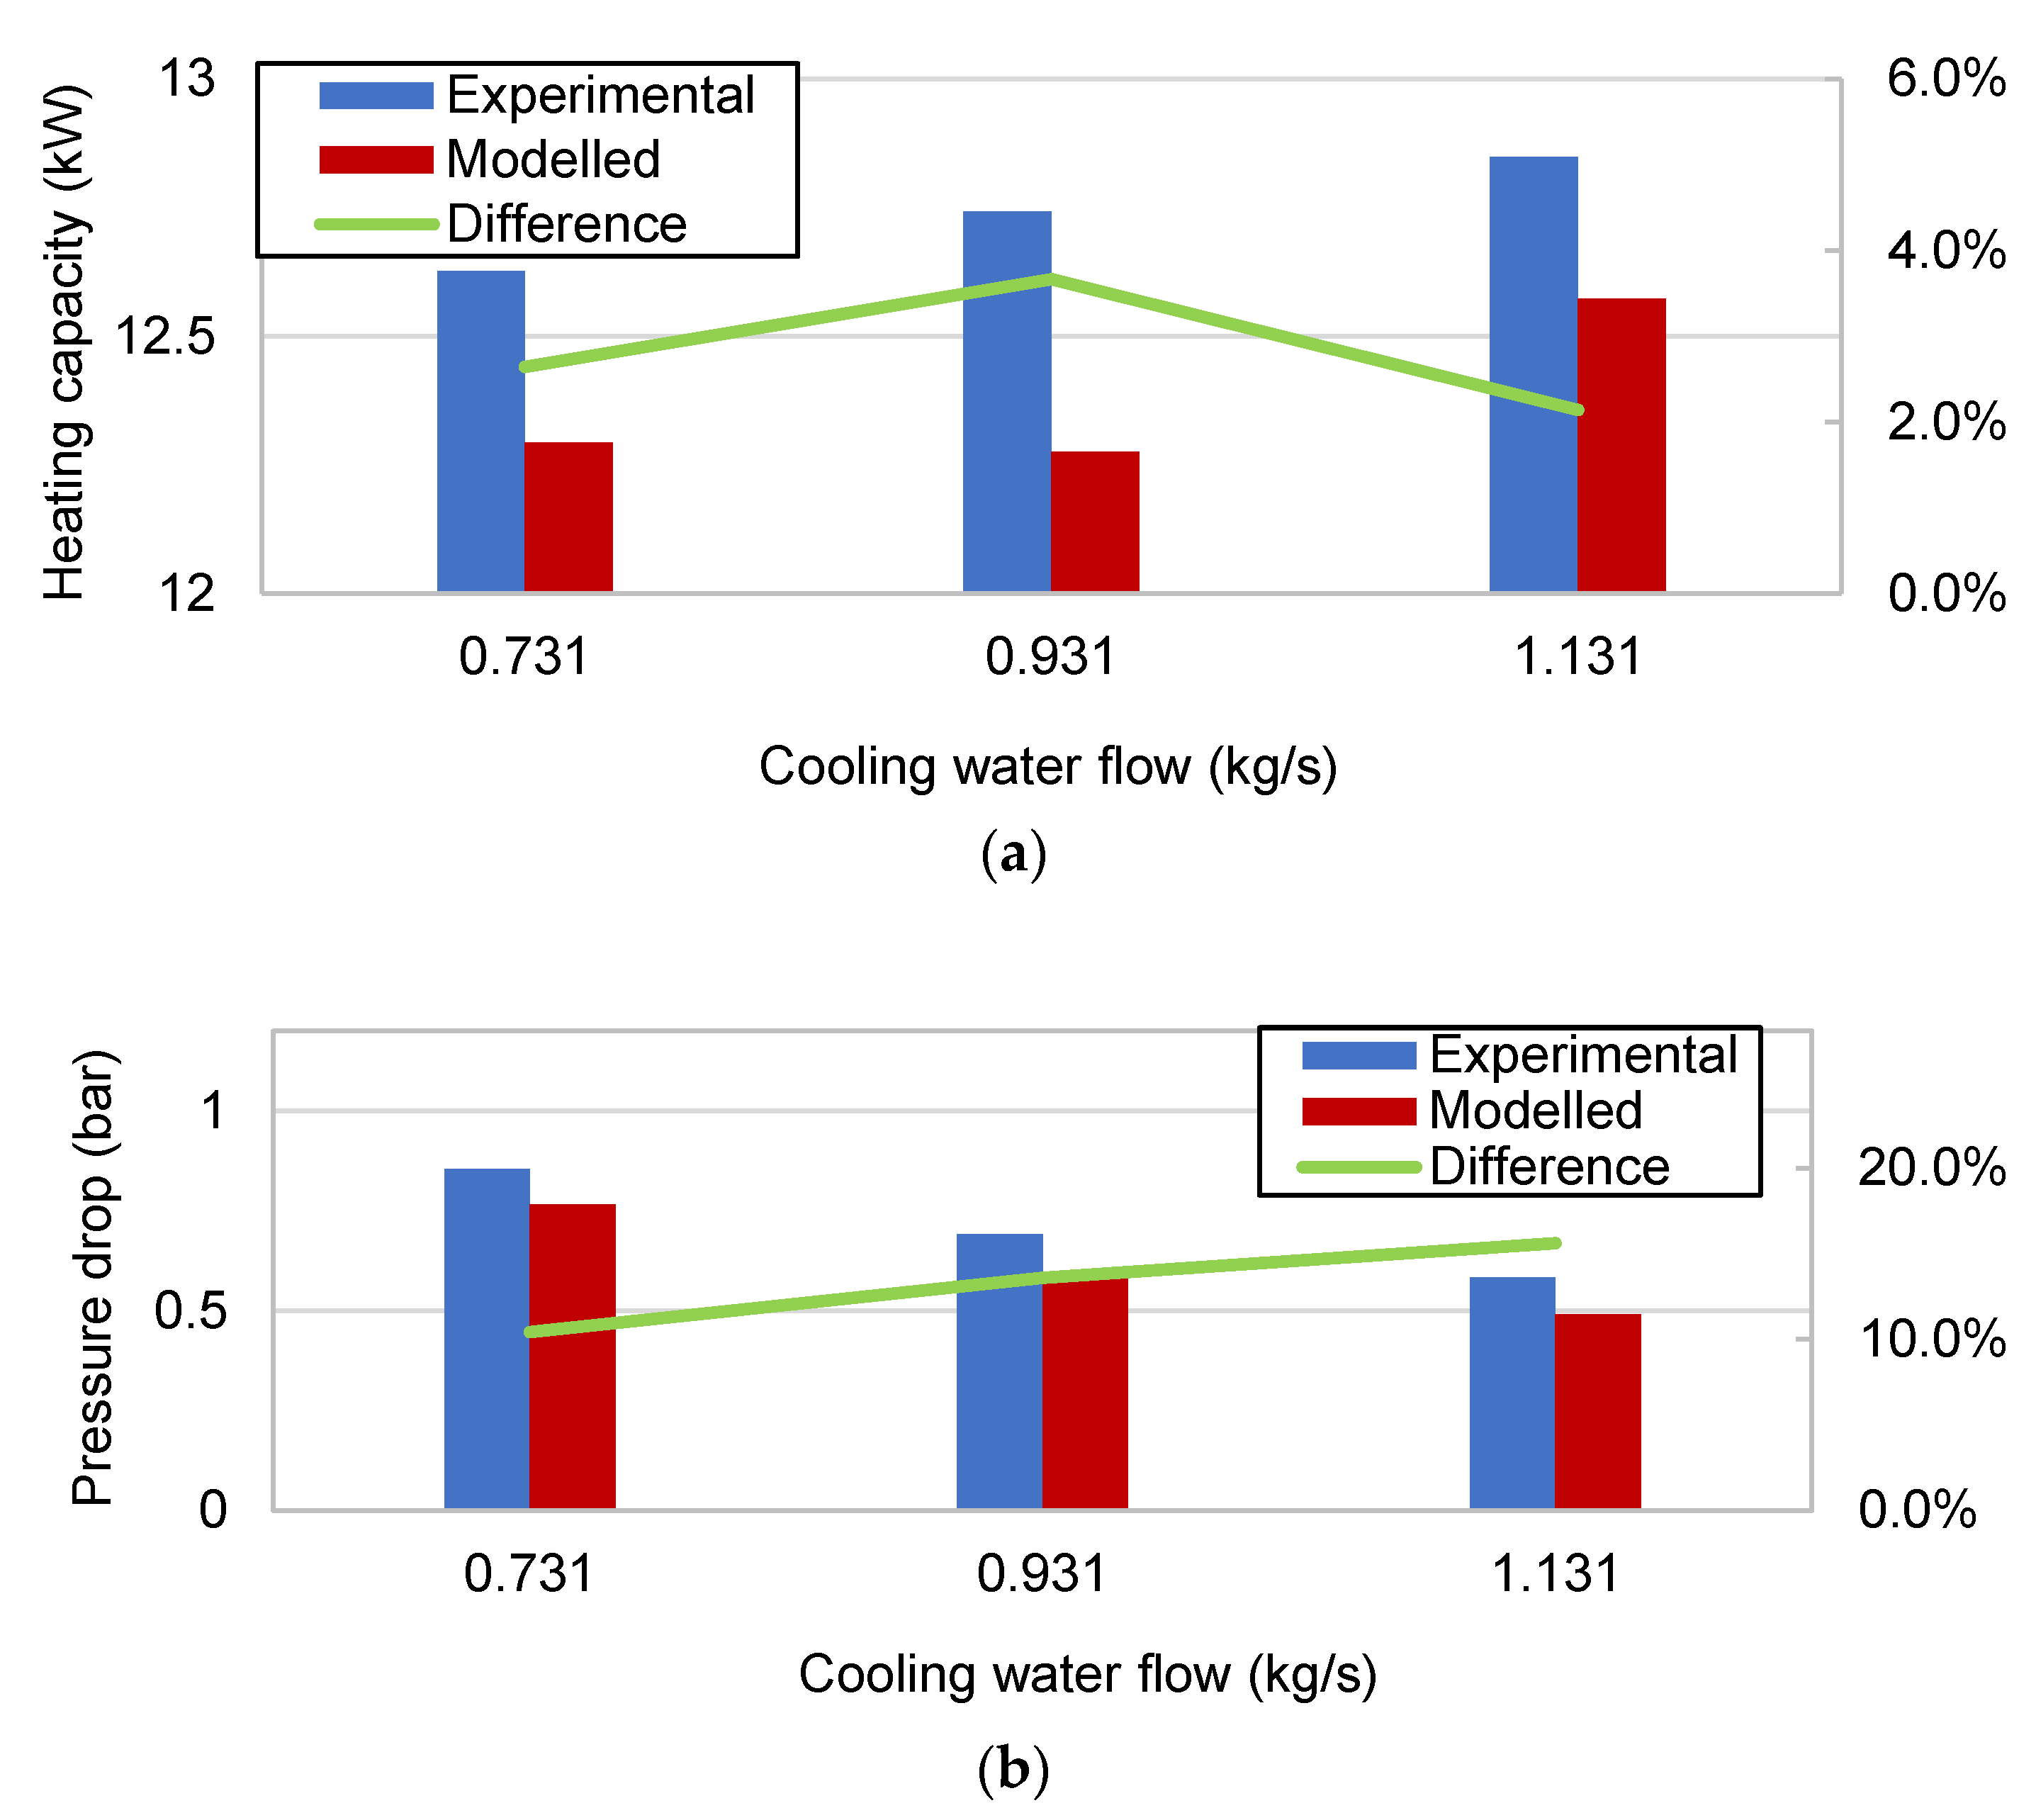
As shown in
Figure 7, by varying the water-side flow from 0.731 kg/s to 1.131 kg/s, the experimental values of mass flow and entry pressure in the refrigerant side were used to validate the tube-in-tube condenser model. The final simulated refrigerant pressure drop and heating capacity were within a small deviation range.
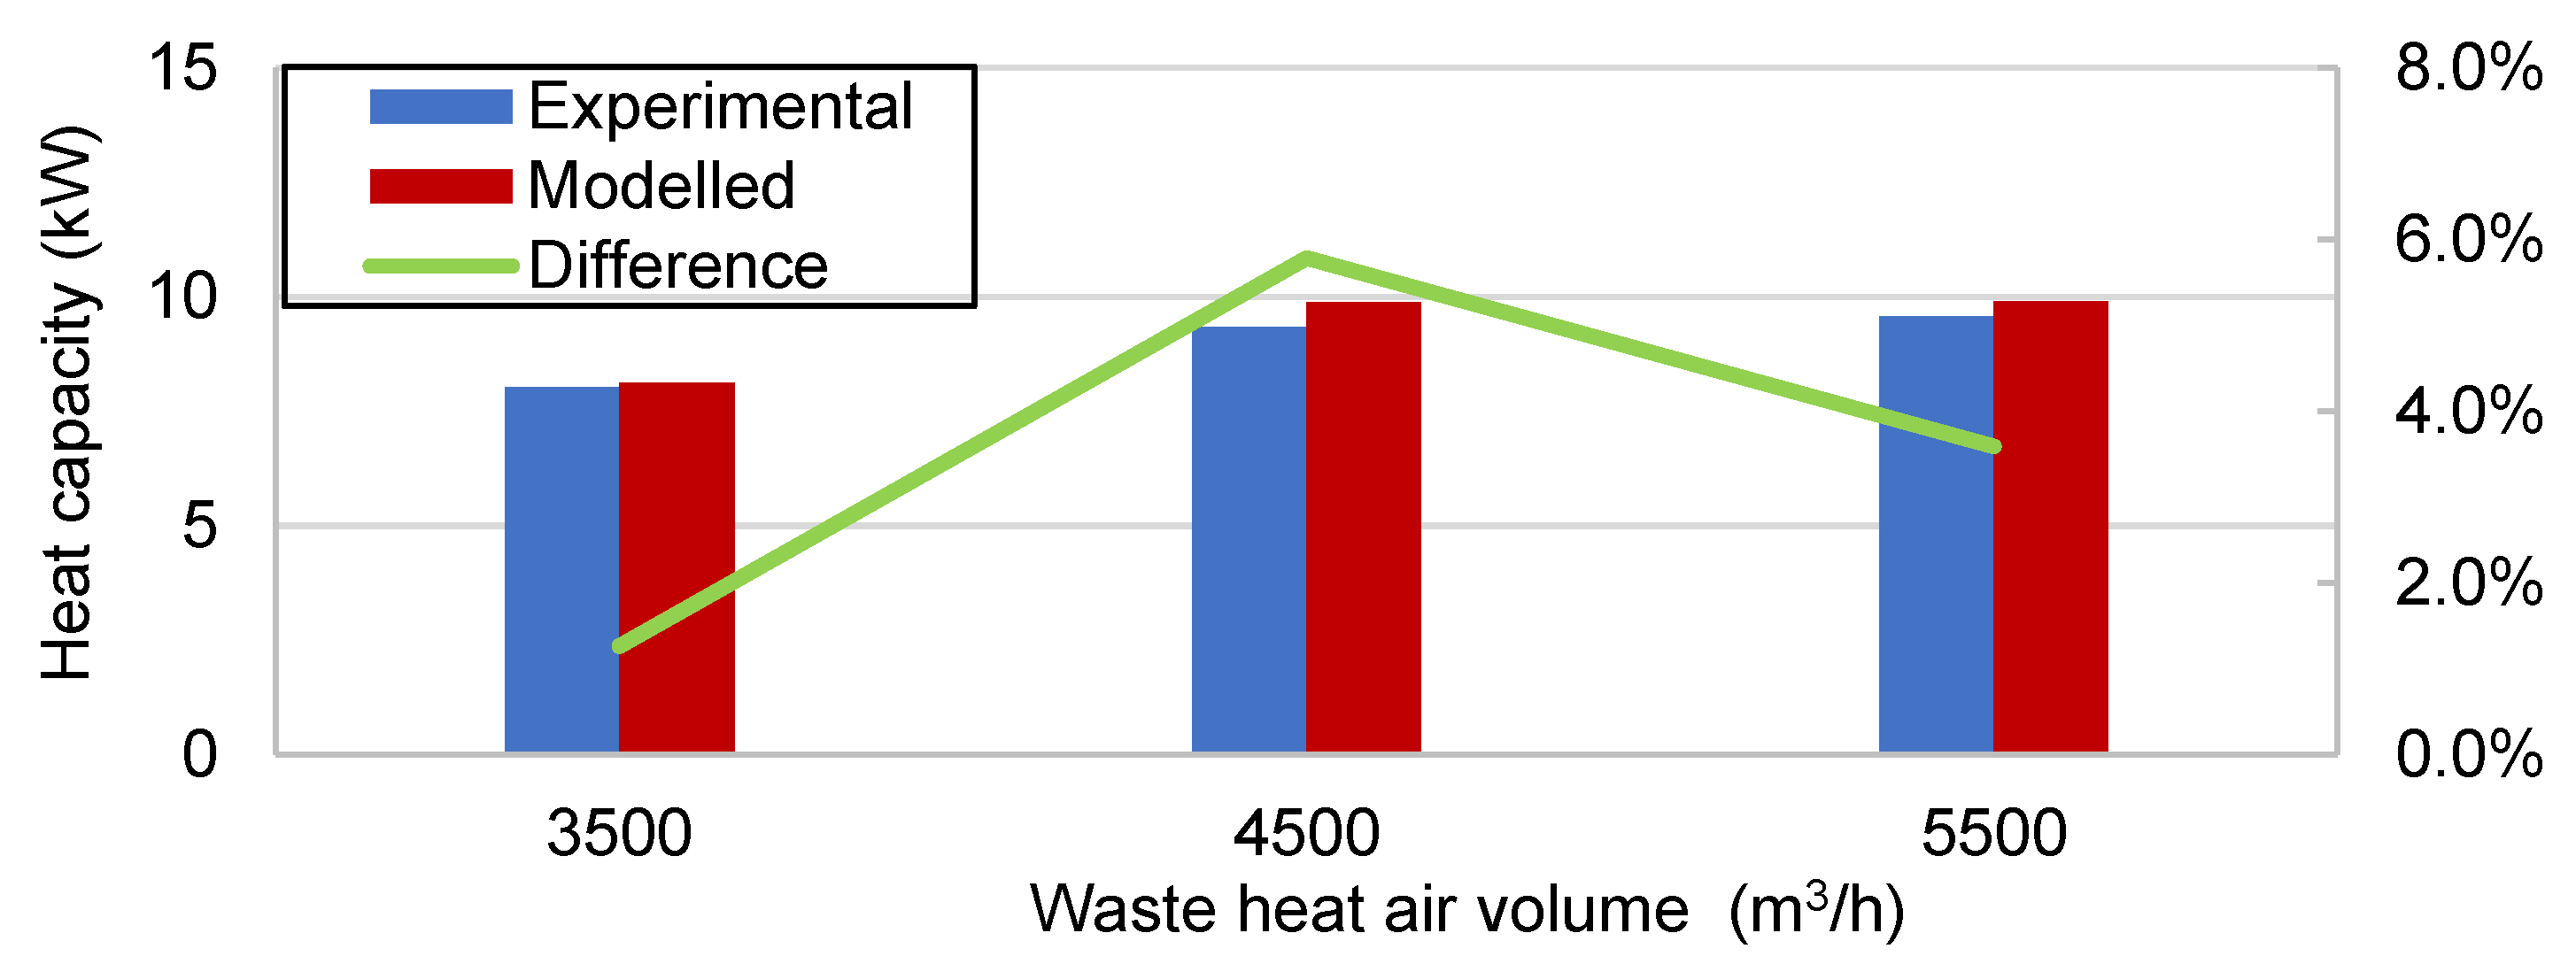
The evaporator is divided into 7 channels and 26 tubes arranged side by side. To improve the evaporator model and properly take into account the thermal inertia, the thermal capacities of the evaporator model were calibrated using a variable hot air volume test; as shown in
Figure 8, the deviation of heat transfer after calibration was within 5.78%.
4. Simulation Results and Experimental Verification
In this section, the effects of waste heat temperature, air volume, cooling water temperature, and water flow on heat pump heating capacity, compressor power, and COP are assessed based on simulation results and verified using experimental data.
4.1. The Effect of Waste Heat Temperature
The main changes in evaporator-side working conditions are waste heat temperature and waste heat air volume. The first simulation investigated the effect of waste heat temperature on the heat pump hot water system. The waste heat temperature was varied from 25 °C to 55 °C, and the cooling water was heated from 18 °C to 55 °C. Since waste heat air volume is between 3000 m3/h and 7000 m3/h, an intermediate volume of 5000 m3/h was selected. As the outlet temperature of the cooling water was set at a constant, there was little variation in condensing temperature and condensing pressure.
The variation in evaporation pressure with waste heat temperature is shown in
Figure 9. When the temperature was lower than 40 °C, the evaporation pressure increased obviously with increasing temperature. When the temperature was higher than 45 °C, the evaporation pressure basically remained unchanged at about 7 bar. The deviation between the simulated and experimental values was small. The deviation was greater when the waste heat temperature was lower because the heat transfer of the evaporator is easily affected by the ambient temperature when the waste heat temperature is close to room temperature; this effect was not factored into the model.
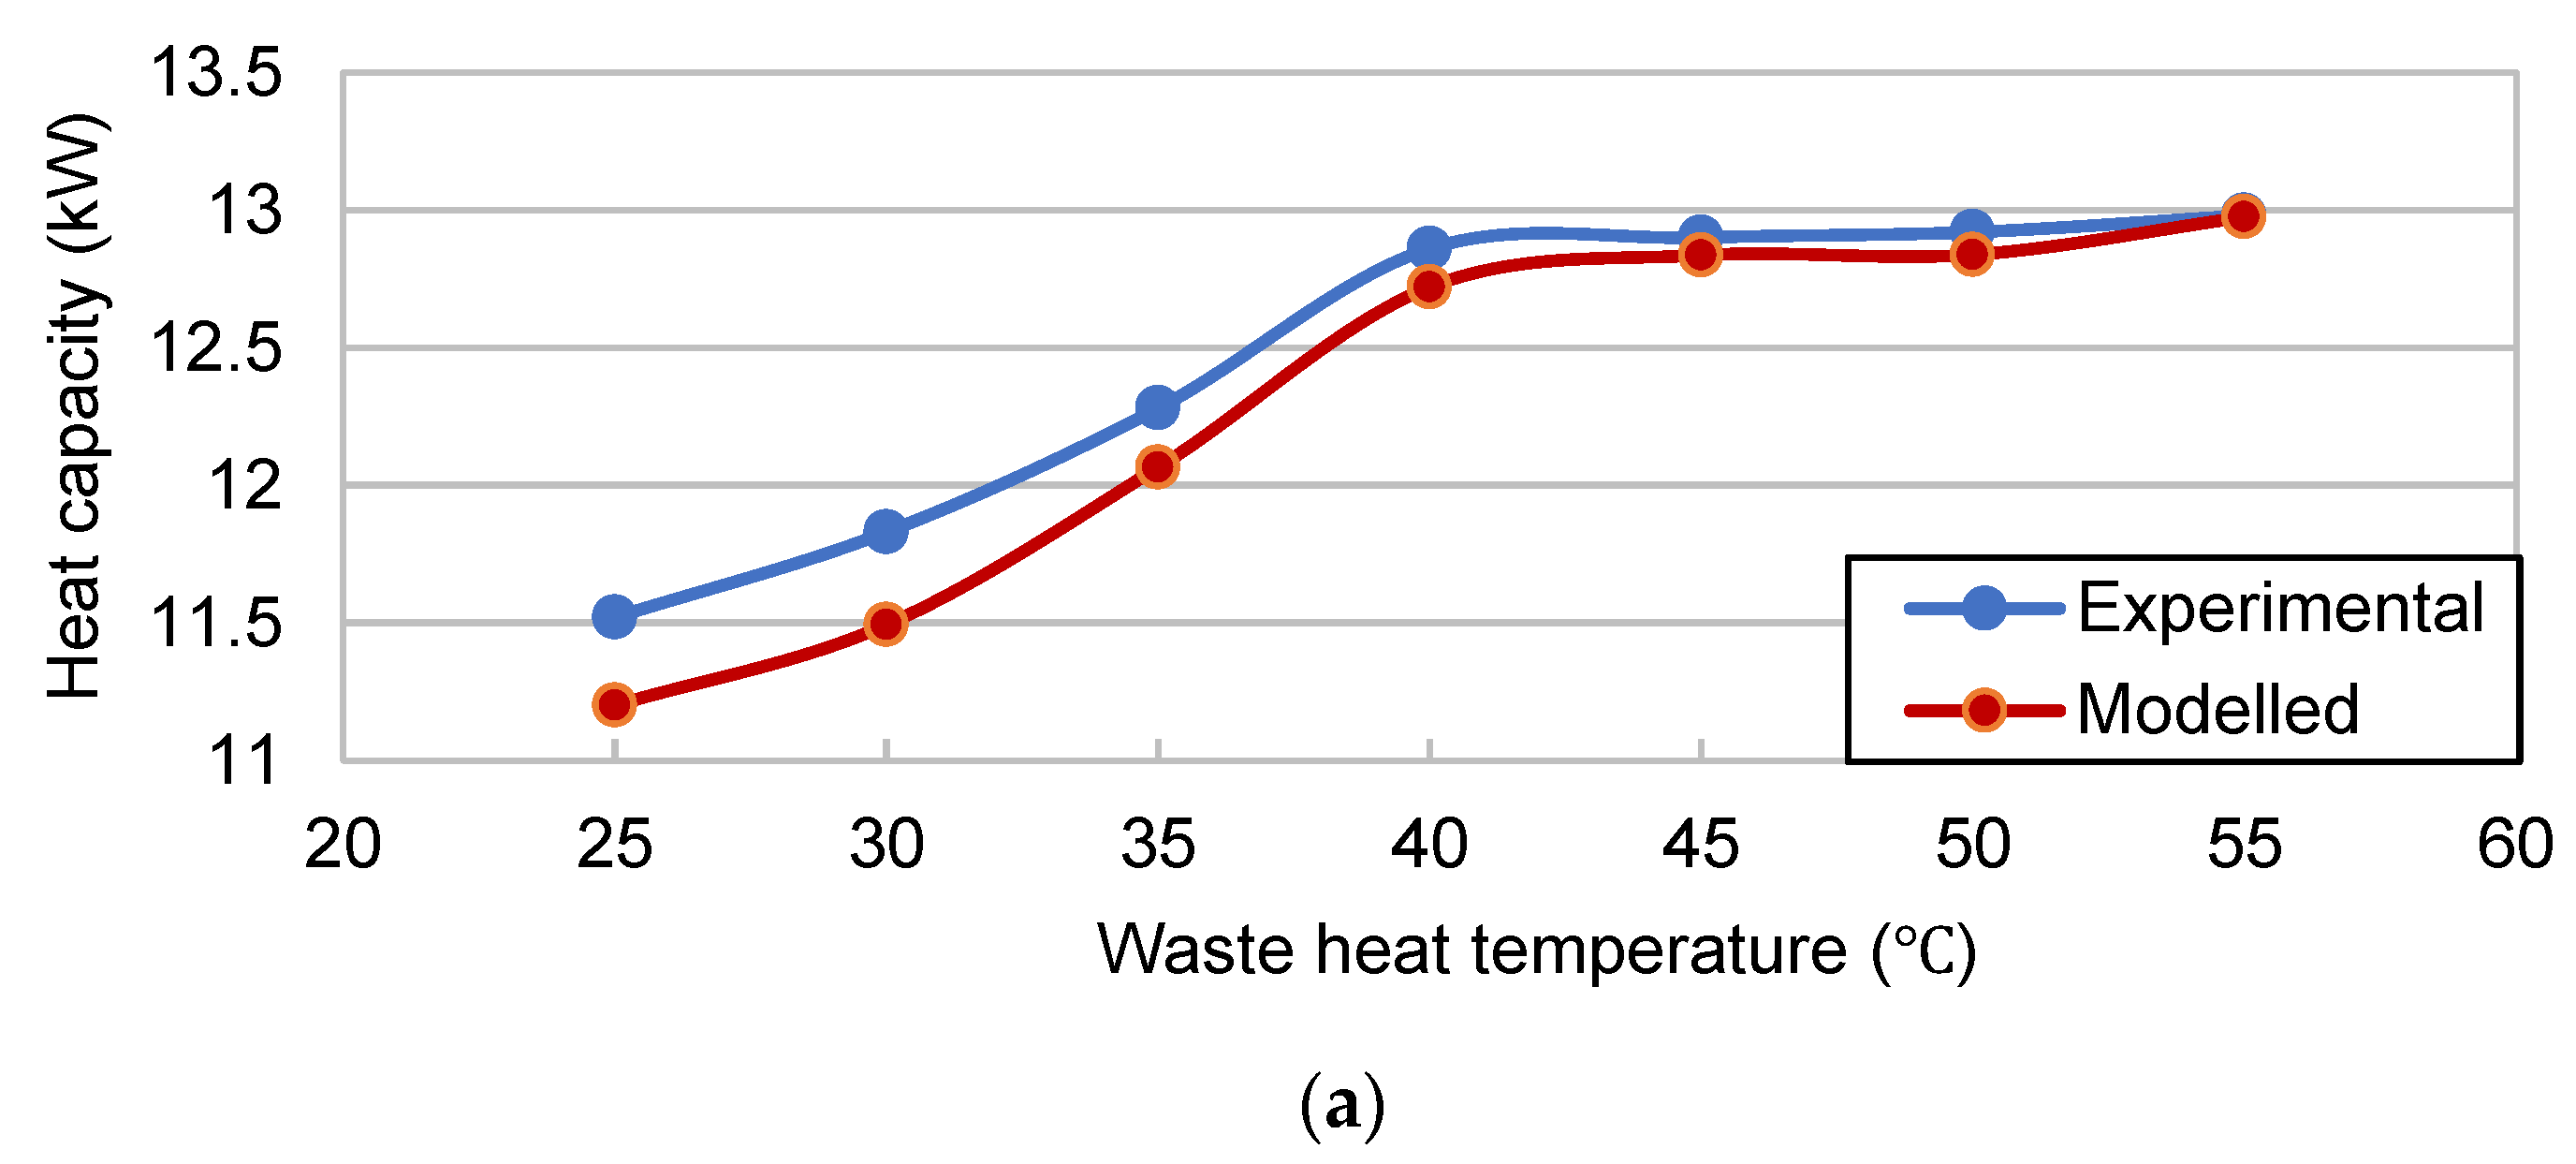
As shown
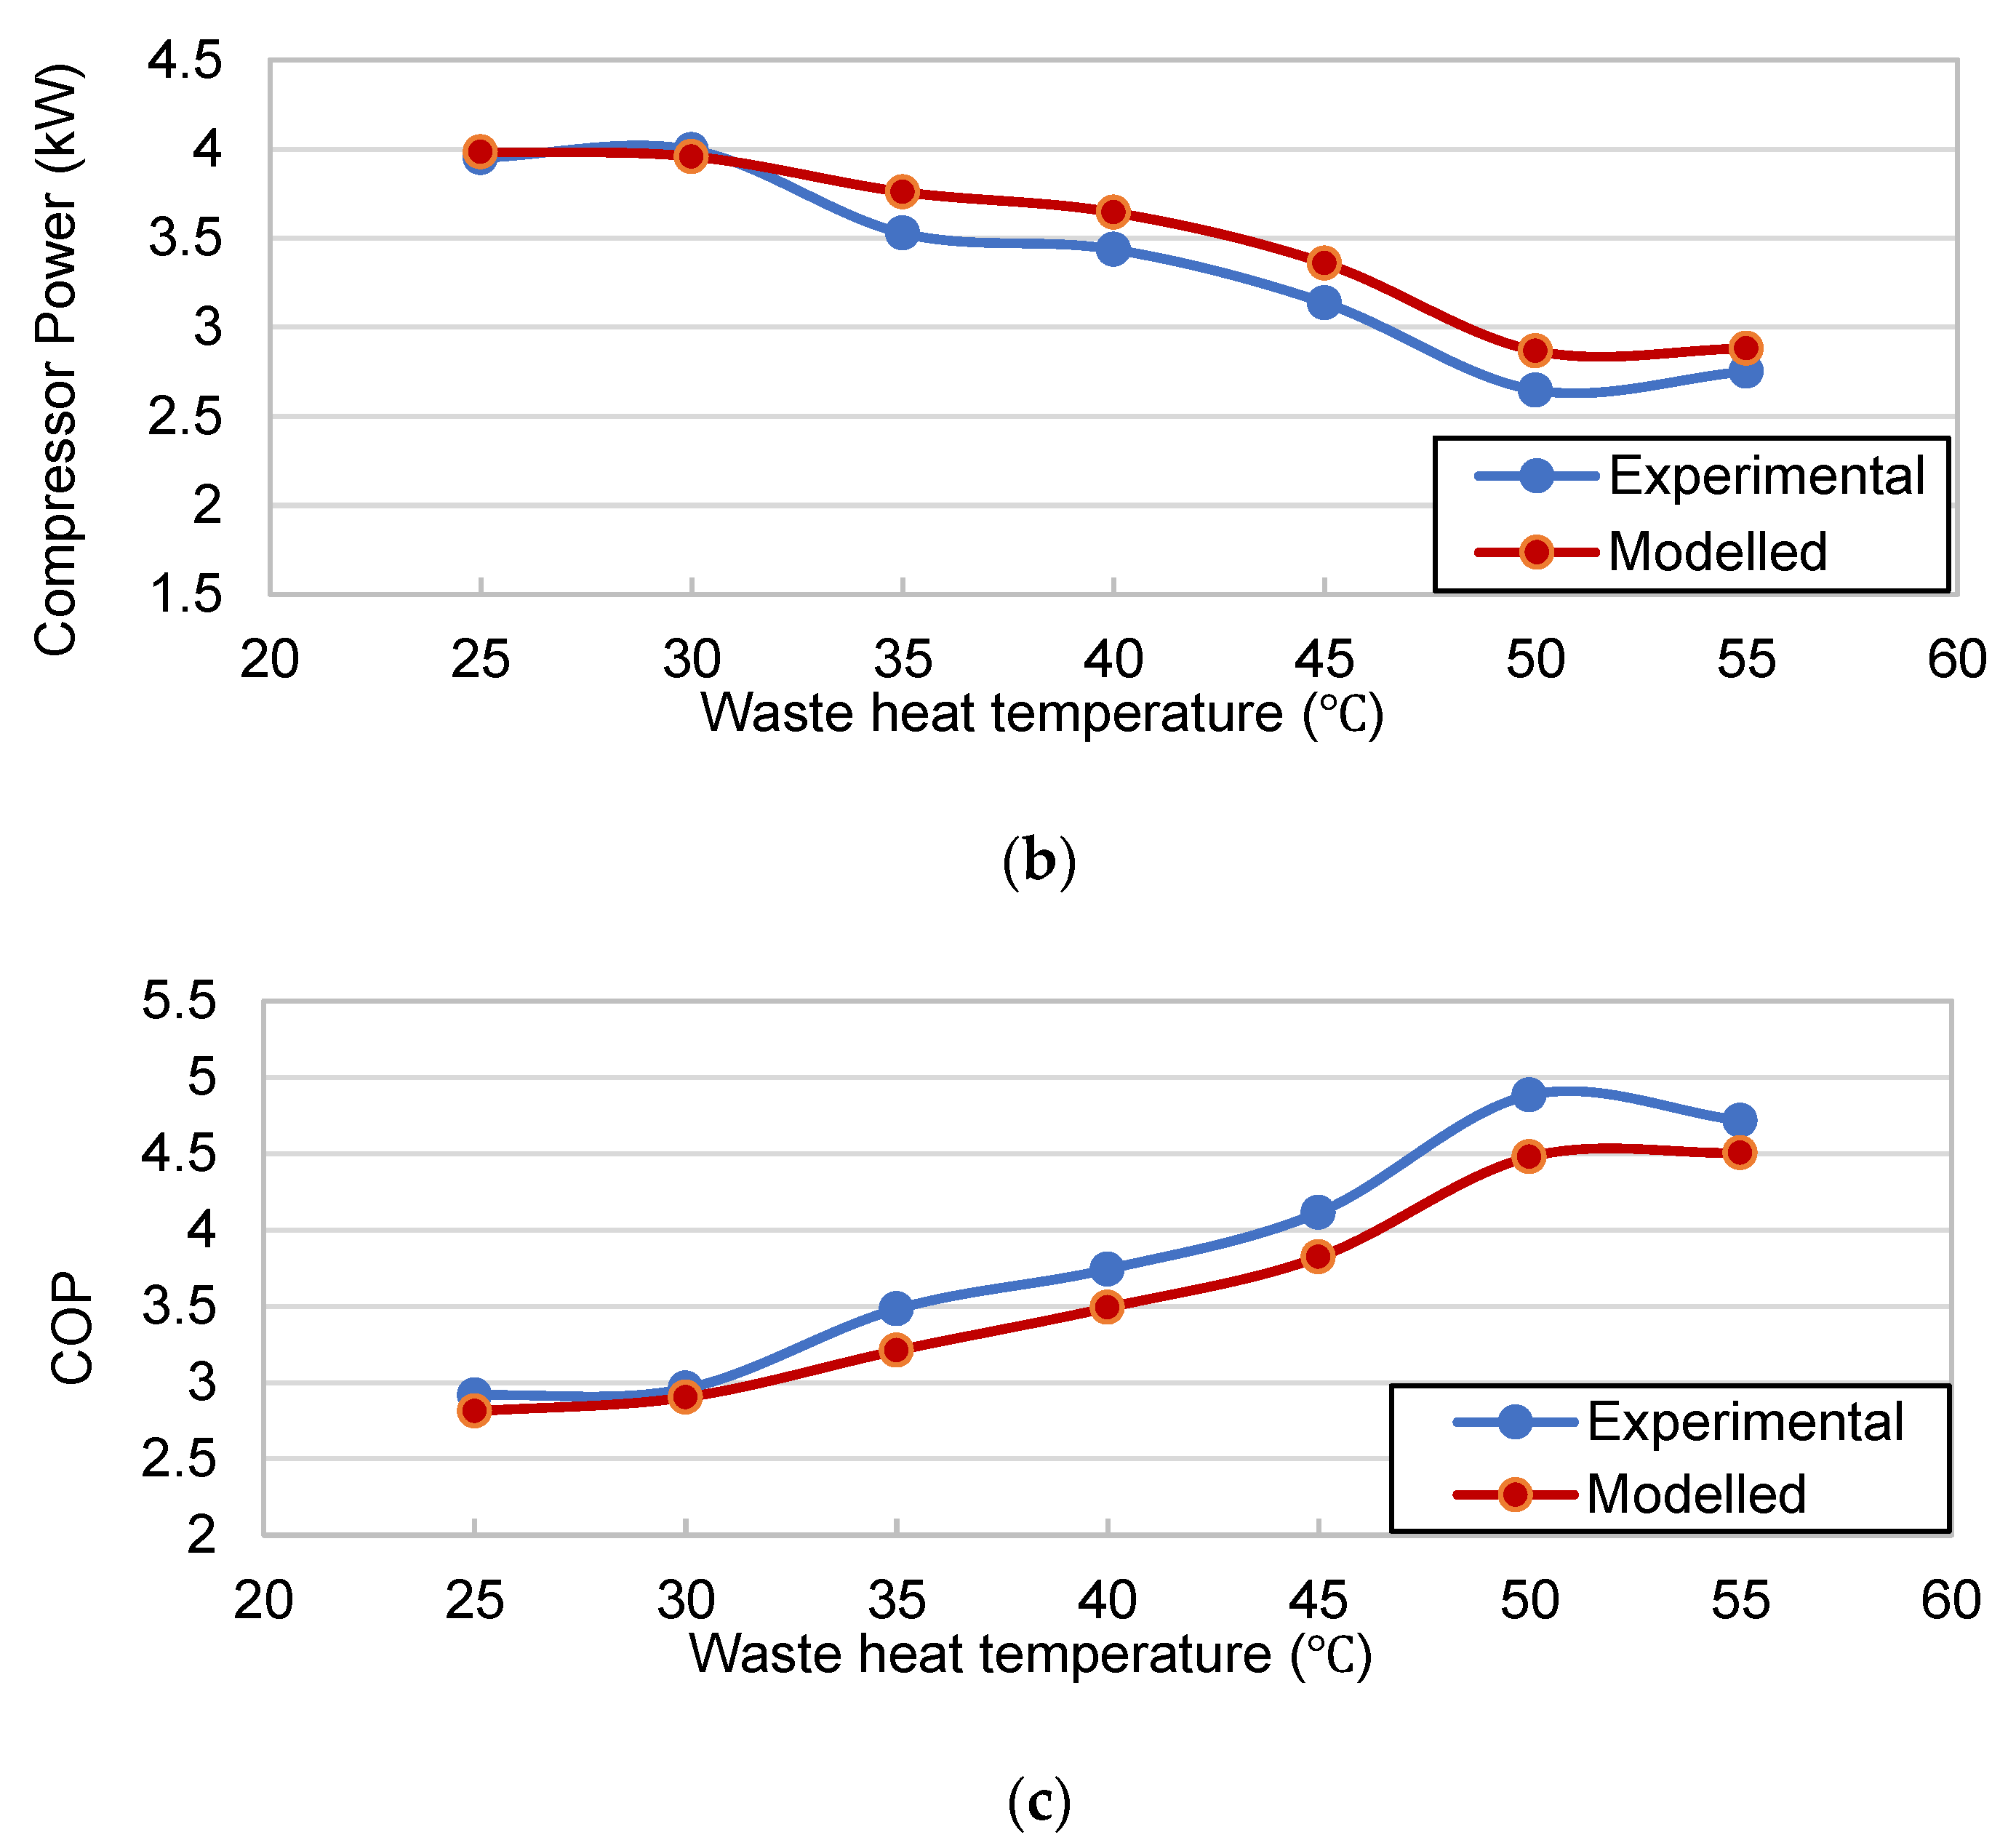
Figure 10, during the gradual increase in waste heat temperature, the heating capacity of the system rose first and then flattened after 40 °C. When the temperature of the waste heat decreases, the heat transfer on the evaporator side decreases. Because the heat transfer on the evaporator side is constrained by the flow and density of waste heat and the waste heat enthalpy value at the evaporator inlet and outlet, when the air volume is fixed, the density of the waste heat changes less with temperature, and the enthalpy value decreases with decreasing temperatures, resulting in a decrease in heat absorption on the evaporator side at low temperatures. This is also the reason that the heat produced by the ASHPWH system decreases when the ambient temperature is low. At the same time, the system superheat decreases when the temperature is low, resulting in increased compressor power consumption.
The heating capacity and the compressor power consumption showed an opposite trend, and the curve of the simulated and experimental COP values reached a maximum value at 50 °C, with a maximum deviation of 8.28%. Good agreement was found between the experimental and simulated results in terms of energy transfer in the system.
4.2. The Effect of Waste Heat Air Volume
The effect of varying the waste heat air volume from 3500 m3/h to 6500 m3/h on the heat pump system was investigated to determine the optimum discharge rate and achieve the best heating performance. The waste heat temperature was set at 50 °C, and the cooling water inlet and outlet temperatures were 18 °C and 55 °C, respectively.
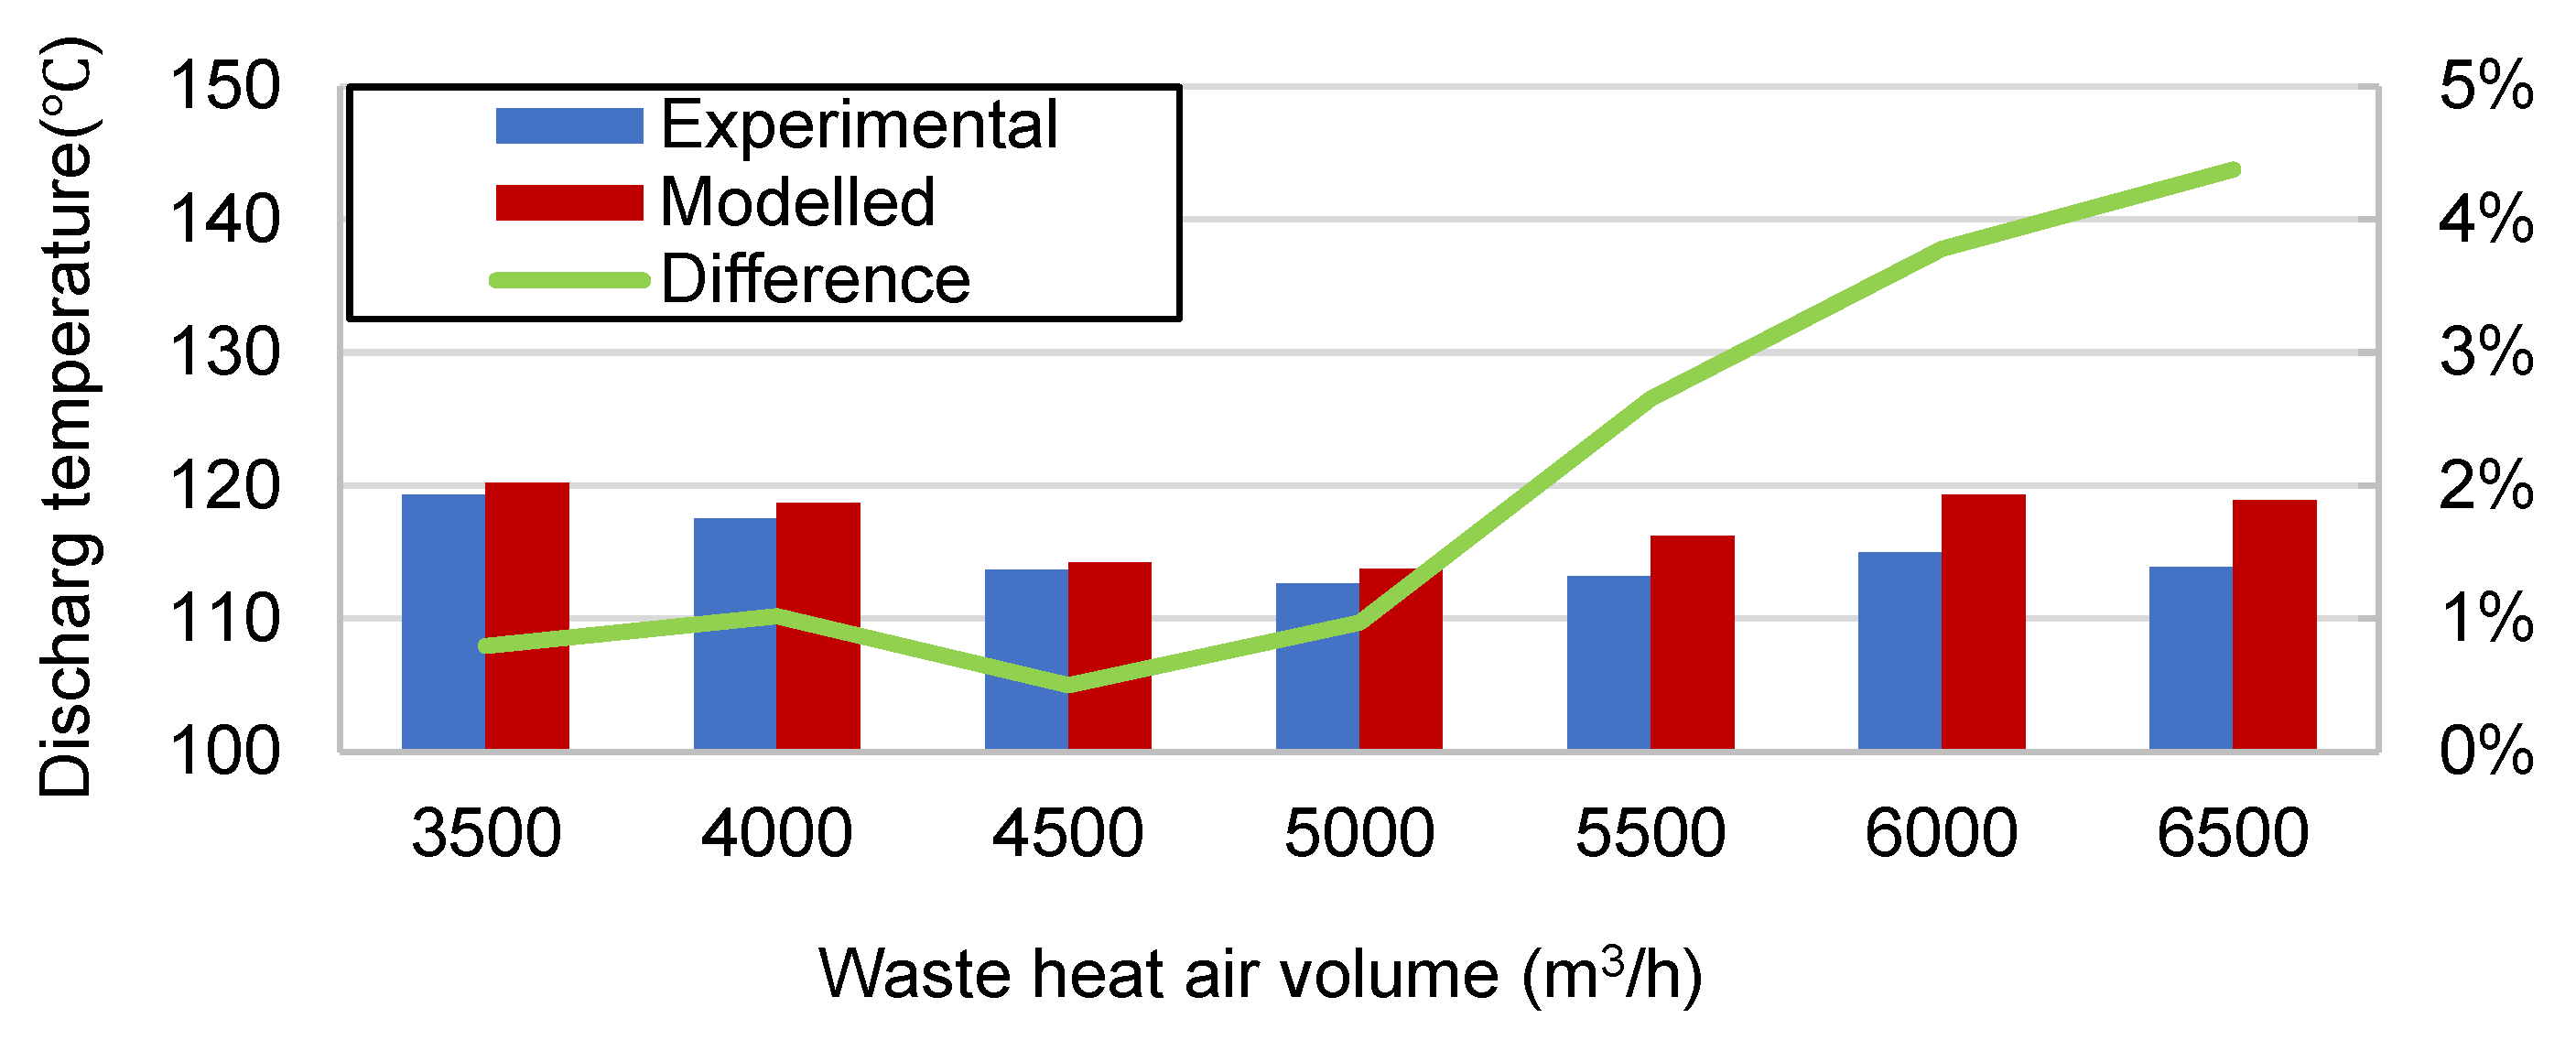
Figure 11 shows the variation in compressor discharge temperature with different waste heat air volumes. Temperature differences lower than 4.37% were found when comparing the model and experimental values. The compressor discharge temperature first decreased and then increased, reaching a minimum value of 5000 m
3/h.
As the volume of waste air increased, both the heating capacity (
Figure 12a) and compressor power consumption (
Figure 12b) increased. When the air volume gradually increases, the heat transfer coefficient on the evaporator side increases, and the heat transfer effect is enhanced. In the process of a continuous increase in air volume, the length of the overheated zone increases, while the length of the two-phase zone decreases, which promotes the evaporation of most liquid refrigerant in the overheated zone. Although the heat transfer coefficient of the evaporator side increases, the heat transfer basically remains unchanged.
At the same time, the increase in air volume leads to a decrease in evaporation pressure; however, the condensation pressure is basically unchanged. As a result, the suction pressure decreases, and the discharge pressure is essentially stable due to the constant condensing temperature, which leads to an increase in the pressure ratio and compressor power consumption.
After the waste heat air volume reached 5000 m
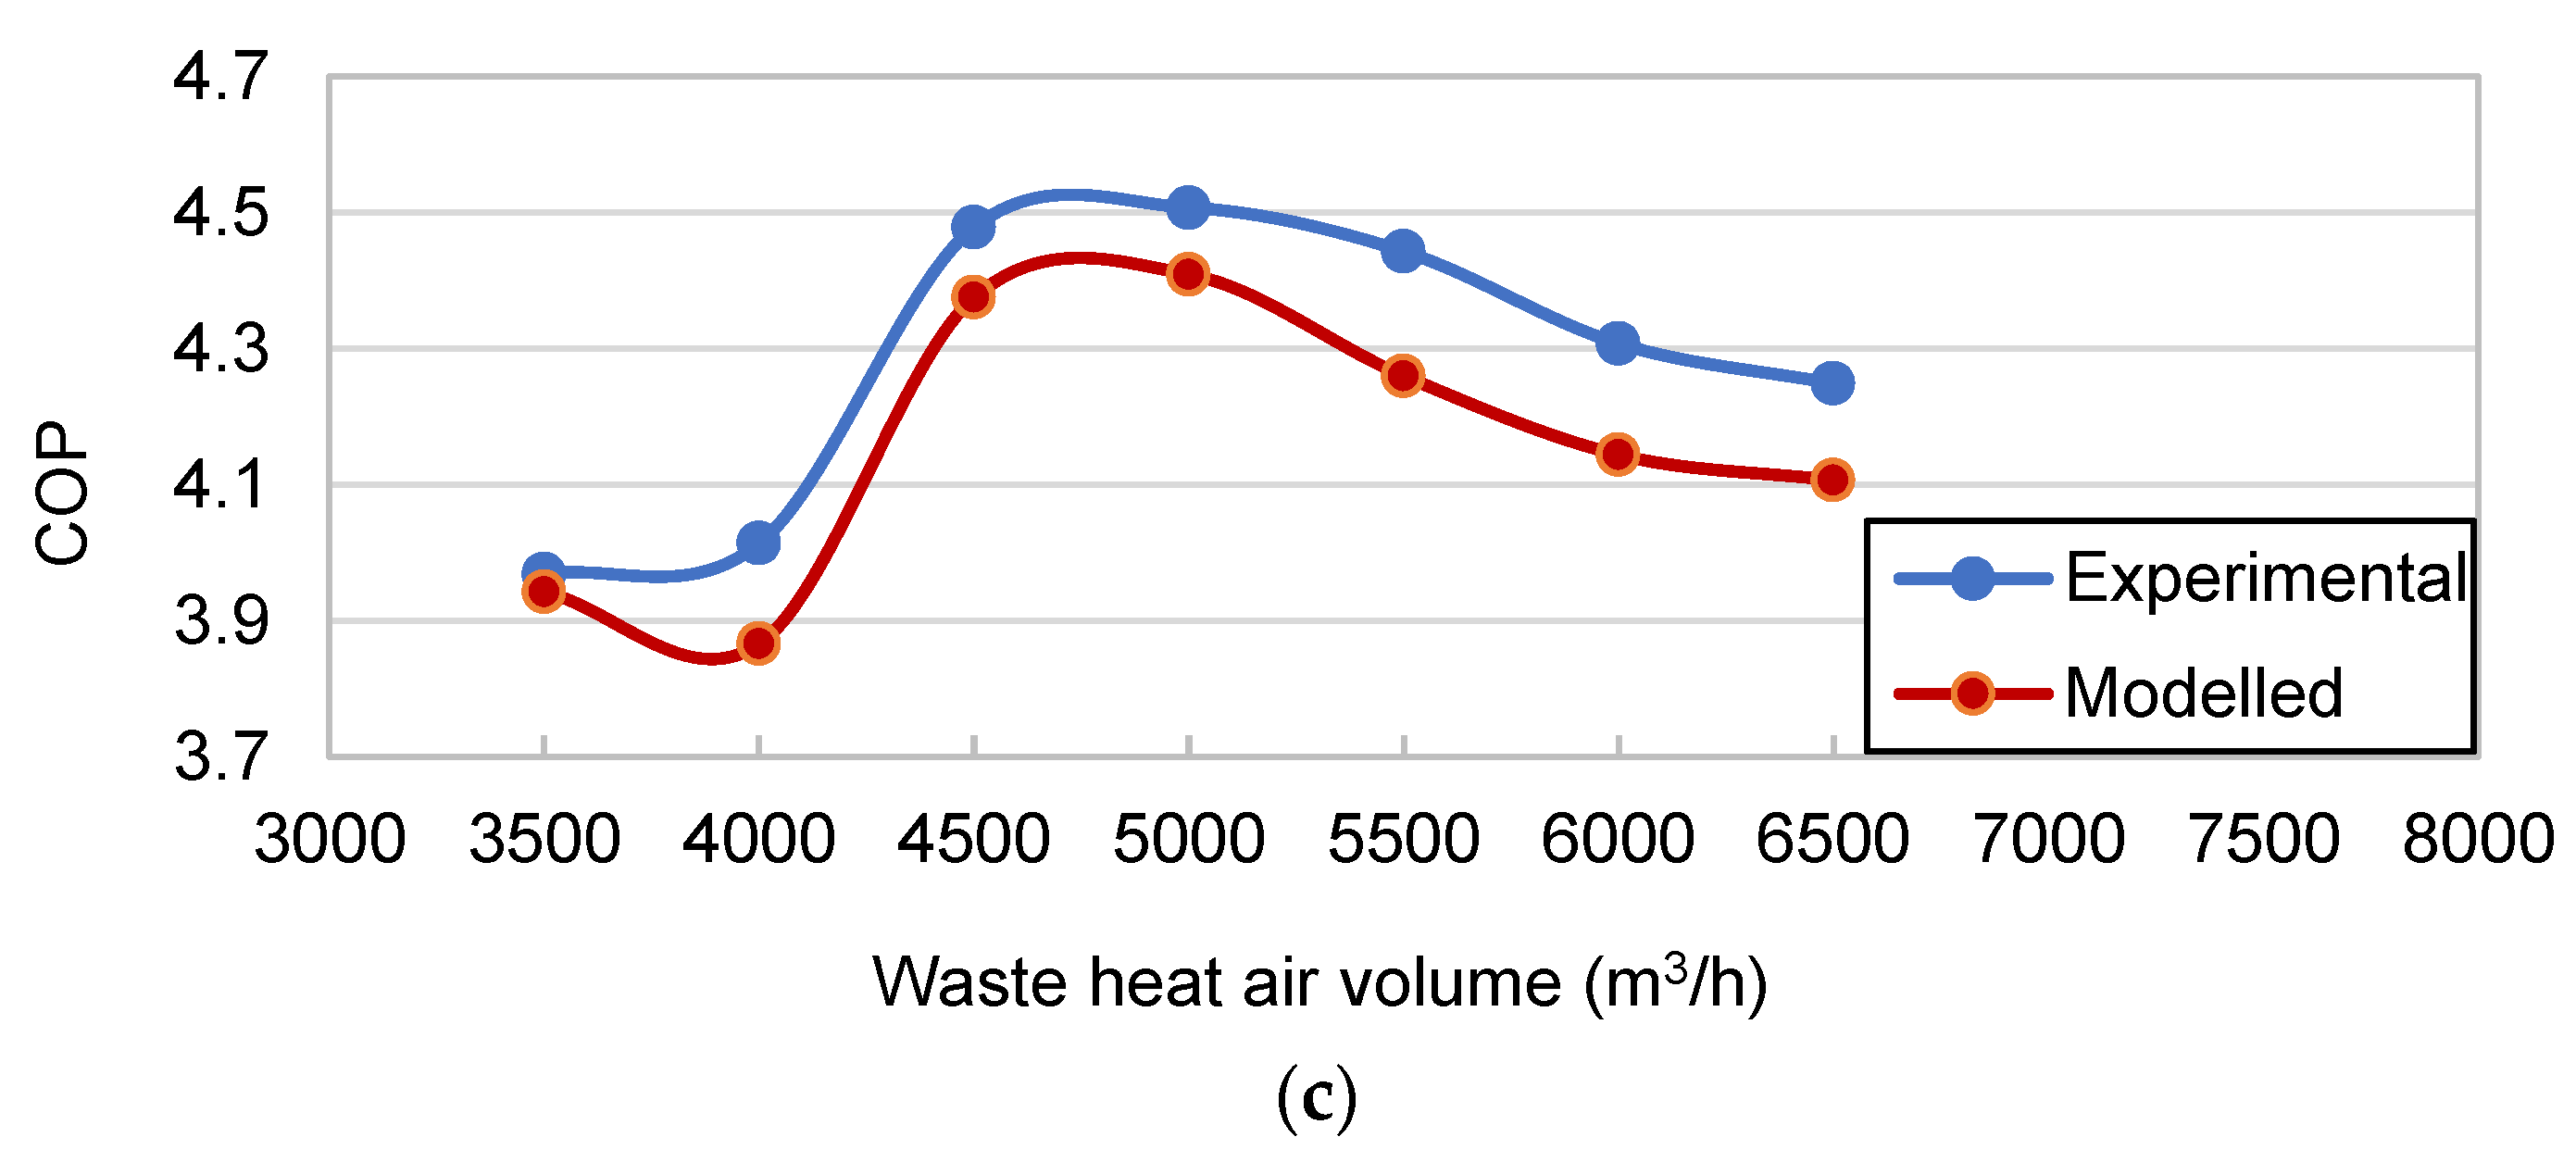
3/h, the increasing extent of compressor power consumption was more obvious than that of the heating capacity, and the system COP began to fall. As shown in
Figure 12c, the COP rose more rapidly from 4000 m
3/h onwards and reached a maximum of 4.14 and 4.50 at 5000 m
3/h for the simulated and experimental values, respectively. The deviation of the simulated COP values from the experimental values was within 4.12%.
Combining the findings presented in
Section 4.1 and
Section 4.2, from the point of view of waste heat temperature and air volume control, the heat pump system has the best heating performance when the waste heat temperature is around 50 °C and the air volume is between 4500 and 5000 m
3/h.
4.3. The Effect of Cooling Water Temperature
The main changes in condenser-side working conditions are cooling water temperature and flow rate. First, the simulation was used to characterize the performance of the system with a cooling water inlet temperature ranging from 5 °C to 35 °C and an outlet temperature of 55 °C.
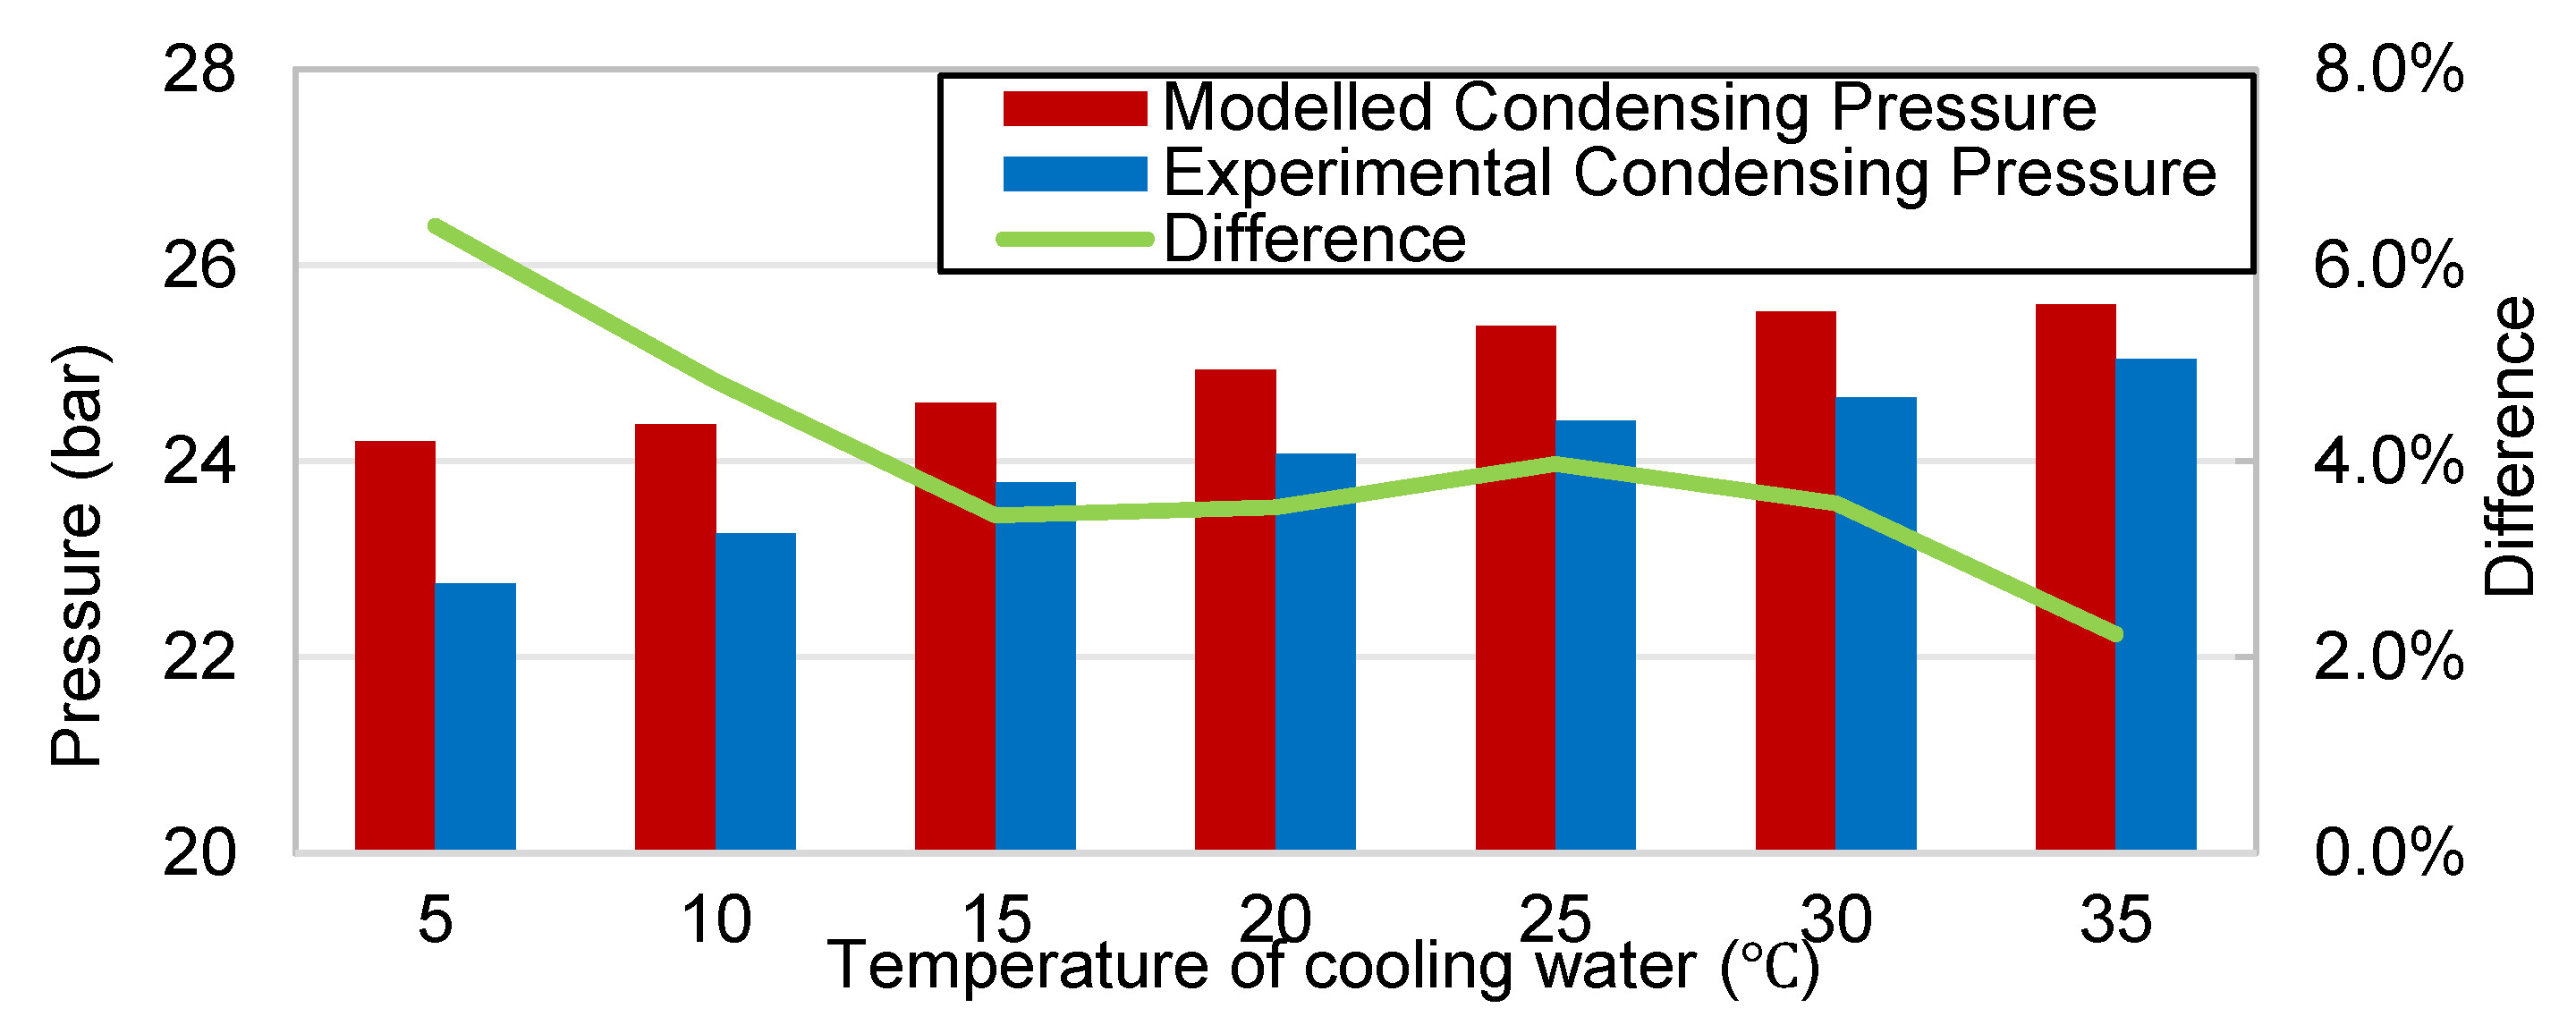
The condensing pressure gradually increased as the cooling water inlet temperature increased, as shown in
Figure 13. Pressure differences lower than 6.40% were found when comparing the model and experimental values. The deviation values were greater when the cooling water temperature was below 10 °C. This is because the model does not consider the heat exchange between the cooling water and the experimental environment.
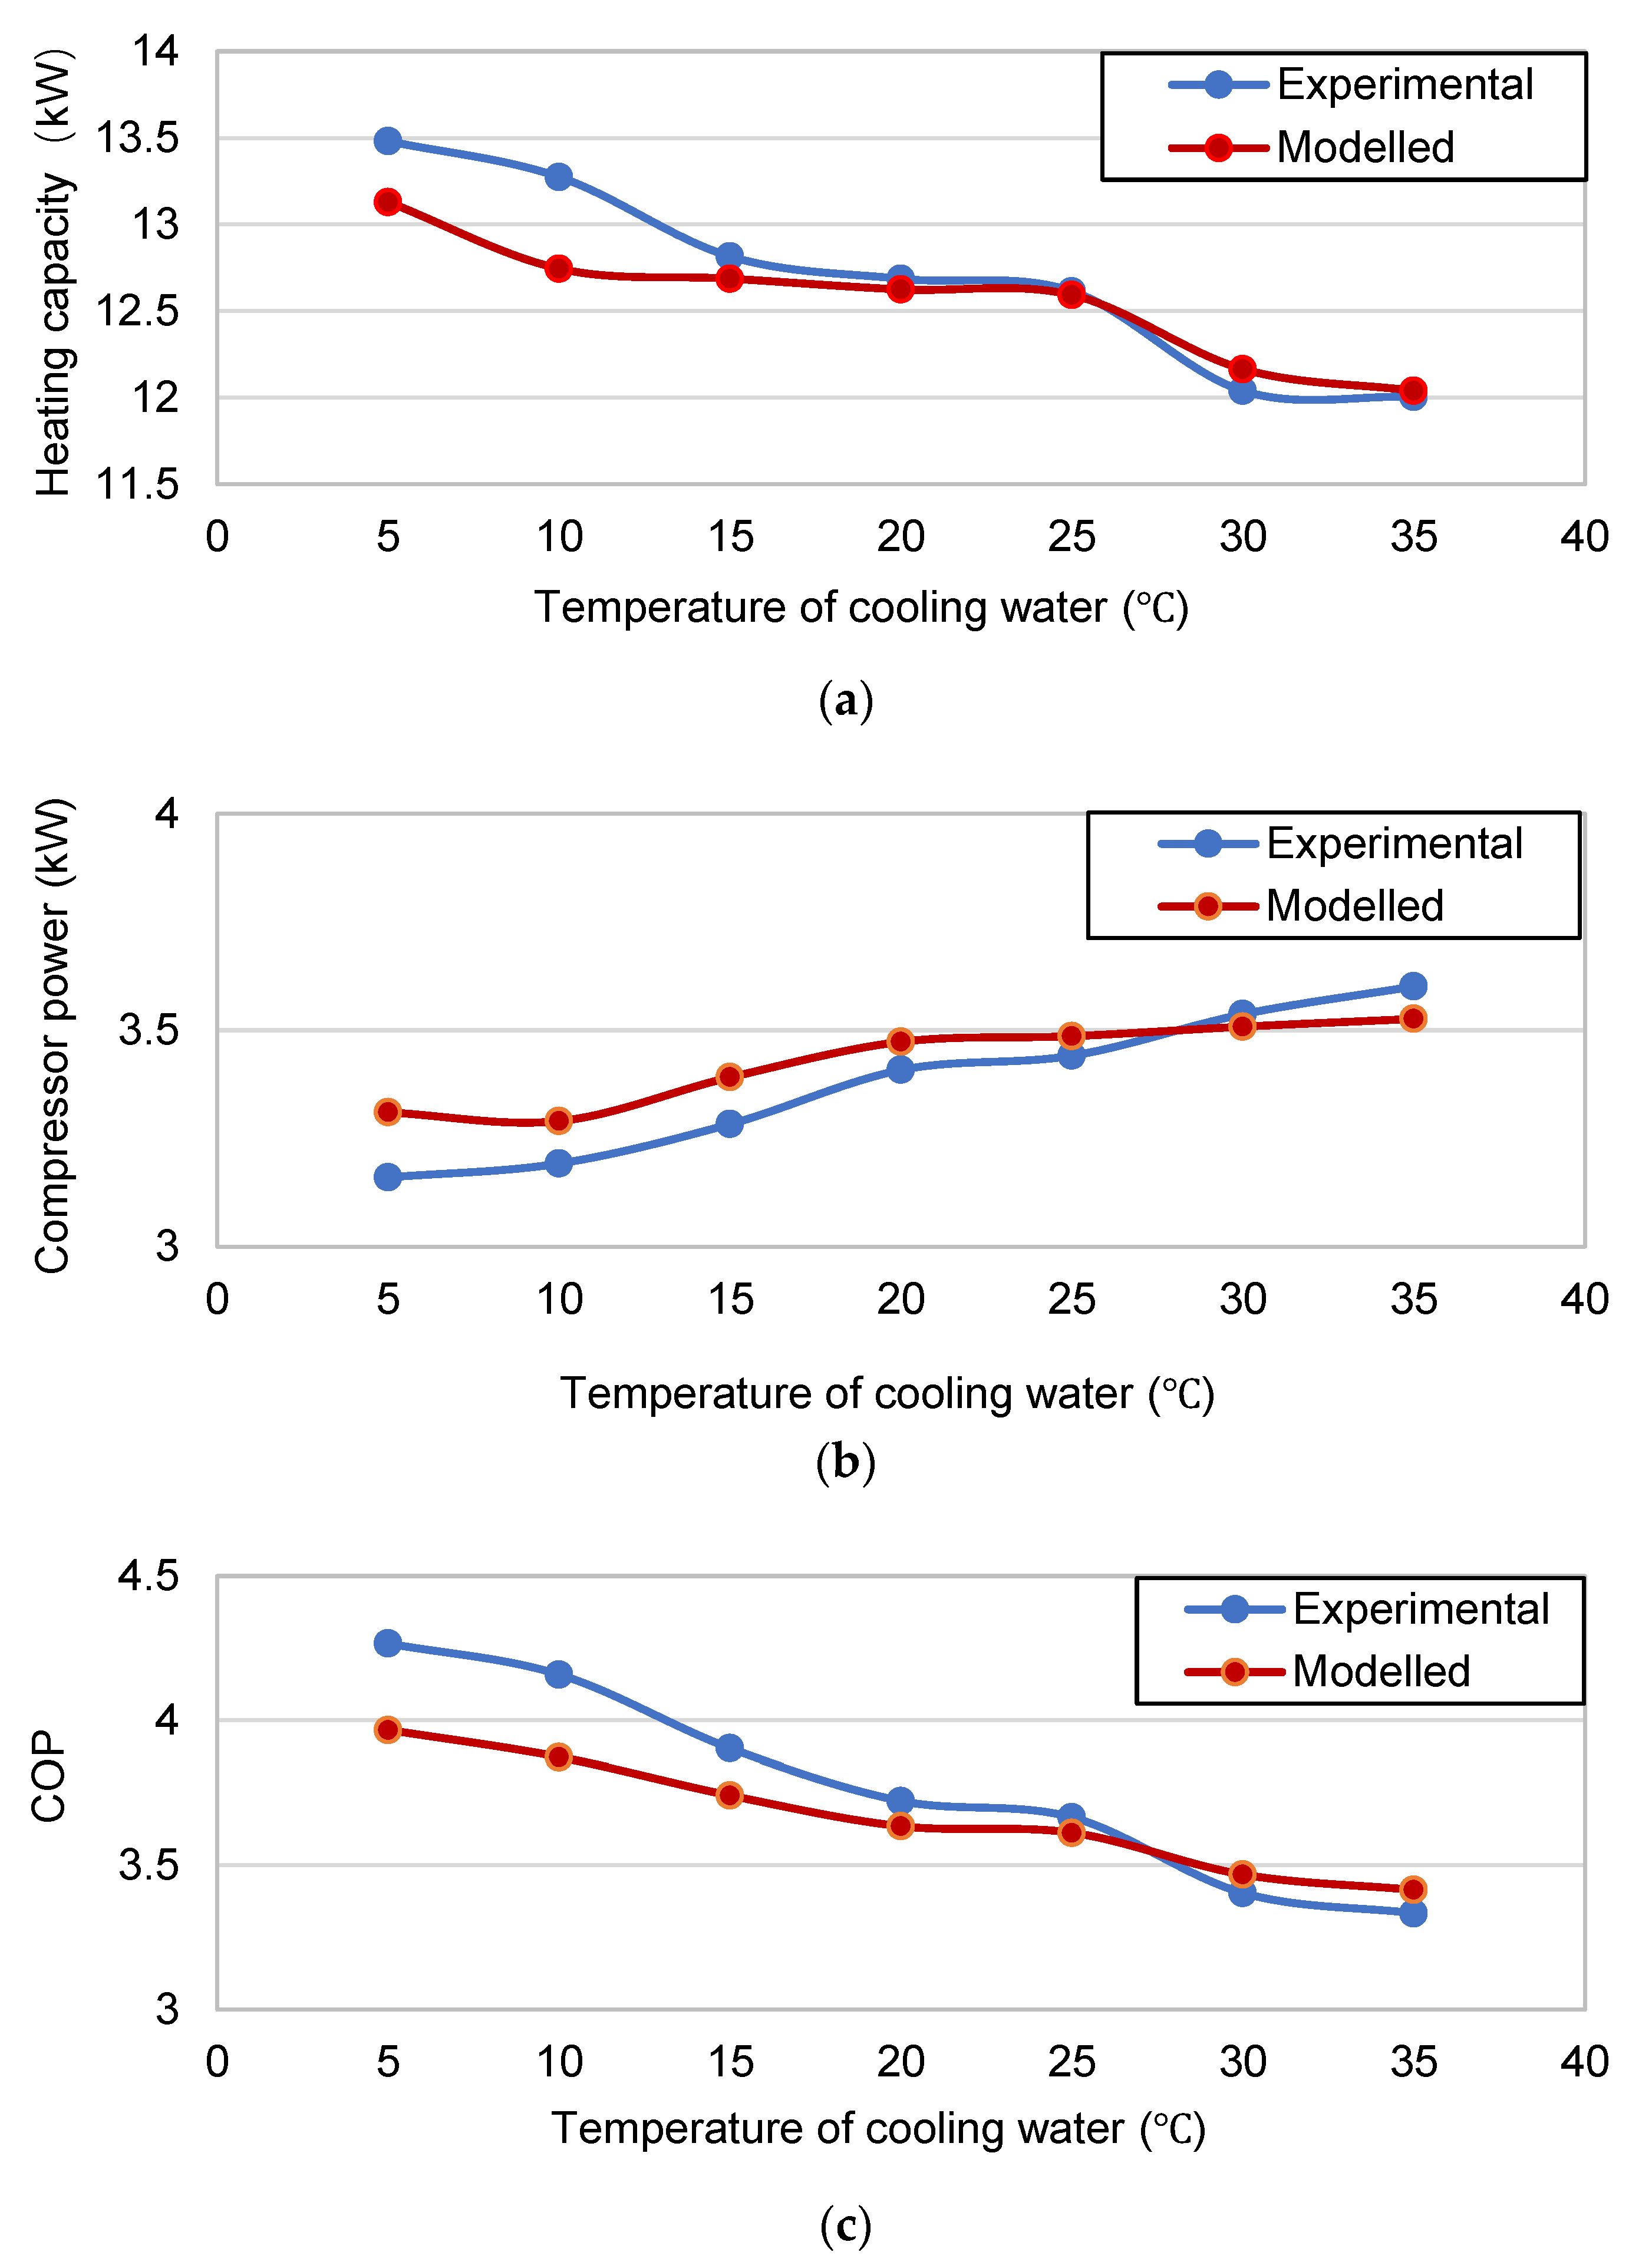
The heat exchange between the refrigerant and cooling water decreased when the cooling water inlet temperature was increased, as shown in
Figure 14a. This is because the increase in inlet temperature causes the refrigerant to change from a supercooled or saturated liquid to a gas–liquid mixing state, resulting in insufficient convective heat transfer in the two-phase region. The heating capacity dropped obviously after 25 °C; thus, the water temperature should not exceed 25 °C.
Meanwhile, the evaporation pressure was basically constant under this condition because the parameters on the evaporator side changed only slightly. The constant evaporation pressure and the increase in condensation pressure led to an increase in the compressor pressure ratio, which leads to an increase in compressor power consumption (
Figure 14b). The COP of the system showed a downward trend, as shown in
Figure 14c. The variation in COP in the simulated system was consistent with the experimental value, and the deviation was within 7.02%.
4.4. The Effect of Cooling Water Flow Rate
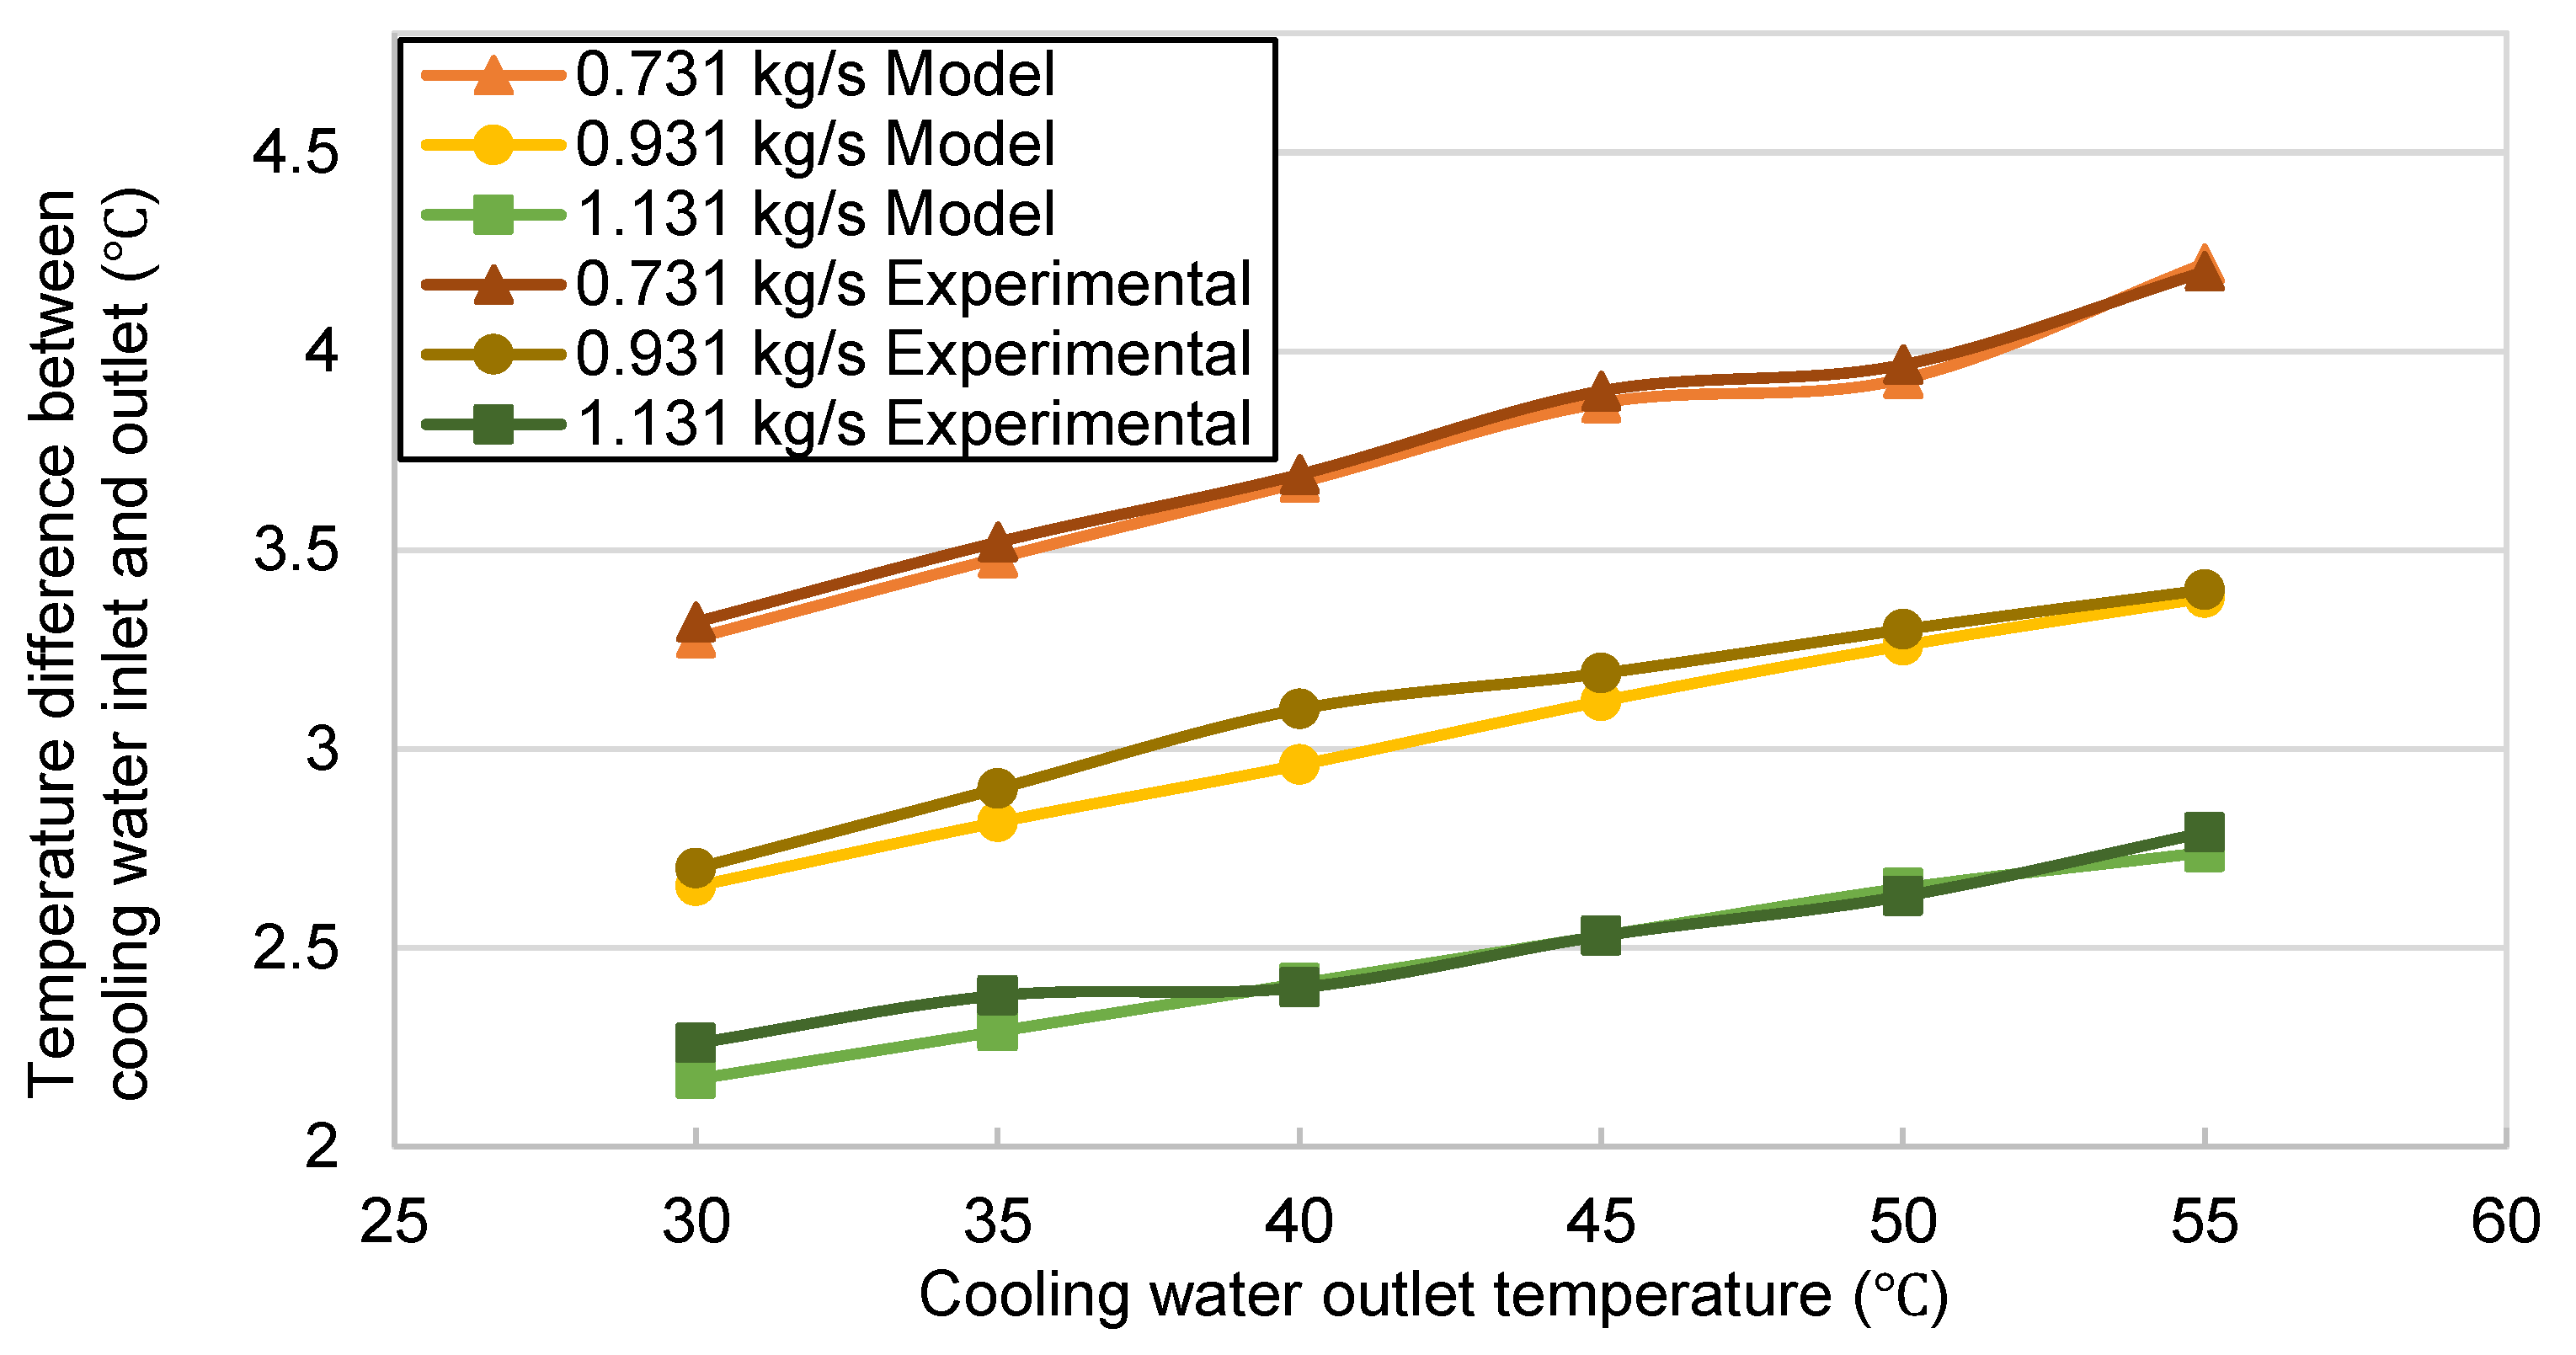
Finally, the influence of cooling water flow rate on system performance was studied. The three different water flow rates were 0.731 kg/s, 0.931 kg/s, and 1.131 kg/s. The set working conditions were an inlet water temperature of 20 °C, an outlet water temperature of 55 °C, an air temperature of 50 °C, and an air flow rate of 5000 m3/h.
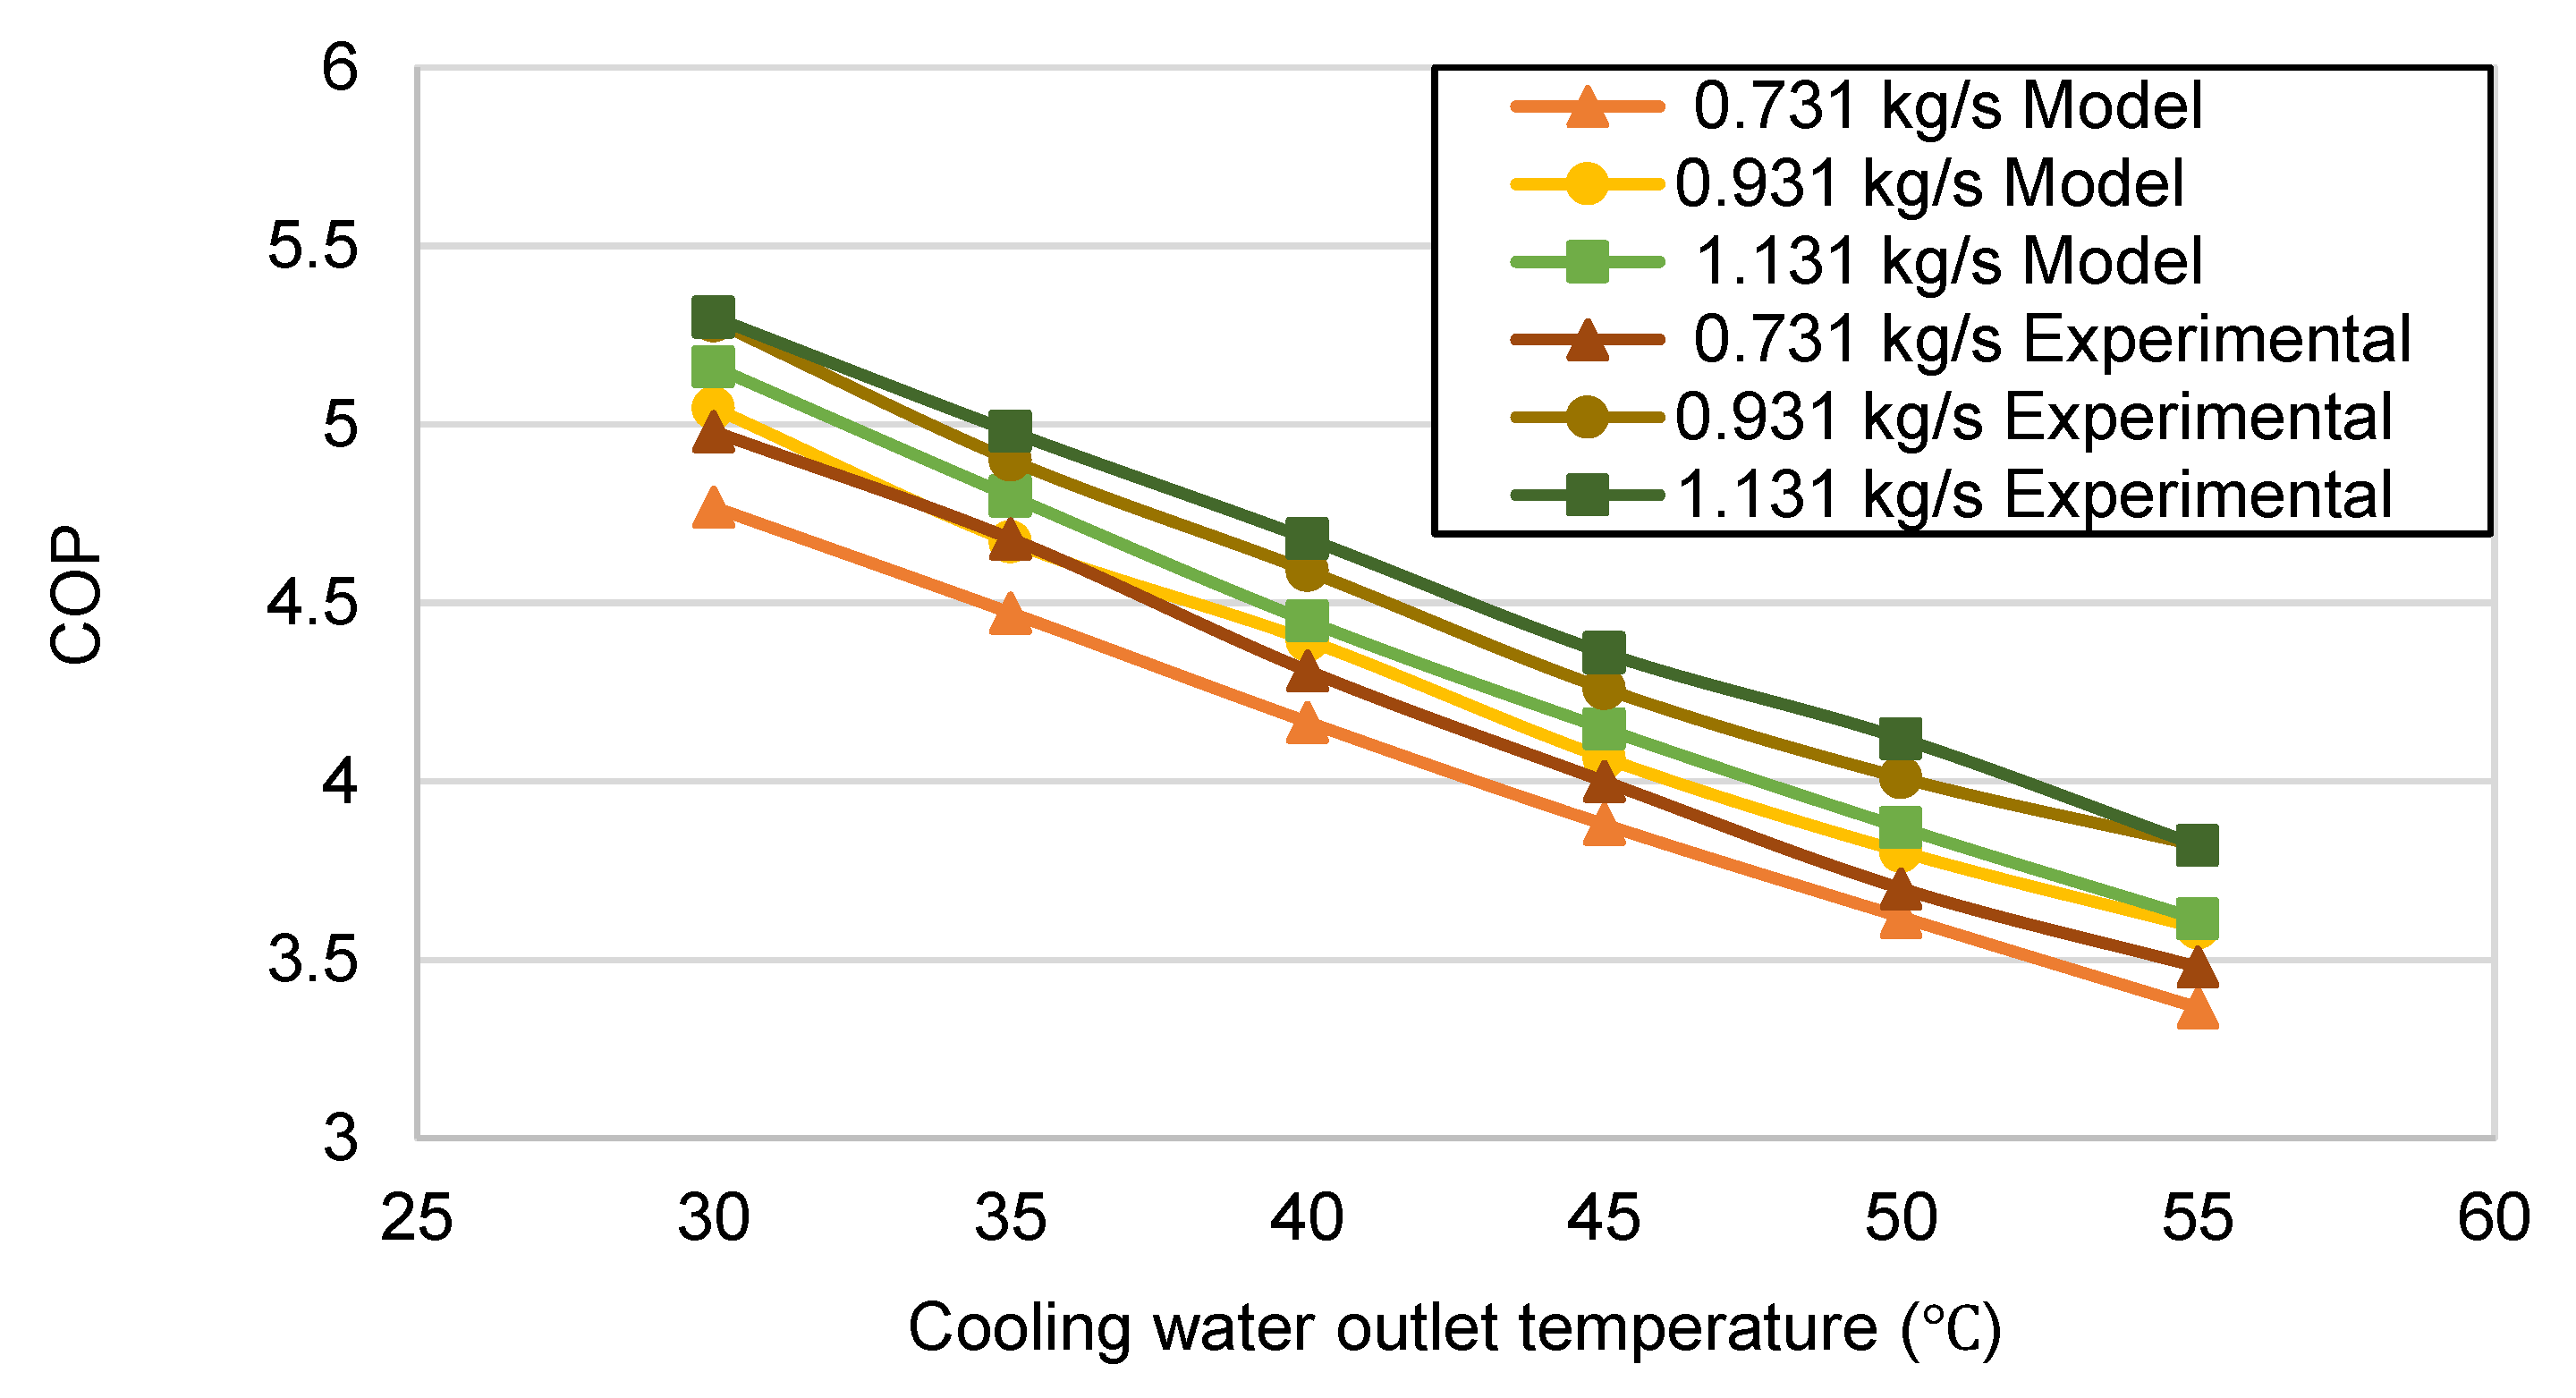
Figure 15 shows the variation in temperature difference between the inlet and outlet of the cooling water in the three flow cases. The temperature difference was reduced as the circulating water flow increased because when the flow rate is higher, the increase in the heat transfer coefficient is smaller, resulting in a lower heat transfer effect. This finding indicates that water flow should be controlled within a certain range. This is reflected by the increment in COP shown in
Figure 16. The average COP of the simulated system increased by 6.65% as the circulating water flow rate was increased from 0.731 kg/s to 0.931 kg/s, while the increase of 0.68% from 0.931 kg/s to 1.131 kg/s was not obvious. This suggests that water flow should be controlled at 0.931 kg/s and is consistent with the trend of the experimental results; in addition, the average COP difference of the system under the three flows was only 4.29%, which further demonstrates the effectiveness of the model.
Based on the combined findings presented in
Section 4.3 and
Section 4.4 related to the control of the initial cooling water temperature and flow rate, the cooling water temperature should be lower than 25 °C, and the flow rate should be controlled at 0.931 kg/s to achieve the best heating performance.
5. Conclusions and Discussion
In this study, a semiempirical parametric model was proposed for a waste heat air-source heat pump water heater (WH-ASHPWH) system. Compared to mathematical models, our semiempirical parametric model does not require a complex mathematical modeling process and can take into account all components and their attributes, such as the pressure drop of connecting pipes. In addition, due to its parameterization characteristics, the model has better adaptability to inaccurateness and changes in system parameters. The veracity and validity of the model were confirmed by a case study. The conclusions are as follows:
- (1)
A discrete model of a tube-in-tube condenser based on a two-phase flow pipe was established. Discretization with 5 and 10 elements was compared with a model without any discretization by assessing simulation quality and CPU time. It was found that for this exchanger, discretization with five elements was a good modeling choice. After experimental calibration, the simulated heating capacity had a small deviation of 3.67%.
- (2)
The maximum deviation in COP was 8.28%. Analysis of the COP and heating data shows that the simulation results are in good agreement with the experimental data. In addition, due to the flexibility of the model with respect to adjusting parameters, it is very convenient to change the system working conditions or make component changes to assess the system’s running status and performance. The simulated running cycle is less than 8 min. It was shown that the model established in this study is reliable and efficient.
- (3)
The effectiveness of the model was shown using an experimental case, and the optimal operating range of the case system was determined. The case system had the best heating performance when the waste heat temperature was around 50 °C and the air volume was between 4500 and 5000 m3/h. The cooling water temperature should be lower than 25 °C, and the flow rate should be controlled at 0.931 kg/s.
The results of simulation under different operation conditions indicate that the model can reflect the heating performance of the WH-ASHPWH system to provide reliable guidance for efficient operation. However, some limitations still exist, and improvements can be made in future research. First, the effect of the influence of the indoor thermal environment on heat transfer in the system was not considered in this paper. The focus of this work was to validate whether the proposed parameterized model was feasible and effective for a complex WH-ASHPWH system based on simulation investigation; thus, different indoor temperatures were set as a disturbance or boundary condition. This is why the deviation from the actual value was large when the temperature of the waste hot air or the air volume was low. Secondly, the discrete condenser model proposed in this paper is only valid for tube-in-tube condensers. It can reflect the heat exchange between refrigerant and cooling water well but with simple discrete elements. There are many kinds and structures of heat exchangers used in air-source heat pump systems; thus, a general parametric model should be developed that is suitable for each type of system.
Author Contributions
Conceptualization, Y.Z.; modeling, Y.Z.; validation, Y.Z.; writing—original draft preparation, Y.Z.; writing—review and editing, B.P. and B.Z. All authors have read and agreed to the published version of the manuscript.
Funding
This research was funded by the National Natural Science Foundation of China (Grant No. 51675254, 51966009), the National Key Research and Development Program of China (Grant No. SQ2020YFF0420989), the Talent Innovation and Entrepreneurship Program of Lanzhou (Grant No. 2020-RC-23), and the Science and Technology Program of Gansu Province (Grant No. 20YF8GA057).
Data Availability Statement
Not applicable.
Conflicts of Interest
The authors declare no conflict of interest.
Abbreviations
| ASHP | Air-source heat pump |
| WH-ASHPWH | Waste heat air-source heat pump water heater |
| COP | Coefficient of performance |
| WHR | Waste heat recovery |
| CHP | Compound heat pump |
| NSGA-II | Non-dominated Sorting Genetic Algorithm-II |
| ηv | Volumetric efficiency |
| N | Rotary speed (r/min) |
| tau | Pressure ratio |
| ηmech | Mechanical efficiency |
| dm2 | Mass flow rate (kg/s) |
| hinc | Difference between discharge and suction-specific enthalpy (J/kg) |
| τ3 | Torque (N·m) |
| ηis | Isentropic efficiency |
| hdis | Isentropic discharge enthalpy (J/kg) |
| hs | Suction-specific enthalpy (J/kg) |
| hd | Discharge-specific enthalpy (J/kg) |
| ρsuc | Suction density (kg/m3) |
| disp | Compressor displacement (m3) |
| VDI | Verein Deutscher Ingenieure |
References
- Hou, B.B.; Zhang, Z.G.; Zhang, W. Analysis of Energy Efficiency of Solar Energy/Air Source Compound Heat Pump System under Heating Condition. Appl. Mech. Mater. 2011, 130–134, 1609–1612. [Google Scholar] [CrossRef]
- Cheng, Y.G.; Wu, Y.Q.; Bai, S.R. A Smart Community Waste Heat Recovery System Based on Air Source-Sewage Source Compound Heat Pump. Int. J. Heat Technol. 2021, 39, 503–511. [Google Scholar] [CrossRef]
- Zhou, G.H.; Liu, Y.; Zhang, C.; Chen, S.J. Experimental study on heating performance of a solar assistant air source heat pump. J. Sol. Energy 2011, 32, 1662–1665. [Google Scholar] [CrossRef]
- Han, Z.W.; Li, X.T.; Shi, W.X.; Shi, Y.Z. Simulation Research on Operation Characteristics of Solar Energy Storage and Low Temperature Air Source Heat Pump Compound Air-conditioning System. J. Sol. Energy 2012, 33, 1411–1418. [Google Scholar] [CrossRef]
- Hong, W.P.; Hao, J.; Wang, J.Y.; Teng, D.; Jin, X. Performance analysis of combined cooling heating and power (CCHP) exhaust waste heat coupled air source heat pump system. In Building Simulation; Tsinghua University Press: Beijing, China, 2019; Volume 12, pp. 563–571. [Google Scholar] [CrossRef]
- Li, Z.R.; Du, Y.; Pan, Y.Q.; Zhang, F.; Meng, Z.F.; Zhang, Y.N. Experimental Performance Study of Solar-Assisted Enhanced Vapor Injection Air-Source Heat Pump System. Energies 2022, 15, 7730. [Google Scholar] [CrossRef]
- Vering, C.; Wüllhorst, F.; Mehrfeld, P.; Müller, D. Towards an integrated design of heat pump systems: Application of process intensification using two-stage optimization. Energy Convers. Manag. 2021, 250, 114888. [Google Scholar] [CrossRef]
- Safa, A.A.; Fung, A.S.; Kumar, R. Performance of two-stage variable capacity air source heat pump: Field performance results and TRNSYS simulation. Energy Build. 2015, 94, 80–90. [Google Scholar] [CrossRef]
- Bertsch, S.S.; Groll, E.A. Two-stage air-source heat pump for residential heating and cooling applications in northern U.S. climates. Int. J. Refrig. 2008, 31, 1282–1292. [Google Scholar] [CrossRef]
- Xiao, B.; Huang, T.Y.; He, L.; Yan, Y.; Sun, Y.Y.; Wang, W. Experimental study of an improved air-source heat pump system with a novel three-cylinder two-stage variable volume ratio rotary compressor. Int. J. Refrig. 2019, 100, 343–353. [Google Scholar] [CrossRef]
- Jiang, S.; Wang, S.G.; Jin, X.; Yu, Y. Optimum compressor cylinder volume ratio for two-stage compression air source heat pump systems. Int. J. Refrig. 2016, 67, 77–89. [Google Scholar] [CrossRef]
- Sim, J.; Lee, H.; Jeong, J.H. Optimal design of variable-path heat exchanger for energy efficiency improvement of air-source heat pump system. Appl. Energy 2021, 290, 116741. [Google Scholar] [CrossRef]
- Pei, G.; Li, G.Q.; Ji, J. Comparative study of air-source heat pump water heater systems using the instantaneous heating and cyclic heating modes. Appl. Therm. Eng. 2010, 31, 342–347. [Google Scholar] [CrossRef]
- Tangwe, S.L.; Simon, M.; Meyer, E.L. Prediction of coefficient of performance and simulation design of an air source heat pump water heater. J. Eng. Des. Technol. 2017, 15, 378–394. [Google Scholar] [CrossRef]
- Wu, Z.X.; You, S.J.; Zhang, H.; Wang, Y.R.; Jiang, Y.; Liu, Z.K.; Sha, L.; Wei, S. Experimental investigations and multi-objective optimization of an air source absorption heat pump for residential district heating. Energy Convers. Manag. 2021, 240, 114267. [Google Scholar] [CrossRef]
- Wang, W.Y.; Hu, B.; Wang, R.Z.; Luo, M.W.; Zhang, G.P.; Xiang, B. Model predictive control for the performance improvement of air source heat pump heating system via variable water temperature difference. Int. J. Refrig. 2022, 138, 169–179. [Google Scholar] [CrossRef]
- Qiu, G.D.; Wei, X.H.; Xu, Z.F.; Cai, W.H. A novel integrated heating system of solar energy and air source heat pumps and its optimal working condition range in cold regions. Energy Convers. Manag. 2018, 174, 922–931. [Google Scholar] [CrossRef]
- Lei, M.J.; Zhang, H.; Wang, F.; You, X.K. Experimental study of an instantaneous-heating air source heat pump water heater with a temperature stratified water tank. Adv. Mech. Eng. 2016, 8, 1687814016671248. [Google Scholar] [CrossRef]
- Shah, M.M. A general correlation for heat transfer during film condensation inside pipes. Int. J. Heat Mass Transf. 1979, 22, 547–556. [Google Scholar] [CrossRef]
- Steiner, D.; Taborek, J. Flow boiling heat transfer in vertical tubes correlated by an asymptotic model. Heat Transf. Eng. 1992, 13, 43–69. [Google Scholar] [CrossRef]
- Tangwe, S.L.; Simon, M.; Meyer, E.L.; Mwampheli, S.; Makaka, G. Performance optimization of an air source heat pump water heater using mathematical modelling. J. Energy South. Afr. 2015, 26, 86–95. [Google Scholar] [CrossRef]
- Liu, H.; Li, S.H.; Du, M.H.; Tan, J.M. Influence of wrapped-tank mini-channel condenser structure on performance of heat pump water heater. J. Cent. South Univ. 2021, 52, 1854–1864. [Google Scholar]
- Wang, Z.H.; Wang, F.H.; Wang, X.K.; Ma, Z.J.; Wu, X.Z.; Song, M.J. Dynamic character investigation and optimization of a novel air-source heat pump system. Appl. Therm. Eng. 2017, 111, 122–133. [Google Scholar] [CrossRef]
- Ibrahim, O.; Fardoun, F.; Younes, R.; Louahlia-Gualous, H. Air source heat pump water heater: Dynamic modeling, optimal energy management and mini-tubes condensers. Energy 2014, 64, 1102–1116. [Google Scholar] [CrossRef]
- Sun, C.L. Simulation and Experimental Study of R290 Air Energy Heat Pump Water Heater. Master’s Thesis, Nanjing University of Technology, Nanjing, China, 2016. [Google Scholar]
- McAdams, W.H.; Woods, W.K.; Heroman, L.C. Vaporization inside horizontal tubes -II- Benzene-oil mixtures. Trans. ASME 1942, 64, 193–200. [Google Scholar] [CrossRef]
| Disclaimer/Publisher’s Note: The statements, opinions and data contained in all publications are solely those of the individual author(s) and contributor(s) and not of MDPI and/or the editor(s). MDPI and/or the editor(s) disclaim responsibility for any injury to people or property resulting from any ideas, methods, instructions or products referred to in the content. |
© 2023 by the authors. Licensee MDPI, Basel, Switzerland. This article is an open access article distributed under the terms and conditions of the Creative Commons Attribution (CC BY) license (https://creativecommons.org/licenses/by/4.0/).
