Article

In Situ Combustion of Heavy Oil within a Vuggy Carbonate Reservoir: Part I—Feasibility Study

1
In Situ Combustion Research Group (ISCRG), University of Calgary, 2500 University Dr. NW, Calgary, AB T2N 1N4, Canada
2
Center for Hydrocarbon Recovery, Skolkovo Institute of Science and Technology, Sikorsky Street 11, Moscow 121205, Russia
*
Author to whom correspondence should be addressed.
Energies 2023, 16(5), 2233; https://doi.org/10.3390/en16052233
Submission received: 10 January 2023 / Revised: 10 February 2023 / Accepted: 22 February 2023 / Published: 25 February 2023

Abstract

:
Worldwide, the known recoverable heavy oil and bitumen reserves make up more than 64% of the total reserves, of which more than 60% are trapped in carbonates. Air injection has immense potential for hydrocarbon recovery from various reservoirs. While most of the successful air-based techniques are performed within carbonate reservoirs containing light oil, theoretically, in situ combustion (ISC) has also shown great potential for recovering heavy oil and bitumen. Carbonates are complex in terms of geology and are often associated with fractures and vugs that affect the fluid flow, pressure propagation and progression of the ISC reactions. This paper describes the first experiment in which the triple-porosity concept was applied to simulate heterogeneity through artificially induced vugs, core matrix and fractures. This approach was used to study the feasibility of the ISC recovery technique for heavy oil (14° API) within a dolomite reservoir using a combustion tube (CT) in an experiment performed at 1740 psig. The combustion front advanced through 78% of the core length prior to the termination of air injection, producing 80% of the initial oil. To differentiate between the various sources of the CO2 gas (a product of carbonate decomposition vs. the combustion reaction) the atomic ratios of (CO2 + CO)/CO = 6 and (CO2 + CO)/N2 = 0.21 were applied. Additionally, partial upgrading of the produced heavy oil was observed.

1. Introduction

Carbonate formations contain a significant portion of the known heavy oil and bitumen reserves worldwide and are often produced using various recovery techniques, such as hot water flooding, steam-based recovery and polymer, foam and air injections [1,2,3].
Carbonate rocks are challenging to describe due to the inherent petrophysical heterogeneity which they form after the depositional process. Mineral composition, burial and tectonic history, pore space, diagenetic processes and secondary changes, such as the formation of fractures, faults and stylolites, define the complexity of carbonate rocks [4,5,6,7]. The porosity and permeability of carbonate rocks vary from one reservoir to another and often within the same reservoir [8]. A variety of rock textures can be observed, even on the macroscopic level. The extensive study conducted by Lucia [9] highlighted the importance of understanding the rock fabric in order to realistically describe the engineering parameters of permeability and porosity that are further used for geological and fluid flow modelling.
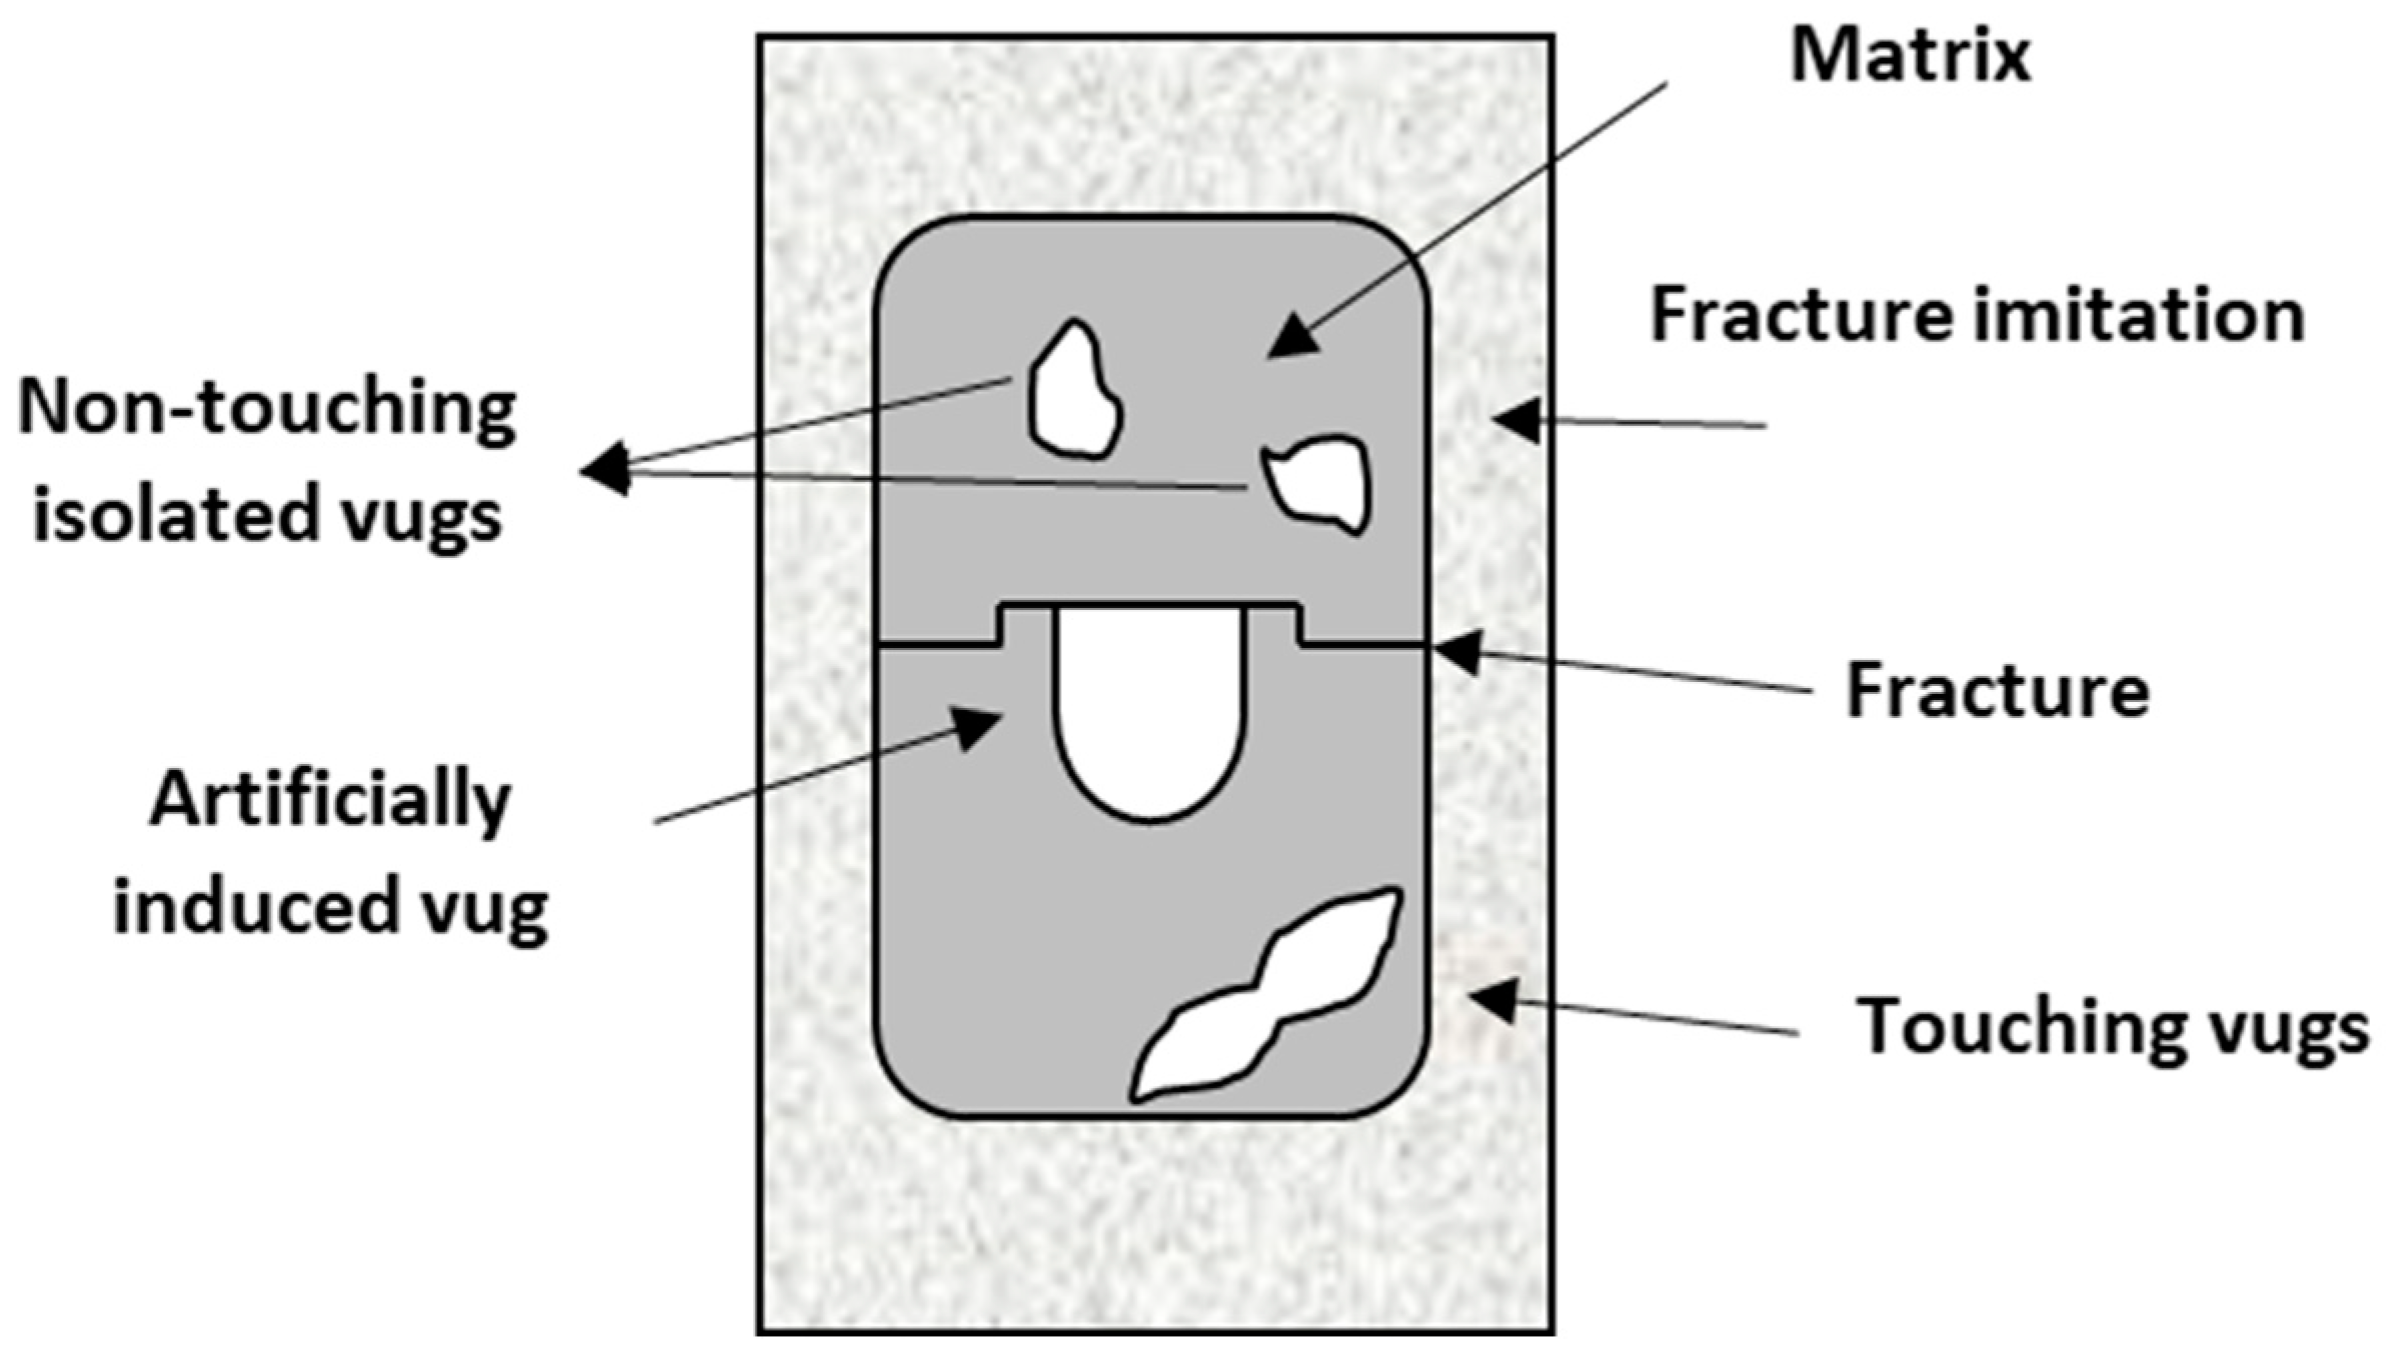
To understand the correlation between rock fabric and petrophysical properties, it is crucial to identify the pore space based on its petrophysical characteristics. This can be achieved by separating the pore space into two categories: interparticle porosity, which is found between grains or crystals, and vuggy porosity, which encompasses all other pore space types. Vuggy porosity is then divided into two groups based on the connectivity of the vugs: separate vugs, where the vugs are only connected through the interparticle pore network, and touching vugs, where the vugs are in direct contact with each other. Figure 1 presents a schematic visualizing the difference between separate and touching vuggy pore spaces.
While the separate-vug pores’ contribution to the fluid flow can be quantified, the touching-vug pores act more as fracture porosity and cannot be defined using this classification. It is typical for the separate-vug pore type to be oil-filled. Nevertheless, it is recommended to ignore this aspect by subtracting this type of porosity from the total porosity, as it has an insignificant impact on permeability. An effective recovery technique for the isolated vugs is yet to be proven.
From the viewpoint of oil-bearing carbonate reservoir exploitation, the complexity is associated with hard-to-control recovery due to unwanted early breakthroughs and mixed wettability [10]. Most of the laboratory studies conducted using the ISC technique for carbonates focused on feasibility, understanding the mechanisms of oil recovery (oxygen diffusion and thermodynamic transfers), and strategies that can be used to control early breakthrough, especially in naturally fractured reservoirs (NFRs) [11,12,13,14,15,16,17]. A field pilot test was reported by a few other authors, who described the technical implementation of ISC combustion in a Grossmont formation, which is characterized by severe heterogeneity with the existence of fractures and vugs. They observed operational challenges related to the control of fire propagation [18,19]. The feasibility of ISC performance in fractures has been studied both experimentally and numerically. The performance of the ISC process in isolated vuggy pore spaces, however, has not been investigated on any scale.
In general, vuggy porous media can be represented through various models, one of which was introduced by Yuan et al. [20,21] in a study where they represented the vuggy pore space, which is common in Grossmont formations, with a dual-porosity model using CMG STARS software for steam-based recovery simulation. Kossack [22] performed gas injection into vuggy and fractured reservoirs using the commercial simulator Eclipse Compositional (Schlumberger). In that study, the isolated vugs with multiple fractures were represented by a triple-porosity system via a modified dual-porosity model. The oil displacement mechanism was found to be dependent on the viscous and gravity forces, capillary pressure, gas composition and diffusion coefficient. The fine-grid single-porosity model was used to evaluate oil recovery from the matrix, fractures and vugs and was matched to the dual-porosity system to determine the matrix properties. The effect of vugs on a reactive fluid flow was studied by Izgec, both experimentally and numerically [23]. The results demonstrated that the connected vugs do not contribute to the effective permeability but do affect the path diversion of the fluid flow.
Revising the fundamentals of the dual-porosity concept, a pioneer who introduced the fundamentals of a dual-porosity model (matrix–fracture) was Barenblatt [24]. His work was later extended by Warren and Root [25], Kazemi [26] and Swaan [27]. The first triple-porosity model was developed by Liu [28], followed by Abdassah and Ershaghi [29]. The model was further studied by Jalali and Ershaghi [30] and Al-Ghamdi and Ershaghi [31]. From a petrophysical evaluation perspective, dual- and triple-porosity models were described by Aguilera et al. [32,33]. While dual-porosity models consist of matrix and fracture networks, a triple-porous system also considers non-connected vugs.
Regardless of the approach adopted for representing a vuggy porous media, the ISC processes within the complex carbonate reservoirs are still enigmatic and have not been investigated in the literature. The objective of this part of the study is to provide the first feasibility evaluation of an air-based recovery method for application in vuggy carbonate reservoirs containing heavy oil. The novelty of this work and the experimental approach followed in this study lies in the representation of the carbonate reservoir using core plugs physically fabricated and assembled to best resemble the actual reservoir conditions in terms of the complexity of the oil-bearing-formation-containing matrix, fractures and vugs. The detailed mineralogical analysis and compositional changes will be discussed in a subsequent publication focusing on an in-depth understanding of the processes taking place during the ISC reactions, as well as the reservoir rock properties on the macro- and microscopic levels.

2. Materials and Methods

The target Permian-Carboniferous reservoir, located in the European part of Russia, is characterized by dolomites, with average permeability and porosity values of approximately 567 md and 15%, respectively.
The experimental procedure included three stages: (a) the pre-test, (b) test (the burn itself) and (c) post-test. The steps of these stages were as follows: (a) oil, brine and core preparation; selection of core samples that are mineralogically close to the original dolomite; and packing; (b): helium (He) pressurization and heating to achieve the initial reservoir conditions; air injection; purging using He and depressurization; data collection; and fluid sampling (temperature, produced gas and liquid volume; and composition); (c): unpacking; fluid analysis; core analysis; and material balance evaluation.

2.1. Oil

The studied heavy oil had a small amount of water and was thus used “as is”. The significant content of the dissolved H2S was removed through N2 bubbling. The heavy oil characteristics are presented in Table 1.

2.2. Brine

The brine was synthesized in the laboratory to reflect the conditions of the original field brine, as presented in Table 2.

2.3. Core

The heterogeneity of the composite core used for this study is characterized by the presence of vugs, fractures and a matrix. While the matrix component of the triple-porosity model acts as a skeleton of the rock that holds the structure together and is the base that cannot be altered, the other two components, the vugs and fractures, were artificially induced to ensure a clear representation of the oil extraction scenario with the combustion front.
The original reservoir core material was cleaned of any remaining residuals and impurities using a Soxhlet-type extractor flushed with toluene solvent for two weeks. After evaporating the solvent, the sample was left in the oven overnight at 350 °C. The clean core was later crushed and sieved.
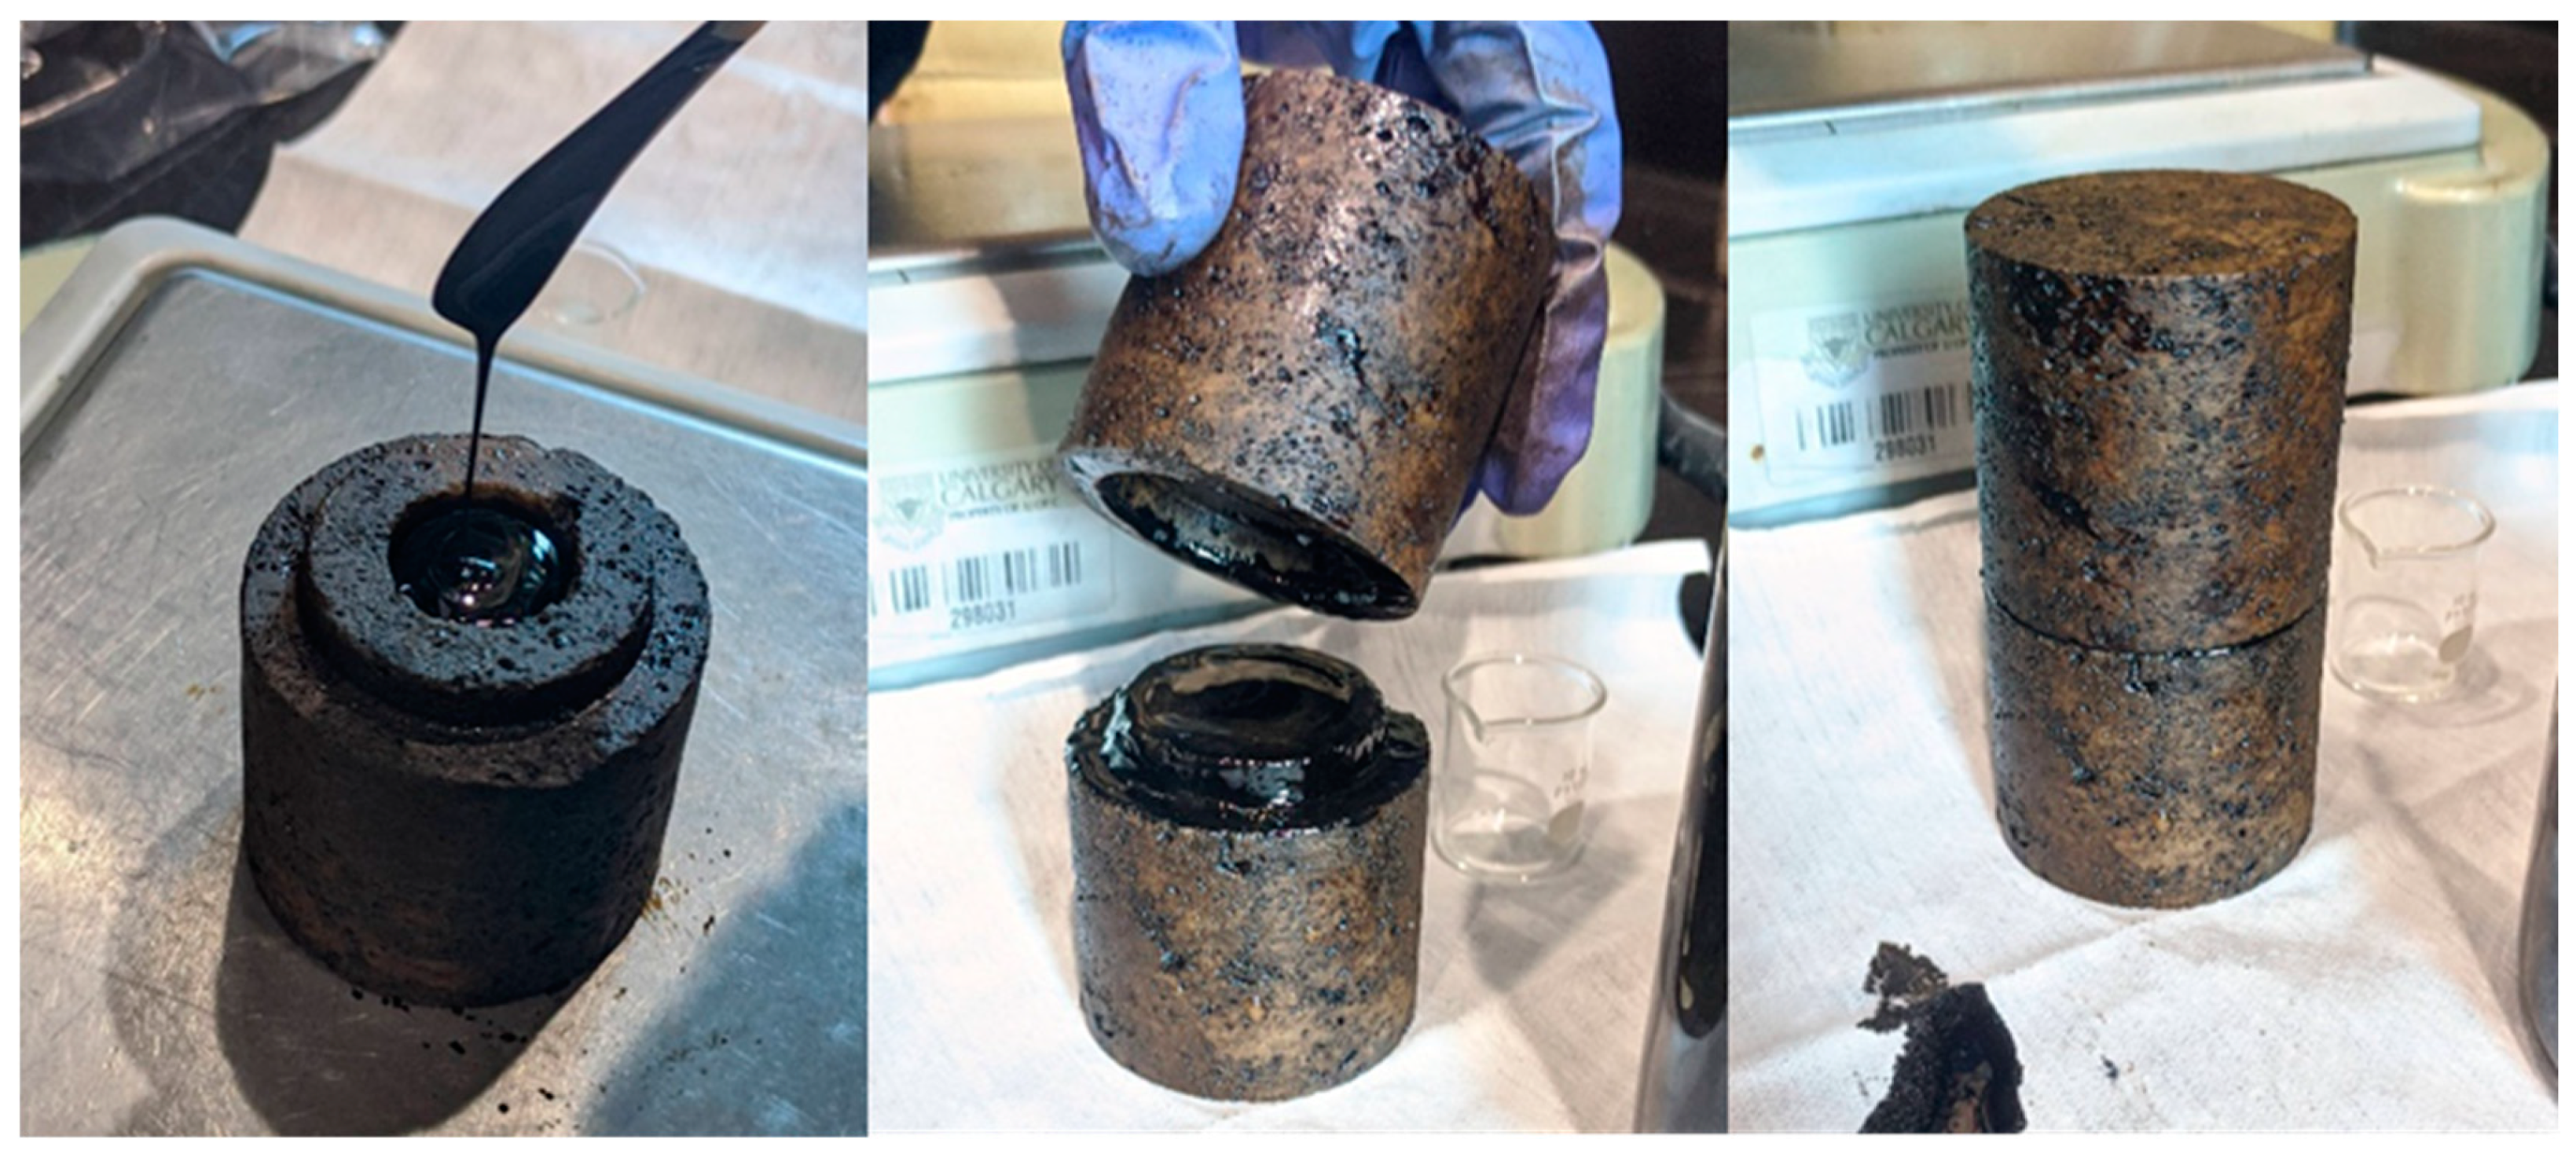
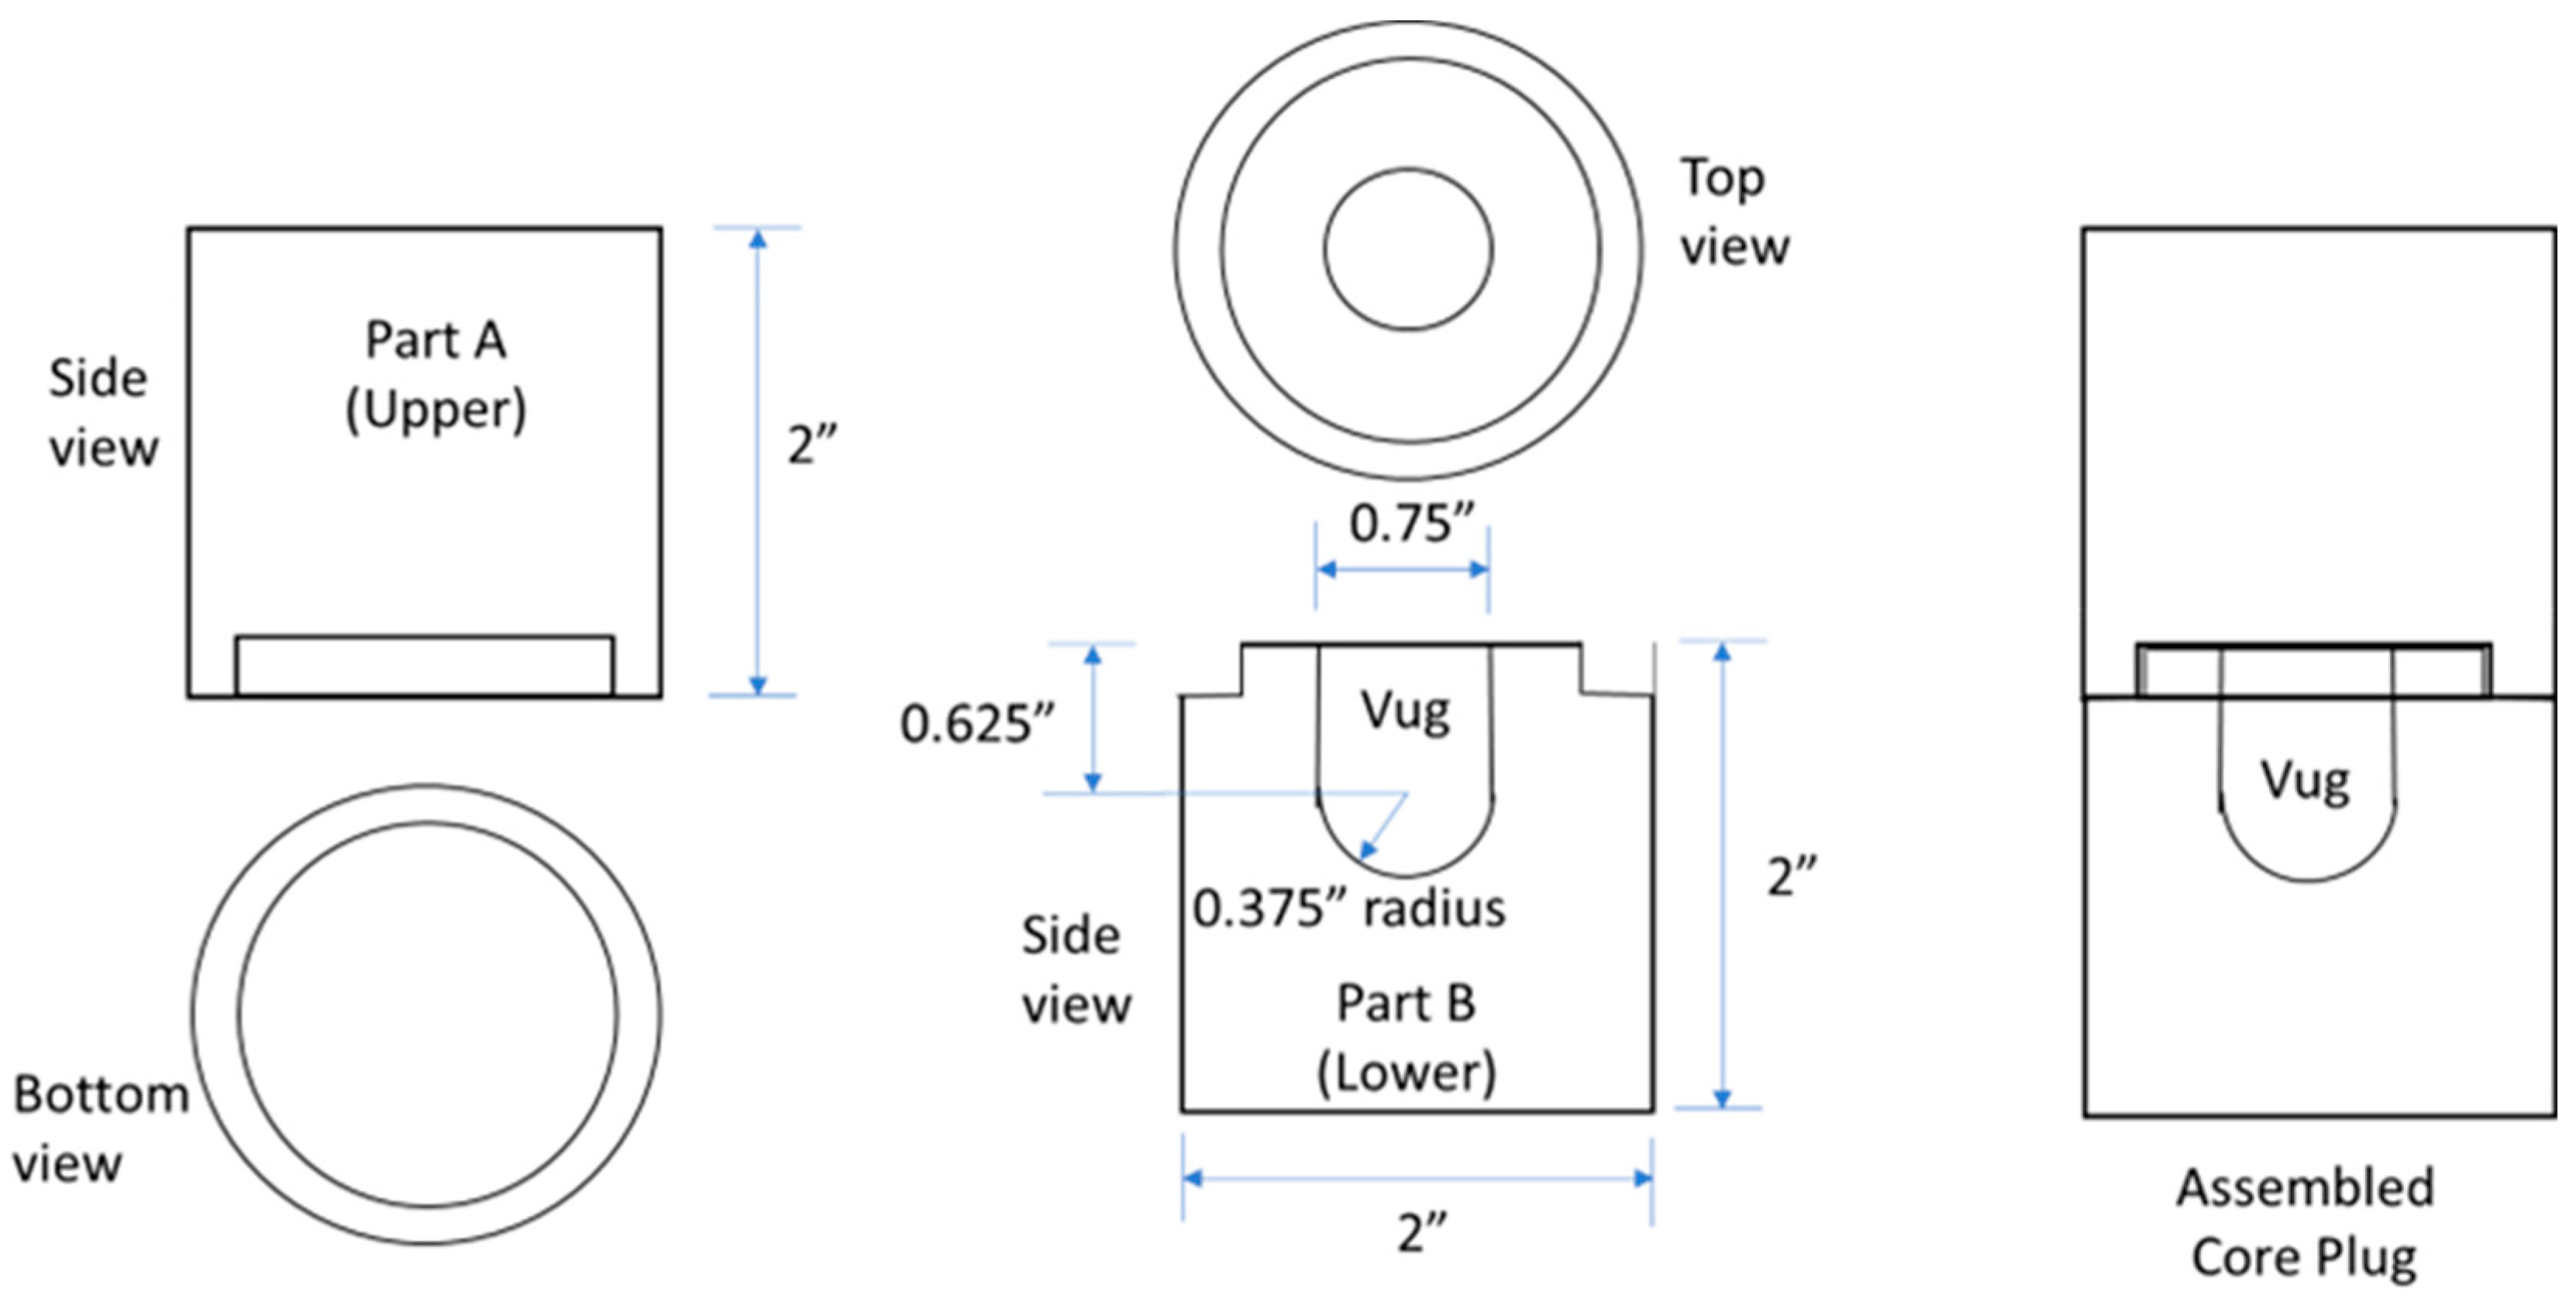
Silurian outcrop dolomite samples, purchased from Kocurek Industries Inc. of Caldwell, Texas, were used for the test and named, in this study, as core plugs or consolidated dolomites. The plugs were custom-manufactured to create artificial cylindrical vugs that had hemispherical ends. Each plug consisted of two parts, a vug and a cap, which fit together, creating a closed vug. The idea behind this design was to create enough volume to enable it to be further filled with oil in order to observe its displacement to the reduced permeability area or to the matrix. The fit between the vug half and the cap was close but not sealed, representing an approximately 1 mm fracture (Figure 2). The dimensions of the core plug are presented as a sketch in Figure 3.
To oil-saturate the core plugs, each cap and vug core plug were saturated separately. First, the core plugs were placed in a pressure vessel under a vacuum, and then CO2 flooded and were again evacuated in a vacuum to remove the gas. The pressure vessel was filled with oil to a pressure of 5000 psig (345 bar) at 40 °C and left for an extended period to fully saturate the core plugs. After depressurizing, the core plugs were removed, reweighed and frozen at −10 °C for a week to prevent a potential loss of the light hydrocarbon components from the original oil.
The sketch of the compositional core representing the triple-porosity model used for this study is presented in Figure 4.

2.4. Apparatus

This test was performed using a medium-pressure combustion tube (MPCT) system. The core holder had a 4-inch (10 cm) outer diameter and was a 1.83 m (6 ft)-long, thin-walled (1 mm) Type 600 Inconel tube. The tube had 12 heating zones, each being 15 cm (6 inches) in length, maintaining near adiabatic conditions in the test. An additional heater at the tube inlet was used to initiate the ignition process. Each heating zone comprised two thermocouples, one on the centerline and the outer one on the wall of the Inconel tube, respectively, acting as a heater and a control system. Thermocouples located on the centerline were used to provide the central temperature of the heat wave at the thermocouple location. A temperature difference of 5–10 °C was maintained between the centerline and wall thermocouples by controlling the zone heater and activating it to minimize radial heat loss to the surroundings.
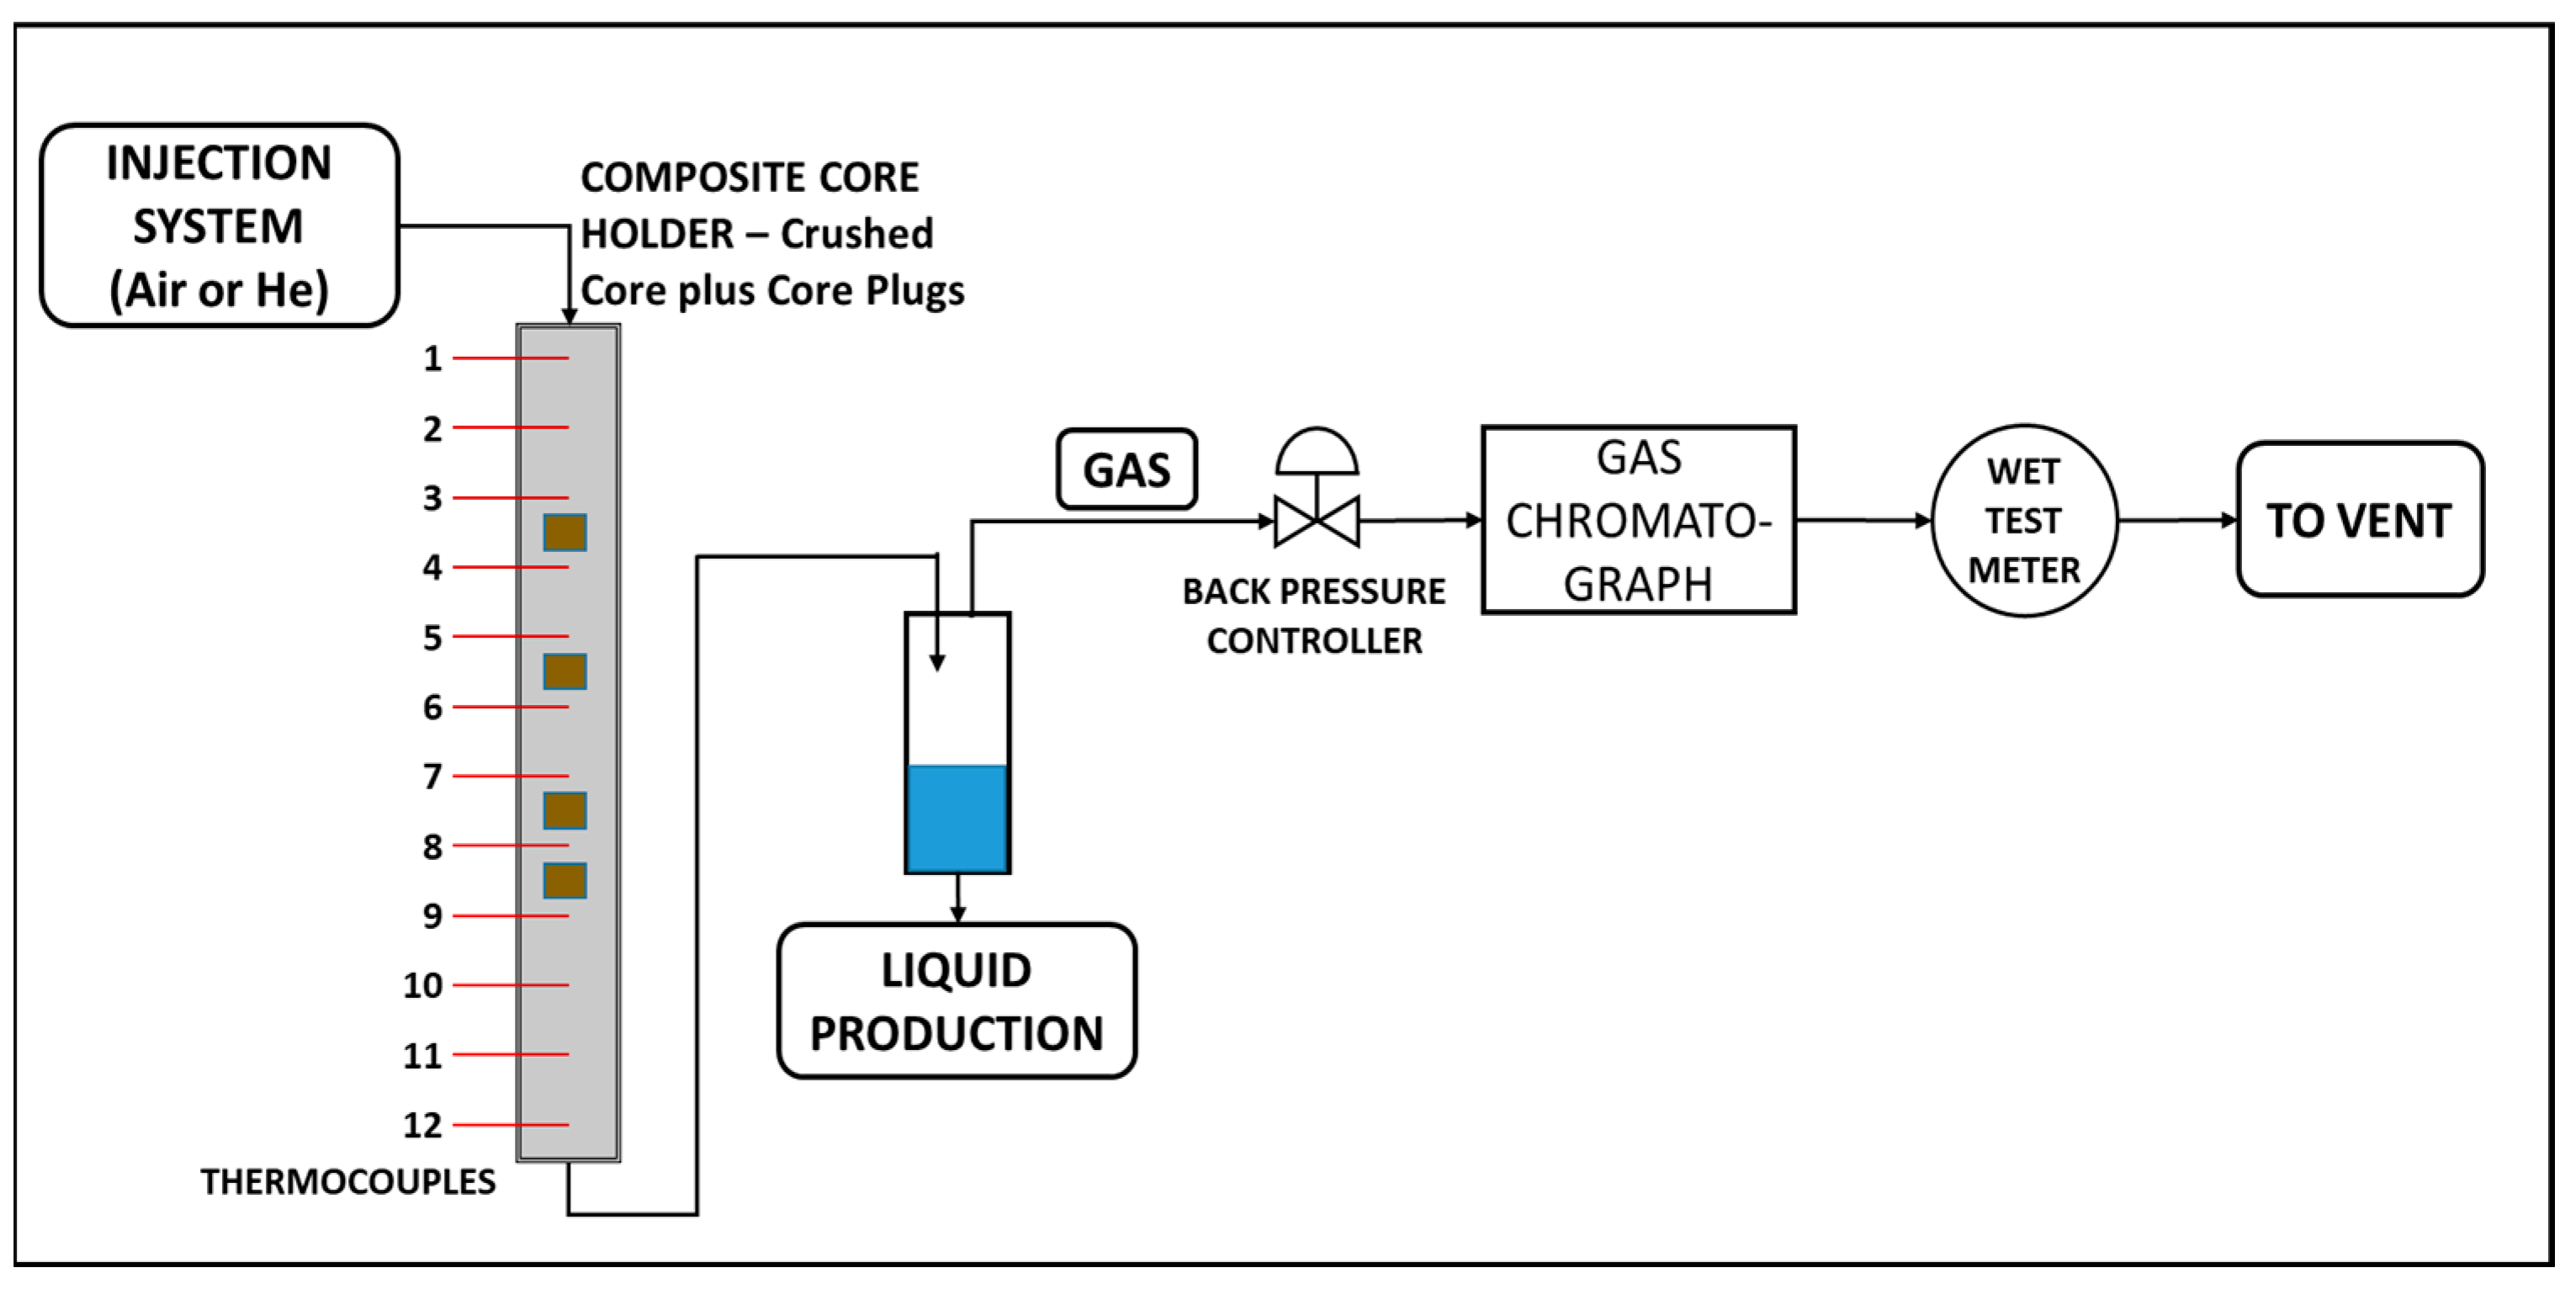
When the CT was packed, it was vertically oriented to be gravity-stable in terms of the combustion front propagation. The air was injected from the top, and the produced fluids were collected at the bottom. The production system was equipped with a high-pressure production vessel allowing for the separation of gases and liquids. When the flue gas broke through, the gas stream was directed to the back-pressure regulator (BPR), which maintained the reservoir pressure in the core pack. Oil and brine were manually withdrawn from the separator into sample jars and stored for later analyses. To detect the effluent gas composition, the product gas was passed through gas chromatographs (GCs) and through a wet test meter (WTM) to measure the composition and volume of the produced gas. Finally, the produced gas was vented into the atmosphere. Figure 5 demonstrates the schematic of the MPCT system.
A regular CT packing procedure was carried out using a 16-mesh silica sand frac followed by a 20/30-mesh silica sand frac, which was placed at the injection end of the tube [34]. This measure is required to mitigate fines migration into the injection line. Next, the crushed core pre-mixed with brine and oil was tamped into a core holder hosting four core plugs. Each core plug occupied a depth of approximately 84 mm. The core plugs were placed to fit between two successive thermocouples (Figure 5).
On completion of the packing operation, the tube was sealed, insulated and inserted into the pressure jacket. Note that the porosity and permeability of the premixed composite core pack could not be directly measured; thus, the porosity was calculated based on the core densities.
Table 3 presents the details of the test materials used for the CT and some of the reservoir properties of the packed core.
The porosity was calculated using the volume of the core holder and the grain densities of the carbonate material and frac sand. The saturations were calculated based on the densities of the brine and oil at 25 °C under atmospheric conditions. The frac sand and dolomite were included in this process. A detailed description of the calculation steps can be found elsewhere [35].

2.5. Combustion Test Procedure

Helium was injected to pressurize the system up to 1740 psig. At the same time, the heating of the 12 zones of the composite core pack to the reservoir temperature was initiated. Helium was then injected at a flow rate of 234 L(ST)/h (flux of 30.0 m3(ST)/m2h). The GC sampling of the produced gas continued throughout the production period. When the ignition set point of 325 °C was achieved, the He injection was switched to air at a flow rate of 234 L(ST)/h (flux of 30.0 m3(ST)/m2h). Ignition occurred 5 min after the start of air injection with a rapid temperature increase to 568 °C in Zone 1.
Generally, the thermal front advanced steadily through the reservoir. When the leading edge of the combustion front had passed the thermocouple at Zone 10 or 78 % of the core pack length, air injection was replaced with He again at the same flow rate of 234 L(ST)/h (flux of 30.0 m3(ST)/m2h). The burn continued to consume the O2 stored in the swept zone behind the combustion front. Unfortunately, there was an operator error, where He cylinders contaminated by N2 were used. This did not affect the quality of the test, as neither He nor N2 is reactive with hydrocarbons. The impact of this error was evident in the post-test material balance analysis of the gases.
The disappearance of the N2 from the effluent gas composition detected by the GCs during the pure He purge was used as an indicator to stop the experiment. After terminating the He injection, the system was bled down and left to cool. The post-test assessments included unpacking, liquid and gas production analysis, further calculations of the combustion parameters and core analysis. The main events are listed in Table 4.

3. Results

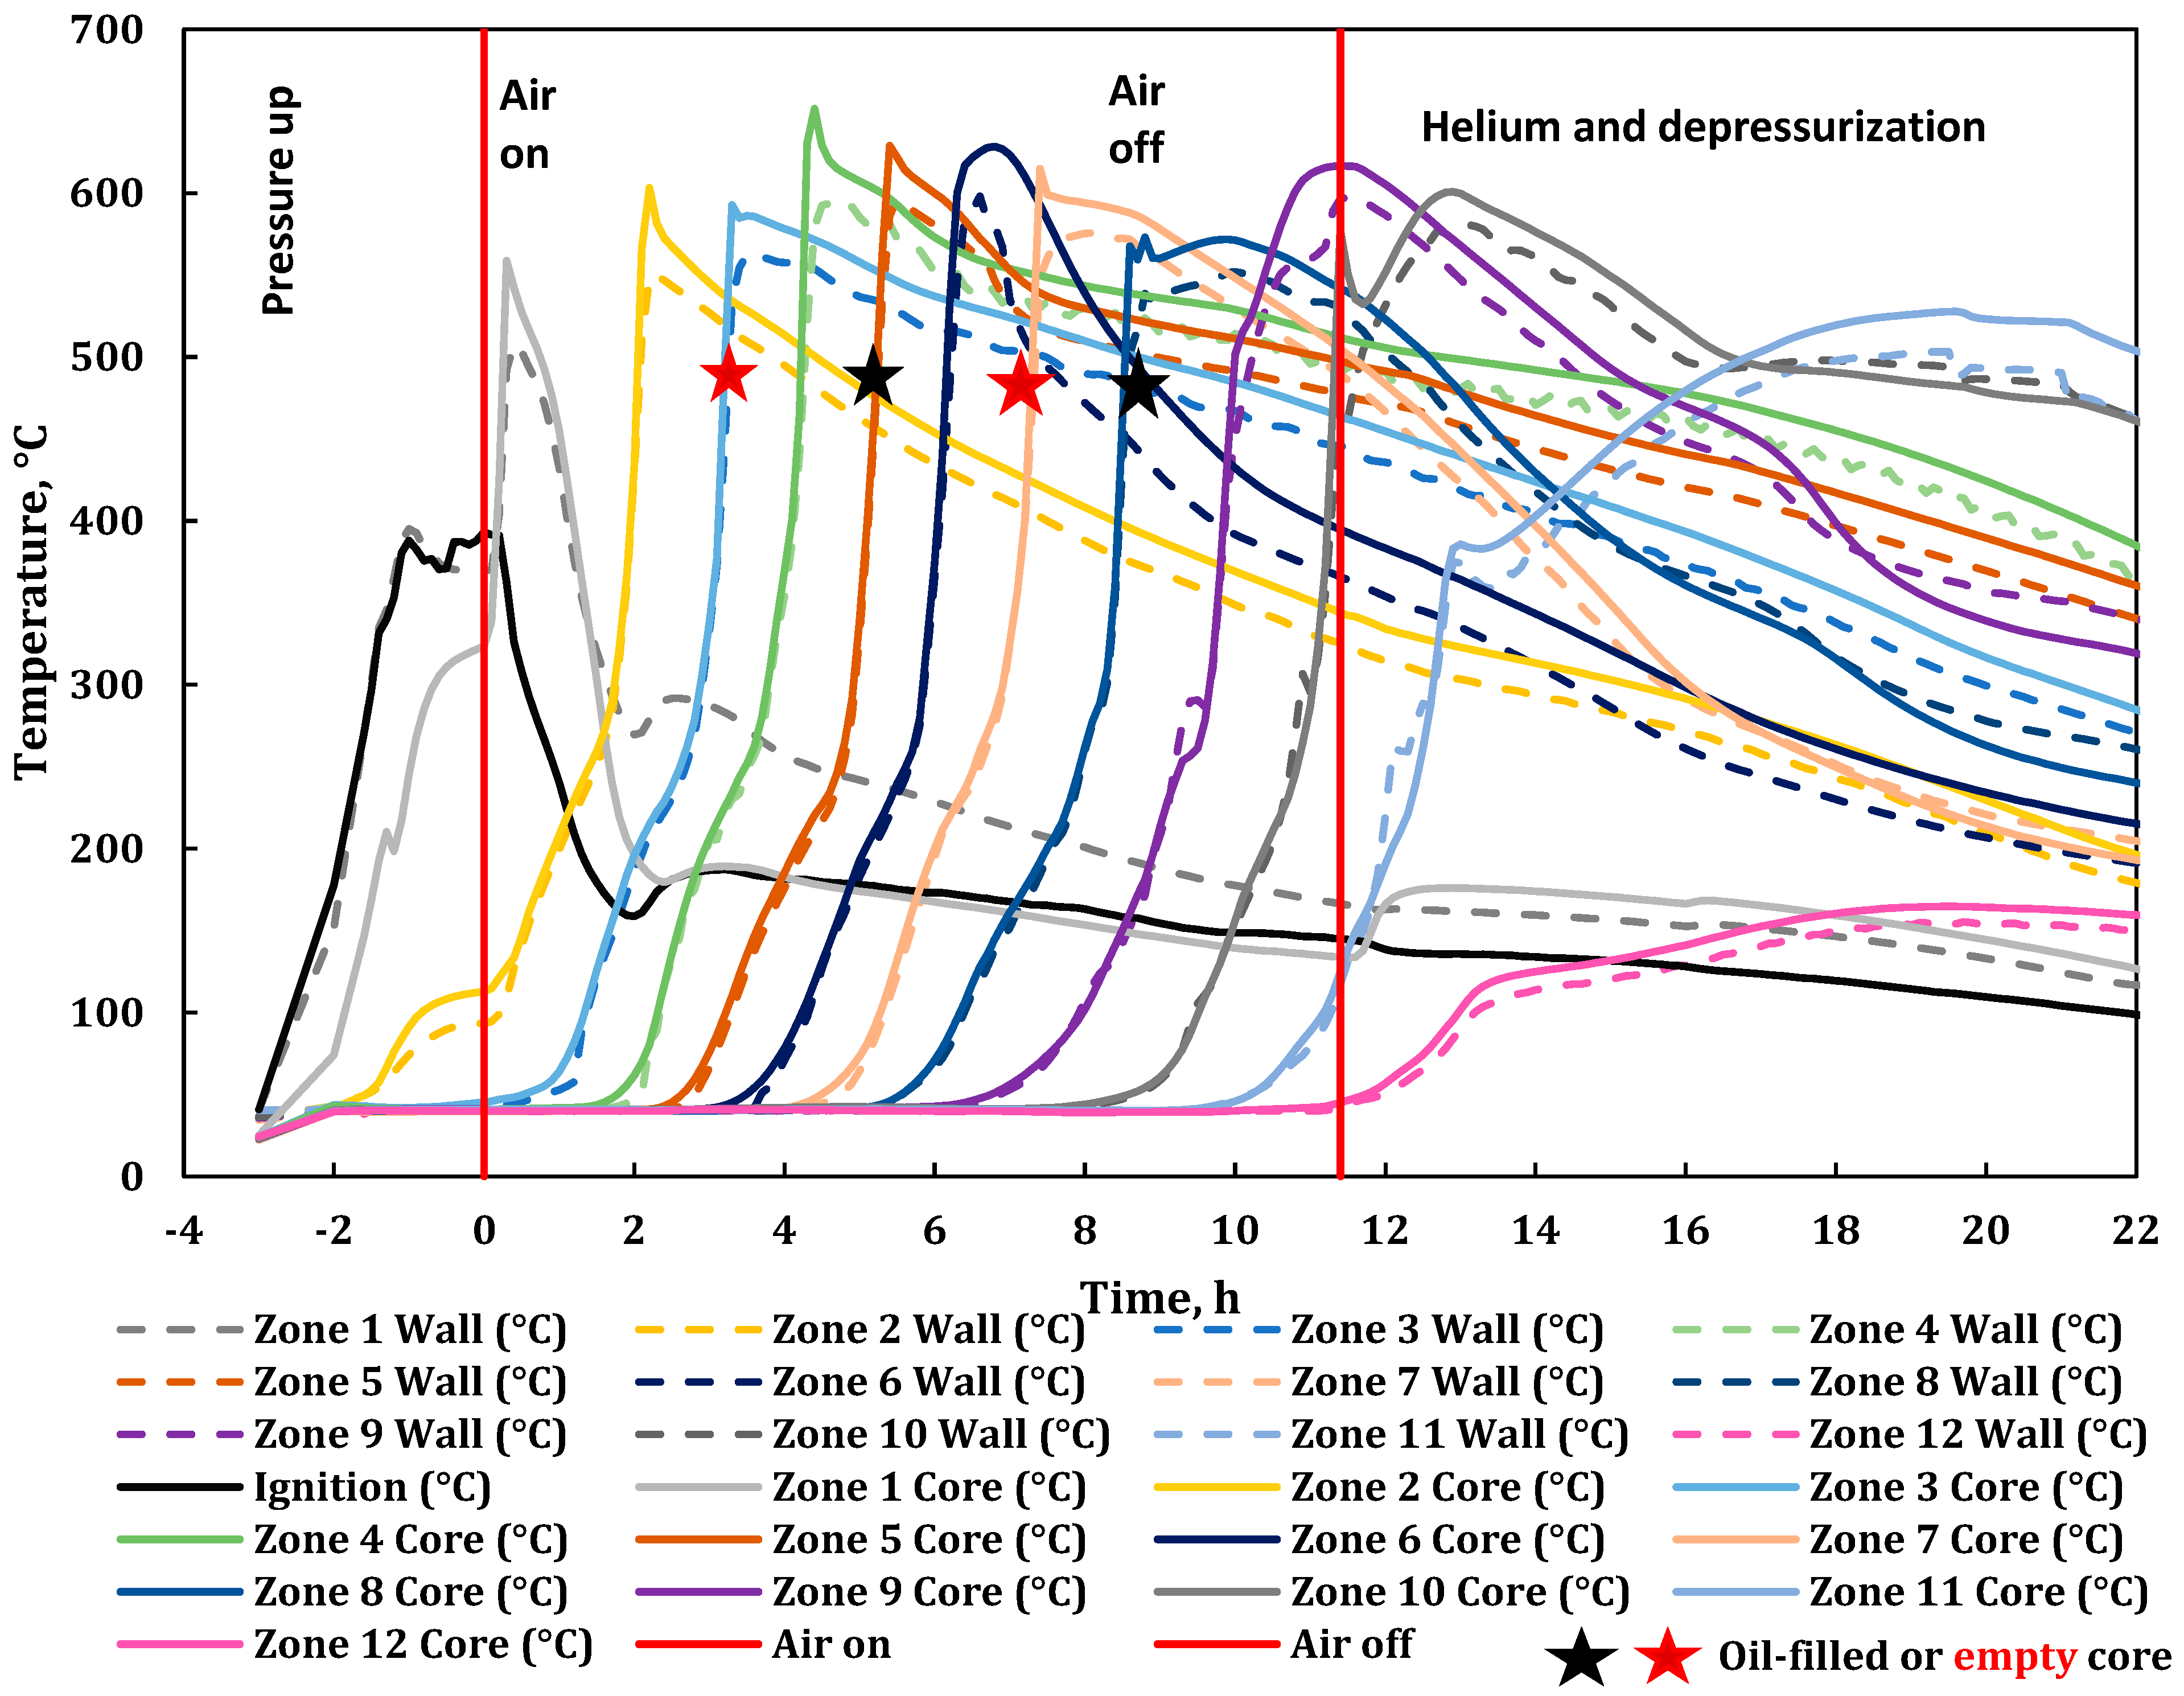
The temperature history of the centerline, wall thermocouples and core plug locations are presented in Figure 6. Generally, temperature peaks are local maximum values for each zone and represent the leading edge of the fire front. The temperature profiles were stable, indicating a successful high-temperature combustion front propagation. Despite the smooth temperature profiles, the combustion front likely did not traverse the core plugs in a piston-like fashion, as there is a significant difference in its ability to filter through the relatively loosely packed crushed carbonate and the consolidated core plugs.
After the high-temperature front passed through the zones where the oil-filled core plugs were placed (5–6 and 8–9), the next temperature zone appeared to have a dome-like curved shape compared to the sharper peaks observed for the other zones. This phenomenon can probably be explained by the additional oil flow filtering through the core plugs and joining the mainstream.
As the combustion propagates toward the end of the tube, the accumulated light hydrocarbon gases react with the O2, causing the temperature rise to be resumed after a short interruption, as shown in Zones 8, 10 and 11.
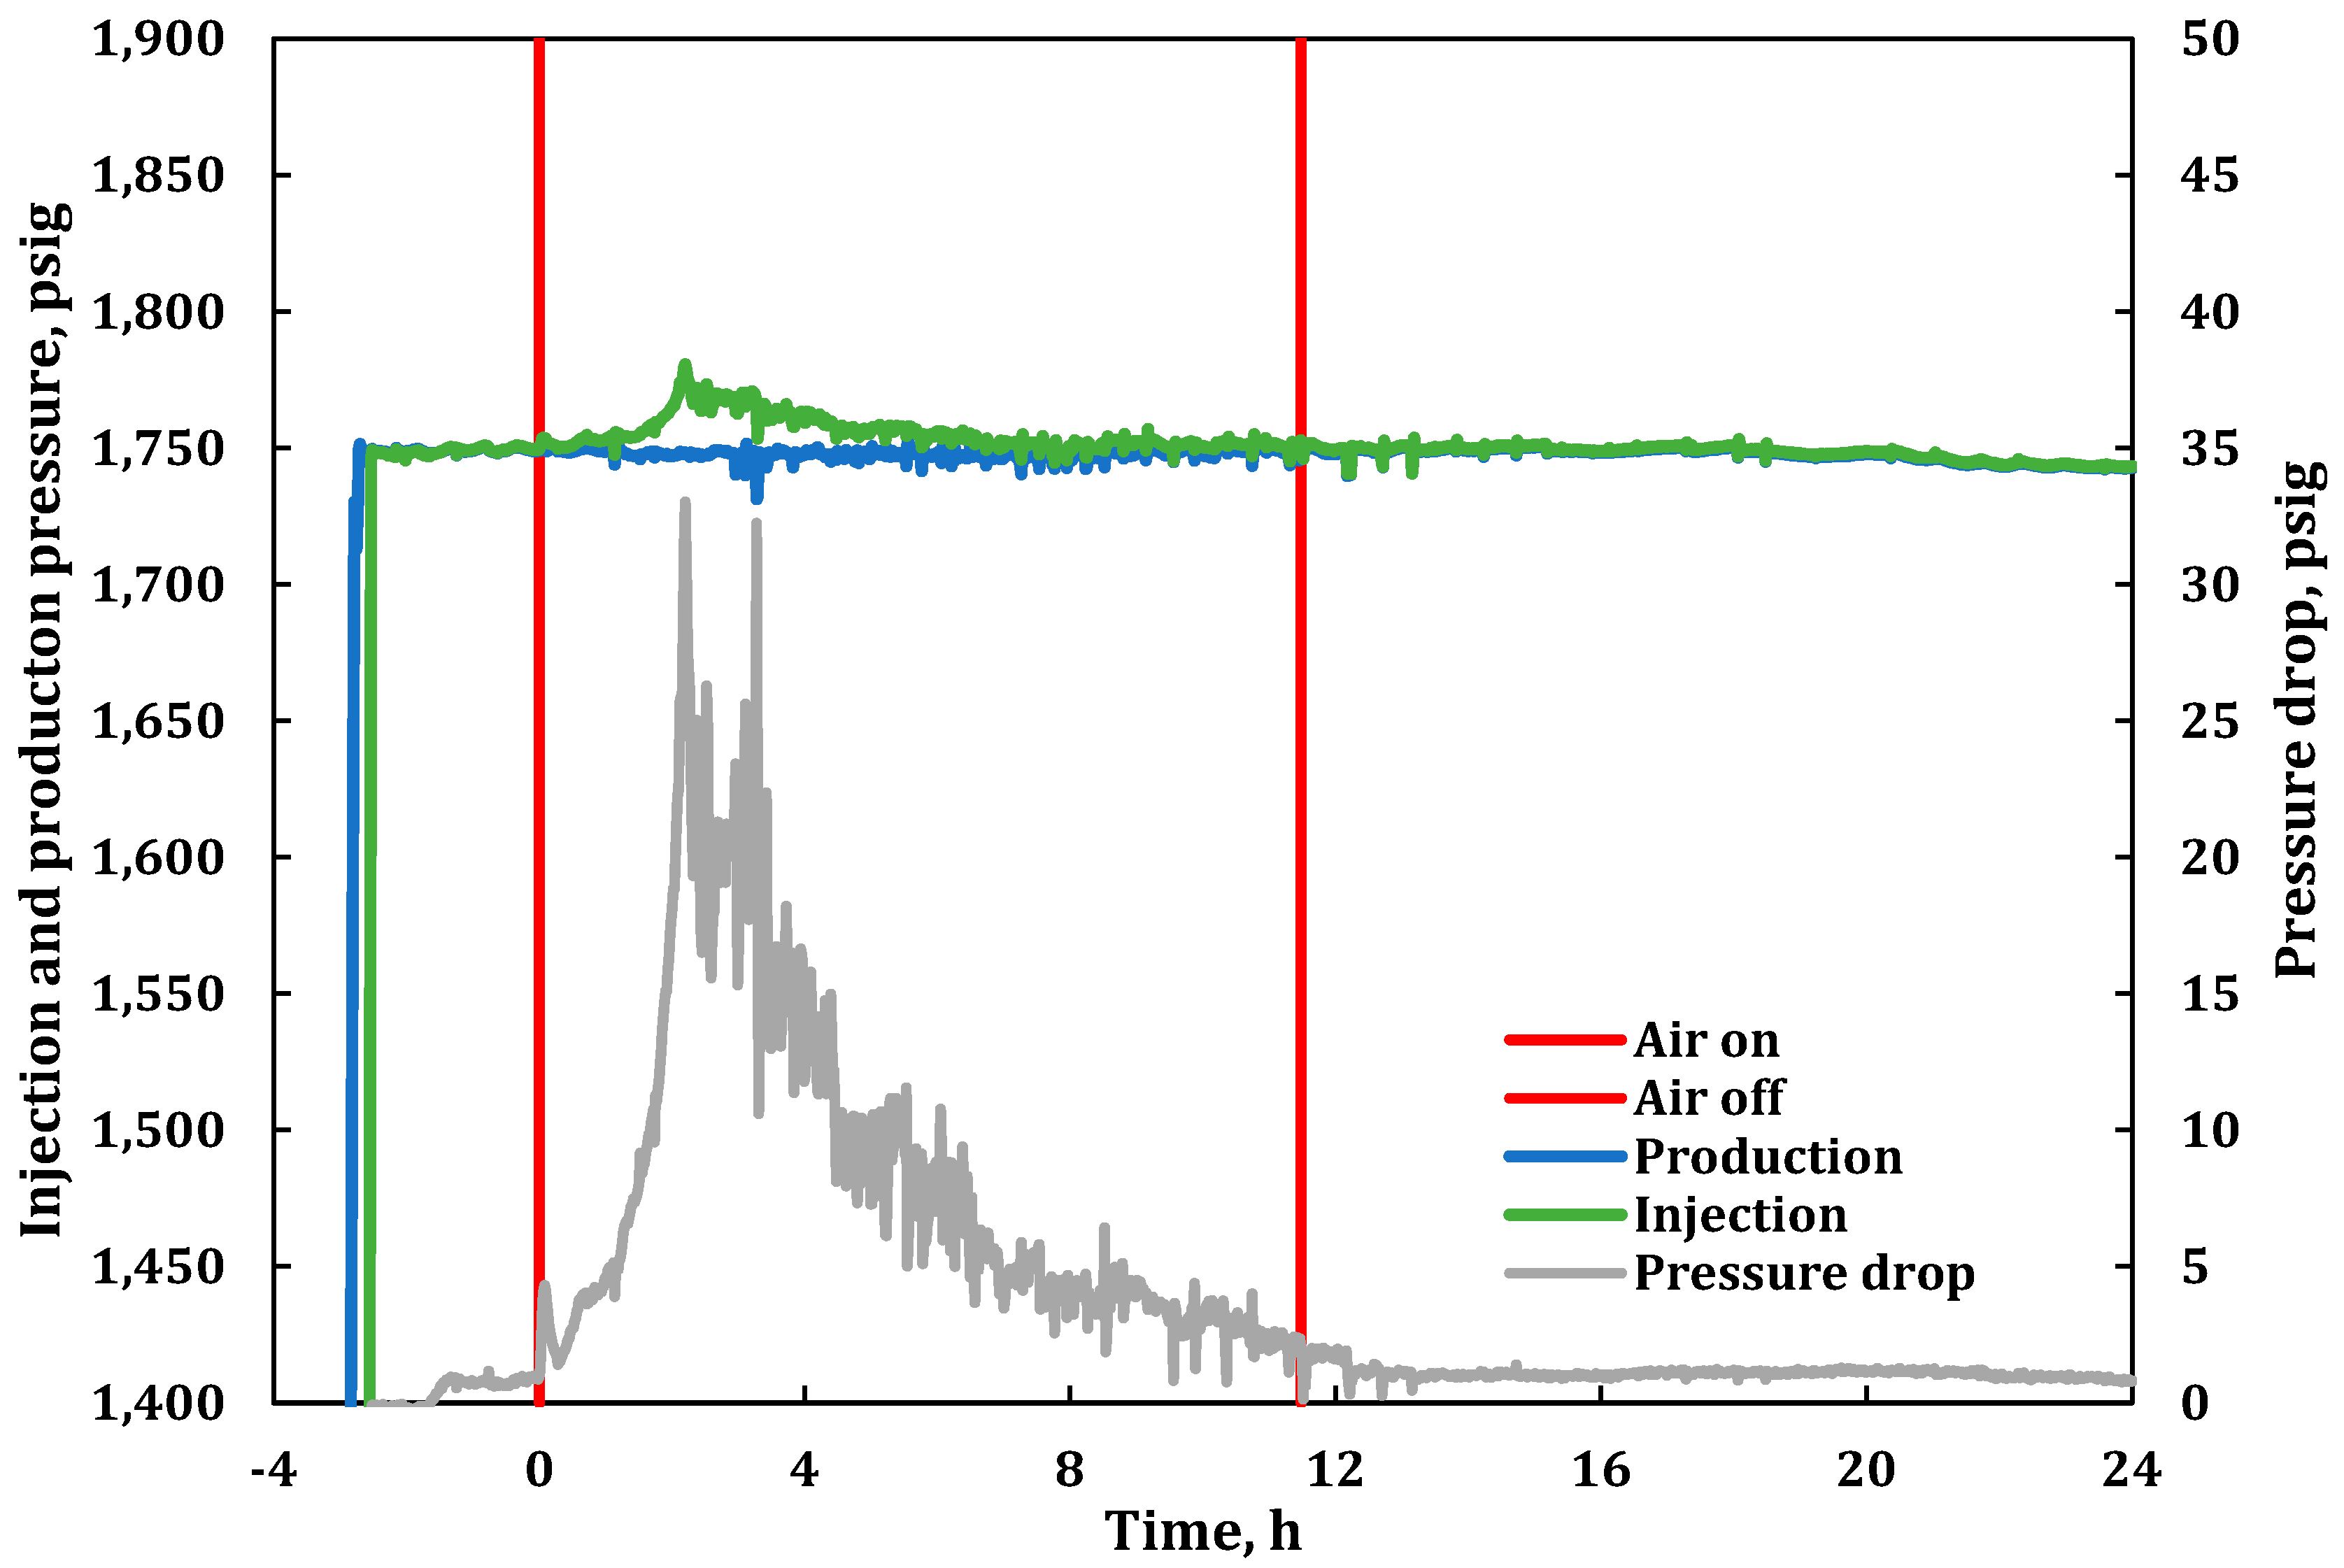
The vuggy CT test performed in the current study demonstrated a stable injection pressure during the He injection period (Figure 7). Based on the ISCRG’s extensive experience, a low-pressure drop is typical for heavy oils with low oil saturation until the test is ignited. The first peak in the injection pressure appeared as soon as the gas injection switched to air. The pressure drop was detected at the maximum temperature in Zone 1 where the ignition occurred. A further pressure rise displayed in Figure 7 was associated with the advance of the hot mobilized oil into the cooler part of the core. The maximum pressure observed was after 2.2 h when the leading or downstream edge of the heat wave passed the thermocouple located in Zone 2. The second significant pressure spike occurred as the leading edge of the combustion front was very close to the thermocouple in Zone 4. Production of displaced fluids allowed a gradual pressure reduction towards the end of the experiment.
Oil recovery during an ISC recovery process is controlled by the oxidation and displacement history at each location downstream of the leading edge of the combustion zone. The steam bank and the fire front propagation are two of the most important driving forces of oil mobilization.
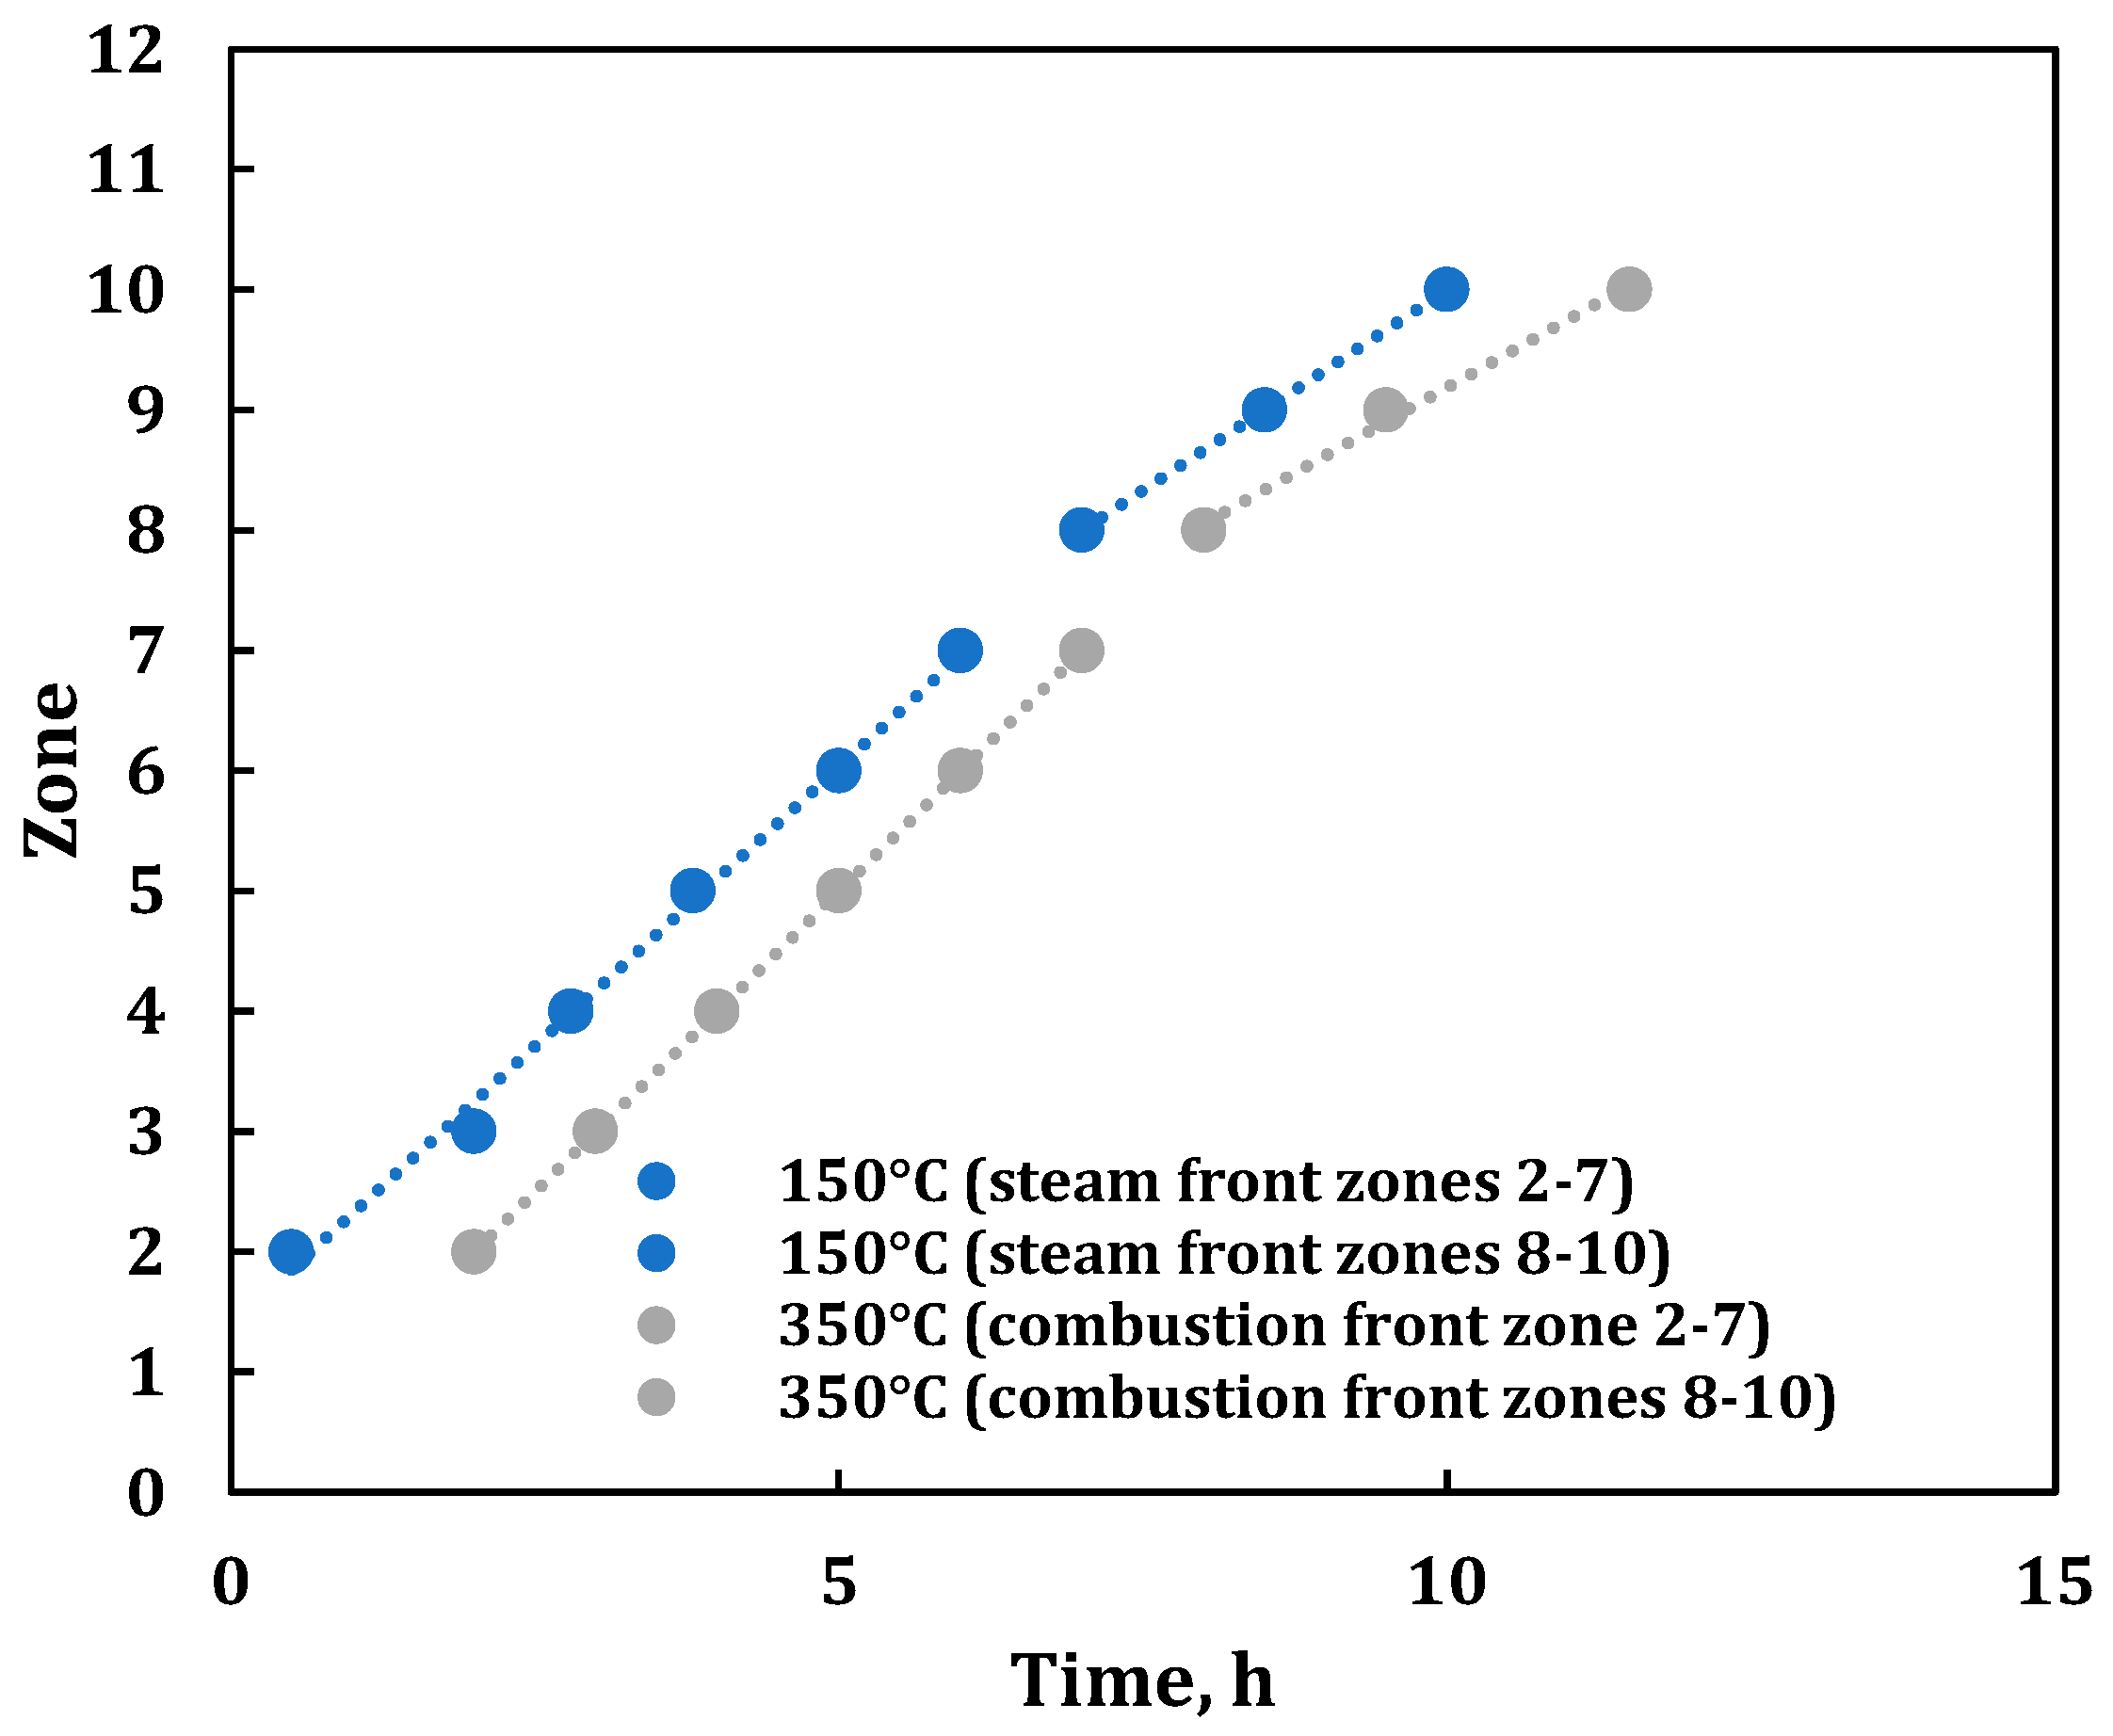
The temperatures of 150 and 350 °C require special attention, as they are, respectively, the temperatures at which oxygen addition (LTO) reactions generate temperature rises that are visually identifiable and generate well-defined heat waves, in addition to carbon oxides and water, and bond scission reactions occur in the heavy oils. The temperature of 350 °C is characterized as the transition to the high-temperature range (HTR), in which the highest levels of energy generation and O2 uptake occur. The reaction zone temperatures in the HTR correspond to effective oil mobilization.
Figure 8 shows the heat wave front location versus time for the 150 °C location (steam bank) and 350 °C (leading high-temperature edge). Both fronts have similar velocities, being 0.147 m/h, from the beginning of the experiment to Zone 7. The 150 and 350 °C front velocities slow to 0.098 m/h and 0.104 m/h, respectively, as their fronts advance through Zones 8 to 10.

3.1. Product Gas Composition Analysis

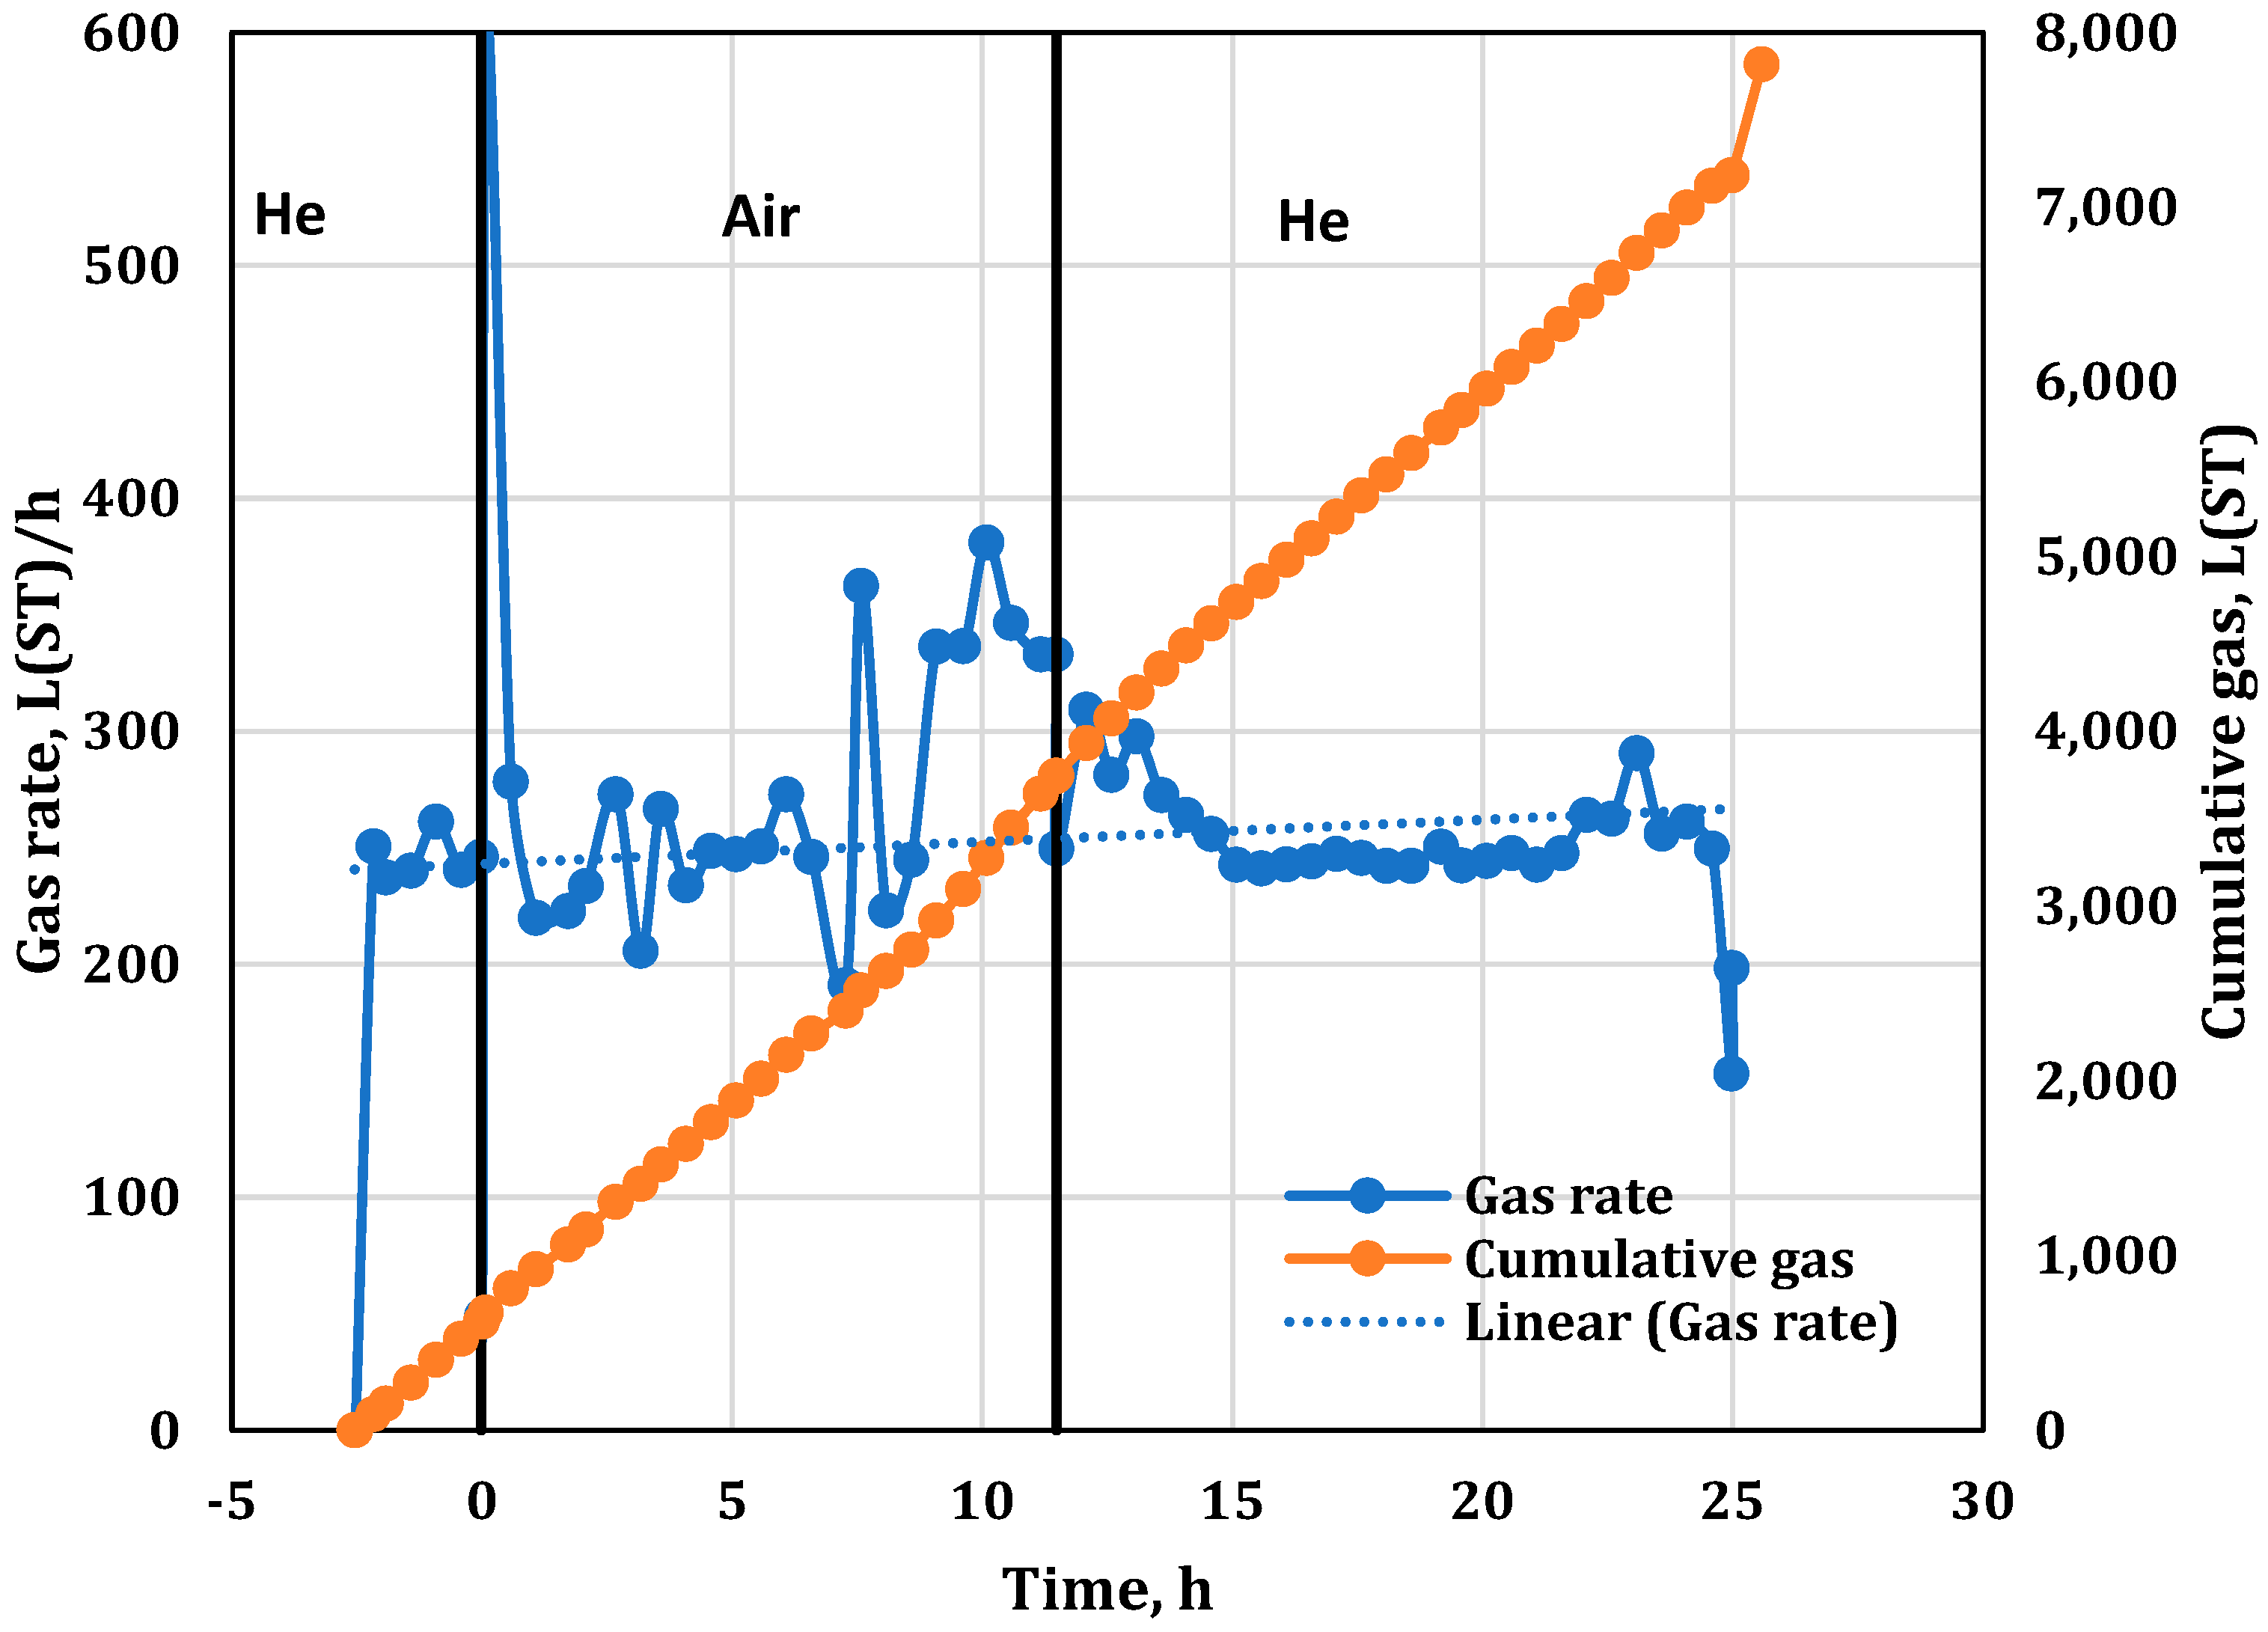
Gas composition identification is a routine type of analysis in CT tests. In this work, a couple of issues noted during the experiment execution introduced challenges that needed further assessment. First, due to the operator error, the high-pressure He gas cylinder, which was used prior to the ignition start-up and during the helium purge period, should have contained pure He. Instead, it was inadvertently N2-contaminated. Secondly, after approximately 8 h from the ignition time, a small He leak originating from the pressure jacket annulus and combining with the effluent gas stream was detected. Finally, a higher-than-expected level of CO2 production was detected. This was determined to be the result of the decomposition of the dolomite crushed core and core plugs under high-temperature and -pressure conditions. The N2 impurities in the cylinders and the detected He leaks did not affect the quality of the CT tests, because the gases entering the system were non-reactive. It was necessary to develop a methodology so as to correct the gas composition data. The separation of the N2 associated with the injected air from the N2 contained in the contaminated He cylinder was vital, as the N2 was used as a tie component to complete the material balance of the consumed gases.
Three high-pressure cylinders containing He were utilized during the CT experiment. Cylinder 1 (He) and Cylinder 2 (He) were N2-contaminated with an insignificant amount of O2. The compositions of the used He cylinders are presented in Table 5.
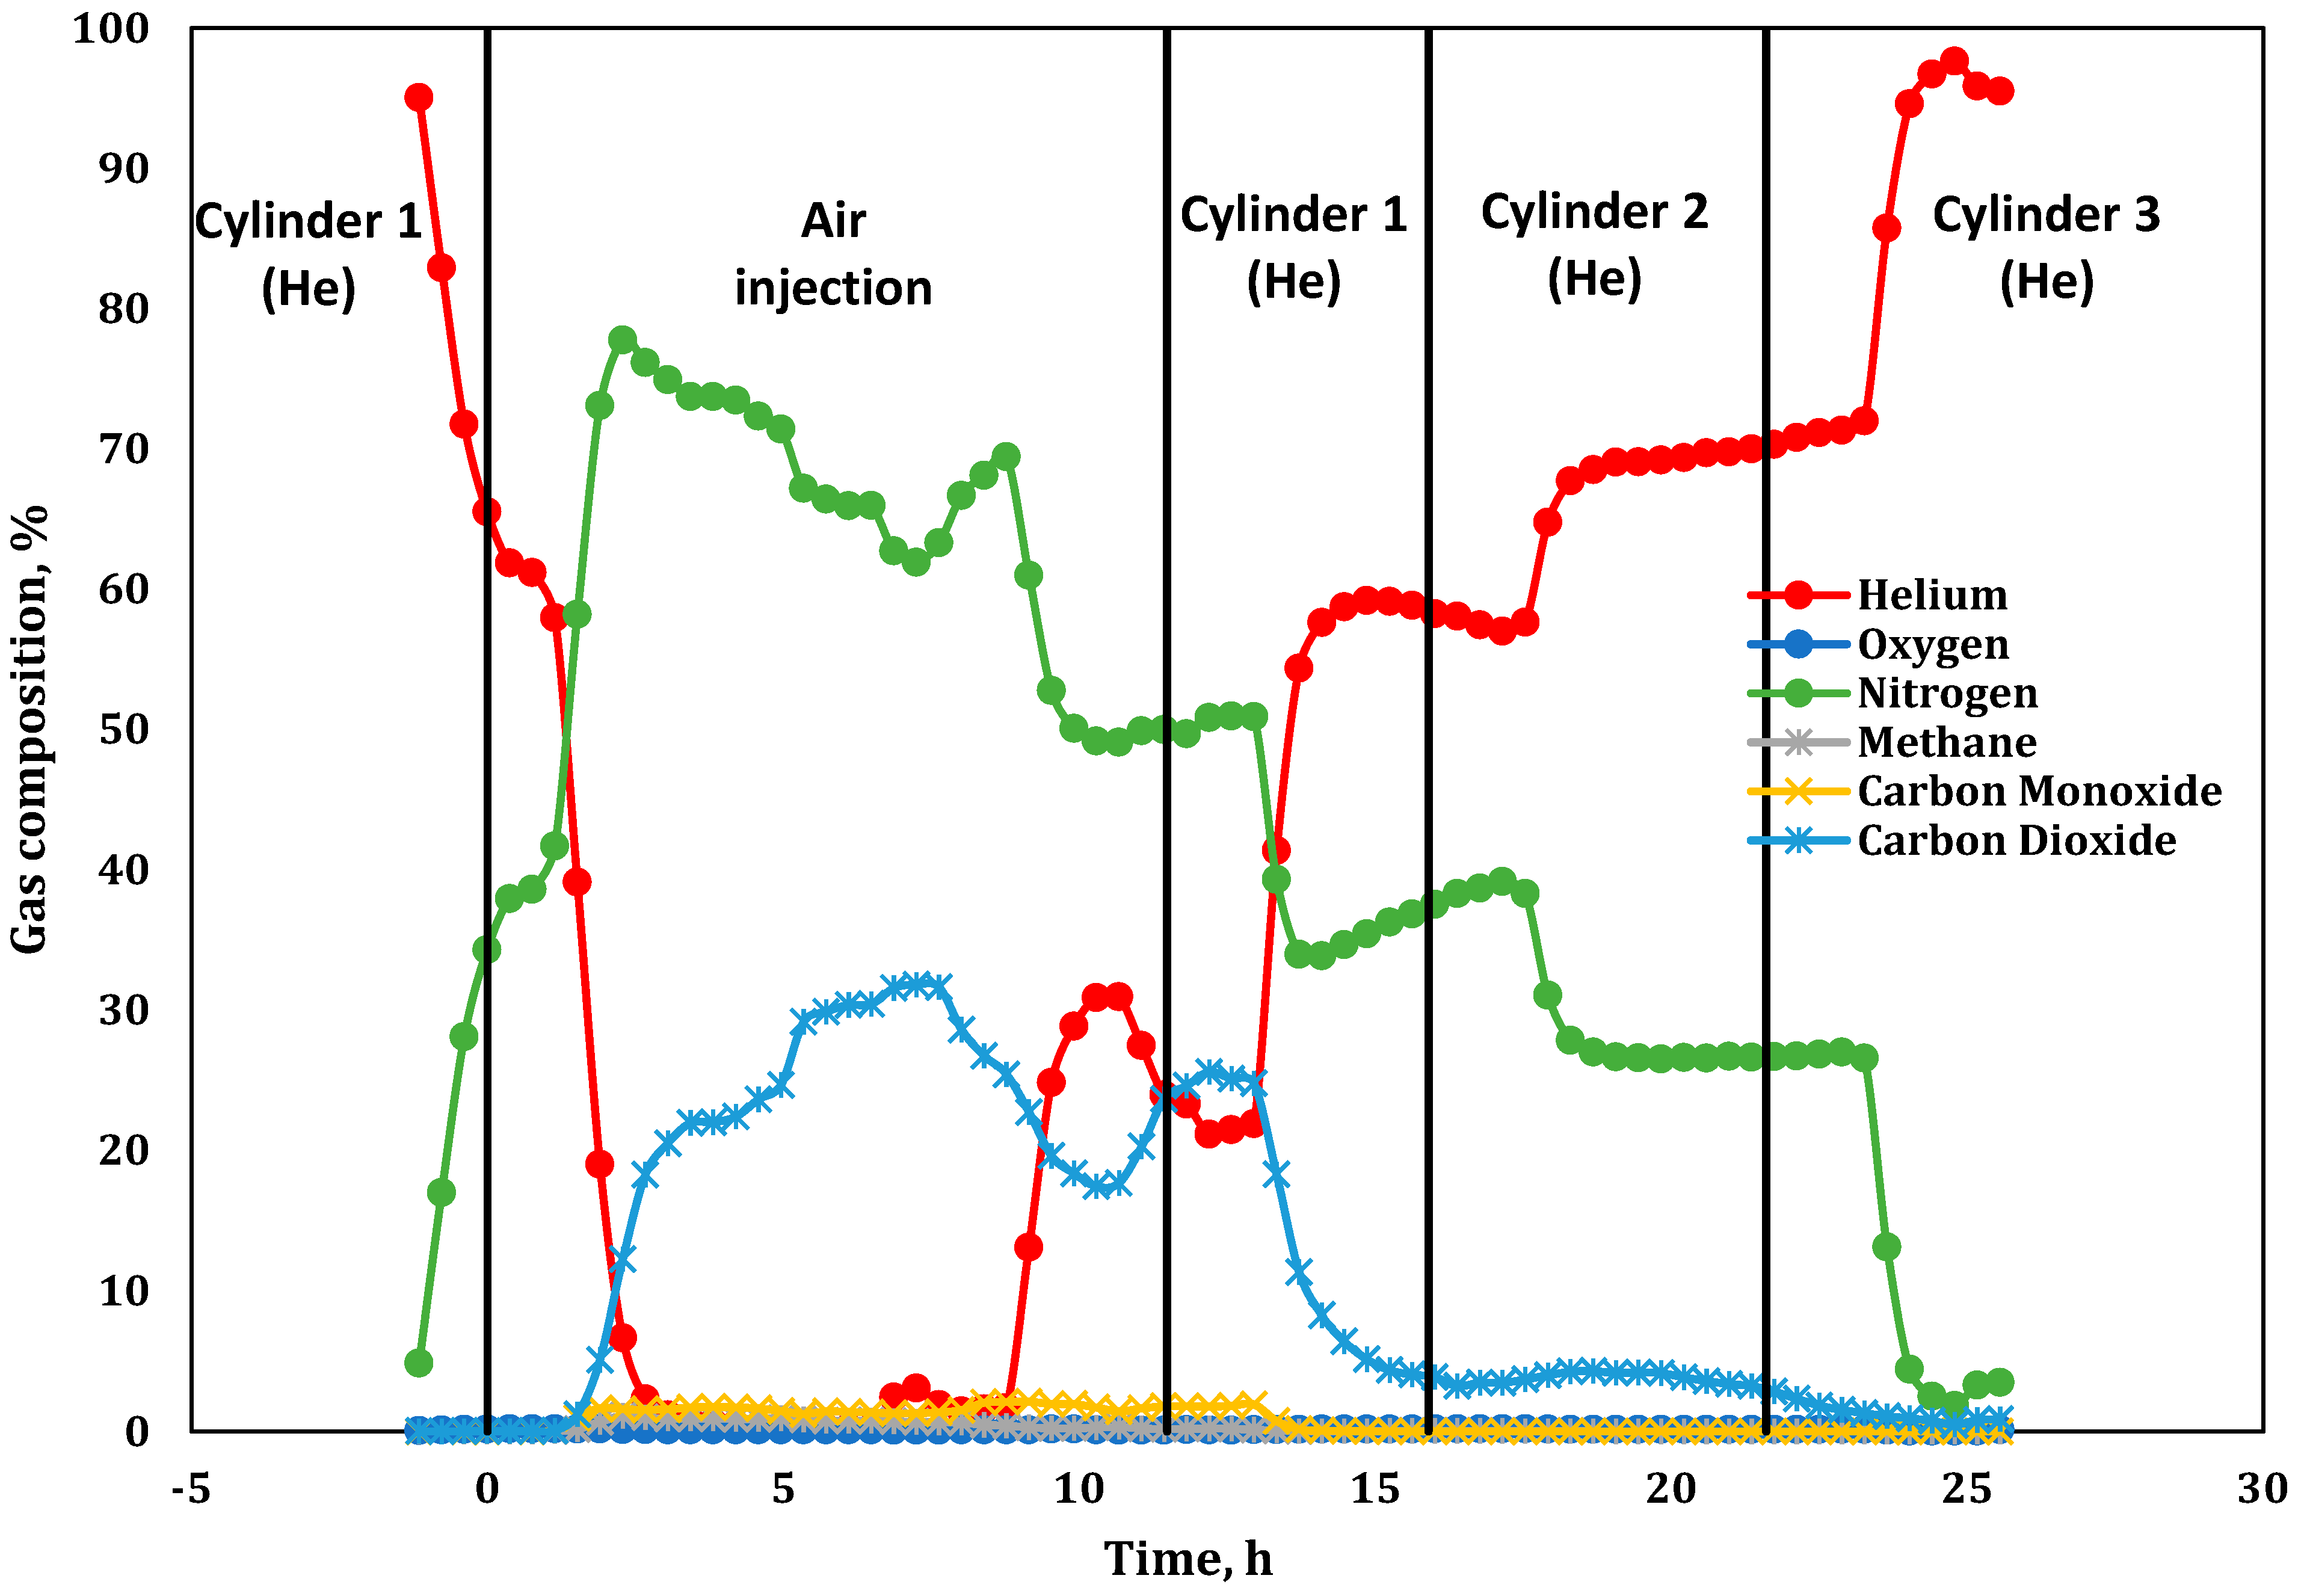
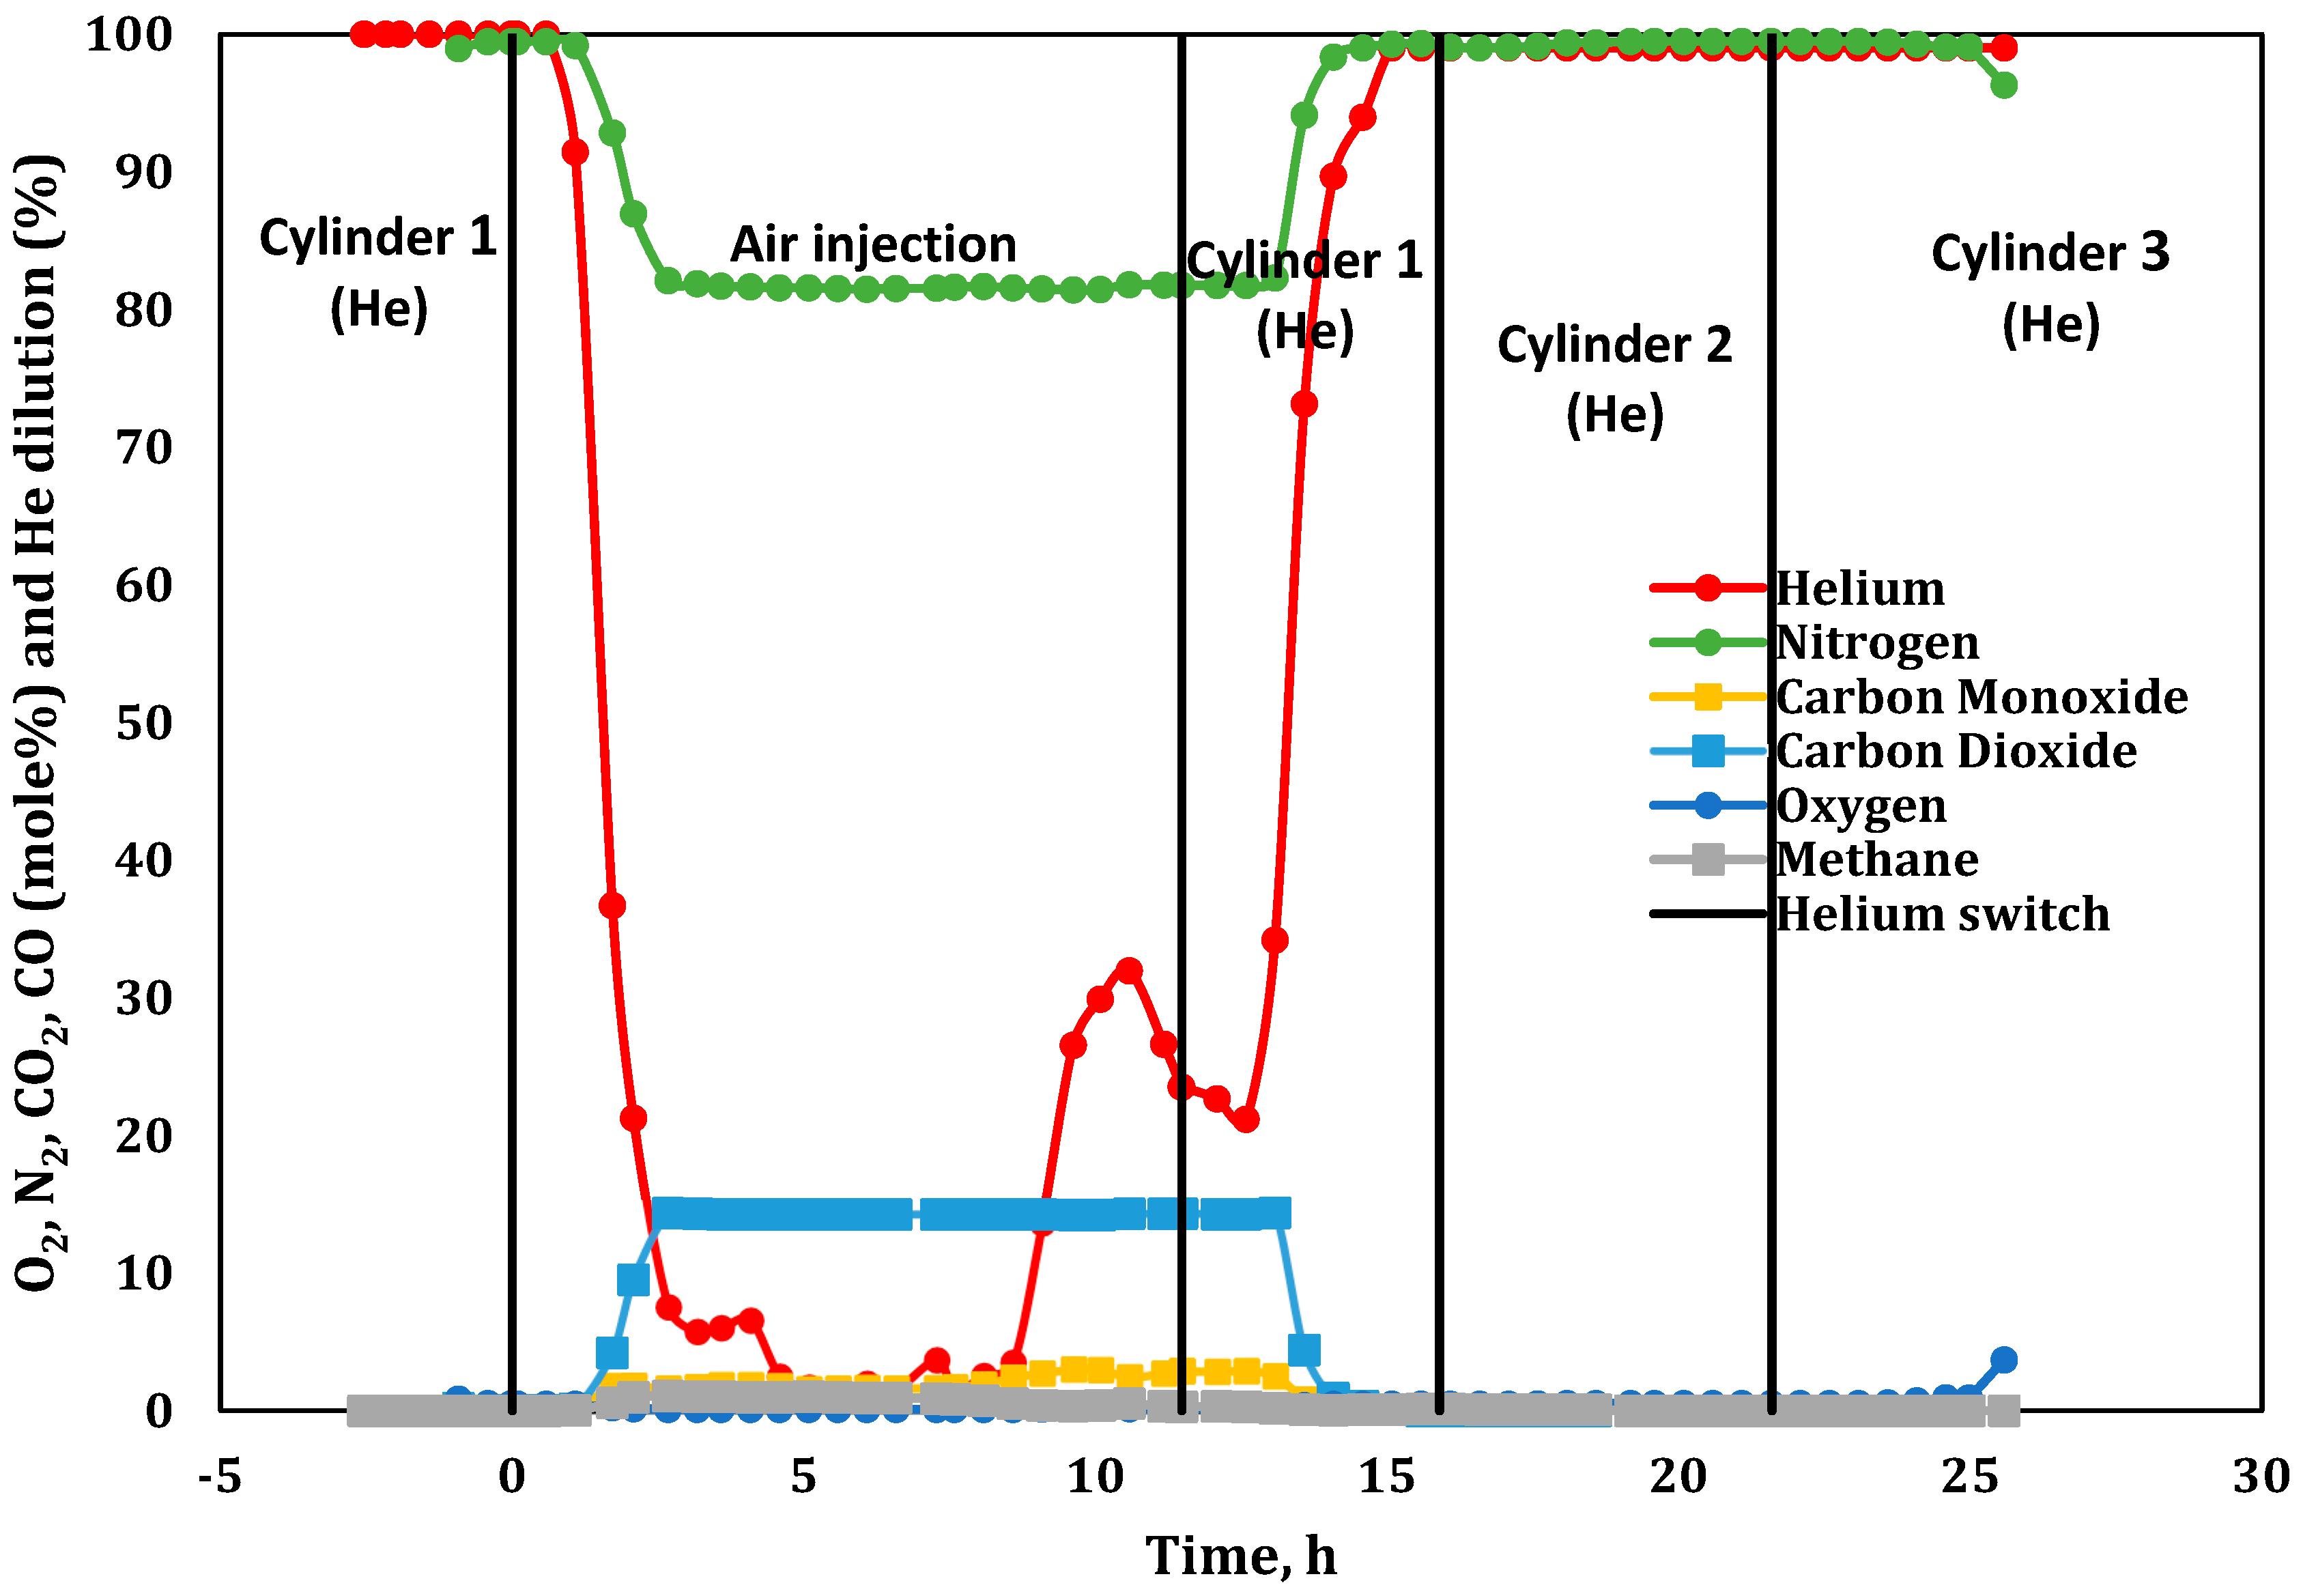
Cylinder 3 (He) was used to purge the remaining N2 from the tube. As the O2 content in the He cylinders was minute, it was excluded from the mass balance calculation. The behavior of the produced gases and the switching times from one injection cylinder to another are shown in Figure 9.
As expected, for an ISC test using air injection, the combined N2 and He (Cylinder 1) content in the effluent gas was detected throughout the experiment. Between 14 and 17 h, the N2 and He concentrations of Cylinder 1 (He) were 42 and 57%. At 15.8 h, when the gas cylinder was switched to Cylinder 2 (He) and after a 1.7 h delay, the gas composition changed to 72 and 27% for He and N2, respectively. After 21.6 h, the gas bottle was changed to Cylinder 3, which comprised pure He, allowing the N2 to be completely purged from the system. An unexpected increase in the He concentration in the product gas was observed during the 6.5 to 13 h period. First, a sharp increase from 0 to 3%, followed by a decline to 1.5%, was observed. At approximately 8.5 to 9 h, the He concentration increased to more than 30%, indicating a leak from the He-filled annulus.
Figure 10 focuses on the produced gas components with a concentration of less than 2 mole % in the produced gas (O2, light hydrocarbons, H2S and H2). The O2 present in this plot was associated with the injected air and the contaminated He from Cylinders 1 and 2. The O2 concentration disappeared after switching the injection gas to Cylinder 3.
The rate of the produced gas (see Figure 11) showed an increased product gas flow associated with a leak from the pressure jacket. It was found near the core pack outlet or production line. Vertical black colored lines indicate the switch from helium to air and back to helium injection.
One of the highest percentages of the produced gas stream was associated with the CO2 concentration. It was apparent from the high CO2 concentration and N2 concentration, which was lower than 79%, that more CO2 than the combustion reactions could have produced was generated. This required careful analysis to establish whether the origin was related to the oil or dolomite core. Normally, when a CT test is performed within a sandstone reservoir, the CO2 production range is approximately 12–14%. In this study, the CO2 production was greater than 30%. The decomposition of the dolomite core samples was confirmed by the loss-on-ignition test.
To introduce corrections to the gas composition, some assumptions were made based on the extensive experience and observations of the ISCRG:
1. The mixture of helium and nitrogen that was added before the air injection was treated as pure He, and the N2 component was “removed” using high He dilution ratios. The term “helium dilution” refers to the proportion of gas that is He. Using this factor, the gas composition was expressed as if there was no He present.
2. The He dilution factor was also used to correct for the He leak.
3. The CO2 was divided into two parts: (a) oxidation/combustion reactions and (b) dolomite core decomposition.
From the CT experiments, two ratios based on the produced combustion gas mole fraction compositions were calculated and compared to the typically reported values, viz.,
(a) (CO2 + CO)/CO = 6
(b) (CO2 + CO)/N2 = 0.21
It is recognized that, in some cases, these values may vary; however, the above is a reasonable approximation that can be used for this study. Using these ratios, the excess CO2 was assigned to dolomite decomposition as the difference between the total CO2 detected by the GCs and the calculated CO2 associated with the oxidation/combustion processes. The decrease in CO, recorded after 13.58 h, was considered during the computation of CO2 using the (CO2 + CO)/CO molar ratio. CO2 gas is usually accompanied by CO, which, to some extent, is represented by a constant molar ratio if a stable combustion period is observed. After the air injection termination, the CO production declined. After 15 h, the measured COx resulting from the combustion reaction was assumed to be zero, and all the subsequent CO2 was assigned to dolomite core decomposition.
4. A combination of the He dilution factor and prior knowledge based on past experiments conducted under similar pressure conditions were used to correct for the N2 contamination effect during the purge. The CO2 gas generated as a result of dolomite decomposition was not included in this correction practice, as it was treated as a separate stream.
The modified gas composition of the produced components is presented in Figure 12 and Figure 13, demonstrating stable burning in the bond scission mode that takes place in the HTR. The declining He dilution was tracked from the time when the air injection began to 8.5 h, when a distinctive peak was detected, indicating a leak from the annulus tube. Overall, the unexpected He stream made up approximately 2% or 160 L(ST) of the total effluent gas during the air injection period. As with previous figures, the black-colored vertical lines indicate the switch times between the various gas bottles, labelled on each figure.
The light hydrocarbon gases, as presented in Figure 13, were most likely products of the thermal cracking reactions and displayed a stable production during the experiment. The H2 and CH4 curves showed an increased or continuous stream after the air was shut down. The H2 disappeared after 13 h once the He dilution factor approached zero.

3.2. Combustion Parameters Based on Product Gas Analysis

When designing an ISC-based project for a field scale, the air and fuel requirements are the most important parameters. They are often estimated from laboratory experimental studies mimicking reservoir conditions [2]. Generally, when the ISC is operated using a dry or normal wet regime, the common air and fuel requirement values for heavy oils are 240 m3(ST)/m3 and 22 kg/m3, respectively.
In the traditional literature, the calculation of the fuel requirements is based on the C and H2 balance, i.e., on the produced volumes of CO2 and CO, assuming that all the H2 is consumed to form water. The ISCRG practice aims to obtain the fuel based on the injected air requirements and estimate the fuel based on the air/fuel ratio (AFR). This avoids uncertainties related to water formation and fuel oxygenation. Using combustion stoichiometry, the burnt carbon was computed considering the amount of carbon oxides produced, while the apparent H2 was estimated assuming that all the reacted O2 was consumed to form carbon oxides or water. It is known that a portion of the reacted O2 is consumed by LTO reactions, but an accurate water balance is required to separate the O2 consumed to form water from the O2 consumed by LTO reactions. This is why the H/C ratio is normally referred to as the apparent H/C ratio. All the equations used to calculate the apparent H/C ratio, AFR, fuel and air requirements and other parameters mentioned here can be found in Barzin et al. [36].
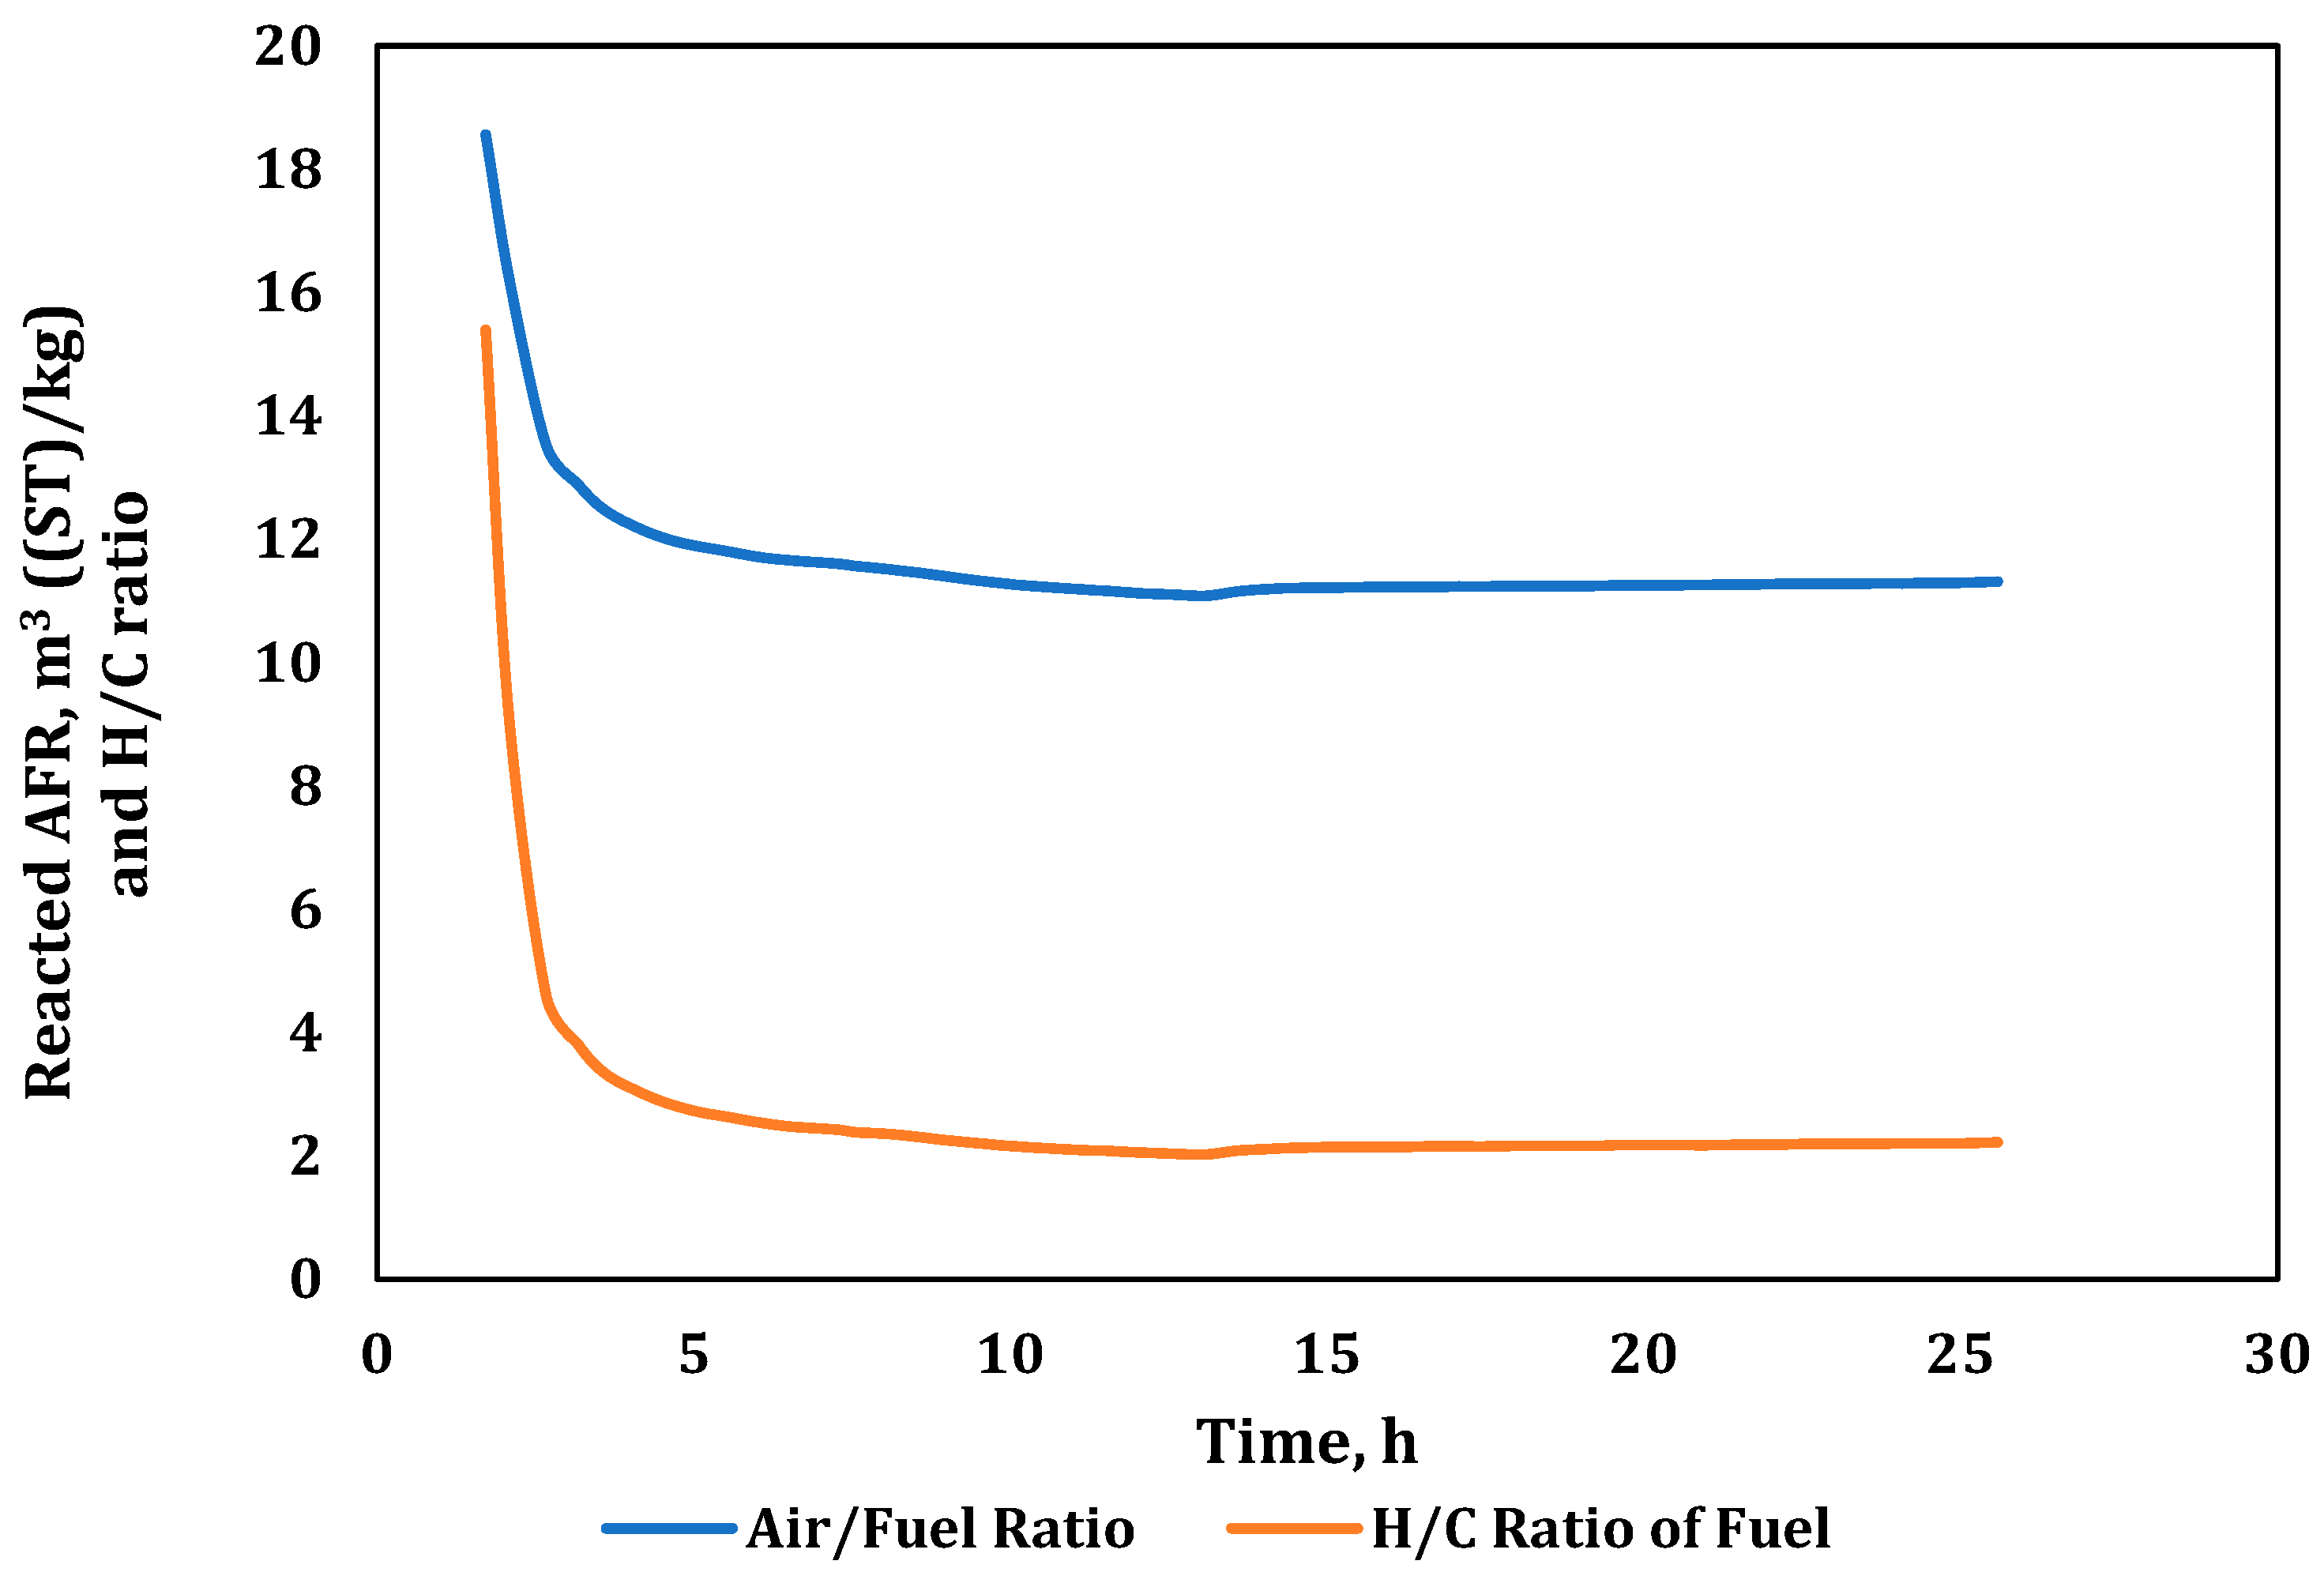
The calculated values of the apparent incremental H/C and air/fuel ratios presented in Figure 14 exhibited stable burning after approximately 3 and 6 h, respectively, from the beginning of the experiment. The AFR parameter range varies between 10.8 and 15.0 for heavy oils and bitumen [37,38] and 10.8 to 12.5 m3 (ST)/kg for light oils [39].
Tracking the apparent H/C ratio curve, the values at the start of the experiment were much greater than 3, indicating that the combustion propagation was operating in the O2 addition mode [2]. At the same time, an increase in the CO2 concentration following stabilization was observed (see Figure 14). The stabilized apparent H/C ratio displayed an average value of 2.1.
A summary of the air (O2)–fuel parameters, O2 utilization and the volume of gases produced can be found in Table 6. These values were obtained based on the burned volume of the composite core of 11.3 × 10⁻³ m3 or 78% of the CT volume.

3.3. Post-Test Procedures

After the samples were collected, a sequence of techniques was applied to fulfill a material balance based on a comparison of the initial and post-combustion weights of all the components. This included (1) Soxhlet extraction of the remaining oil from the crushed core; (2) water measurements using the Dean–Stark apparatus; and (3) a loss-on-ignition test using a 600 °C furnace.
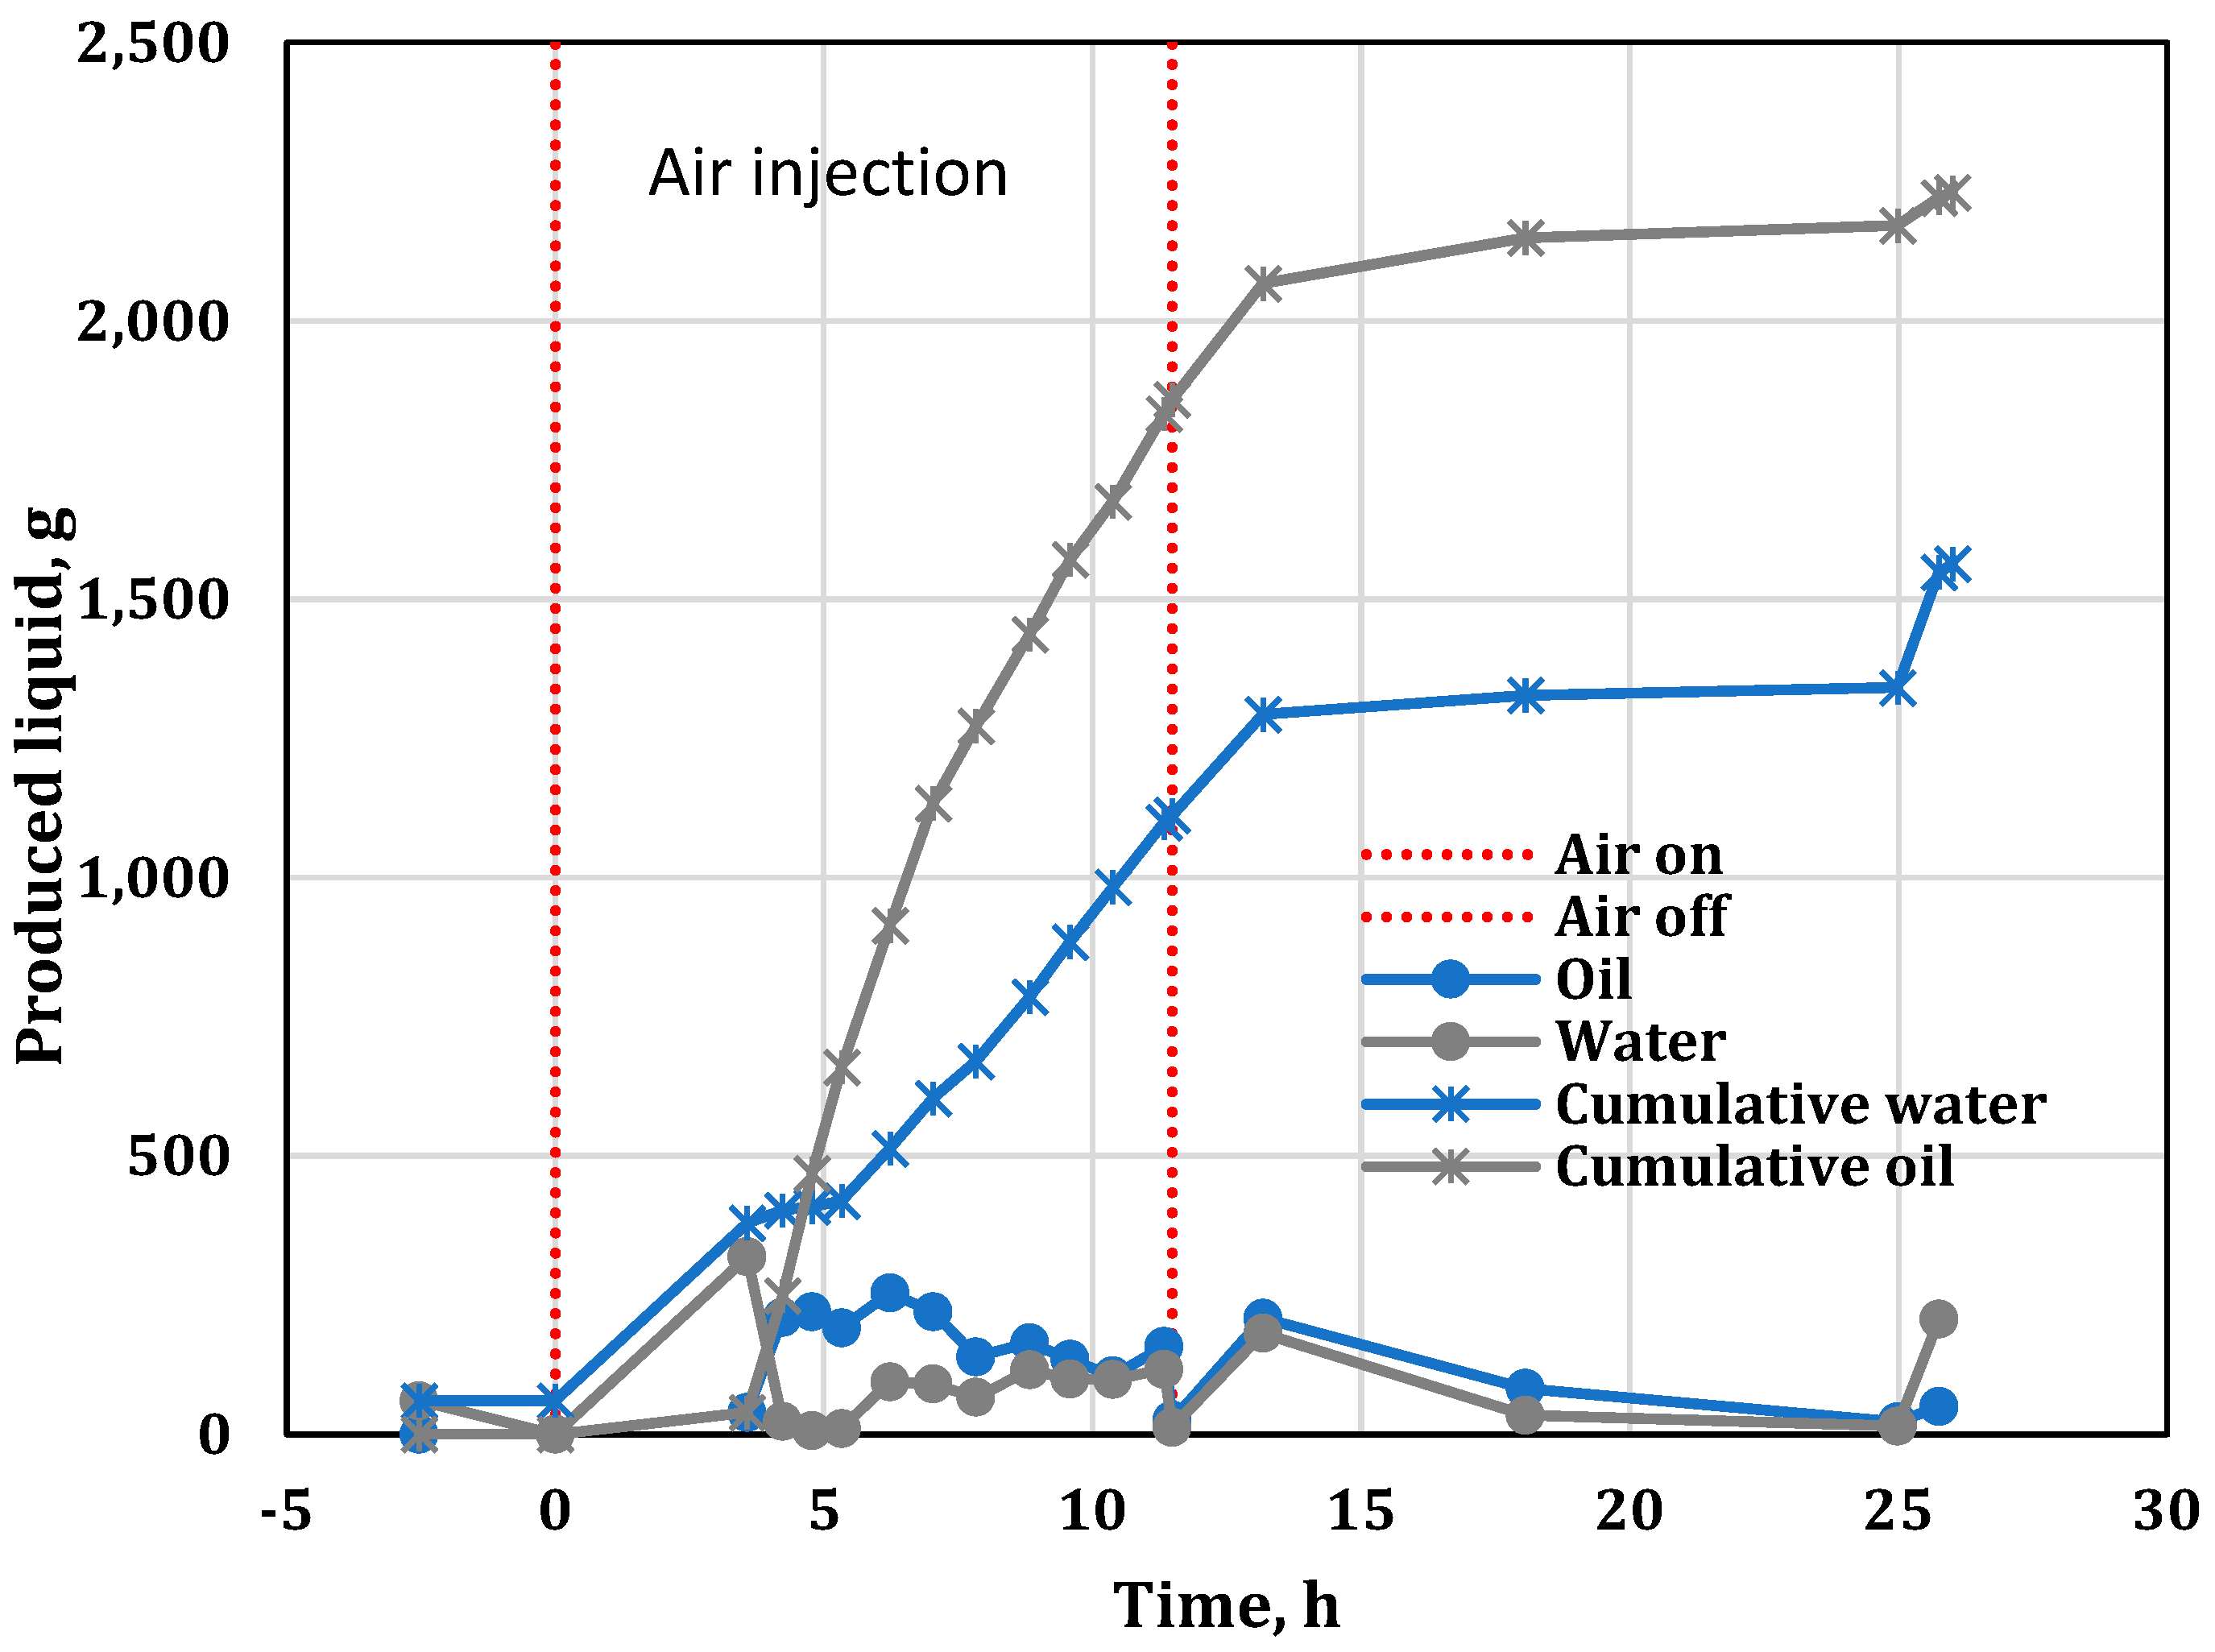
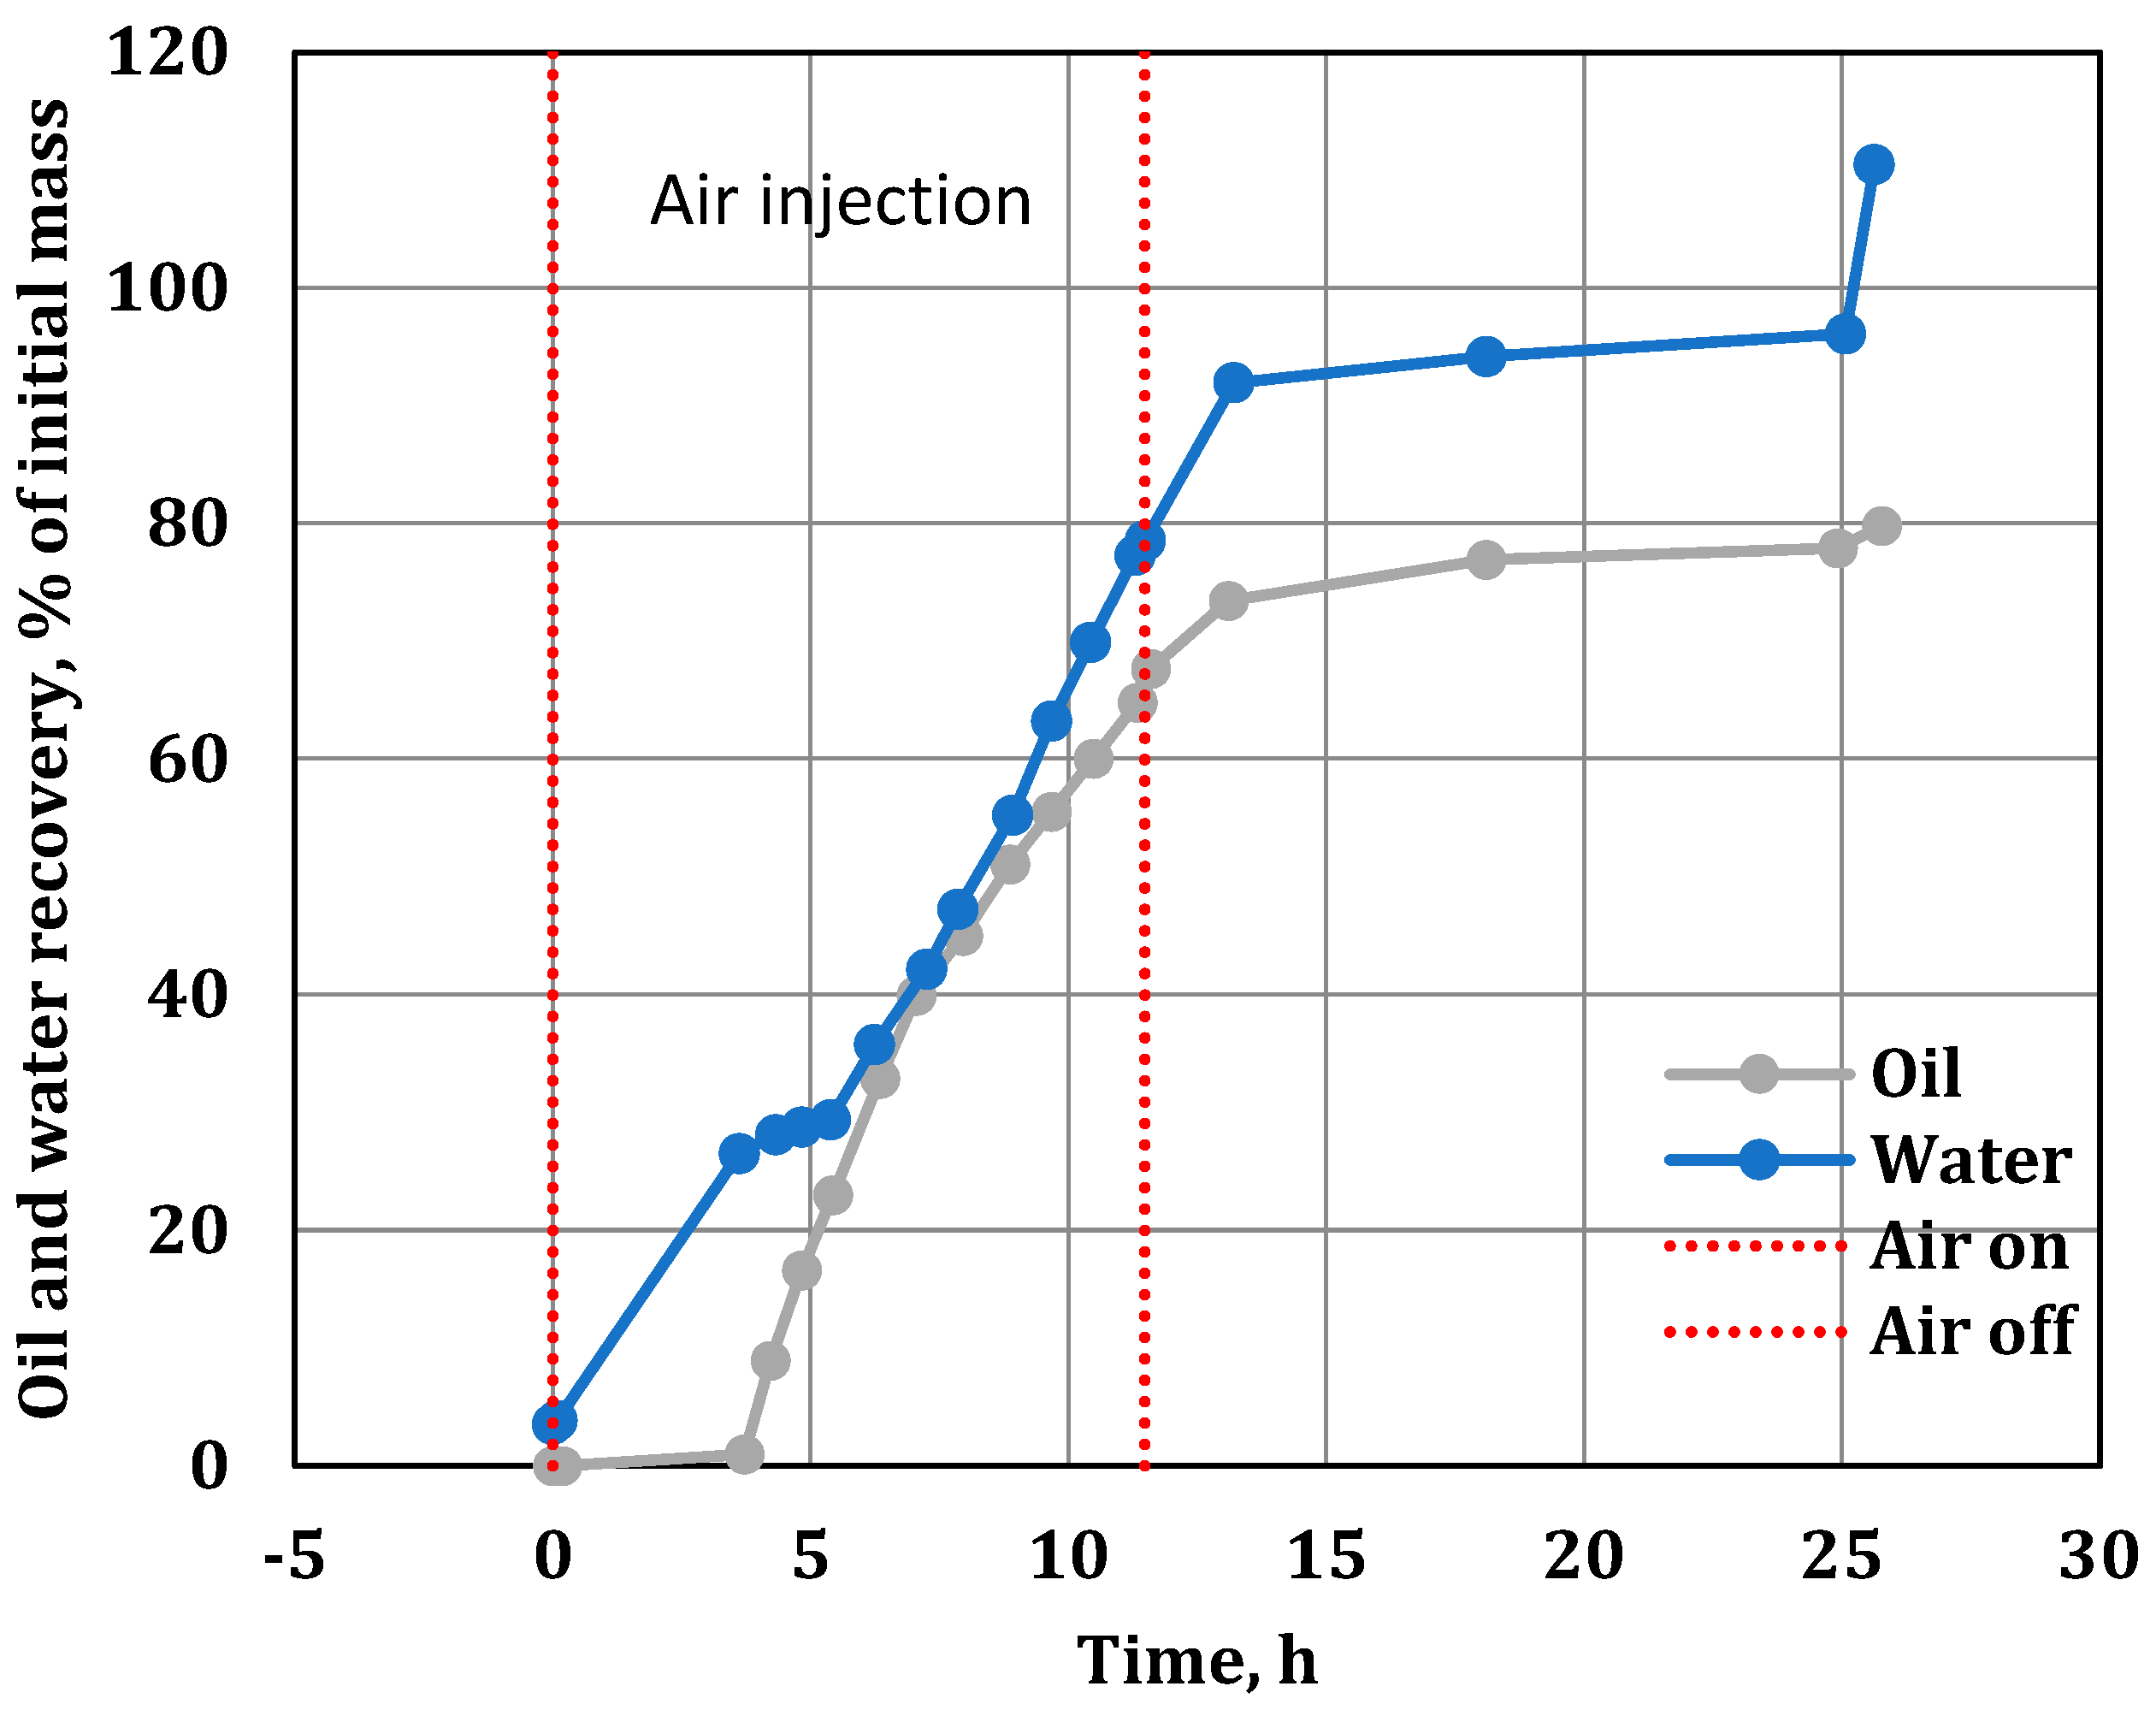
During the experiment, periodic samples of the fluids and gases were collected. The incremental and cumulative water and oil produced are plotted in Figure 15.
The pressure-up stage produced 60.3 g of water free from any oil content. As expected, due to the additional water volumes generated by the bond scission reactions in the HTR, the water recovery at the end of the experiment was more than 100% of the initial water (Figure 16).
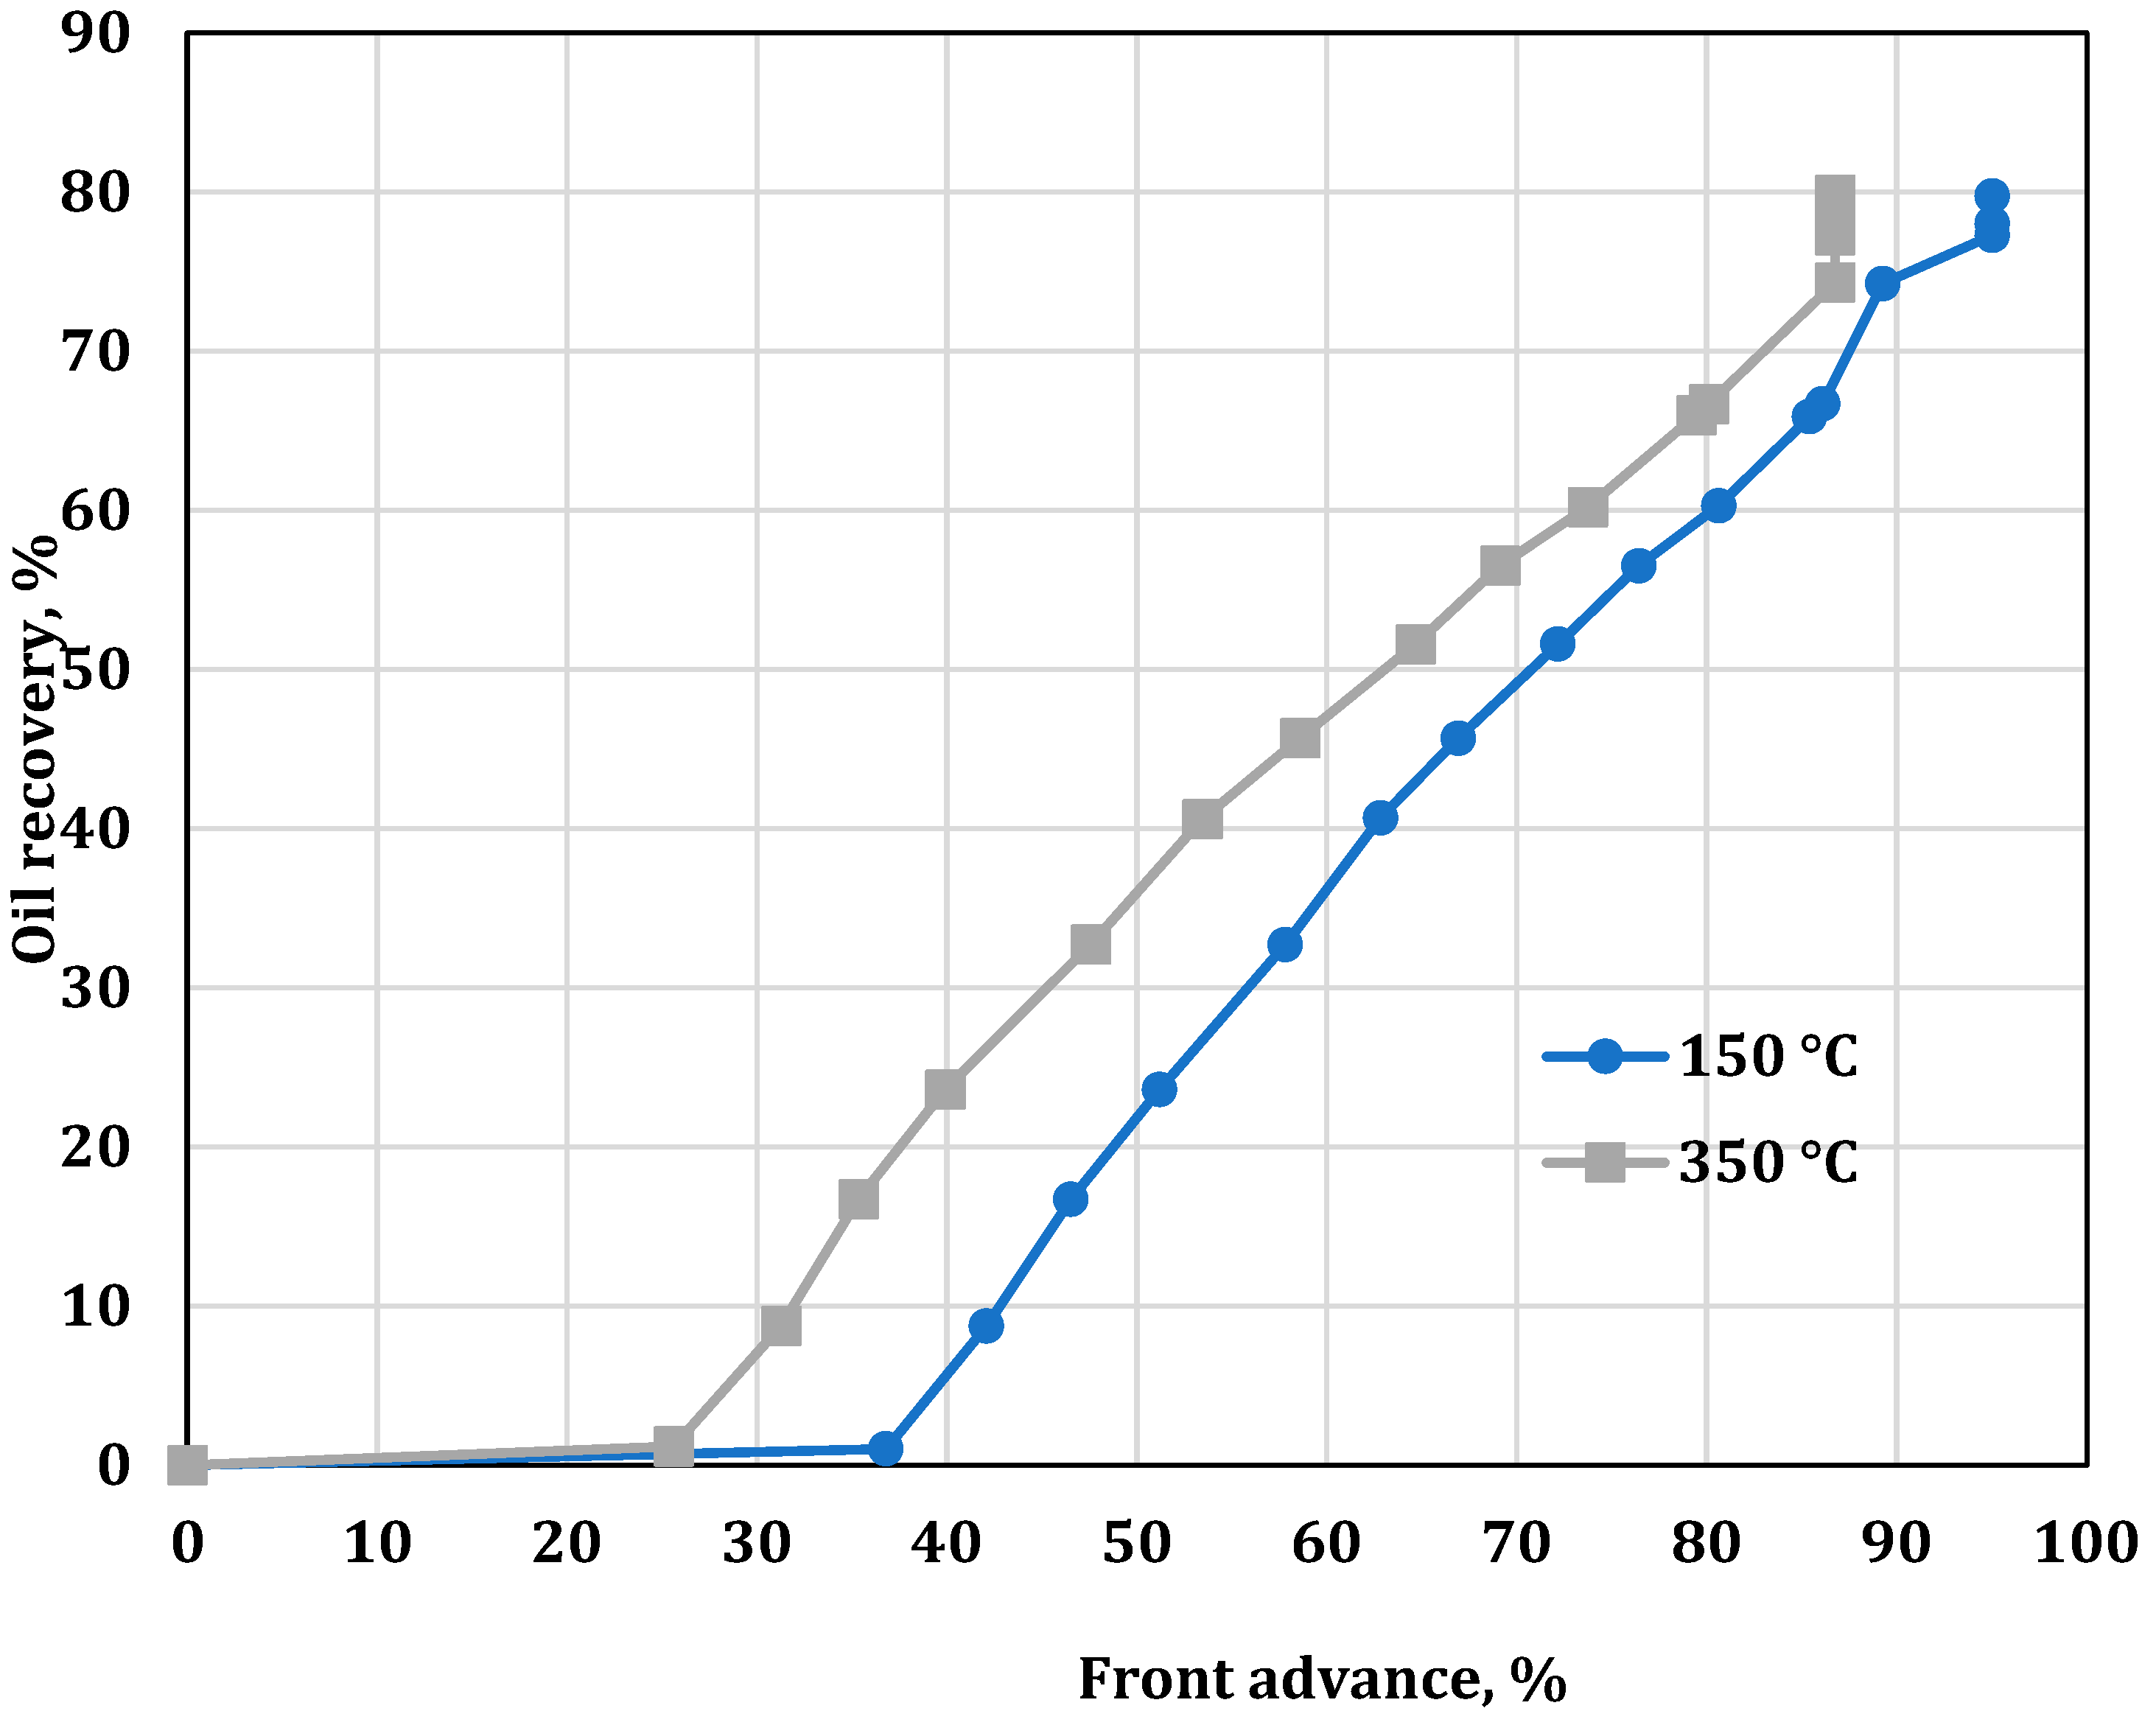
Following the alignment of the produced oil with the 150 and 350 °C front advancements, as shown in Figure 17, the oil recovery began after 25% of the composite core was swept by the 150 °C-level heat wave. The delayed recovery was associated with the saturation procedure, which was different from regular restored-state core flooding. Physical pre-mixing of the core with oil and water prior to packing in the core holder was performed to achieve a specific fluid saturation while avoiding any disturbance of the core plugs and associated artificial vugs. As a result, the crushed core pack surrounding the core plugs contained an initial gas saturation.
As shown in Figure 17, the oil recovery factor was 80% (2231.5 g of the original oil in place (OOIP)), even though only 78% of the composite core was swept by the high-temperature combustion front.

3.4. Compositional Analysis

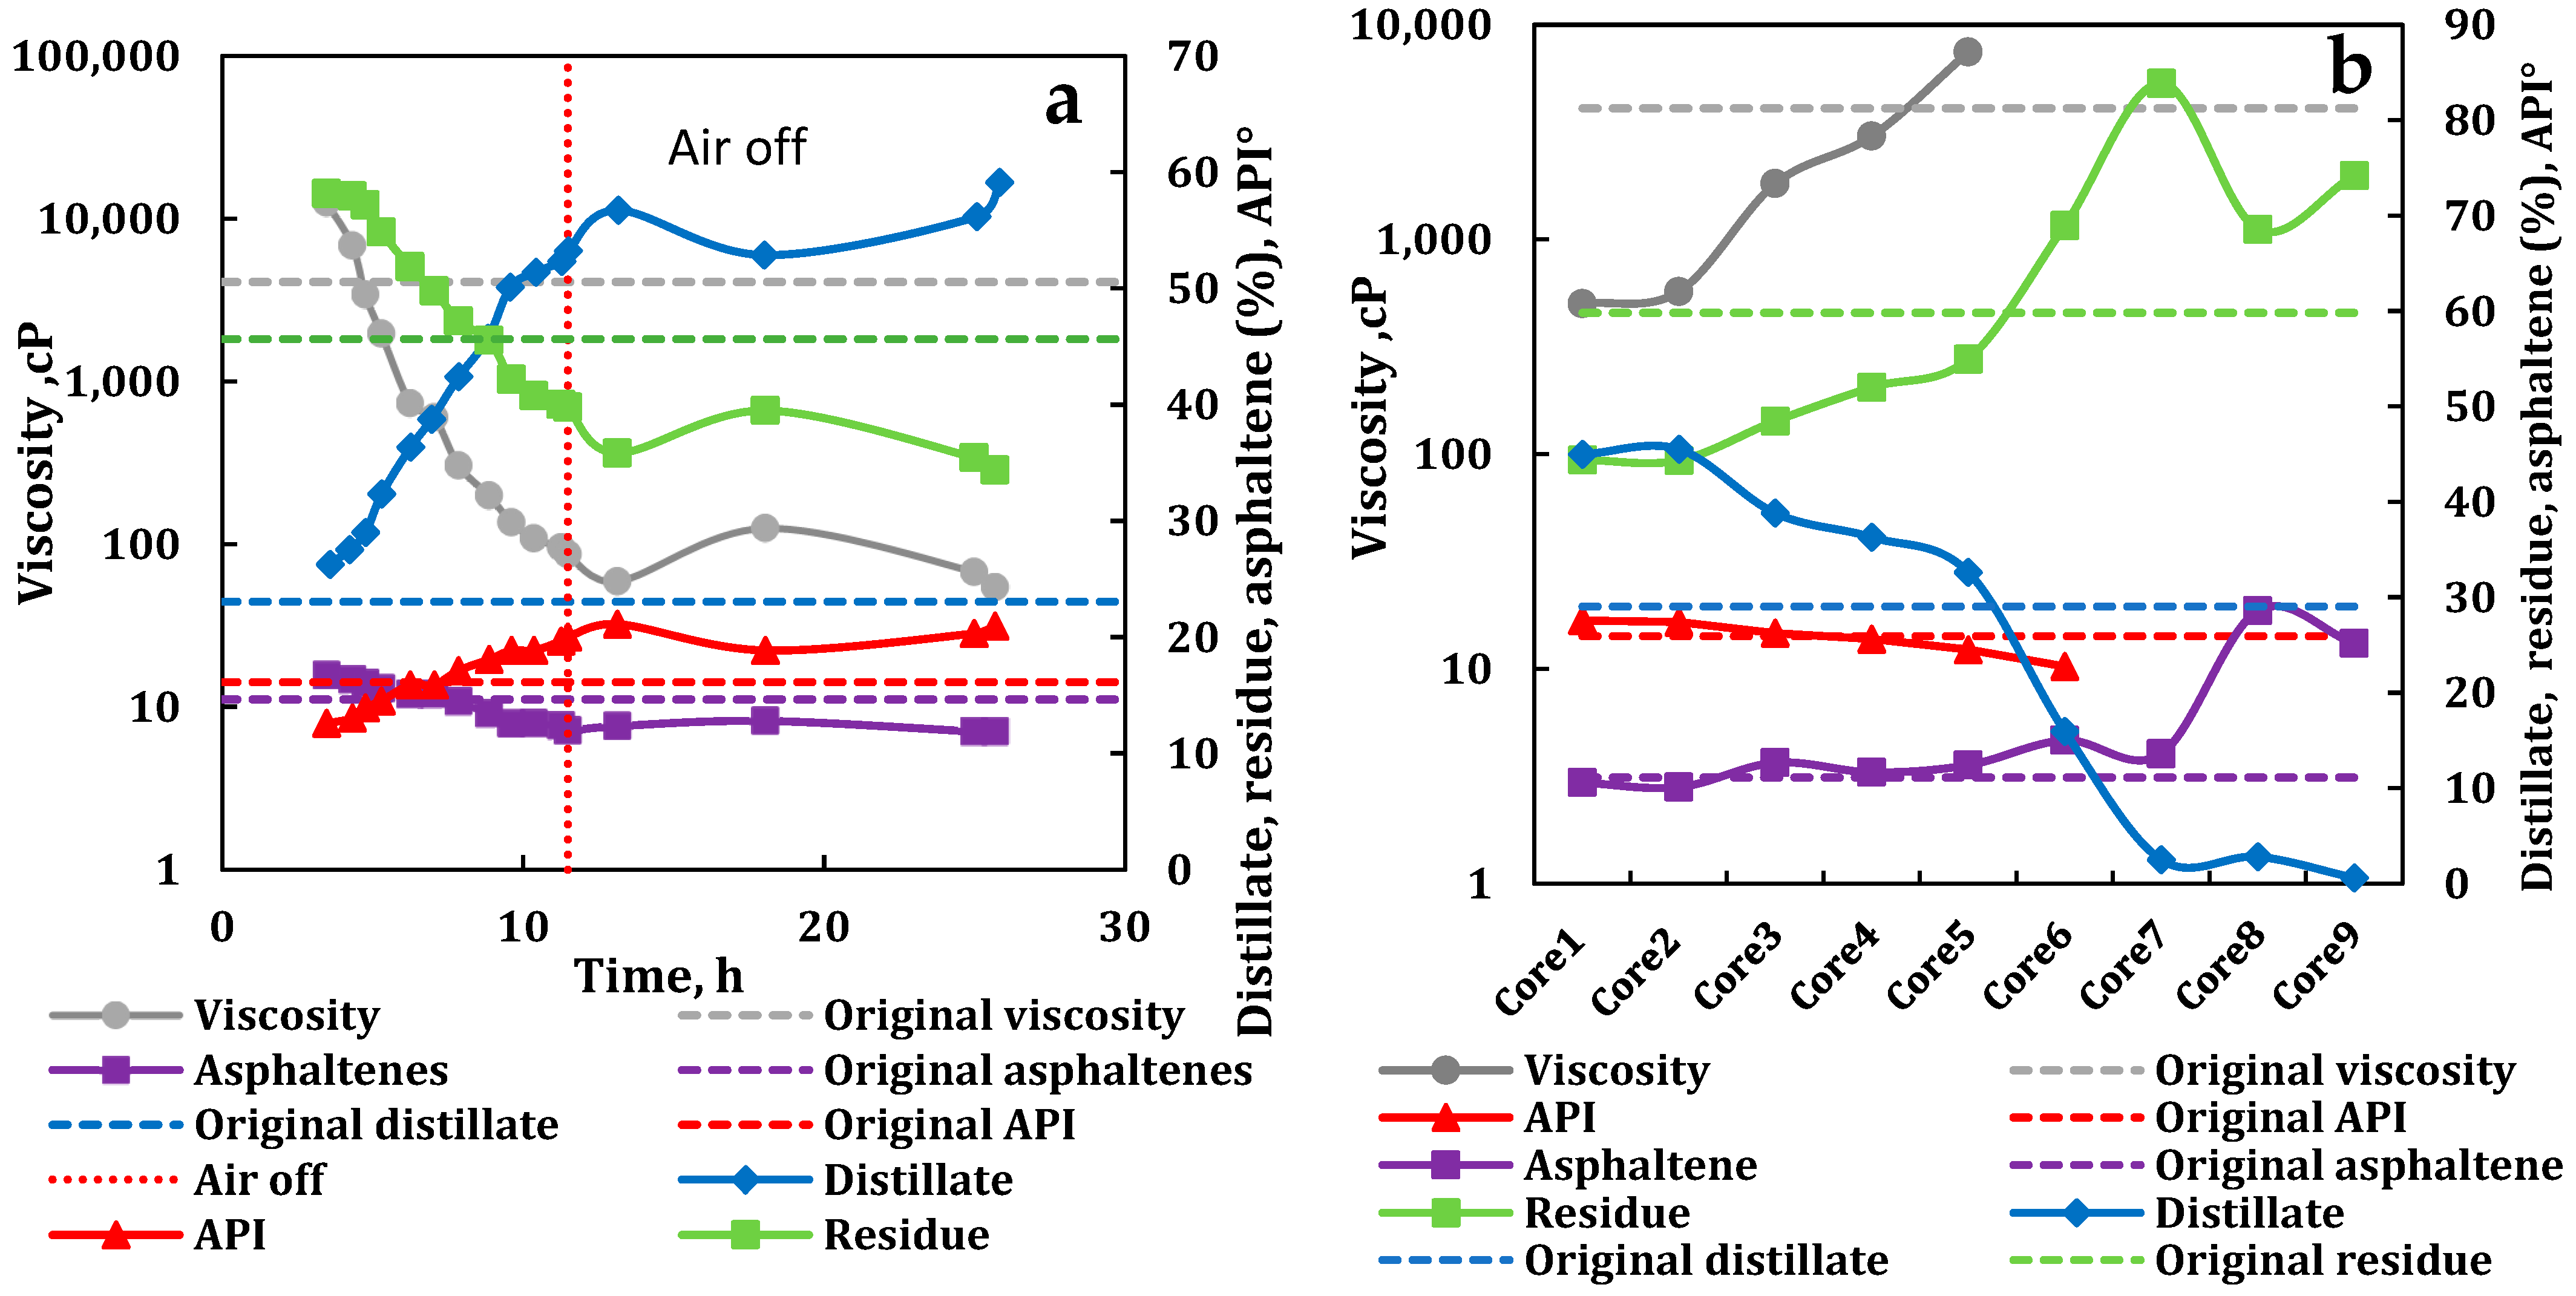
The oil samples were analyzed for changes in viscosity, density, the asphaltene content, elemental analysis of CHNSO (obtained using LECO CHN-2000 and Antek 9000 analyzers, with the oxygen calculated as the difference between the measured CHNS components, assuming CHNS+O made up 100 mass %), cut-point analysis (obtained using ASTM D7500) and composition of saturates, aromatics, resins and asphaltenes (SARA). Figure 18 reflects the viscosity change obtained from the produced oil samples. During the air injection process, the viscosity of the produced oil significantly decreased.
In Figure 19, a continuous upgrade of the API gravity and viscosity (measured at 25 °C), along with the asphaltene content reduction, can be observed. The results of the simulated distillation percent, showing the split between distillate (400 °C- fraction) and residue (400 °C+ fraction), confirm the upgrading of the produced oil samples.
The extraction of the core samples started from the production end. Core 1 and Core 2 correspond to the sample located at the production end, representing frac sand with the meshes of 16 and 20/30, respectively. As expected, the hydrocarbons remaining in the core exhibited a higher asphaltene content because the original oil-heavy components precipitated onto the surface of the mineral skeleton. The highest accumulation of asphaltenes was observed in areas beyond the point where the air injection stopped (corresponding to the collected sample Core 8), where a coke-like wall was evident.
The average oil upgrading values for the samples produced during the run were as follows: API°—from 14.2 to 17.4, asphaltenes—from 11.13 to 9.7 wt.% (12.8% decrease), distillate @ 400 °C—from 29 to 44 wt.%, and residue @ 400 °C+—from 60 to 45 wt.%. Note that the viscosity values deviated significantly and started declining after 4.8 h of the ISC operation. Thus, the viscosity varied from 4091 to 59 cP (measured at 25 °C), with the trend decreasing as the produced oil samples corresponding to the combustion front approached the production outlet.
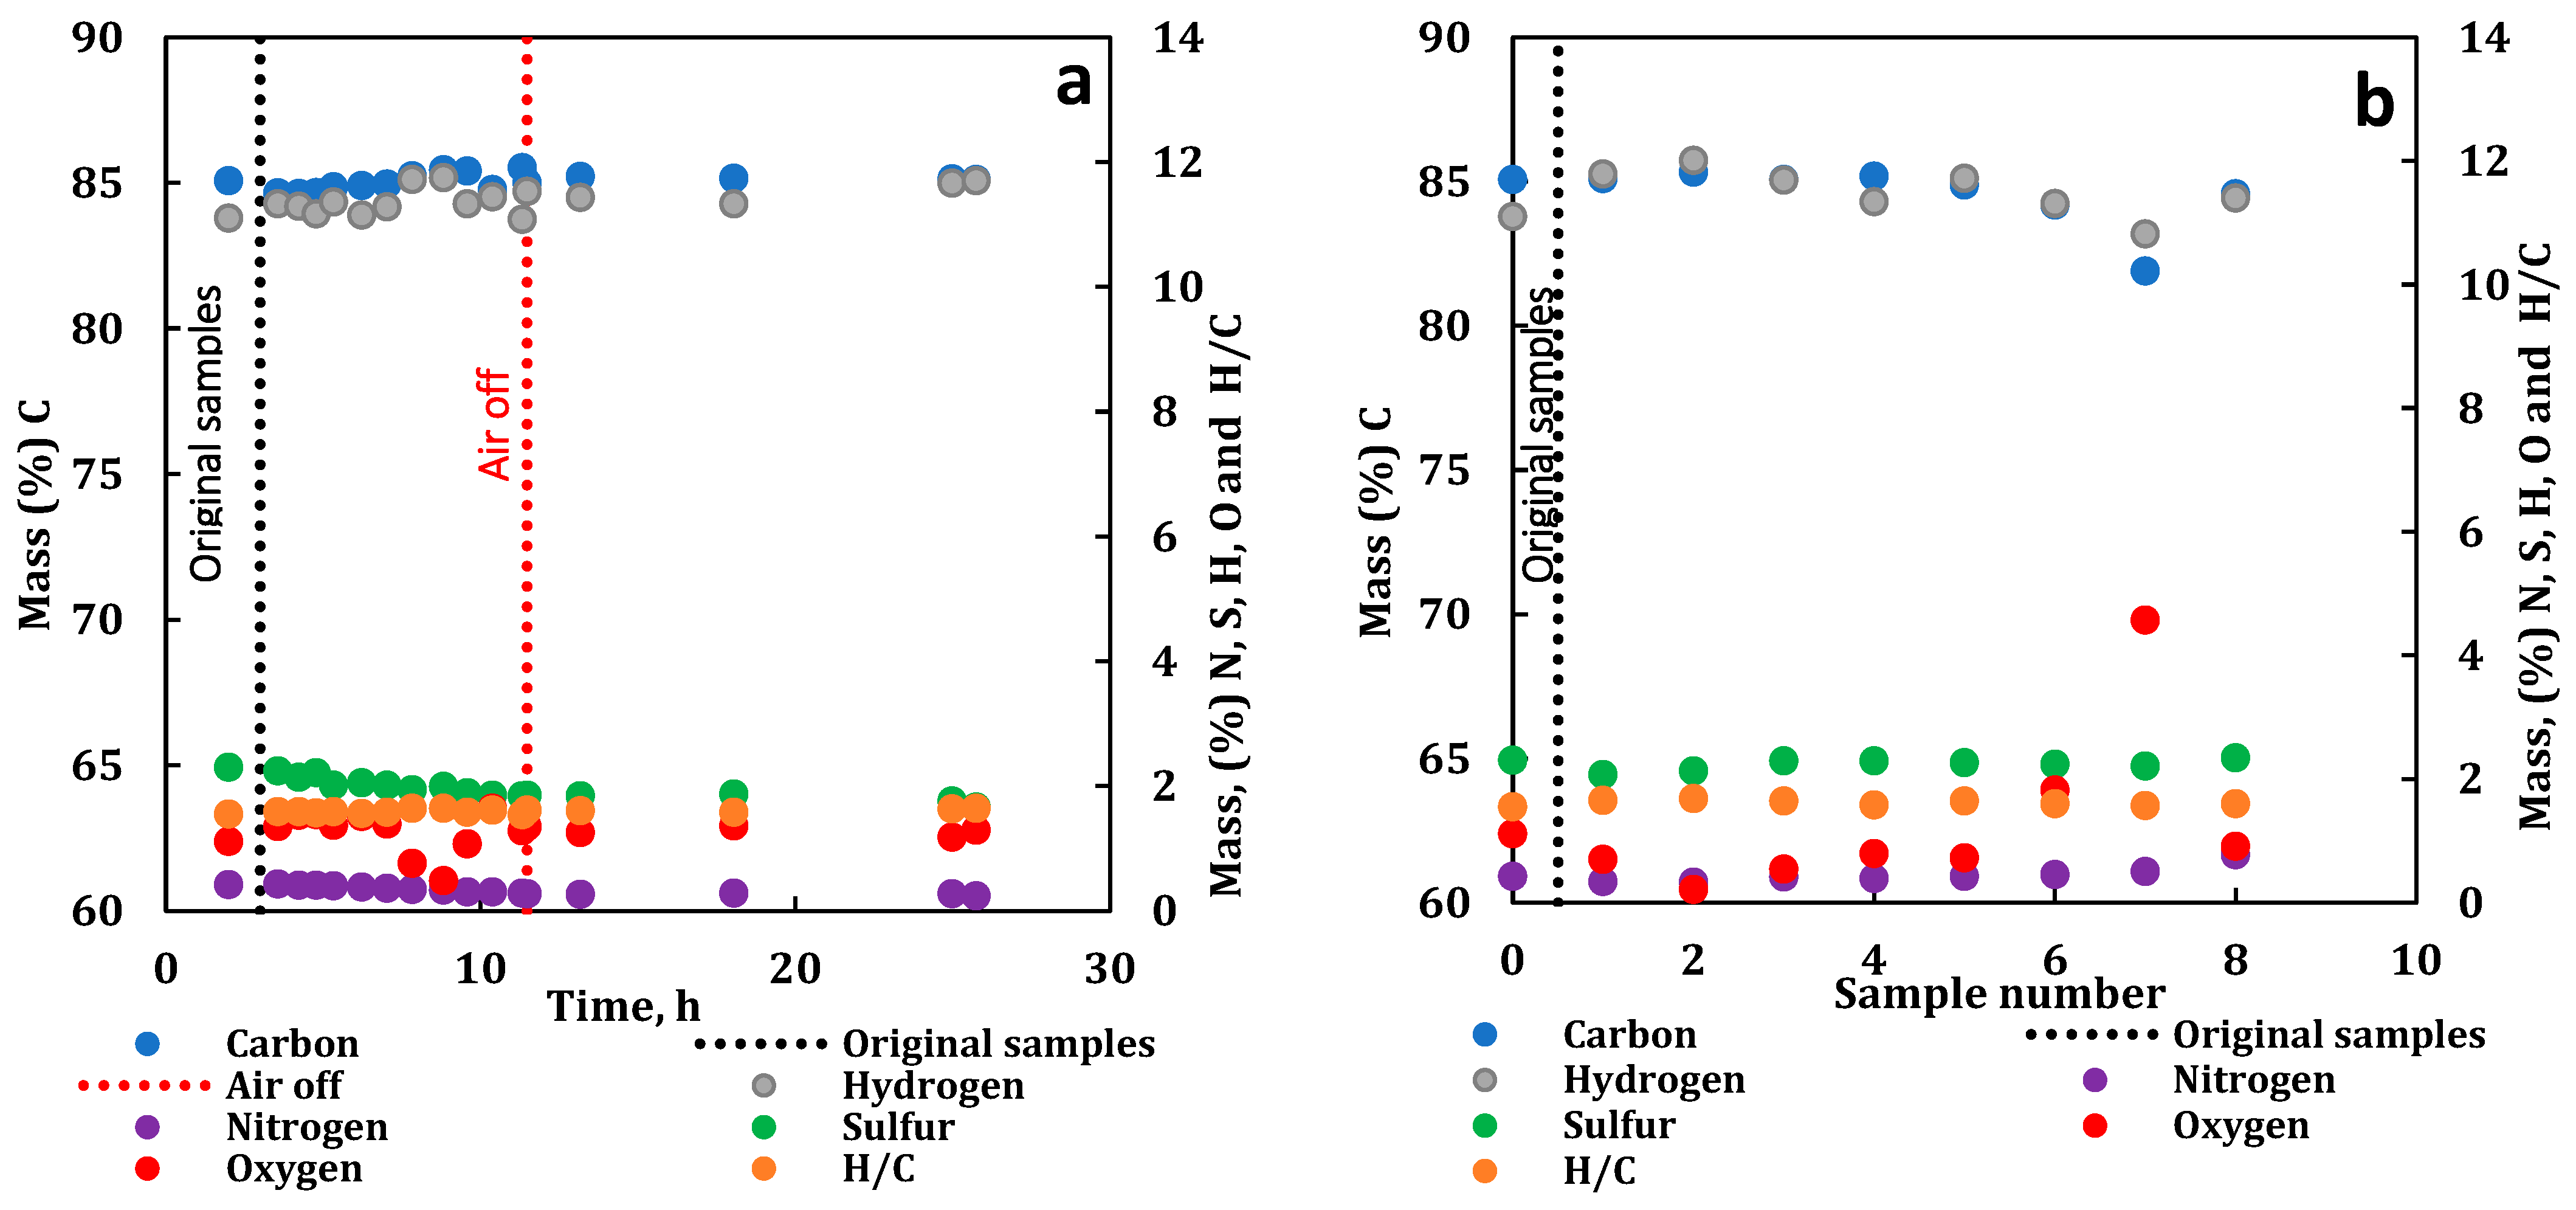
Due to the insufficient amount of extracted oil, viscosity and API gravity measurements of some of the extracted samples were not possible. The produced oil samples and the extracted residual oil samples demonstrated a slight change in the values of H and S, while the rest of the elements (except for O) presented a stable mass fraction throughout the run (Figure 20). The oxygen mass noticeably reduced between 7.0 and 8.8 h, slowly increasing towards the end of production.
Using the simulated distillation results, cut-point analyses were performed from the initial boiling point to 700 °C+ on both types of produced liquid oil samples: the oil produced as liquid during the test and the toluene-extracted oil from the excavated core. The data indicate that most of the oil upgrading was associated with an increase in the light-intermediate components (C4 to C20) and a reduction in the asphaltenes and heavier ends (C44 to C100). Some discrepancies were observed in the oil property results obtained from the core extractions. While an increase in C44 to C100 was observed, the concentration of the lighter components, C4–C20, were underestimated in the oil samples, as they were exposed to toluene extraction (Figure 21). Thus, the average percentage of the increase in the concentration of C4 to C44 in the produced oil samples was approximately 30%, 54% of which was associated with the increase in the C4–C20 fractions.
While in situ oil upgrading obtained through the other thermal methods is mainly a function of the temperature rise and asphaltene precipitation, in the case of ISC, the upgrading occurs due to the bond scission reaction, and the products may have a significantly lower carbon number content [40].

3.5. Water, Oil and Coke Analysis

The water analysis of the produced samples included the following tests: pH, total solids and selected cation and anion measurements. The redox environment, a pH of 7.0 to 7.4, was quite stable, demonstrating that the core material likely buffered the aqueous phase.
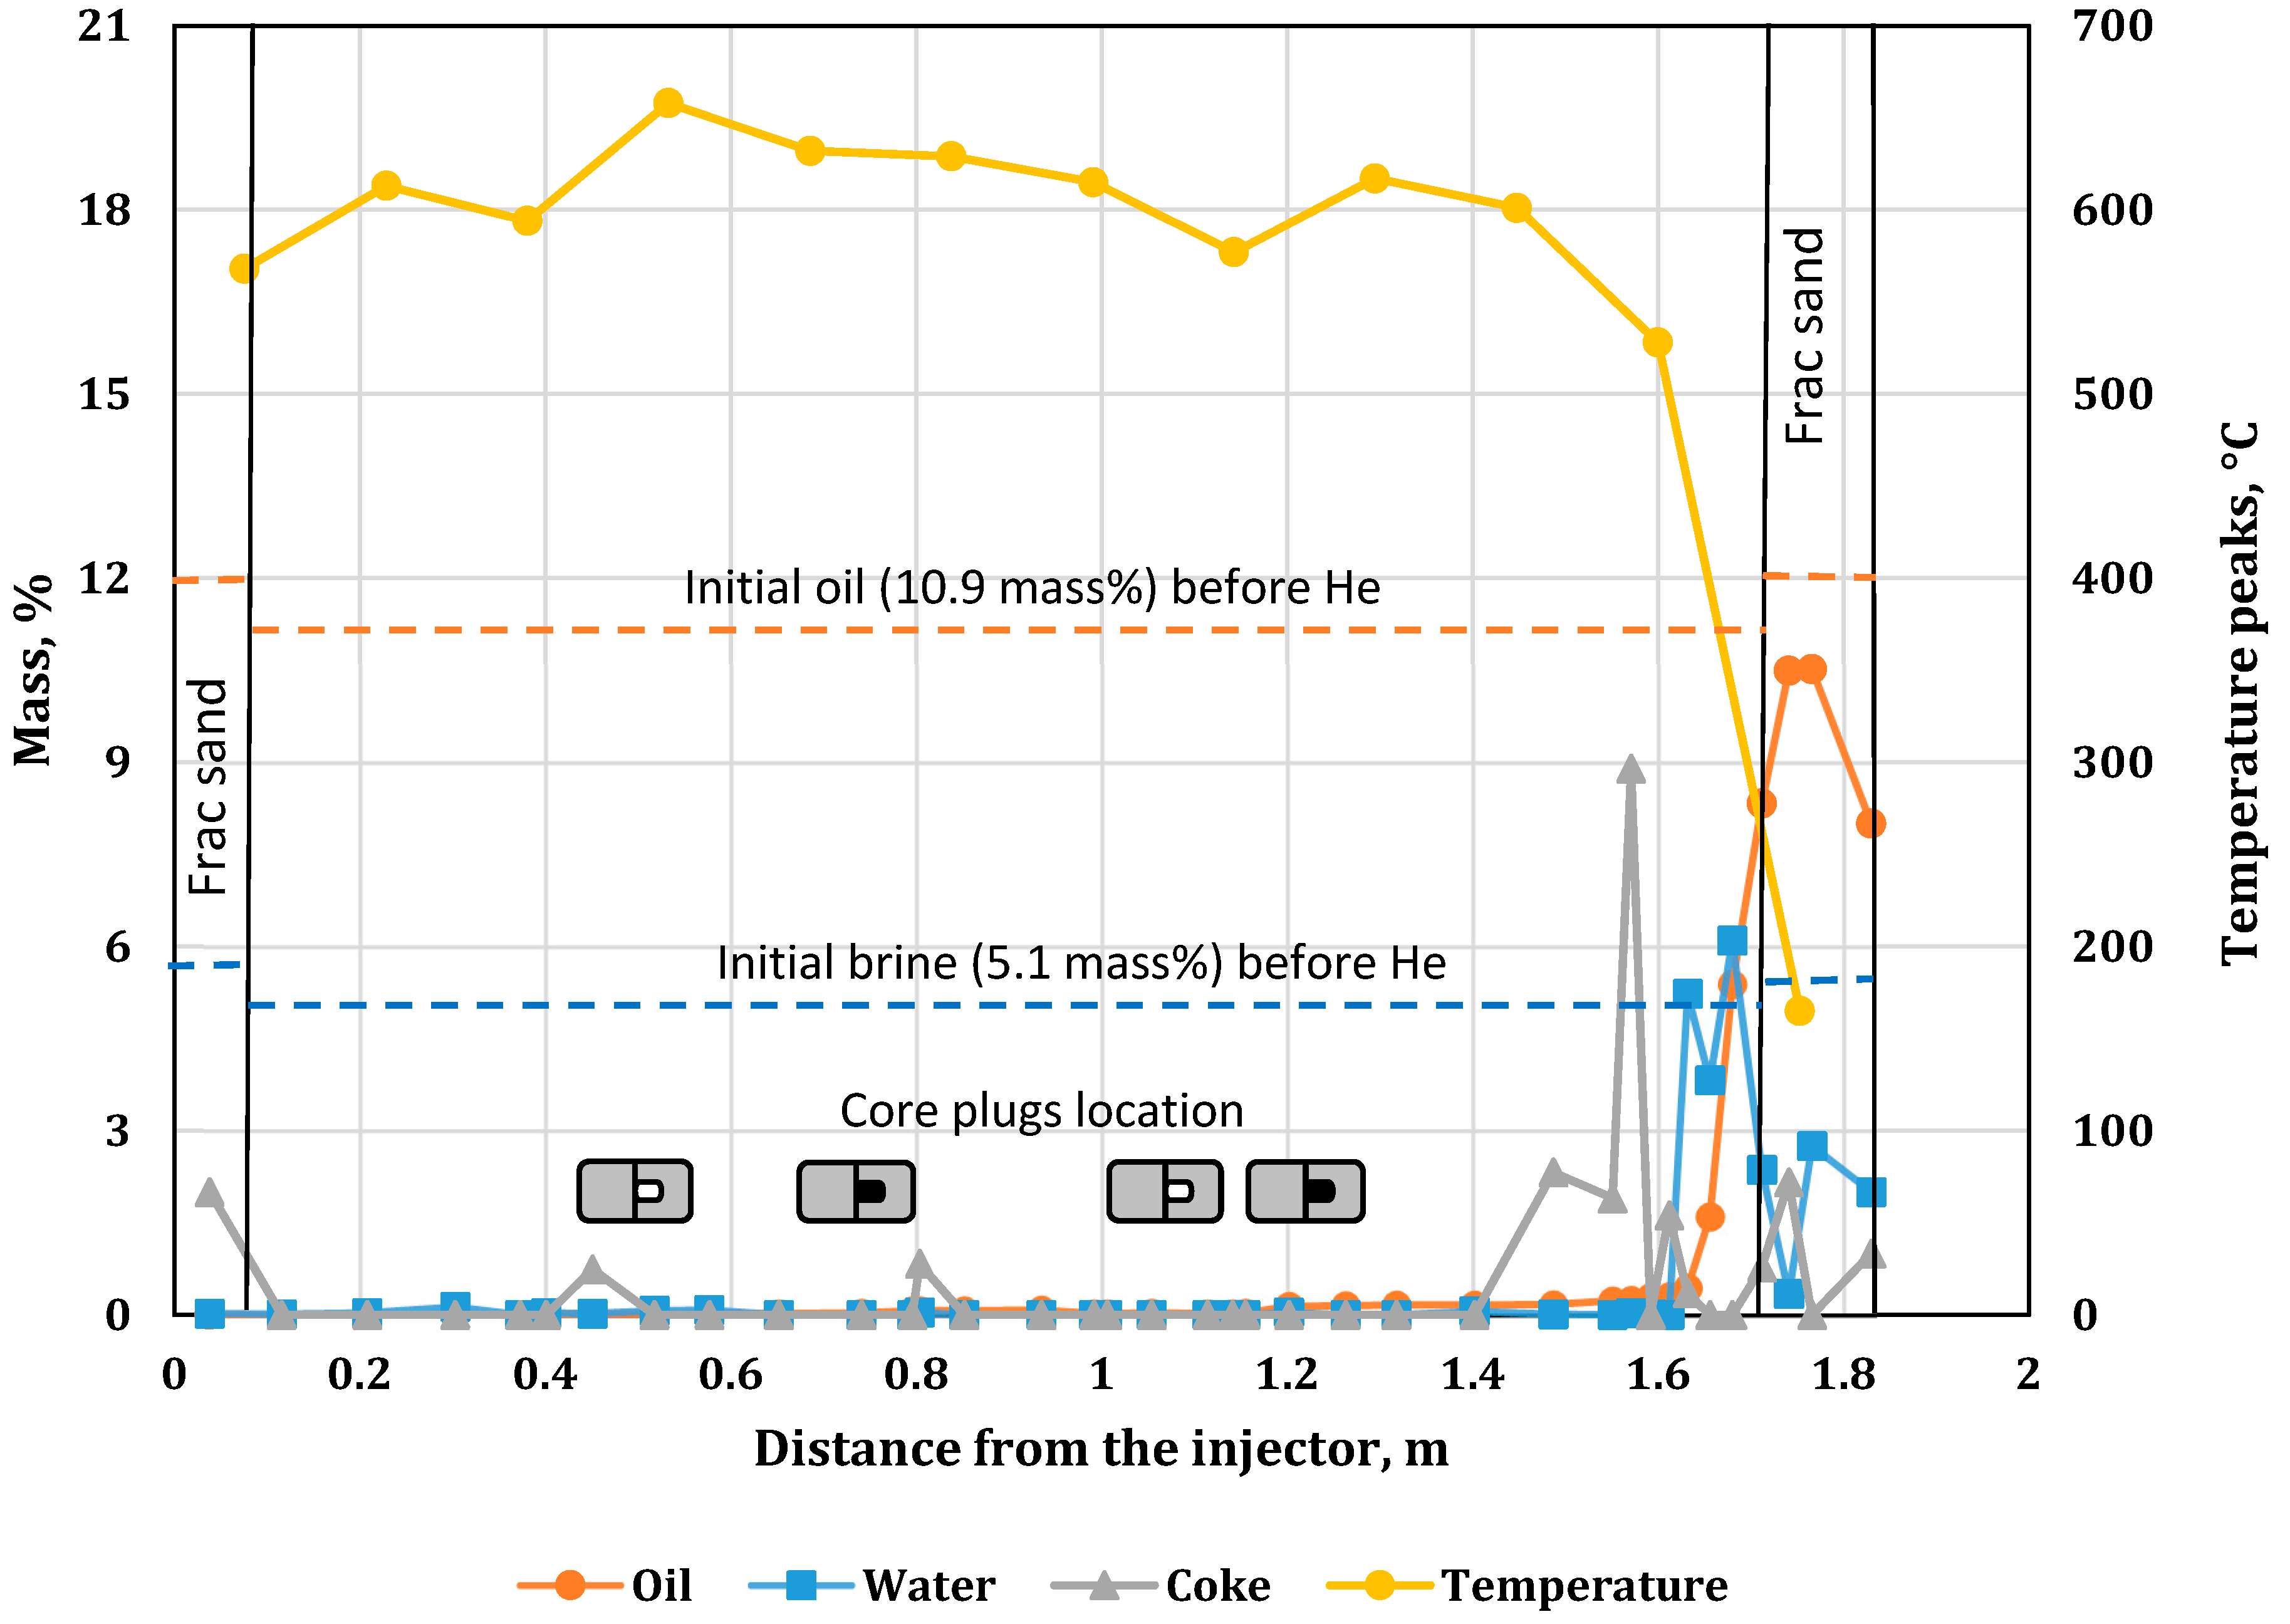
Figure 22 shows the location of the fluids and coke saturations along the CT, including the observed temperature peaks. The legend “Core plug locations” highlights the location of the core plug sets with artificial vugs that are either empty or oil-filled.
The data show that the combustion front was highly effective in mobilizing the OOIP from the swept region. This is evident, as the majority of the recoverable oil was found in the downstream part of the core that was not exposed to the high-temperature wave (154.7 g). The amount of coke found in the post-test core was approximately 64.9 g, and 111.0 g of water remained in the post-test core.

4. Conclusions

Carbonate reservoirs host most of the heavy oil and bitumen reserves worldwide and are often associated with complex heterogeneity. ISC has potential to produce oil from these complex reserves. This study provides the first feasibility evaluation of ISC application in reservoirs with triple porosity. This was achieved by conducting a CT experiment on custom-designed/fabricated core plugs representing a complex combination of vugs, fractures and a matrix. The results indicate that a significant recovery of the OOIP from such reservoirs is achievable. During the experiment, a recovery factor of 80% was observed. The produced oil was upgraded from 14.2 to 17.4 °API, with a 12.8% reduction in the asphaltene content and viscosity improvement from 4091 mPa*s to 59 mPa*s (in some of the oil samples). As the temperature reached high values, on average 640 °C in the first 10 zones, a considerable production of CO2 gas in the production stream was observed. This was explained by the dolomite decomposition. To correct for the CO2 concentration in the material balance analysis and to distinguish between the sources of the CO2 gas (as a product of the carbonate decomposition vs. combustion reaction), the atomic ratios of (CO2 + CO)/CO = 6 and (CO2 + CO)/N2 = 0.21 were applied.
The triple-porosity concept was successfully implemented and tested in the CT test. Moreover, the cross-section view of one of the core plugs excavated from the CT after the experiment illustrated the possibility of extracting oil from the isolated vugs. These findings will be discussed in the second part of this study.
The compositional analysis of the effluent gases in this study showed that a significant portion of CO2 is produced as a byproduct of dolomite decomposition resulting from the establishment of a higher temperature profile. However, this might not necessarily take place when ISC is applied on a large field scale. The significant heat losses to the overburden and underburden formations (due to a large temperature gradient) would hinder the achievement of higher temperature values, therefore reducing the amount of dolomite decomposition and CO2 gas generation. The experimental results of Askarova et al. [41] showed lower temperature peaks for the combustion reactions within consolidated dolomites, which is generally the case for reservoirs. Regardless of the magnitude of CO2 generation in a combustion reaction, the produced CO2 could be captured and repurposed as an injectant for an EOR application in neighboring reservoirs.

Author Contributions

Conceptualization, G.M., R.F., M.U. and A.C.; methodology, G.M., S.M., M.U., D.M. and R.F.; validation, M.U., D.M., S.M. and A.C.; formal analysis, M.U., R.F. and A.C.; investigation, R.F.; resources S.M., A.C. and M.S.; data curation, G.M., D.M. and M.U.; writing—R.F.; writing—review and editing, R.F., M.U., D.M. and G.M.; visualization, R.F. and M.U.; supervision, S.M., G.M., A.C. and M.S.; project administration, S.M., A.C. and M.S.; funding acquisition, S.M. and G.M. All authors have read and agreed to the published version of the manuscript.

Funding

This research received no external funding.

Data Availability Statement

The data presented in this study are available on request from the corresponding author. The data are not publicly available due to the confidentiality agreement with the industrial partner.

Acknowledgments

The authors would like to acknowledge the staff members of the ISCRG of the University of Calgary and the Center for Hydrocarbon Recovery at the Skolkovo Institute of Science and Technology for their technical assistance in conducting this research.

Conflicts of Interest

The authors declare no conflict of interest.

References

  1. Green, D.W.; Willhite, G.P. Enhanced Oil Recovery, 4. Nachdr; Henry L. Doherty Memorial Fund of AIME, Society of Petroleum Engineers: Richardson, TX, USA, 2008. [Google Scholar]
  2. Moore, R.G.; Laureshen, C.J.; Ursenbach, M.G.; Mehta, S.A.; Belgrave, J.D.M. Combustion/Oxidation Behavior of Athabasca Oil Sands Bitumen. SPE/DOE Improv. Oil Recovery Symp. 1999, 2, 8. [Google Scholar] [CrossRef]
  3. Wu, Z.; Liu, H.; Pang, Z.; Wu, C.; Gao, M. Pore-Scale Experiment on Blocking Characteristics and EOR Mechanisms of Nitrogen Foam for Heavy Oil: A 2D Visualized Study. Energy Fuels 2016, 30, 9106–9113. [Google Scholar] [CrossRef]
  4. Agosta, F.; Prasad, M.; Aydin, A. Physical properties of carbonate fault rocks, fucino basin (Central Italy): Implications for fault seal in platform carbonates. Geofluids 2007, 7, 19–32. [Google Scholar] [CrossRef]
  5. Croizé, D.; Ehrenberg, S.N.; Bjørlykke, K.; Renard, F.; Jahren, J. Petrophysical properties of bioclastic platform carbonates: Implications for porosity controls during burial. Mar. Pet. Geol. 2010, 27, 1765–1774. [Google Scholar] [CrossRef] [Green Version]
  6. Heap, M.; Baud, P.; Reuschlé, T.; Meredith, P.G. Stylolites in limestones: Barriers to fluid flow? Geology 2014, 42, 51–54. [Google Scholar] [CrossRef] [Green Version]
  7. Machel, H.G. Investigations of Burial Diagenesis in Carbonate Hydrocarbon Reservoir Rocks. Geosci. Can. 2005, 32, 27. [Google Scholar]
  8. Mazzullo, S.J. Overview of Porosity Evolution in Carbonate Reservoirs. 2004. Available online: http://www.searchanddiscovery.com/documents/2004/mazzullo/ (accessed on 17 July 2019).
  9. Lucia, F.J. Rock-Fabric/Petrophysical Classification of Carbonate Pore Space for Reservoir Characterization. AAPG Bull. 1995, 79, 1275–1300. [Google Scholar] [CrossRef]
  10. Manrique, E.J.; Muci, V.E.; Gurfinkel, M.E. EOR Field Experiences in Carbonate Reservoirs in the United States. SPE Reserv. Eval. Eng. 2007, 10, 667–686. [Google Scholar] [CrossRef]
  11. Mayorquin-Ruiz, J.R.; Babadagli, T. Optimal Design of Low Temperature Air Injection for Efficient Recovery of Heavy Oil in Deep Naturally Fractured Reservoirs: Experimental and Numerical Approach. In Proceedings of the SPE Heavy Oil Conference Canada, Calgary, AB, Canada, 12–14 June 2012. [Google Scholar] [CrossRef]
  12. Lacroix, S.; Delaplace, P.; Bourbiaux, B.; Foulon, D. Simulation of Air Injection in Light-Oil Fractured Reservoirs: Setting-Up a Predictive Dual Porosity Model. In Proceedings of the SPE Annual Technical Conference and Exhibition, Houston, TX, USA, 26–29 September 2004; p. 12. [Google Scholar]
  13. Schulte, W.M.; de Vries, A.S. In-Situ Combustion in Naturally Fractured Heavy Oil Reservoirs. Soc. Pet. Eng. J. 1985, 25, 67–77. [Google Scholar] [CrossRef]
  14. Tabasinejad, F.; Karrat, R. Feasibility Study of In-Situ Combustion in Naturally Fractured Heavy Oil Reservoirs. In Proceedings of the International Oil Conference and Exhibition in Mexico, Cancun, Mexico, 31 August–2 September 2006; p. 10. [Google Scholar]
  15. Stokka, S.; Oesthus, A.; Frangeul, J. Evaluation of Air Injection as an IOR Method for the Giant Ekofisk Chalk Field. In Proceedings of the SPE International Improved Oil Recovery Conference in Asia Pacific, Kuala Lumpur, Malaysia, 5–6 December 2005. [Google Scholar] [CrossRef]
  16. Fatemi, S.M.; Kharrat, R.; Vossoughi, S. Investigation of Top-Down In-Situ Combustion Process in Complex Fractured Carbonate Models: Effects of Fractures’ Geometrical Properties. In Proceedings of the Canadian Unconventional Resources Conference, Calgary, AB, Canada, 15–17 November 2011. [Google Scholar] [CrossRef]
  17. Fadaei, H.; Debenest, G.; Kamp, A.M.; Quintard, M.; Renard, G. How the In-Situ Combustion Process Works in a Fractured System: 2D Core- and Block-Scale Simulation. SPE Reserv. Eval. Eng. 2010, 13, 118–130. [Google Scholar] [CrossRef]
  18. Alvarez, J.M.; Sawatzky, R.P.; Forster, L.M. Alberta’s Bitumen Carbonate Reservoirs—Moving Forward with Advanced R&D. In Proceedings of the World Heavy Oil Congress, Edmonton, AB, Canada, 15 May 2008. [Google Scholar]
  19. Craig, F.J.; Parrish, D.R. A Multipilot Evaluation of the COFCAW Process. J. Pet. Technol. 1974, 26, 659–666. [Google Scholar] [CrossRef]
  20. Qi, J.; Yuan, J.-Y. History Matching Grosmont C Carbonate Thermal Production Performance. In Proceedings of the SPE Heavy Oil Conference-Canada, Calgary, AB, Canada, 11–13 June 2013. [Google Scholar] [CrossRef]
  21. Yuan, J.-Y.; Jiang, Q.; Russel-Houston, J.; Thornton, B.; Putnam, P. Evolving Recovery Technologies Directed Towards Commercial Development of the Grosmont Carbonate Reservoirs. In Proceedings of the Canadian Unconventional Resources and International Petroleum Conference, Calgary, AB, Canada, 19–21 October 2010. [Google Scholar] [CrossRef]
  22. Kovscek, A.R.; Castanier, L.M.; Gerritsen, M.G. Improved Predictability of In-Situ-Combustion Enhanced Oil Recovery. SPE Reserv. Eval. Eng. 2013, 16, 172–182. [Google Scholar] [CrossRef] [Green Version]
  23. Izgec, O. Reactive Flow in Uggy Carbonates: Methods and Models Applied to Matrix Acidizing of Carbonates; Texas A&M University: College Station, TX, USA, 2009. [Google Scholar]
  24. Barenblatt, G.; Zheltov, I.; Kochina, I. Basic concepts in the theory of seepage of homogeneous liquids in fissured rocks [strata]. J. Appl. Math. Mech. 1960, 24, 1286–1303. [Google Scholar] [CrossRef]
  25. Warren, J.; Root, P. The Behavior of Naturally Fractured Reservoirs. Soc. Pet. Eng. J. 1963, 3, 245–255. [Google Scholar] [CrossRef] [Green Version]
  26. Kazemi, H. Pressure Transient Analysis of Naturally Fractured Reservoirs with Uniform Fracture Distribution. Soc. Pet. Eng. J. 1969, 9, 451–462. [Google Scholar] [CrossRef]
  27. De Swaan, O.A. Analytic Solutions for Determining Naturally Fractured Reservoir Properties by Well Testing. Soc. Pet. Eng. J. 1976, 16, 117–122. [Google Scholar] [CrossRef] [Green Version]
  28. Liu, C. Exact solution for the compressible flow equations through a medium with triple-porosity. Appl. Math. Mech. 1981, 2, 457–462. [Google Scholar] [CrossRef]
  29. Abdassah, D.; Ershaghi, I. Triple-Porosity Systems for Representing Naturally Fractured Reservoirs. SPE Form. Eval. 1986, 1, 113–127. [Google Scholar] [CrossRef]
  30. Jalali, Y.; Ershaghi, I. Pressure Transient Analysis of Heterogeneous Naturally Fractured Reservoirs. In Proceedings of the SPE California Regional Meeting, Ventura, CA, USA, 8–10 April 1987; p. 14. [Google Scholar] [CrossRef]
  31. Al-Ghamdi, A.; Ershaghi, I. Pressure Transient Analysis of Dually Fractured Reservoirs. SPE J. 1996, 1, 93–100. [Google Scholar] [CrossRef]
  32. Aguilera, R. Analysis of Naturally Fractured Reservoirs From Conventional Well Logs. J. Pet. Technol. 1976, 28, 764–772. [Google Scholar] [CrossRef]
  33. Aguilera, R.F.; Aguilera, R. A Triple Porosity Model for Petrophysical Analysis of Naturally Fractured Reservoirs. Petrophysics 2004, 45, SPWLA-2004-v45n2a4. [Google Scholar]
  34. Moore, R.; Mehta, S.; Belgrave, J.; Ursenbach, M.; Laureshen, C.; Weissman, J.; Kessler, R. A Downhole Catalytic Upgrading Process for Heavy Oil Using In Situ Combustion. J. Can. Pet. Technol. 1999, 38, PETSOC-99-13-44. [Google Scholar] [CrossRef]
  35. Feizabadi, S.E. The Challenge of Proving Vapor Phase Burning in Porous Media in an In Situ Combustion Heavy Oil Recovery Process Based on Laboratory Modeling. 2017. Available online: http://hdl.handle.net/11023/4269 (accessed on 17 December 2022).
  36. Barzin, Y.; Moore, R.G.; Mehta, S.A.; Mallory, D.G.; Ursenbach, M.G.; Tabasinejad, F. Role of Vapor Phase in Oxidation/Combustion Kinetics of High-Pressure Air Injection (HPAI). In Proceedings of the SPE Annual Technical Conference and Exhibition, Florence, Italy, 19–22 September 2010; p. SPE-135641-MS. [Google Scholar] [CrossRef]
  37. Ambastha, A.; Kumar, M. New Insights Into In-Situ Combustion Simulation for Heavy Oil Reservoirs. In Proceedings of the SPE Annual Technical Conference and Exhibition, Houston, TX, USA, 3–6 October 1999. [Google Scholar] [CrossRef]
  38. Fazlyeva, R.R.; Ursenbach, M.G.; Mehta, S.A.; Moore, R.G.; Mallory, D.G. University of Calgary Vug Test No. 1; University of Calgary: Calgary, AB, Canada, 2021. [Google Scholar]
  39. Teramoto, T.; Uematsu, H.; Takabayashi, K.; Onishi, T. Air-Injection EOR in Highly Water-Saturated Light-Oil Reservoir. In Proceedings of the SPE Europec/EAGE Annual Conference and Exhibition, Vienna, Austria, 12–15 June 2006. [Google Scholar] [CrossRef]
  40. Sequera-Dalton, B.M.; Aminfar, E.; Moore, R.G.; Mehta, S.A.R.; Ursenbach, M.G. Compositional Changes in Athabasca Bitumen During Air Injection into Mature SAGD Chambers—Observations from 3-D Large Scale Experiments. In Proceedings of the SPE Canada Heavy Oil Conference, Virtual, 28 September–2 October 2020. [Google Scholar] [CrossRef]
  41. Askarova, A.G.; Popov, E.Y.; Maerle, K.V.; Cheremisin, A.N. Comparative Study of In-Situ Combustion Tests on Consolidated and Crushed Cores. SPE Reserv. Eval. Eng. 2022, 26, 167–179. [Google Scholar] [CrossRef]
Figure 1. Geological and petrophysical classification of vuggy pore space based on interconnection [6].
Energies 16 02233 g001
Figure 2. Photographs of an oil-saturated core plug being filled with oil and capped.
Energies 16 02233 g002
Figure 3. Dimensions of a core plug with artificial vug.
Energies 16 02233 g003
Figure 4. Triple-porosity model.
Energies 16 02233 g004
Figure 5. Schematic drawing of the MPCT system showing the location of the four core plugs relative to the 12 centerline thermocouple locations.
Energies 16 02233 g005
Figure 6. Temperature profile—vuggy test.
Energies 16 02233 g006
Figure 7. Pressure profile for Vuggy CT test.
Energies 16 02233 g007
Figure 8. Steam and combustion fronts for vuggy CT test.
Energies 16 02233 g008
Figure 9. Composition of produced gas, including He for the vuggy CT test.
Energies 16 02233 g009
Figure 10. Composition of produced gas, including He (expanded Y-scale).
Energies 16 02233 g010
Figure 11. WTM-measured results: cumulative gas production and produced gas rate.
Energies 16 02233 g011
Figure 12. Produced combustion gas composition (recalculated) for the vuggy test.
Energies 16 02233 g012
Figure 13. Produced light hydrocarbon gas composition for the vuggy test.
Energies 16 02233 g013
Figure 14. Reacted AFR and apparent H/C ratio.
Energies 16 02233 g014
Figure 15. Water and oil production (incremental and cumulative).
Energies 16 02233 g015
Figure 16. Oil and water recovery.
Energies 16 02233 g016
Figure 17. Oil recovery vs. front advancement.
Energies 16 02233 g017
Figure 18. Viscosity of the produced oil.
Energies 16 02233 g018
Figure 19. Properties of (a) the produced oil and (b) the oil extracted from the post-test core.
Energies 16 02233 g019
Figure 20. Samples of (a) produced oil and (b) extracted residual from the core samples.
Energies 16 02233 g020
Figure 21. Carbon number obtained from (a) produced oil and (b) oil extracted from the core samples.
Energies 16 02233 g021
Figure 22. Residual oil, water and coke mass percent in the unpacked core.
Energies 16 02233 g022
Table 1. Characteristics of the filtered heavy oil sample.
PropertyOil
MW, g/mol375
Carbon (C), wt%85.76
Hydrogen (H2), wt%11.17
Atomic H/C1.56
Nitrogen (N2), wt%0.51
Sulphur (S), wt%1.81
Density @25 °C, kg/m3972
Viscosity @25 °C, cP4091
Saturates, wt%31.58
Aromatics, wt%32.29
Resins, wt%25.00
Asphaltenes, wt%11.13
Table 2. Brine composition.
ComponentsMolar Mass (g/mol)Concentration (mol/L)Concentration (g/L)Concentration (g/10 L)
MgCl2 • 6H2O203.300.10201620.740207.398
CaCl2 • 2H2O147.010.13722620.174201.735
FeCl3 • 6H2O270.300.0000000.0000.000
KCl74.550.0563464.20142.006
NaHCO384.010.0049980.4204.199
Na2SO4142.040.0102851.46114.609
NaCl58.440.79916446.703467.031
Table 3. Packing details and reservoir properties.
Material or PropertyValueDescription
Oil, g2788.4Including the oil used for the core plug saturation and filling the vugs, as well as the crushed core premix.
Brine, g1253.3Used for the crushed core premix. An additional 342 g was used in the lines and pressure taps and is not included in this table.
Crushed core and frac sand, g20,279.0Dolomite core with 16- and 20/30-mesh frac sand.
Core plugs, g1732.3Prior to saturation.
Calculated porosity, %45.1Whole composite core.
Average Soil, %44.3Core saturation at the start of air injection based on oil and brine densities at 25 °C and atmospheric pressure. They provide an “order of magnitude” estimation of the core saturation under the actual conditions of 40 °C and 1740 psig (120 bar). Note that these calculations include the combined frac sand, crushed dolomite core and core plug (including vugs) components of the composite core pack.
Average Sbrine, %18.4
Average Sgas, %37.3
Initial temperature, °C40Represents a reservoir temperature. The ignition temperature was set as 325 °C.
Operating back pressure, psig1740Maintained throughout the test.
Table 4. Main events of the vuggy CT test.
Run Time, (Hour)Activity
−3.43Started pressurizing of the system to 1740 psig using He injection into the core and annulus.
−3.22All zones set to 30 °C. Started the core preheating to 40 °C (reservoir temperature).
−3.07All zones set to 40 °C.
−2.73Reached the target pressure of 1740 psig (120 bar).
−2.53Started He injection at 234 L(ST)/h (flux of 30.0 m3(ST)/m2h). Later, we found that the He cylinder was contaminated with 42% N2.
−2.35Start of ignition heating by setting Zone 1 to 100 °C.
0.00Zone 1 at 325 °C (wall temperature 370 °C); start of air injection at 234 L(ST)/h; flux of 30.0 m3 (ST)/m2h.
0.08Indication of ignition.
3.57Produced first liquid (oil).
5.92Installed flue gas scrubber (caustic) due to H2S/mercaptans in the produced gas.
11.48Stopped air injection, reaching Zone 10; switched to He purge at 234 L(ST)/h (flux of 30 m3(ST)/m2h). Same He cylinder with 42% N2.
15.82Switched to the second He cylinder. Determined that this cylinder contained 27% N2.
21.58Identified the problem of He cylinder contamination. Changed to the third cylinder containing pure He.
24.98Completed He purge; started depressurizing the system.
25.58Test completion.
Table 5. Gas cylinders and operation details.
As Measured by the H2/He GC in Mole PercentInjection Rate and Start Time
TemperatureHeN2O2L(ST)/h and (h)
Cylinder 1 (He)57.4842.450.06234.80; (−2.53 and 11.48)
Cylinder 2 (He)72.5226.710.10250.8; (15.8)
Cylinder 3 (He)10000292.6; (21.6)
As measured by the combustion GC * in mole percent
Cylinder 1 (He)-99.370.60
Cylinder 2 (He)-99.120.83
Cylinder 3 (He)---
Air Cylinder 78.1121.89
* The combustion GC uses He as a carrier gas; hence, He was not detected in the gas sample.
Table 6. Summary of ISC parameters.
Total Fuel Consumed (g)237.9
  Mass of Carbon in Combustion Products (g)200.6
  Mass of Hydrogen in Combustion Products (g)37.4
Total Air Required (liters (ST))2690.8
Measured Oxygen Feed (liters (ST))589.0
Measured Air Feed (liters (ST))2690.8
Total Volume of Produced Gas (inert flood, He-free) (liters (ST))2539.4
Total Volume of Produced Gas (He included) (liters (ST))7824.8
Overall Oxygen and Fuel Requirement Parameters:
Air to Fuel Ratio (m3(ST)/kg)11.31
Oxygen to Fuel Ratio (m3(ST)/kg)2.47
Air Requirement (m3(ST)/m3)238.7
Fuel Requirement (kg/m3)21.11
Air and Fuel Requirements Based on a (Burned) Tube Volume of 0.0113 (m3)
Hydrogen to Carbon Ratio2.22
Overall Oxygen Utilization (percent)99.3
Overall (CO2 + CO)/CO Ratio7.21
Overall (CO2 + CO)/N2 Ratio0.19
Reacted Oxygen Forming COx (percent)62.7
Total Fuel Gas Production (g)44.6
  Mass of Carbon in Fuel Gas (g)35.1
  Mass of Hydrogen in Fuel Gas (g)8.6
  Mass of Sulfur in Fuel Gas (g)0.9
Total Mass of Oil Produced as Gas (g)282.5
Component Production litres (ST)
O24.3
N22101.7
CO54.6
CO2339.0
CH417.1
C2H41.8
C2H65.5
C3H63.1
C3H84.7
C4+3.3
H23.6
H2S0.7
Disclaimer/Publisher’s Note: The statements, opinions and data contained in all publications are solely those of the individual author(s) and contributor(s) and not of MDPI and/or the editor(s). MDPI and/or the editor(s) disclaim responsibility for any injury to people or property resulting from any ideas, methods, instructions or products referred to in the content.