Abstract
The nonlinear characteristics of power electronic-based loads in a power system contribute a major role in the harmonics’ injection and other power quality disturbances. This affects the quality of the power supplied to consumers by distribution systems. Flexible AC transmission system (FACTS) devices at the transmission level and custom power devices at the distribution level are used for an effective power transfer. In addition to these devices, filters play a prominent role in distribution systems. This paper aims to analyze the supply voltage in the time–frequency domain to perceive the variations in signal strength, explaining the role and significance of filters in mitigating or reducing harmonics. This paper presents the significance of harmonic filters in terms of signal-processing terminology. This depicts the prominent role of filters in improving the power quality by harmonic reduction or elimination, depending upon the requirement. The mathematical transform used in this approach is the short-time Fourier transform, which results in transforming the signal into a domain giving information about time and frequency. A MATLAB Simulink environment and ‘spectrogram’ were used to simulate harmonic signals, and we analyzed them using a short-time Fourier transform. Different windows were used with varying window size lengths.
1. Introduction
The nonlinear nature of power electronic-based loads causes distortions in the supply voltage. It is the responsibility of utilities and consumers to maintain the quality of power. There has always been a problem with harmonics in power systems because of the substantial losses they cause, especially on the consumer end. Since the introduction of microelectronic processors, particularly in personal computer programmable logic controllers, there has been a rise in the need for green energy. Harmonic distortion refers to the underlying structure that causes the asymmetrical signal. Since multiple AC components are involved, harmonics will increase RMS values in electricity [1,2,3,4]. Overvoltage, data loss, and overheating of equipment on the same network can all be caused by harmonics if they are not properly prevented [5,6]. Harmonic filters, such as a voltage regulator, can help with this, but they are expensive for large-scale industries; therefore, it is important to have good monitoring systems in place instead [7]. Following standards such as IEEE 519-2014 and IEC 61000-3-2, appropriate precautions might be performed if the harmonic level rises above a certain threshold [8,9]. The role of the harmonics filter in a power system is to mitigate or eliminate harmonics to achieve ideal sinusoidal voltage, having only a fundamental frequency component. The aim of this paper is to emphasize the variations in the supply voltage before and after connecting in the considered system. In this paper, the focus is laid on the visualization of the supply voltage in a time–frequency representation. The distortion present in the voltage signal was reduced after connecting the filters, which provides the contribution of a significant role of the filters in the reduction of harmonics. The paper is organized with Section 1 describing the analysis of the harmonic content present in a signal, Section 2 explaining the materials and methods, Section 3 explaining the total harmonic distortion analysis, Section 4 deals with the analysis of the supply voltage after integration of the renewable energy source into the considered system, and the last section ends with the conclusion. The major contribution of the proposed work is as follows:
- The frequency domain representation of harmonics based on mathematical equations;
- The short-time Fourier transform-based representation of harmonics;
- Generation of the waveforms of voltage and current waveforms at the supply side and load side by the simulation of a power system in a MATLAB environment;
- Keeping in view the power quality in terms of the supply voltage and load current, the supply voltage is considered for analysis;
- A spectrogram of the supply voltage is visualized for different windows of Hamming, Kaiser, and Blackman windows;
- Using the time and frequency domain representation for a length, the Hamming window is chosen for analysis;
- Using the Hamming window for small and large window lengths, the spectrogram is analyzed for supply voltage with and without filters;
- A reduction in the power distribution is observed for the spectrogram of the supply voltage after connecting the filters;
- This indicates a reduction in the harmonic content;
- The results are validated by a calculation of the total harmonic distortion;
- The renewable energy source is integrated into the system, and the effect of the filter’s presence is observed.
1.1. Analysis of Harmonic Content Present in a Signal
1.1.1. Information about Frequency Content
Typically, the frequency content of a measured signal is extracted using a time-tested method called the Fourier transform (FT) [10]. The data are typically shown as a power spectrum, where the y-axis represents the signal strength, and the x-axis represents the frequency [11,12]. Short-range transients, such as impulsive and oscillating transients, over the samples collected, render this method useless for pinpointing fault occurrence times [13]. Furthermore, FT analysis has not taken into account the time-varying effects of the frequency in nonstationary signals [14]. However, the ease with which this method can be implemented makes it a good fit for real-time monitoring, as described in [15]. In this study, we propose using time–frequency distribution (TFD) to get around this shortcoming of FT. With TFD, the analyzed signal is plotted in three dimensions, with the third dimension being time. Estimating the harmonic parameters in a joint time–frequency domain can be accomplished using linear TFD techniques, such as the short-time Fourier transform (STFT) [16], Gabor transforms [17], the wavelet transform [18], and the S-transform [19]. In [20], short-duration voltage variations are classified based on extracting features from the low-frequency representation of the signals using the wavelet transform. Multiplication by a window function based on the Fourier transform analysis of each interval divides the function into discrete temporal windows [21].
1.1.2. Extraction of Additional Information Using Time–frequency Representation
The precision of analysis will suffer if the time window is too small, as this will produce artificial discontinuities that may lead to unintended consequences, such as overlap in the results along the time variable. It is important to think about the best window type and size for the required situation [22]. The STFT allows for more precise detection of harmonic distortion in the time and frequency margins. Picking a sliding window to apply the FT within is the basis for the STFT’s formulation. The concept behind the STFT is that it uses a constant window size to do an analysis that is efficient at both time and frequency scales. Better frequency resolution is achieved at longer window lengths, while better time resolution is achieved at shorter window lengths [23]. The analysis is well-suited for transients that last only a brief amount of time since a high time resolution can be attained even for a small window or interval of time [24]. The results of a frequency resolution determination using a somewhat large window are accurate, while the results are wrong for the time resolution [25]. The results can be good in both the time and frequency resolution [26], hence a multi-scale window utilizing the wavelet transform and S-transform is required.
This method presents a problem for sophisticated algorithms [27]. FT analysis is used in commercial harmonic monitoring systems. While the system is reliable in terms of harmonic level information, it is lacking in terms of sequential information [28]. The location of the harmonic becomes undetectable [29] since harmonic distortion only happens at certain periods. Consequently, as shown in Section 2, the STFT is proposed as a solution to this issue by giving sequential and spectral material in time–frequency representation (TFR). Clear insight into the time-localized spectrum is provided by the values of the TFR surface over the time–frequency plane, which also provides information on the temporal evolution of spectral components. In this study, we distinguish between fundamental and harmonic signals, including those at the signal level, the multi-level, the short duration, and the inter-harmonic levels. MATLAB/Simulink was used to model the example signals. While the STFT was presented via the TFR, the evaluated signal for the FT was displayed in the power spectrum. The parameters that can be estimated are the instantaneous RMS fundamental voltage, V1RMS(t), instantaneous RMS voltage, VRMS(t), instantaneous total waveform distortion, VTWD(t), instantaneous total harmonic distortion, VTHD(t), and instantaneous total nonharmonic distortion, VTnHD(t). According to IEEE Recommended Practice for Monitoring Electric Power Quality (IEEE Standard 1159-1995) [30], harmonics come under the category of waveform distortion in the classification of power quality disturbances. Harmonics are voltages or currents having integer multiples of fundamental frequency [31], and harmonics have a 0 to 9 kHz typical spectral content with a steady-state duration and a 0 to 20% variation in the magnitude of the voltage.
1.1.3. Role of Harmonic Filters
The series filter inserts voltage for maintaining the voltage at the point of common coupling balanced, making it distortion-free. The shunt filter injects a current into the system such that the currents entering the bus to which the filter is connected is sinusoidal. Both these objectives must be met irrespective of the unbalance or distortion in either source or load sides. The switching schemes for the series and shunt filters play a prominent role in the filter’s operation. The arrangement of the filters in a power system with the voltage and current injection carried out simultaneously is shown in the general block diagram shown in Figure 1.
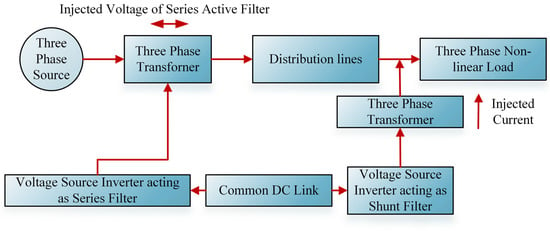
Figure 1.
General block diagram representation of a power system with harmonic filters.
The voltage source inverter is connected in a series with the supply voltage through a series transformer. The shunt inverter is connected across the load through a shunt transformer. Based on different applications of the shunt, the series filters can act individually, or a simultaneous operation can also be performed. The shunt filter injects the current into the shunt, and the series filter injects the voltage in a series based on the distortion levels and compensating ability. The performance of a static VAR compensator (SVC), a shunt-connected device, and the operation of its controller scheme is reviewed in [32] for the analysis of voltage sag and swell, terms representing a decrease and increase in the voltage existing for a short duration of 0.5 cycles to 1 min. A comprehensive review of a custom power device termed a unified power quality conditioner (UPQC), which is used to enhance the power quality at the distribution levels, is provided in [33] with different configurations, compensation approaches, and topologies.
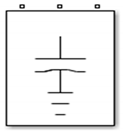
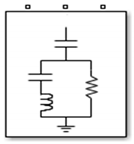
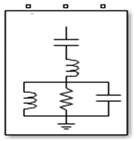
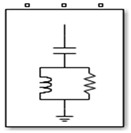
Figure 2 shows the system considered for analysis and simulation. Harmonic filters refer to single-tuned, double-tuned, high-pass, and C-type high-pass filters. An inductor produces lagging reactive power as the current lags the voltage, and a capacitor produces leading reactive power as the current leads the voltage. By producing variations in the impedance, the reactive power is controlled, and the voltage profile is maintained constant.
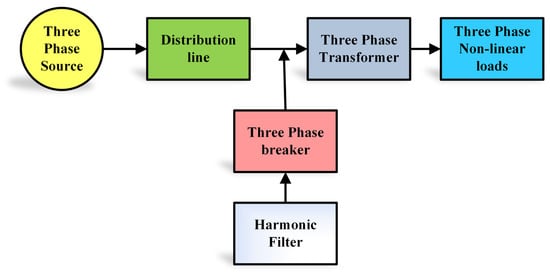
Figure 2.
General block diagram representation of a power system considered for analysis.
The technical specifications for the system with a fundamental frequency of 50 Hz considered for the MATLAB simulation are described in Table 1.

Table 1.
Technical Specifications of the system.
In general, all the filters are built from passive RLC components. A series capacitor acts as a filter and produces capacitive reactive power. For the double-tuned filter, the tuning frequencies are in the 11th and 13th order of the fundamental frequency, and the quality factor is 20. For the high-pass filter, the tuning frequency is in the 24th-order multiple of the fundamental frequency, and the quality factor is 7. For the C-type high-pass filter, the tuning frequency is in the 3rd-order multiple of the fundamental frequency, and the quality factor is 2. The voltage injection into the system is made through which reactive power is controlled, resulting in control of the reactive power, resulting in a balanced and distortion-free supply voltage. Different types of filters are connected at the supply side and load side. Table 2 depicts the different types of filters used in the simulated system to analyze the supply voltage before and after connecting the filters. Shunt filters and series filters, defined by way of the connection, respectively, inject the shunt current and series voltage into the distribution line based on the requirement.

Table 2.
Different types of filter configurations used as harmonic filters, used as a single filter or in combination, each having a nominal line-to-line voltage of 500 kV, and 50 Hz with a nominal reactive power var is 150 Mvar.
2. Materials and Methods
2.1. Application of Fourier Transform for Harmonics Signal
2.1.1. Generation of Harmonics in Time and Frequency Domains
The mathematical equation used for obtaining the time domain signal is given by (1) with constants α1, α2, α5, and α7.
By simulating Equation (1) for harmonics in MATLAB, the voltage waveform with harmonics is obtained, as depicted in Figure 3a. Fourier transform is given by (2), which shows signal X(t) in the time domain transforming to X(ω) in the frequency domain.
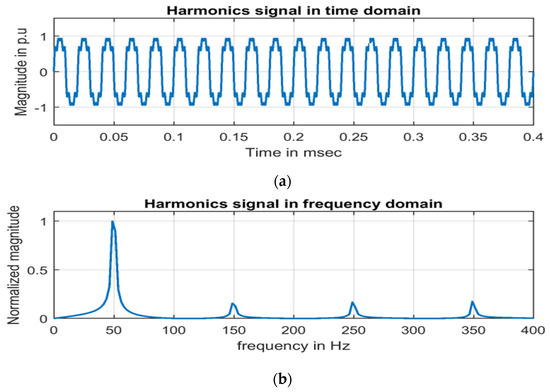
Figure 3.
Harmonics signal: (a) time domain and (b) frequency domain.
The harmonics signal in the frequency domain is shown in Figure 3b with normalized magnitude on the ordinate and frequency in the Hertz on the abscissa.
The effect of frequency changes and distortion in the waveform can be explained by generating a harmonics signal for a duration of 0.4 ms. By applying the Fourier transform, the frequency content present in the signal in Figure 3a is obtained in terms of normalized magnitude, indicated in Figure 3b, with the maximum magnitude at a 50 Hz frequency along with spikes at frequencies 150 Hz, 250 Hz, and 350 Hz. The harmonics signal comprises four signals, each at different frequencies of 50 Hz, 150 Hz, 250 Hz, and 350 Hz, with different respective normalized magnitude values, 1, 0.1559, 0.1666, and 0.1741. In general, an ideal sinusoidal supply voltage must have a fundamental frequency component of 50 Hz or 60 Hz.
2.1.2. Short-Time Fourier Transform-Based Representation of Harmonics Signal
By applying the Fourier transform, frequency information is obtained as only the frequency components present in the signal are perceivable, with a limitation on the time at which these frequencies occur. This has initiated the short-time Fourier transform. Dennis Gabor, in 1946, adapted a technique called ‘windowing’ the signal, which involves analysis through a small section of the signal termed the short-time Fourier transform (STFT). Figure 4a,b depicts the surface plot of sine and harmonics signals with a color map. In the ‘spectrogram’-based analysis, there is improvement in frequency localization with a wider time duration, and the frequency localization is lost with a shorter time duration. Other transforms, such as continuous, discrete wavelet, and wavelet packet transforms, are used in signal processing for information extraction due to the limitation of the STFT’s effectiveness, depending on window size. Once the size of the window is fixed, the frequency content cannot be captured for a signal lesser in size than that of the window. In all the ‘spectrogram’ figures, the main application of the spectrogram analysis is to find the frequency components and time instants at which they occur and is represented by a variation in colors indicating the power level of the signal.
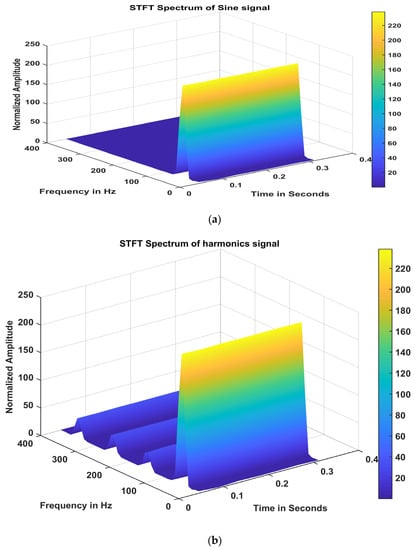
Figure 4.
(a) STFT spectrum of sine signal. (b) STFT spectrum of harmonics signal.
Information obtained from the spectrogram of sine and harmonics signals can be visualized in Figure 5a,b. The strength of the supply voltage signal showing a variation in the color, according to the colormap, is displayed as a function of time for different frequencies.
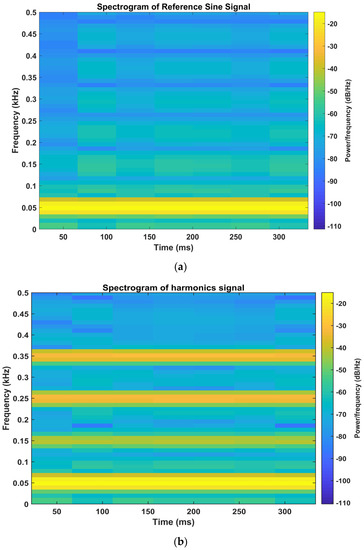
Figure 5.
(a) Spectrogram of the reference sine signal with the color map. (b) Spectrogram of harmonics signal with time on the abscissa and the frequency on the ordinate.
Information about the amplitude, time, and frequency can be observed from the STFT spectrum of the sine and harmonics signals from Figure 4a,b. It is observed from the STFT spectrum that for the sine wave, the frequency component is 50 Hz, and the harmonic signal has frequency components of 50 Hz, 150 Hz, 250 Hz, and 350 Hz, which are fundamental, 3rd, 5th, and 7th order multiples of a fundamental frequency. By applying the short-time Fourier transform, the frequency content present in the signal as a function of time can be obtained, as indicated in Figure 5a,b with the time on the abscissa and the frequency on the ordinate. The color map indicates the power per frequency in terms of dB per Hertz. The function “spectrogram” is used in MATLAB to detect frequencies and their exact order of occurrence in harmonics using the STFT and represents the signal visually as it changes with time, and the STFT is given by (3).
In (3), the signal in the time domain is given by x(t), the window function by ω(τ), τ. represents the time index, and X(τ,ω) is the Fourier transform of x(t)ω(t − τ), resulting in the phase and magnitude of the signal over time and frequency. The STFT representation of the harmonics is given by the spectrogram.
2.2. Voltage and Current Waveforms Obtained at Supply and Load Sides
Generation of Waveforms in Time Domain
By simulating the generalized block diagram in MATLAB with the necessary components’ waveforms shown in Figure 6 and Figure 7, they are obtained for the two cases before and after applying the harmonic filters. Figure 6 depicts the waveforms when there are no filters connected to the system, and the harmonics are evident due to the nonlinear nature of the load.
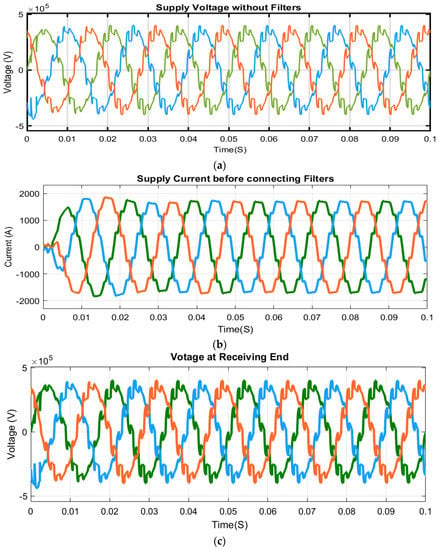
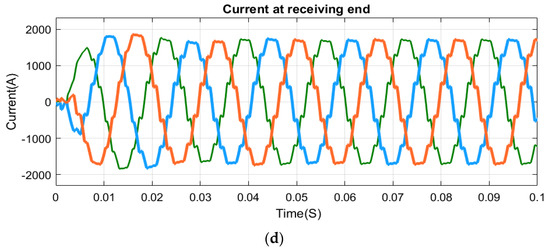
Figure 6.
(a) Voltage waveform at sending end. (b) Current waveform at sending end. (c) Voltage waveform at receiving end without harmonic filters. (d) Current waveform at receiving end without harmonic filters.
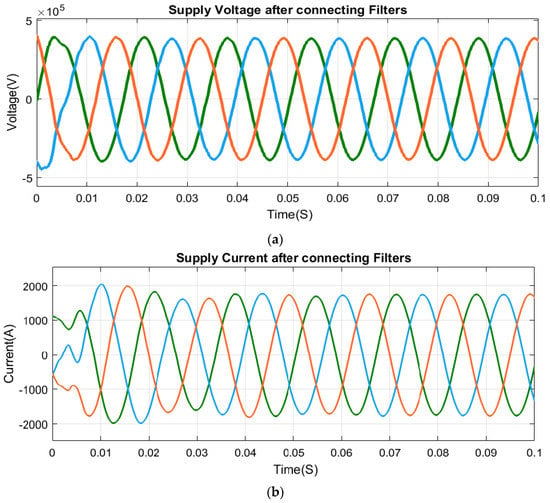
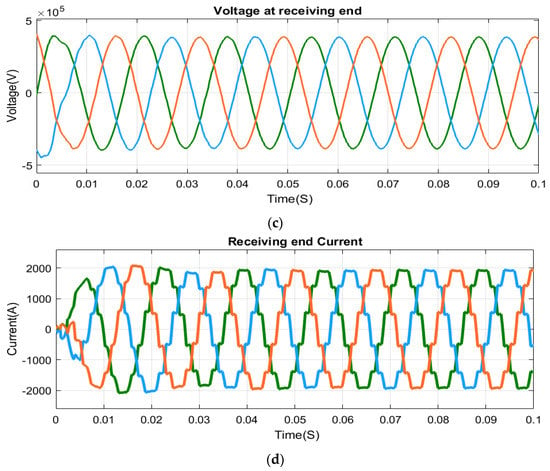
Figure 7.
(a) Voltage waveform at sending end. (b) Current waveform at sending end. (c) Voltage waveform at receiving end with harmonic filters. (d) Current waveform at receiving end with harmonic filters.
A Three-phase circuit breaker is used to connect the filters in and out of the system during simulation. By connecting the harmonic filters, the waveforms shown in Figure 7 are obtained.
2.3. Analysis of Supply Voltage
2.3.1. Spectrogram-Based Representation of Supply Voltage
Due to increased concern about power quality from both utility and consumer perspectives, more significance is on the analysis of supply voltage and load current when compared to supply current and load voltage. The signal considered for analysis is the supply voltage, as this has a prominent role in power quality analysis to maintain quality power without any disturbances. Variations observed in supply voltage are perceived in the time–frequency plane in terms of variation in power density by using spectrogram analysis. As the size of the window is predominant in this analysis, Figure 8 depicts the analysis for different window types. Figure 8a,b represents the supply voltage waveforms before and after connecting the filters by reducing the harmonic content. By suitable voltage or current injection, preventive action is taken by filters to reduce or completely eliminate the harmonic content. Filters may be passive filters having RLC components or power electronic-based active filters. Figure 8c–h depicts a spectrogram of the sine and harmonics for different window types.
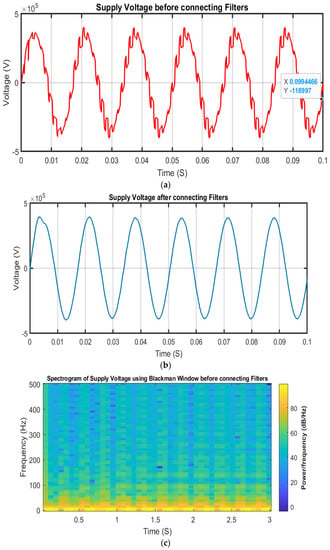
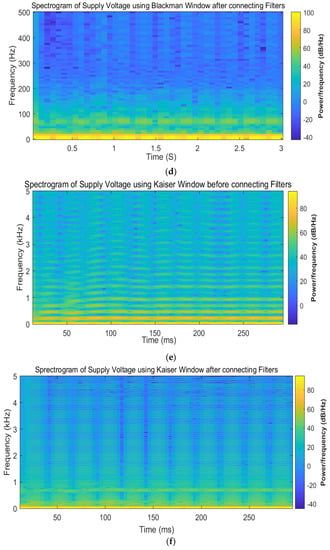
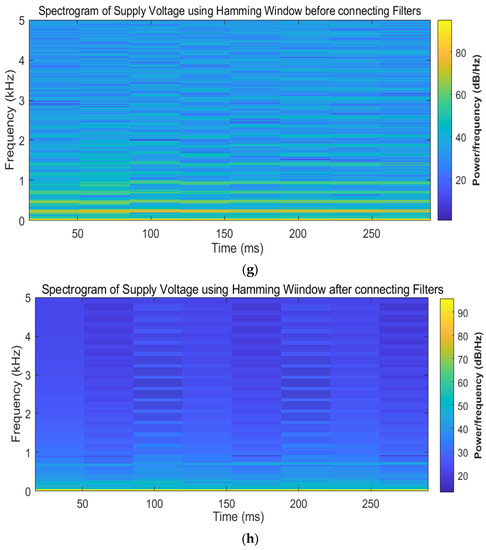
Figure 8.
(a) Supply voltage before connecting harmonic filters. (b) Supply voltage after connecting harmonic filters. (c) Spectrogram of supply voltage before connecting harmonic filters using a Blackman window. (d) Spectrogram of supply voltage after connecting harmonic filters using a Blackman window. (e) Spectrogram of supply voltage before connecting harmonic filters using a Kaiser window. (f) Spectrogram of supply voltage after connecting harmonic filters using a Kaiser window. (g) Spectrogram of supply voltage before connecting harmonic filters using a Hamming window. (h) Spectrogram of supply voltage after connecting harmonic filters using a Hamming window.
2.3.2. Representation of Different ‘Windows’ in Time and Frequency Domains
The window that is used in the STFT analysis of supply voltage signals is the ‘Hamming window’ shown in Figure 9, Figure 10 and Figure 11.
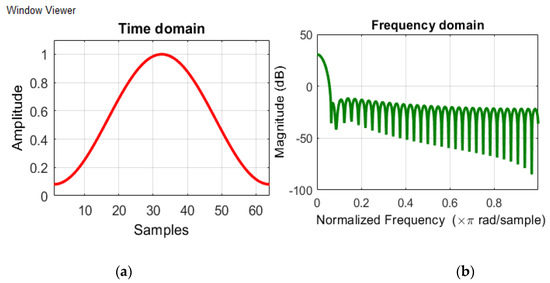
Figure 9.
Hamming window in (a) the time domain and (b) the frequency domain, representing a length of 64 in the time domain.
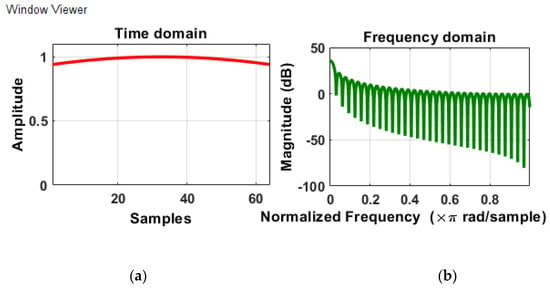
Figure 10.
Kaiser window in (a) the time domain and (b) the frequency domain, representing a length of 64 in the time domain.
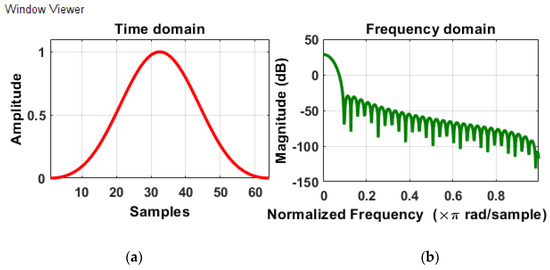
Figure 11.
Blackman window in (a) the time domain and (b) the frequency domain, representing a length of 64 in the time domain.
By using the “Window Designer” application in MATLAB, the time–domain and frequency–domain representations of one or more windows are displayed with different lengths in the time domain.
2.3.3. Effect of Variations in STFT Analysis for Different Sizes in WINDOW length
Windowing is the term that is used in STFT analysis to describe the shaping of a signal. It is observed from Figure 9 that, with an increase in window size in the time domain, as the frequency is inversely related to time, the obtained frequency components are spaced closely and can be resolved easily when the Hamming window is used. The type of window selection is based on the type of signal that is to be analyzed. In this analysis, the Hamming window is used as larger window segments, resulting in greater frequency resolution compared to other windows of the Kaiser and Blackman windows shown in Figure 10 and Figure 11, respectively. The mathematical transform of the STFT gives a 2-dimensional representation of frequency and time with varying amplitudes. The impact of the window length in STFT analysis is taken for two lengths of 120 and 1600 segment sizes, indicating smaller and larger window sizes. Figure 12a–d shows the supply voltage signals before and after connecting the harmonic filters by applying the STFT with window sizes of different segment length sizes.
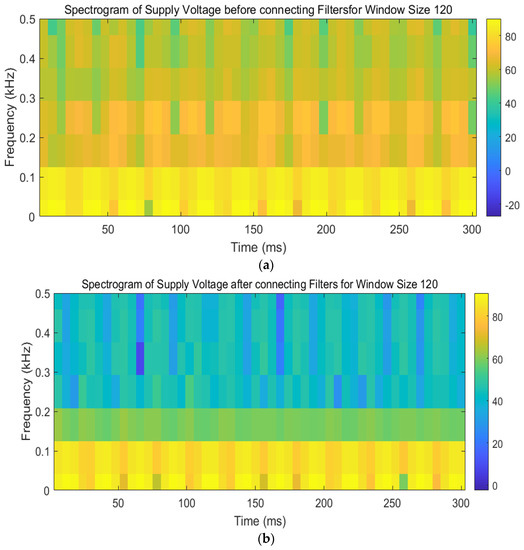
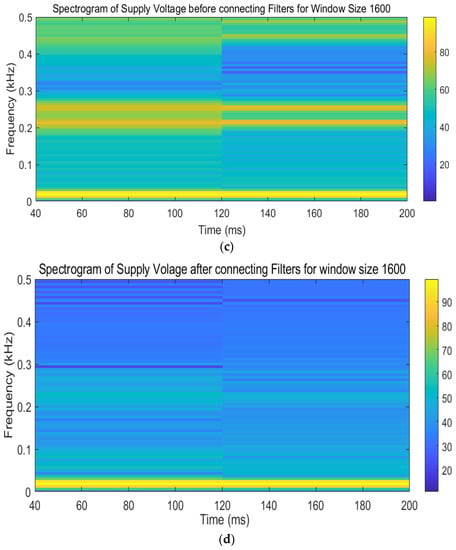
Figure 12.
(a) STFT for supply voltage using the Hamming window of a segment length size of 120 before connecting harmonic filters. (b) STFT for supply voltage using the Hamming window of a segment length size of 120 after connecting harmonic filters. (c) STFT for supply voltage using the Hamming window of a segment length size of 1600 before connecting harmonic filters. (d) STFT for supply voltage using a Hamming window of a segment length size of 1600 after connecting harmonic filters.
There is a sufficient reduction in power distribution levels from the spectrogram after connecting the filters. By varying the widths of the window segments, it is observed that the representation of the signal analyzed using the STFT differs with varying window sizes of different segment lengths. For the STFT, a definite window size is required and should be of a size such that the window cannot be either too small or too large without losing information in the representation. The STFT representation gives the power distribution of signals across the frequency range. An excellent frequency resolution can be achieved by losing time information as the window size is raised, while good time resolution can be achieved by losing frequency information as the window size is decreased. Window size selection is required to balance both time and frequency resolutions. By carefully selecting the window width when utilizing the STFT, frequency versus time information can be acquired. When the window size is changed, the perception of the signal is altered. By using spectrogram analysis, visualization of the frequency spectrum of the supply voltage signal is obtained. The changes in color with a colormap as a reference represent the amplitude of a certain frequency at a certain time. The variations in spectrograms after connecting the filters depict the role and significance of harmonic filters in the suppression and elimination of harmonics.
3. THD Analysis
Harmonic analysis using the FFT (fast Fourier transform) computational tool was performed in MATLAB, and the results are shown in Figure 13a and Figure 14a with depicting analyzed supply voltage signals before and after the filters’ connection, taken for six cycles with an FFT window of two cycles, and having a start time of 0.06 s. In Figure 13b and Figure 14b, the harmonics are displayed with the magnitude in the percent of the fundamental component on the y-axis and with the frequency in Hertz on the x-axis. The total harmonic distortion (THD) value in the supply voltage waveform has decreased from 17.03% to 0.69% after connecting the harmonic filters, indicating the reduction of harmonic content resulting in waveform distortion. Variations in the supply voltage signal, FFT analysis, and display of THD values in MATLAB before and after connecting the filters are observed.
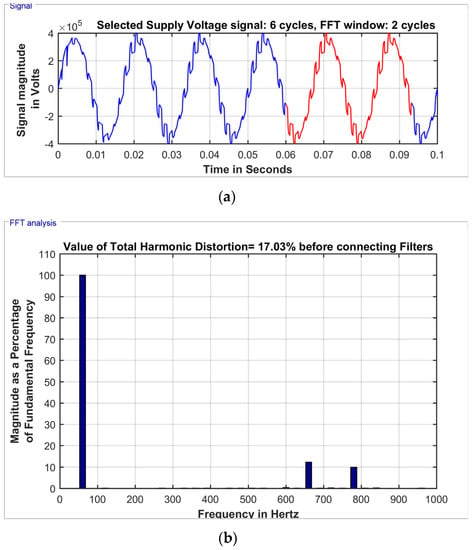
Figure 13.
Before connecting harmonic filters: (a) supply voltage and (b) plot of FFT analysis.
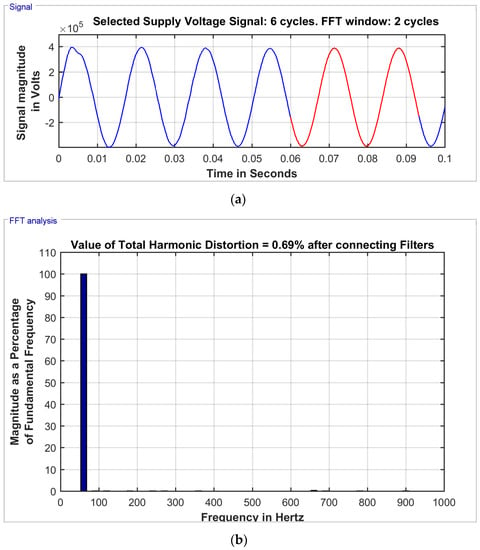
Figure 14.
After connecting harmonic filters; (a) supply voltage and (b) plot of FFT analysis.
4. Integration of Renewable Energy Sources with Stochastic Behavior to Show Effect of Filter
To meet the increased load demand, grids are integrated with renewable energy sources, which have stochastic behavior due to their intermittent nature. The filters can be designed by considering different configurations when renewable energy sources are integrated into the system. The effect of the filter’s operation can be studied by integrating renewable energy sources, as in addition to conventional energy sources, utilities widely use renewable energy sources for power generation. Solar photovoltaic (PV) technology is considered for analysis, as it acts as a promising resource for power generation. Different categories of custom power devices, passive filters, and active filters, with their control algorithms and microgrid response at steady-state dynamic conditions, are explained and implemented in [34,35]. In MATLAB, a PV array is implemented by 88 strings of PV modules connected in parallel. Each string consists of modules connected in a series. The technical specifications for the PV system integrated into the system are described in Table 3 based on a three-phase grid-integrated solar photovoltaic/battery energy storage microgrid system [36]. Different specifications mentioned in [36] are of the solar PV array, nonlinear load, interfacing inductor, ripple filter, filter control, and filter control, and various converter parameters and harmonic patterns of the load and grid currents are obtained for different operating conditions. In [37], the grid-integrated wind- and solar-based AC microgrid is considered for analysis with a wind energy conversion system using a synchronous generator for variable speed generation and a solar PV array connected to step-up or step-down converters, along with a battery along with a control scheme and performance evaluation.

Table 3.
Technical specifications of PV system.
The current versus voltage and power versus voltage characteristics of a 250 kW PV array using an inverter control with the main component as a maximum power point tracker system (MPPT) using a perturb and observe algorithm for different temperatures of 25 °C and 45 °C are shown in Figure 15.
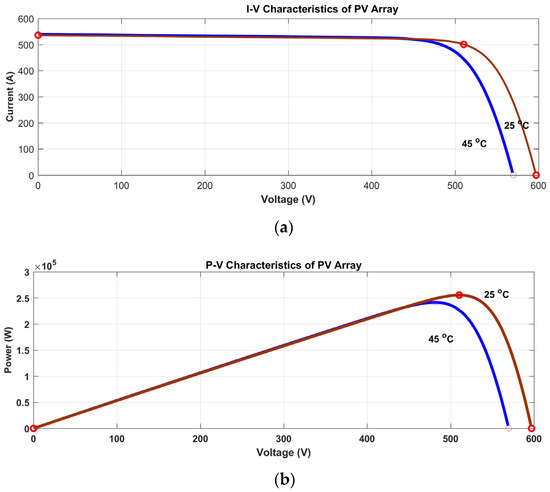
Figure 15.
Characteristics of PV array: (a) current versus voltage and (b) power versus voltage for different temperatures of 25 °C and 45 °C.
The simulated waveforms before and after connecting the filters in the integrated system are shown in Figure 16a,b. Figure 17a,b gives a spectrogram of the supply voltage signal without and with filters when a PV source is connected to the grid. It has been observed that after connecting the filters to the PV-integrated system, the total harmonic distortion value of the supply voltage has reduced from 15.80% to 2.49%. The supply voltage signal is considered for analysis as if there are distortions in the supply voltage, and all the loads connected will get affected, resulting in misoperation or failure of the connected loads.
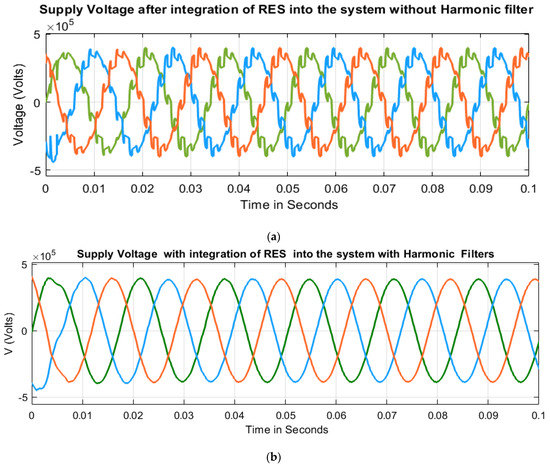
Figure 16.
(a) Supply voltage after integration of PV source into the system without harmonic filters. (b) Supply voltage after integration of PV source into the system with harmonic filters.
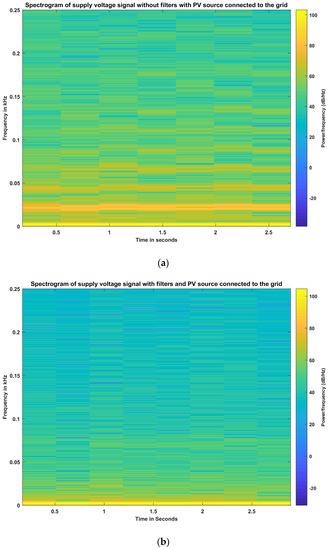
Figure 17.
(a) Spectrogram after integration of PV source into the system without harmonic filters. (b) Spectrogram after integration of PV source into the system with harmonic filters.
5. Conclusions
The analysis of harmonic signals using the STFT is presented in this study. Modeling of the signals was conducted following IEEE standards for various harmonic qualities at various time intervals and frequencies. A comparison between the frequency analysis results obtained before and after the harmonic filters have been applied. According to the analysis, the STFT is a viable choice for harmonic signal analysis since it offers a good time and frequency resolution when the observation window is used. The instantaneous RMS voltage, instantaneous RMS primary voltage, instantaneous total waveform distortion, instantaneous total harmonic distortion, and instantaneous total nonharmonic distortion can be retrieved from the TFR for various harmonic characteristics. The results demonstrate the STFT’s capacity to accurately detect time-varying harmonic signals, and the technique’s contribution to the identification of short-duration harmonic signals is readily apparent. Therefore, it can be said that the suggested method is ideal for use in a real-time monitoring systems for harmonic signal detection. The variations that are observed in waveforms of the supply voltage and variation in THD values before and after connecting the filters can be perceived in a time–frequency representation by transforming the supply voltage signals into a different domain using the short-time Fourier transform. By integrating a solar PV source into the system, the variations in the voltage waveforms and spectrograms without and with harmonic filters are observed.
Author Contributions
Conceptualization, M.S.P., D.K., K.V.K. and B.S.G.; Methodology, K.A., B.S.G., M.B., T.A. and M.M.F.; Software, D.K., K.V.K. and T.A.; Validation, K.A., B.S.G., T.A. and W.E.-S.; Formal analysis, M.S.P., K.V.K., K.A., T.A. and W.E.-S.; Investigation, D.K. and M.B.; Resources, K.V.K., M.B. and M.M.F.; Data curation, M.M.F.; Project administration, M.B. and W.E.-S.; Funding acquisition, W.E.-S. All authors have read and agreed to the published version of the manuscript.
Funding
This work is funded by the Researchers Supporting Project number (RSP2023R503), King Saud University, Riyadh, Saudi Arabia.
Data Availability Statement
Available based on the corresponding author request.
Acknowledgments
The authors appreciate the Researchers Supporting Project number (RSP2023R503), King Saud University, Riyadh, Saudi Arabia.
Conflicts of Interest
The authors declare no conflict of interest.
Appendix A
For obtaining the waveforms, a three-phase transformer with magnetization resistance and magnetization reactance of 500 pu was implemented in MATLAB using three single-phase transformers. Winding 1 is star-grounded with parameters of resistance of 0.0025 pu and inductance of 0 pu. Windings 2 and 3 are star- and delta-connected with parameters of resistance of 0.0025 pu and inductance of 0.24 pu, respectively.
References
- Chen, J.; Shen, J.; Chen, J.; Shen, P.; Song, Q.; Gong, C. Investigation on the selection and design of step-up/down 18-pulse ATRUs for more electric aircrafts. IEEE Trans. Transp. Electrif. 2019, 5, 795–811. [Google Scholar] [CrossRef]
- Jimeno, J.; Merino, J.; Perez-Basante, A.; Gil-de-Muro, A. Analysis of the Applicability of the IEEE 2030.8 Standard for Testing a Microgrid Control System; IEEE: Piscataway, NJ, USA, 2008; pp. 154–196. [Google Scholar]
- Shawky, A.; Takeshita, T.; Sayed, M.A.; Aly, M.; Ahmed, E.M. Improved Controller and Design Method for Grid-Connected Three-Phase Differential SEPIC Inverter. IEEE Access 2021, 9, 58689–58705. [Google Scholar] [CrossRef]
- Yu, Y.; Konstantinou, G.; Hredzak, B.; Agelidis, V.G. Power Balance of Cascaded H-Bridge Multilevel Converters for Large-Scale Photovoltaic Integration. IEEE Trans. Power Electron. 2015, 31, 292–303. [Google Scholar] [CrossRef]
- Anayet, K.; Daut, I.; Indra, N.; Dina, M.; Rajendran, S. A critical review-power quality concerns. J. Eng. Res. Educ. 2008, 5, 21–40. [Google Scholar]
- Taslimov, A.D.; Melikuziev, M.V.; Turaev, I.O. Increasing Reliability by Applying Microprocessor Relays Applied to Eliminate Accident Cases in Electrical Networks. Nexus J. Adv. Stud. Eng. Sci. 2022, 1, 1–7. [Google Scholar]
- Crowder, R. Electric Drives and Electromechanical Systems: Applications and Control; Butterworth-Heinemann: Oxford, UK, 2019. [Google Scholar]
- Civera, M.; Surace, C. A comparative analysis of signal decomposition techniques for structural health monitoring on an experimental benchmark. Sensors 2021, 21, 1825. [Google Scholar] [CrossRef] [PubMed]
- Rudi, D.; Rajani, A.; DwiAtmaja, T.; Junaedi, A.; Kuncoro, M. Study of Harmonic Mitigation Techniques Based on Ranges Level Voltage Refer to IEEE 519-2014. In Proceedings of the 2020 International Conference on Sustainable Energy Engineering and Application (ICSEEA), Tangerang, Indonesia, 18–20 November 2020; pp. 1–8. [Google Scholar]
- Ramírez-Ramírez, A.; Jiménez-Reyes, V.F.; Vélez-Enríquez, J.A.; Leal-Ortiz, S.; García-Guzmán, J. Study of harmonic content and influence of common electrical appliances used in residential installations. In Proceedings of the 2019 IEEE International Conference on Engineering Veracruz (ICEV), Boca del Rio, Mexico, 14–17 October 2019; Volume 1, pp. 1–8. [Google Scholar]
- Kunkels, Y.K.; Riese, H.; Knapen, S.E.; Riemersma-van der Lek, R.F.; George, S.V.; van Roon, A.M.; Schoevers, R.A.; Wichers, M. Efficacy of early warning signals and spectral periodicity for predicting transitions in bipolar patients: An actigraphy study. Transl. Psychiatry 2021, 11, 350. [Google Scholar] [CrossRef]
- Huang, P.; Chen, S.; Gu, M. Field measurement and aeroelastic wind tunnel test of wind-induced vibrations of lattice tower. Struct. Des. Tall Spec. Build. 2019, 28, e1622. [Google Scholar] [CrossRef]
- Rodríguez, A.; Aguado, J.A.; López, J.J.; Martín, F.; Muñoz, F.; Ruiz, J.E. Time-frequency transforms for classification of power quality disturbances. In Power Quality; IntechOpen: London, UK, 2011. [Google Scholar]
- Din, A.; Piah, M.A.M.; Abdullah, A.R.; Norddin, N.; Abdullah, F.S. Leakage current signal parameter of various surface roughness conditions of field-aged polymer insulators. Indones. J. Electr. Eng. Comput. Sci. 2020, 20, 638–645. [Google Scholar] [CrossRef]
- Hu, Y.; Wu, R.S.; Han, L.G.; Zhang, P. Joint multiscale direct envelope inversion of phase and amplitude in the time–frequency domain. IEEE Trans. Geosci. Remote Sens. 2019, 57, 5108–5120. [Google Scholar] [CrossRef]
- Taghizadeh-Alisaraei, A.; Mahdavian, A. Fault detection of injectors in diesel engines using vibration time-frequency analysis. Appl. Acoust. 2018, 143, 48–58. [Google Scholar] [CrossRef]
- Adrien, D.; Andrearczyk, V.; Whybra, P.; van Griethuysen, J.; Müller, H.; Schaer, R.; Vallières, M.; Zwanenburg, A. Standardised convolutional filtering for radiomics. arXiv 2020, arXiv:2006.05470. [Google Scholar]
- Lawgaly, A.; Khelifi, F.; Bouridane, A.; Al-Maadeed, S.; Akbari, Y. Three Dimensional Denoising Filter for Effective Source Smartphone Video Identification and Verification. In Proceedings of the 7th International Conference on Machine Learning Technologies (ICMLT), New York, NY, USA, 11–13 March 2022. [Google Scholar]
- Feng, L.; Jikun, Y. Application of window-optimized 2D S-transform in the optical 3D shape measurement. Optik 2020, 228, 166224. [Google Scholar] [CrossRef]
- Priyadarshini, M.S.; Sushama, M. Classification of short-duration voltage variations using wavelet decomposition based entropy criteria. In Proceedings of the IEEE 2016 International Conference on Wireless Communications, Signal Processing and Networking (WiSPNET), Chennai, India, 23–25 March 2016; pp. 2192–2196. [Google Scholar]
- Oliveira, W.R.; Filho, L.F.A.; Cormane, J. A contribution for the measuring process of harmonics and interharmonics in electrical power systems with photovoltaic sources. Int. J. Electr. Power Energy Syst. 2019, 104, 481–488. [Google Scholar] [CrossRef]
- Krishna, D.; Sasikala, M.; Ganesh, V. Fractional order fuzzy logic based upqc for improvement of power quality in distribution power system. Int. J. Recent Technol. Eng. (IJRTE) 2019, 7, 1405–1410. [Google Scholar]
- Yan, S.; Sun, Y. Early chatter detection in thin-walled workpiece milling process based on multi-synchrosqueezing transform and feature selection. Mech. Syst. Signal Process. 2022, 169, 108622. [Google Scholar] [CrossRef]
- Krishna, D.; Sasikala, M.; Kiranmayi, R. FOPI and FOFL Controller Based UPQC for Mitigation of Power Quality Problems in Distribution Power System. J. Electr. Eng. Technol. 2022, 17, 1543–1554. [Google Scholar] [CrossRef]
- Lopes, C.D.; Becker, T.; Kozakevicius, A.D.J.; Rasia-Filho, A.A.; Macq, B.; Susin, A.A. A P300 potential evaluation wavelet method comparing individuals with high and low risk for alcoholism. Neural Comput. Appl. 2016, 28, 3737–3748. [Google Scholar] [CrossRef]
- Krishna, D.; Sasikala, M.; Ganesh, V. Adaptive FLC-based UPQC in distribution power systems for power quality problems. Int. J. Ambient. Energy 2020, 43, 1719–1729. [Google Scholar] [CrossRef]
- Beniwal, R.K.; Saini, M.K.; Nayyar, A.; Qureshi, B.; Aggarwal, A. A Critical Analysis of Methodologies for Detection and Classification of Power Quality Events in Smart Grid. IEEE Access 2021, 9, 83507–83534. [Google Scholar] [CrossRef]
- Shahkar, S. Condition Monitoring of Gas Turbines using Acoustic Emissions. Ph.D. Thesis, Concordia University, Montréal, QC, Canada, 2018. [Google Scholar]
- Gomes, R.O. Study Case of Impacts in Power Quality and Analysis of Time Varying Harmonics Produced by Photovoltaic Inverters under Transient Conditions; Universidade Federal de Itajubá—UNIFEI: Itajubá, Brazil, 2019. [Google Scholar]
- Janzen, R.E. Extended Intelligence and Mediated Reality Veillametrics in the Space, Time, frequency, and Amplitude Domains. Ph.D. Thesis, University of Toronto (Canada), Toronto, ON, Canada, 2019. [Google Scholar]
- Kwon, T.D. High Bit-Rate Receiver and Equalizer Architectures for Digitial Television Applications; University of California: Los Angeles, CA, USA, 1998. [Google Scholar]
- Priyadarshini, M.S.; Sushama, M. Performance of Static VAR Compensator for Changes in Voltage Due to Sag and Swell. In Innovations in Electrical and Electronics Engineering; Springer: Singapore, 2020; pp. 225–233. [Google Scholar]
- Yoo, J.-S.; Gil, Y.-M.; Ahn, T.-Y. Steady-State Analysis and Optimal Design of an LLC Resonant Converter Considering Internal Loss Resistance. Energies 2022, 15, 8144. [Google Scholar] [CrossRef]
- Singh, B.; Chandra, A.; Al-Haddad, K. Power Quality: Problems and Mitigation Techniques; John Wiley & Sons: Hoboken, NJ, USA, 2014. [Google Scholar]
- Shubhra, S.; Singh, B. Three-phase grid-interactive solar PV-battery microgrid control based on normalized gradient adaptive regularization factor neural filter. IEEE Trans. Ind. Inform. 2019, 16, 2301–2314. [Google Scholar] [CrossRef]
- Chishti, F.; Murshid, S.; Singh, B. Development of Wind and Solar Based AC Microgrid with Power Quality Improvement for Local Nonlinear Load Using MLMS. IEEE Trans. Ind. Appl. 2019, 55, 7134–7145. [Google Scholar] [CrossRef]
- Reddy, C.R.; Goud, B.S.; Aymen, F.; Rao, G.S.; Bortoni, E.C. Power quality improvement in HRES grid connected system with FOPID based atom search optimization technique. Energies 2021, 14, 5812. [Google Scholar] [CrossRef]
Disclaimer/Publisher’s Note: The statements, opinions and data contained in all publications are solely those of the individual author(s) and contributor(s) and not of MDPI and/or the editor(s). MDPI and/or the editor(s) disclaim responsibility for any injury to people or property resulting from any ideas, methods, instructions or products referred to in the content. |
© 2023 by the authors. Licensee MDPI, Basel, Switzerland. This article is an open access article distributed under the terms and conditions of the Creative Commons Attribution (CC BY) license (https://creativecommons.org/licenses/by/4.0/).
