Article

Performance Evaluation of a Linear CPV/T System in Different Working Conditions

by
Carlo Renno
1,*,
Alessandro Perone
1,
Diana D’Agostino
2 and
Francesco Minichiello
2
1
Department of Industrial Engineering, University of Salerno, Via Giovanni Paolo II, 132, 84084 Fisciano (Sa), Italy
2
Department of Industrial Engineering, University of Naples Federico II, P.le Tecchio 80, 80125 Naples, Italy
*
Author to whom correspondence should be addressed.
Energies 2023, 16(5), 2115; https://doi.org/10.3390/en16052115
Submission received: 22 December 2022 / Revised: 8 February 2023 / Accepted: 16 February 2023 / Published: 22 February 2023
(This article belongs to the Special Issue Energy Performance of the Photovoltaic Systems)

Abstract

:
The performance of Concentrating Photovoltaic and Thermal (CPV/T) systems is also linked to climatic conditions. In this paper, the main purpose is to determine the energy and economic performance of a line-focus CPV/T system used for a residential user, considering three cities with different weather conditions: Amsterdam (The Netherlands), Marrakech (Morocco), and Salerno (Italy). A modular configuration of a CPV/T system, with a concentration factor equal to 90 and module of 60 Triple-Junction (TJ) cells, is considered. The electrical power is linked to the values of TJ cell temperature and concentrated radiation by an experimental model. Electric production is highly influenced by the TJ cell temperature values. Hence, Marrakech presents lower power generation in summer than Amsterdam, 126 W, and 134 W respectively; in winter season the trend is reversed. However, the electric production in Marrakech will be higher because presents a higher number of daylight hours than other cities considered. The CPV/T system electrical and thermal producibility is evaluated for each city and for typical winter and summer sunny days, together with the modules number able to obtain the investment profitability.

1. Introduction

Energy consumption is quickly increased during the last years in the world [1]. The dependency on fossil fuels is causing climate changes due to the CO2 emissions increase in the atmosphere [2]. The traditional energy conversion systems currently are often more advantageous from the economic point view, but some renewable technologies will become the next future competitive in comparison with conventional ones [3]. The solar energy is the most promising source of clean energy [4]. The solar energy that reaches the planet surface is so enormous that in one year it is about twice as much as will ever be obtainable by all non-renewable resources on earth such as oil, coal, natural gas and mined uranium combined.
Hence, the main advantages of solar energy are high availability [5] and it can be simultaneously converted into different forms of energy [6]. However, as the conversion efficiency of commercialized solar photovoltaic (PV) power generation is still low and the cost is high, the solar PV systems are limited in actual applications. A limitation of solar power generation is the high cost of solar cells, and the method of solar concentration can effectively reduce the cost of solar PV power generation because it can decrease the number of solar cells number [7,8]. These systems use optics able to focus the solar radiation on smaller Multi-Junction (MJ) cells and to obtain higher electric power thanks to higher conversion efficiency [9]. Hence, the concentrating photovoltaic (CPV) systems allow to maximize the electrical efficiency [10]. However, it is necessary to observe that there is a spectral response of solar cell and not all the solar radiation energy can be used for electric power production. The solar energy dissipated can determine the temperature increase of solar cells, causing the photoelectric conversion efficiency to decrease. A solar concentrating photovoltaic and thermal (CPV/T) system can solve this problem [11,12]. The heat recovered by thermal collector or cooling system can be used in other ways, decreasing the cell temperature and increasing the overall utilization efficiency of solar energy [13]. Hence, despite the high cost of the MJ cells relative to traditional solar cells [14], a careful selection of optics and active cooling system of a CPV/T system can determine further energy and economic advantages [15]. In particular, the electric performance of CPV modules is highly linked to the internal behavior of the solar cells; so, parameters as Direct Normal Irradiation (DNI) and Triple-Junction (TJ) cell temperature, generally adopted in these systems, have a significant impact. The CPV systems work only with the direct component of the solar radiation [16], and can’t convert the diffuse radiation into electrical energy [17]. The rates of solar radiation components depend on the climate conditions of specific zone [18], as well as concentration and environmental temperature parameters which affect the cell temperature and its electrical performance [19]. Hence, the CPV systems could have better electrical performances in cold regions in comparison with hotter regions under other similar conditions [20]. On the other hand, higher operation temperatures allow the thermal energy recovery. Therefore, it is clear that the overall energy performance of a CPV/T system could be different according to its installation site.
This typology of systems has been studied by scientific community in several possible configurations and in different world areas. For example, an experimental study concerning a CPV/T system in Nanjing city (China), is presented in Ref. [21]. The CPV/T system has been tested both for sunny and cloudy days. The results have shown a good assessment of energy performance, reaching overall energy efficiency of about 60%. Another interesting application in China is described in Ref. [22], where a CPV/T system is coupled with an Organic Rankine Cycle (ORC) increasing the conversion efficiency of solar energy in electricity up to 44%. An energy analysis of a concentrating photovoltaic/concentrating solar power (CPV/CSP) hybrid system for the city of Beijing (China), is realized in Ref. [23]. In Ref. [24] the CPV/T energy and economical performances under two different weather conditions, have been studied in Tunisia and in the city of Chambery (France); in Tunisia, the system has presented better performance. In Ref. [25] the energy performance of line-focus CPV/T system from the cogeneration point of view, has been studied in Salerno (Italy). In Ref. [26] the electrical and thermal production of some CPV/T power plants adopted in different areas of Spain, have been monitored.
However, a CPV/T system can’t be equally convenient worldwide. In fact, the electrical and thermal producibilities of a given CPV/T system are linked to the climate conditions of its installation site (yearly DNI, environmental temperature, sunlight hours number, etc.). Hence, the aim of this paper is to analyze by means of an experimental modeling of the energy and economic performances of a line-focus CPV/T system, used to satisfy the energy loads of a residential user when its installation site varies. In order to evaluate the potential of these systems in different world areas, three cities with different weather conditions have been considered: Amsterdam (Netherlands), Marrakech (Morocco) and Salerno (Italy).

2. Experimental System

The experimental system (Figure 1), built in the Applied Thermodynamics Laboratory of the University of Salerno, is a linear CPV/T plant that presents a parabolic trough concentrator. The solar radiation is focused on a pipe where the refrigerant fluid flows and the Triple-Junction (TJ) solar cells are placed. The TJ cells are sixty and present an area of 1.0 × 1.0 cm2 (Table 1). A biaxial tracking system is used in order to focus the maximum Direct Normal Irradiance (DNI) on TJ cells. The first rotation is possible in the horizontal plane and allows to follow the sun in azimuth direction; the second rotation in the vertical plane follows the sun in zenithal direction. Another freedom degree of the system is the variation of the distance between optics and pipe varying the concentration factor value.
Parabolic optics is characterized by its focal length (f) which affects the focused image size, and the truncation value (a) that regulates the energy which reaches the pipe. So, the concentration factor depends on the ratio (f/a). In the CPV/T system sizing the chosen input data have been: C = 107, pipe length equal to 1.2 m and diameter equal to 2.8 cm. Hence, it has been possible to evaluate the parabola size able to ensure the optimal concentration factor. The maximum optical concentration factor (Copt) experimentally measured at the proper focal length, is about 90. To measure the environmental, fluid, and cell temperatures, some PT100 thermo-resistances with accuracy equal to ±0.2 °C [27] have been adopted. A pyrheliometer with accuracy of 2% has been used to measure the DNI. An acquisition data system (data tracker series DT80) has been adopted to measure DNI, voltage, current and temperatures; the sampling rate has been of 15 s.

3. Energy and Economic Performance Evaluation

The main purpose is to study the energy and economic performance of a linear CPV/T plant adopted for a residential user varying the installation site. Since the performance of a CPV/T system is highly dependent on operating conditions, and thus on parameters such as Tenv, DNI and daily hours of sunlight, cities with different climatic conditions have been considered. Three cities (Marrakech, Amsterdam and Salerno), where the performance of the CPV/T system was evaluated, present different values in terms of environmental temperature (Tenv), Direct Normal Irradiance (DNI) and daily hours of sunlight [28].

3.1. Energy Performance

The evaluation of energy performance first requires determining, for each location, typical summer and winter sunny days, that are the limit working conditions of a CPV/T system. For both days, a clear sky irradiation has been considered as the DNI is highly variable with the degree of cloud cover. Hence, the comparison between three cities does not depend on the chosen single day and so on its cloudiness degree.
By considering the annual hourly distribution of DNI and Tenv for each location, it has been possible to make an accurate evaluation of the electrical and thermal energy performance of the CPV/T system. This analysis evaluates the TJ cells number that allows to satisfy the user’s electrical load and to correctly size the CPV/T system, obtained using a modular configuration. The experimental CPV/T plant, previously described, has been considered as single module. Its electric power depends on TJ cells operation temperature (Tcell) and solar radiation (Rcell) concentrated on TJ cell obtained multiplying optical concentration factor and DNI [29].
As for Tcell, approximately equal to the refrigerant temperature (Tfluid), an experimental equation that links it to environmental temperature (Tenv) and Rcell, has been determined. It has been experimentally noted that the increase of Tcell with the environmental temperature increases logarithmically with the concentrated solar radiation, according to the following equation:
T c e l l T e n v = A · l n R c e l l + B
where A and B are coefficients experimentally determined.
The electric power of the module described ( P e l , m o d ) has been experimentally evaluated monitoring both cold winter and hot summer days corresponding to different solar radiation conditions. The experimental analysis has allowed to collect many data representing different CPV/T system working conditions. Adopting a black-box modeling approach, a measured data multivariable regression, with a significance level α = 0.05 , has been realized in Matlab [30].
The following relation among P e l , m o d , R c e l l and T c e l l has been determined:
P e l , m o d = C · R c e l l + D · 1 T c e l l
where C and D are coefficients experimentally determined.
To valid the previous relationships, the solar radiation concentrated on TJ cell and its temperature must be strictly included between the values (9.00 ÷ 83.7) kW m 2 and (35.0 ÷ 95.0) °C, respectively.
The P e l , m o d values evaluated by means of the Equation (2) considers the parasitic current losses generated in the module together with module efficiency which considers the coupling in series of cells along a line where a cell TJ can work at efficiency lower than the nominal one.
Once calculated P e l , m o d , the recovered thermal power ( Q t h , m o d ) can be evaluated by an energy balance on CPV/T module:
Q t h , m o d = R c e l l · A t u b e P e l , m o d Q t h , l o s s
where A t u b e is the tube area where R c e l l is concentrated and Q t h , l o s s represents the thermal losses. The recovery of thermal energy depends on its temperature and then Q t h , m o d has been divided in
-
low-temperature thermal power (LTQth) available at temperatures lower than 40 °C and then not utilizable;
-
middle-temperature thermal power (MTQth) available at temperatures included between 40 °C and 80 °C that can be adopted for winter heating (WH) and to produce domestic hot water (DHW);
-
high-temperature thermal power (HTQth) available at temperatures higher than 80 °C and usable in an Absorption Heat Pump (AHP) to obtain cooling power (Qcool).
So, once defined the Tenv and DNI values [28] for each city and defined the C o p t value for the CPV system, T c e l l (Equation (1)), P e l , m o d (Equation (2)) and Q t h , m o d (Equation (3)) can be calculated.
The electrical and thermal powers supplied by a CPV/T system can be respectively calculated in this way [31].
P e l , C P V / T = P e l , m o d · n m o d · f · η i n v
Q t h , C P V / T = Q t h , m o d · n m o d · f
where Pel,mod and Qth,mod can be calculated by means of the Equations (2) and (3), n m o d is the modules number, η i n v is the inverter efficiency and, considering a non-ideal tracking system, factor f equal to 0.9 is considered.

3.2. Sizing and Economic Analysis

The modules number necessary to satisfy the user loads of each city chosen can be calculated, once evaluated the monthly electric, thermal and cooling loads of residential user. If the modules number increases, the electric and thermal production of the CPV/T system also increases. The production exceeds the user energy loads determining an oversized system, if the modules number is excessively high. The modules optimal number for each city can be calculated in order to maximize the investment profitability, expressed in terms of NPV (Net Present Value), obtained from the difference between the total discounted cash flow for the i-th year ( C F i ) and a current investment ( I 0 ). The initial investment is due to CPV/T system cost, calculated as a product between the single module cost ( c m o d ) and the modules number ( n m o d ). The cash flow of i-th year is equal to sum of cost savings for the purchase of the electrical and thermal energy required by user ( C S i ) and the gains obtainable by the electrical energy surplus sale ( G i ). The cost savings C S i for the i-th year can be so evaluated:
C S i = m = 1 12 c e l · min E e l , C P V / T m ; E e l , U m + c t h · min E t h , C P V / T m ; E t h , U m + c c o o l · min E c o o l , C P V / T m ; E c o o l , U m
where c is the unit purchase cost of each energy vector, multiplied by respective monthly rates of the CPV/T energy (E) producibilities not exceeding the user monthly energy needs. In particular, the unit purchase cost of thermal energy ( c t h ) has been calculated assuming to produce thermal energy through a methane boiler:
c t h = c M e t h a n e η B o i l e r · L C V M e t h a n e
where c M e t h a n e represents the methane unitary cost, η B o i l e r is the boiler efficiency and L C V M e t h a n e is the lower calorific value of Methane. The unit purchase cost of cooling energy ( c c o o l ) has been calculated assuming to produce cooling energy by means of an electrical heat pump with C O P f :
c c o o l = c e l C O P f
As for the cooling energy obtainable by the CPV/T system ( E c o o l , C P V / T ), an AHP with a C O P A H P has been used:
E c o o l , C P V / T = H T E t h · C O P A H P
The gains obtainable by the surplus electrical energy ( G i ) sale have been determined as the product between the monthly energy surpluses obtained by CPV/T system and the relative selling price to energy network ( p e ). The analysis conducted on the NPV allows also to evaluate the Discounted Pay-Back Period (DPBP) that represents the period of time over which the cash flows from an investment pay back the initial investment, factoring in the time value of money. Another index, useful in the investment evaluation, is the Profit Index (PI) defined as the ratio between NPV and I 0 . The evaluation of this index will help to understand whether it is worthwhile to proceed with the project or not. The definitions of NPV, DPBP and I 0 are [32]:
N P V = I 0 + i = 1 U L C F i 1 + r i ;     D P B P = I 0 i = 1 U L C F i 1 + r i ;     P I = N P V I 0
where I 0 is the initial investment, C F i is the cash flow for the i-th year, r is the discount rate and UL indicates the CPV system useful life.

4. Results and Discussion

The energy and economic performances of CPV/T system are linked to the weather conditions of its installation site. Its working has been studied in three different cities (Amsterdam, Marrakech and Salerno) to highlight the potential of these systems in different world areas. These cities present high differences in terms of environmental temperature, daily hours of sunlight and weather conditions that highly affect the DNI levels.
Marrakech (31°40′11″ N, 7°58′23″ W) is characterized by semi-desert subtropical climate, with mild winter and very hot summer. The rainfall is limited and is concentrated in the months from October to May. The amount of DNI in Marrakech is good all the year, but especially in summer with a clear sky. The higher temperatures of the summer season, which can exceed 40 °C, affect the TJ cell electrical performance allowing the recovery of high temperature thermal energy exploitable for different applications. Hence, Marrakech is a particularly suitable installation site for CPV/T system.
On the contrary, Amsterdam (52°22′26″ N, 4°53′22″ E) presents a sub-oceanic climate, humid and rainy, with cold winter and cool summer. Precipitation is relatively abundant, but it is frequent and distributed all the year. The DNI is rather low, above all in winter, due to the high levels of cloud cover. On the other hand, the lower environmental temperatures can guarantee higher TJ cell electrical efficiencies.
Salerno (40°39′51″ N, 14°48′16″56 E) presents intermediate climatic characteristics respect to the cities above described. Salerno is characterized by short, hot, humid and clear summer and by long, cold and cloudy winter. Hence, the amount of sunshine is very good in summer; on the contrary, in winter sunny periods alternate with periods of bad weather.
The climatic differences between the three above mentioned cities determine different CPV/T system working conditions, which depend on the values of Tenv and DNI available in [28]. The experimental tests have allowed to note that the increase of Tcell respect to the environmental temperature increases logarithmically with the concentrated radiation (Equation (1), Figure 2).
This trend refers to fixed value of mass flow of water circulating in the cooling system at speed of 0.2 m/s. Moreover, the relation between P e l , m o d , T c e l l and R c e l l has been analyzed (Equation (2)), as shown in Figure 3. The A and B coefficients values of Equation (1) and the C and D coefficients values of Equation (2) are reported in Table 2 together with the values of R2.
Hence, once known the Tenv and DNI values of each city [28] and once defined the value of C o p t equal to 90 for the CPV/T system, the average hourly values of T c e l l (Equation (1)), P e l , m o d (Equation (2)) and Q t h , m o d (Equation (3)) can be calculated for each city related to typical winter sunny (a) and summer sunny (b) days (Figure 4, Figure 5 and Figure 6).
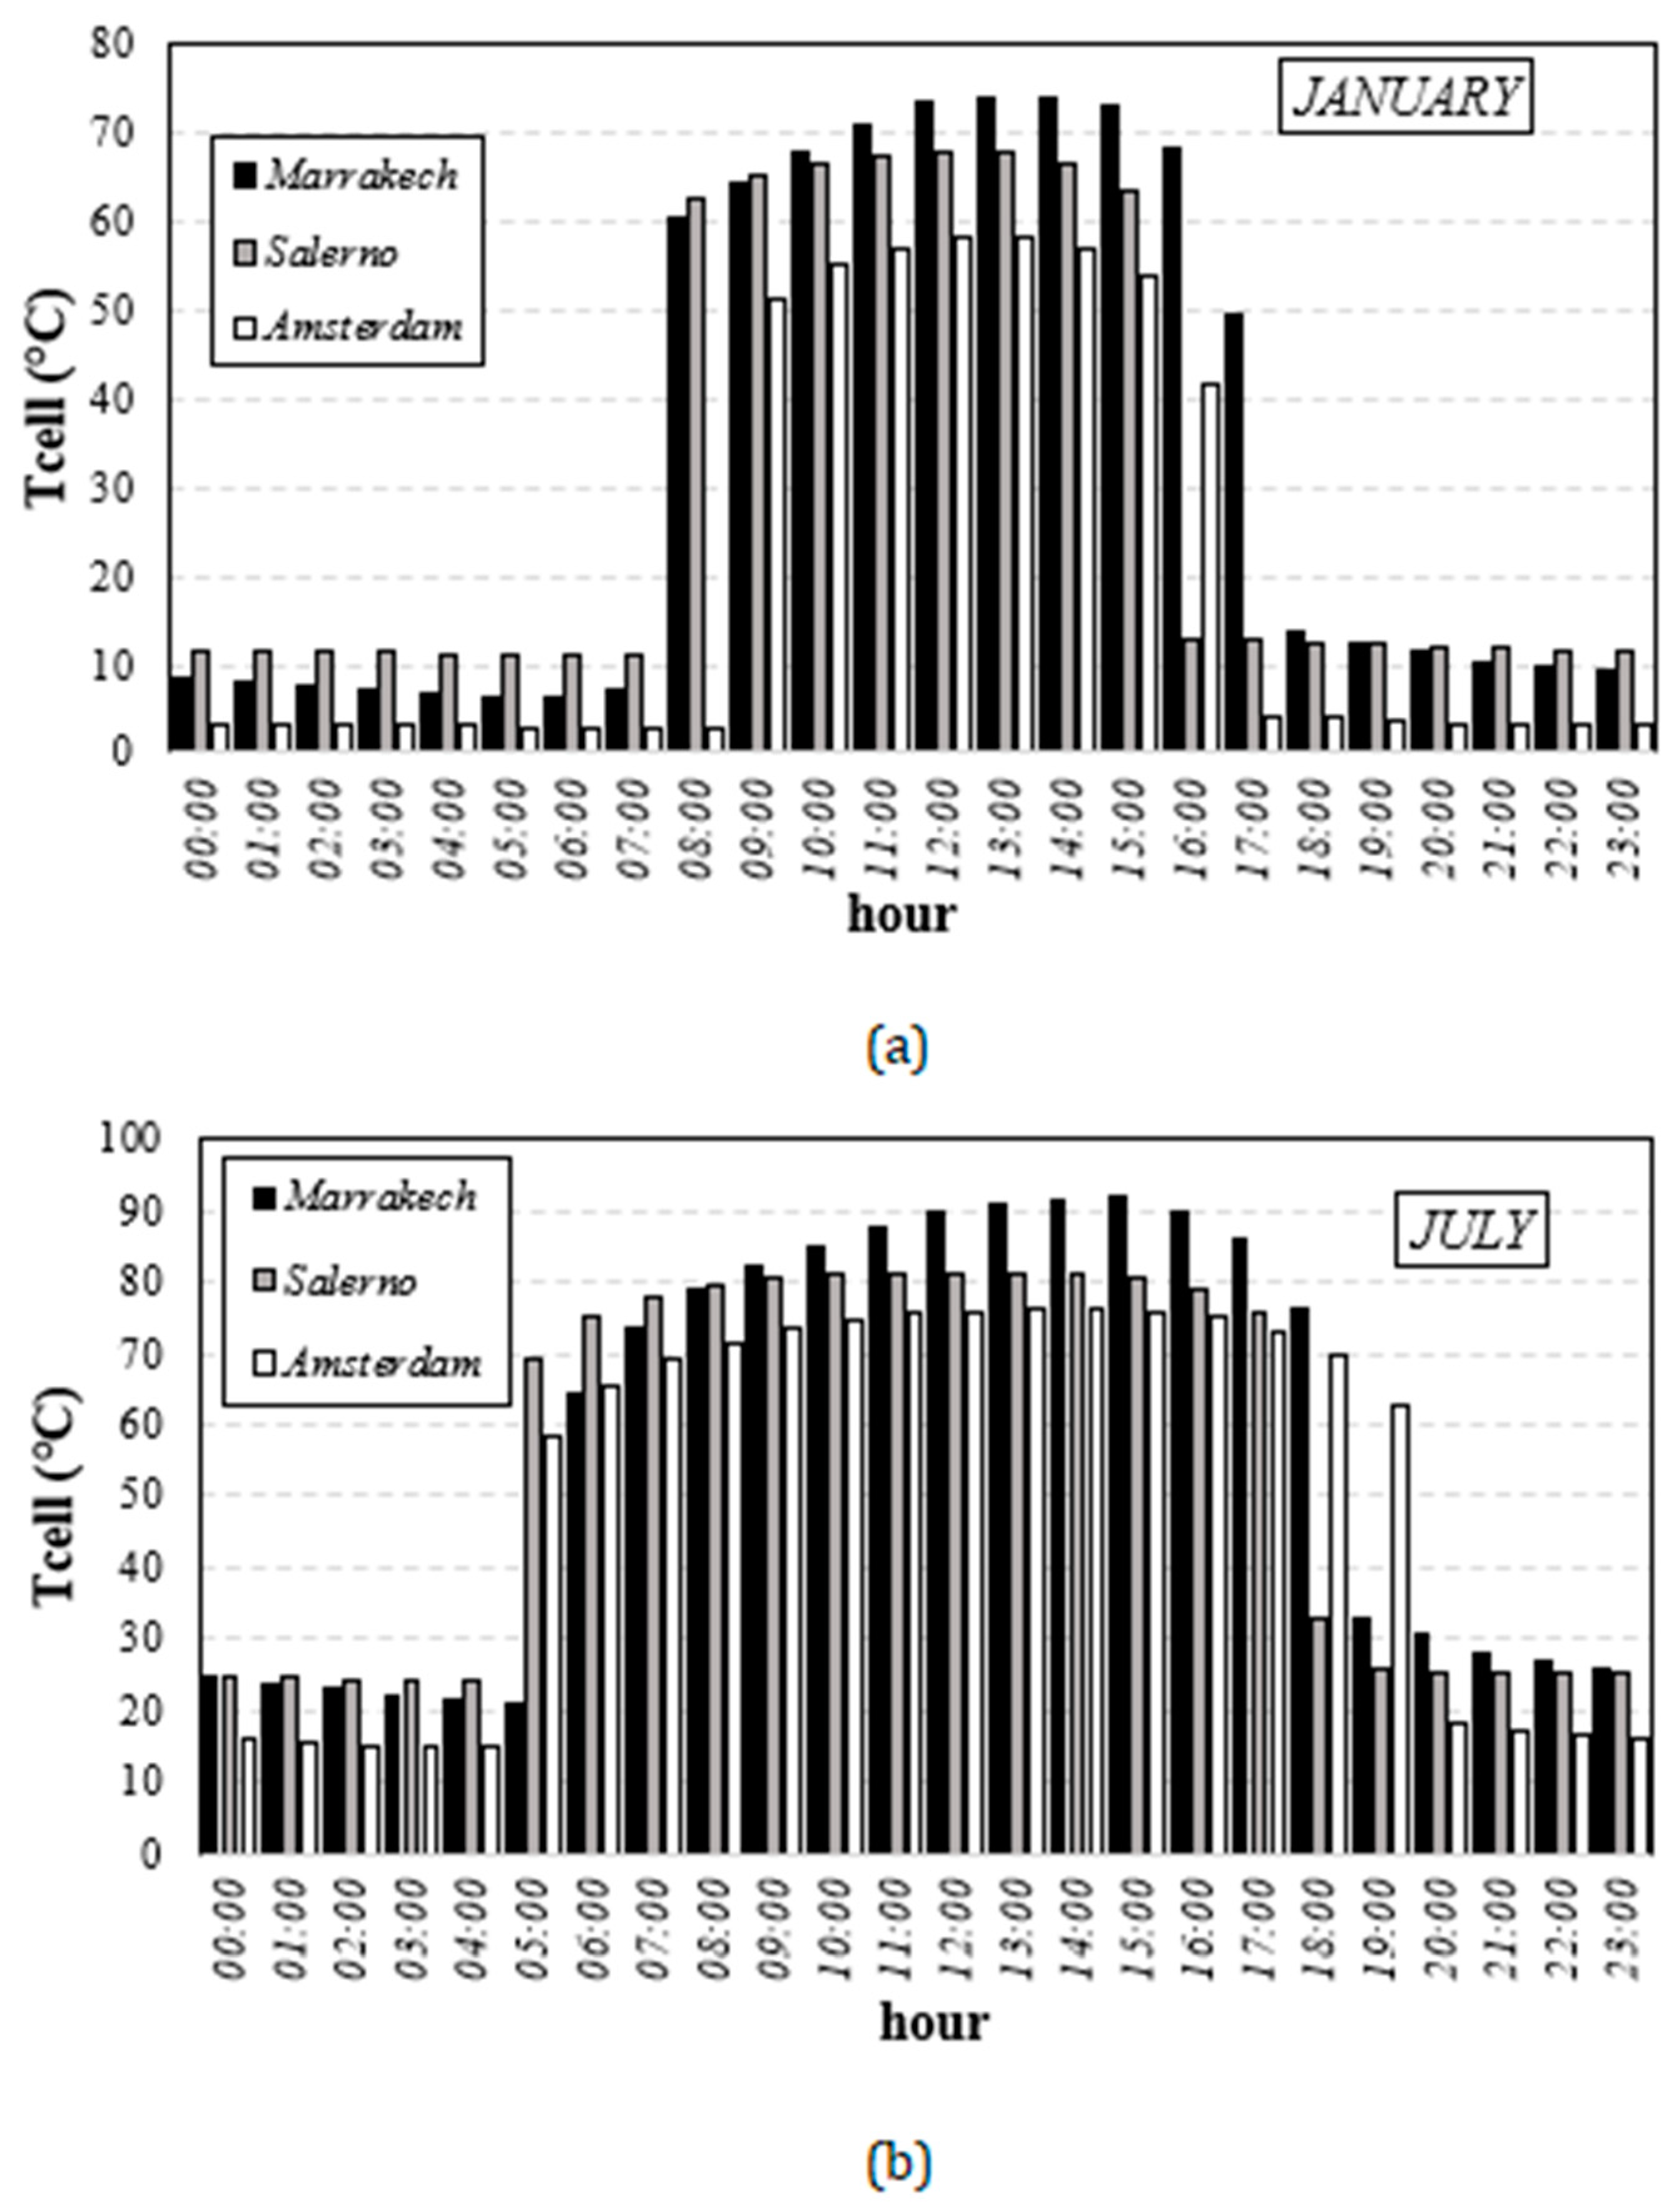
The TJ cell temperature at Marrakech is almost always the highest, reaching a peak of about 75.0 °C in winter day and of 90.0 °C in summer day (Figure 4).
Even if the higher temperatures negatively influence the electrical efficiency, they allow the recovery of high-quality thermal energy exploitable for the production of residential hot water, winter heating and summer cooling by means of an AHP. A similar situation is verified in Salerno, with temperatures about 10 °C lower. On the other hand, at Amsterdam the values of the TJ cell temperature are lower, with a maximum of 60 °C in winter and 76 °C in summer. The daily trends of P e l , m o d and Q t h , m o d for the two above mentioned days are respectively shown in the Figure 5 and Figure 6. According to Equation (2), the electric power supplied by a CPV/T module depends on DNI and Tcell when other conditions are equal. As shown in Figure 5a, in a winter sunny day, despite the electrical efficiency decrease due to the higher temperature, the higher levels of DNI assure at Marrakech the highest electrical power, with a peak of 146 W. The lowest power is that of Amsterdam, because of the low levels of DNI, with a maximum of 120 W. On the contrary, it can be noted in Figure 5b the opposite trend between summer and winter in terms of electrical power.
In fact, the negative influence of the higher temperature on electrical efficiency is more marked, thus causing a notable decrease of the electrical power, especially at Marrakech where it assumes the lowest values. Amsterdam presents the highest values because of the lower temperatures and similar values of DNI, reaching a peak of about 134 W.
A similar analysis can be realized for the thermal energy which can be recovered from a single CPV/T module. The highest values can be registered at Marrakech in winter, with a maximum thermal power of 860 W, followed by Salerno and Amsterdam; there is a trend reversal in the summer day less marked than the previous case. However, the quality of the recovered thermal energy is dependent on its temperature. Hence, Marrakech is the city that guarantees the highest potential from the cogeneration point of view [33].
The daily electrical and thermal producibilities depend also on the daily hours of sunlight. The values of daily electrical energy produced by a single CPV/T module for each locality are shown in Table 3 for the winter and summer days.
It can be observed the opposite trend between summer and winter also in terms of electrical producibility. In a winter sunny day, the electrical producibility varies between about 800 Wh at Amsterdam and about 1200 Wh at Marrakech. In summer the maximum producibility, equal to about 1600 Wh, is related to Amsterdam thanks to the higher daily hours of sunlight, while at Marrakech the producibility is minimum, about 1400 Wh. Figure 7 shows for each city the thermal producibility for different temperature levels in winter and summer sunny days. The total thermal energy follows the same trend of the electrical energy. It is maximum at Marrakech on the winter day (about 7000 Wh) and at Amsterdam in the summer day (about 4000 Wh). In each city it is possible to produce in a sunny day MT thermal energy also in winter, while in summer at Salerno and Marrakech, a CPV/T system can also produce HT thermal energy.
This study has been realized to highlight the influence of climatic conditions on the electrical and thermal performance of CPV/T system. In this analysis, the cloudiness and the consequent reduction of DNI have not been considered to compare the three cities under same conditions. However, an accurate energy performance evaluation of CPV/T system requires the real annual hourly distribution of DNI and Tenv for each city [28]. Considering these data, the CPV system sizing for a residential user has been realized for each city. The parameters values necessary for this analysis are reported in Table 4 [3].
It can be noted that the thermal load also includes the thermal energy necessary to produce domestic hot water. These values are shown in Table 5 for Marrakech and Amsterdam which represent the two extreme conditions.
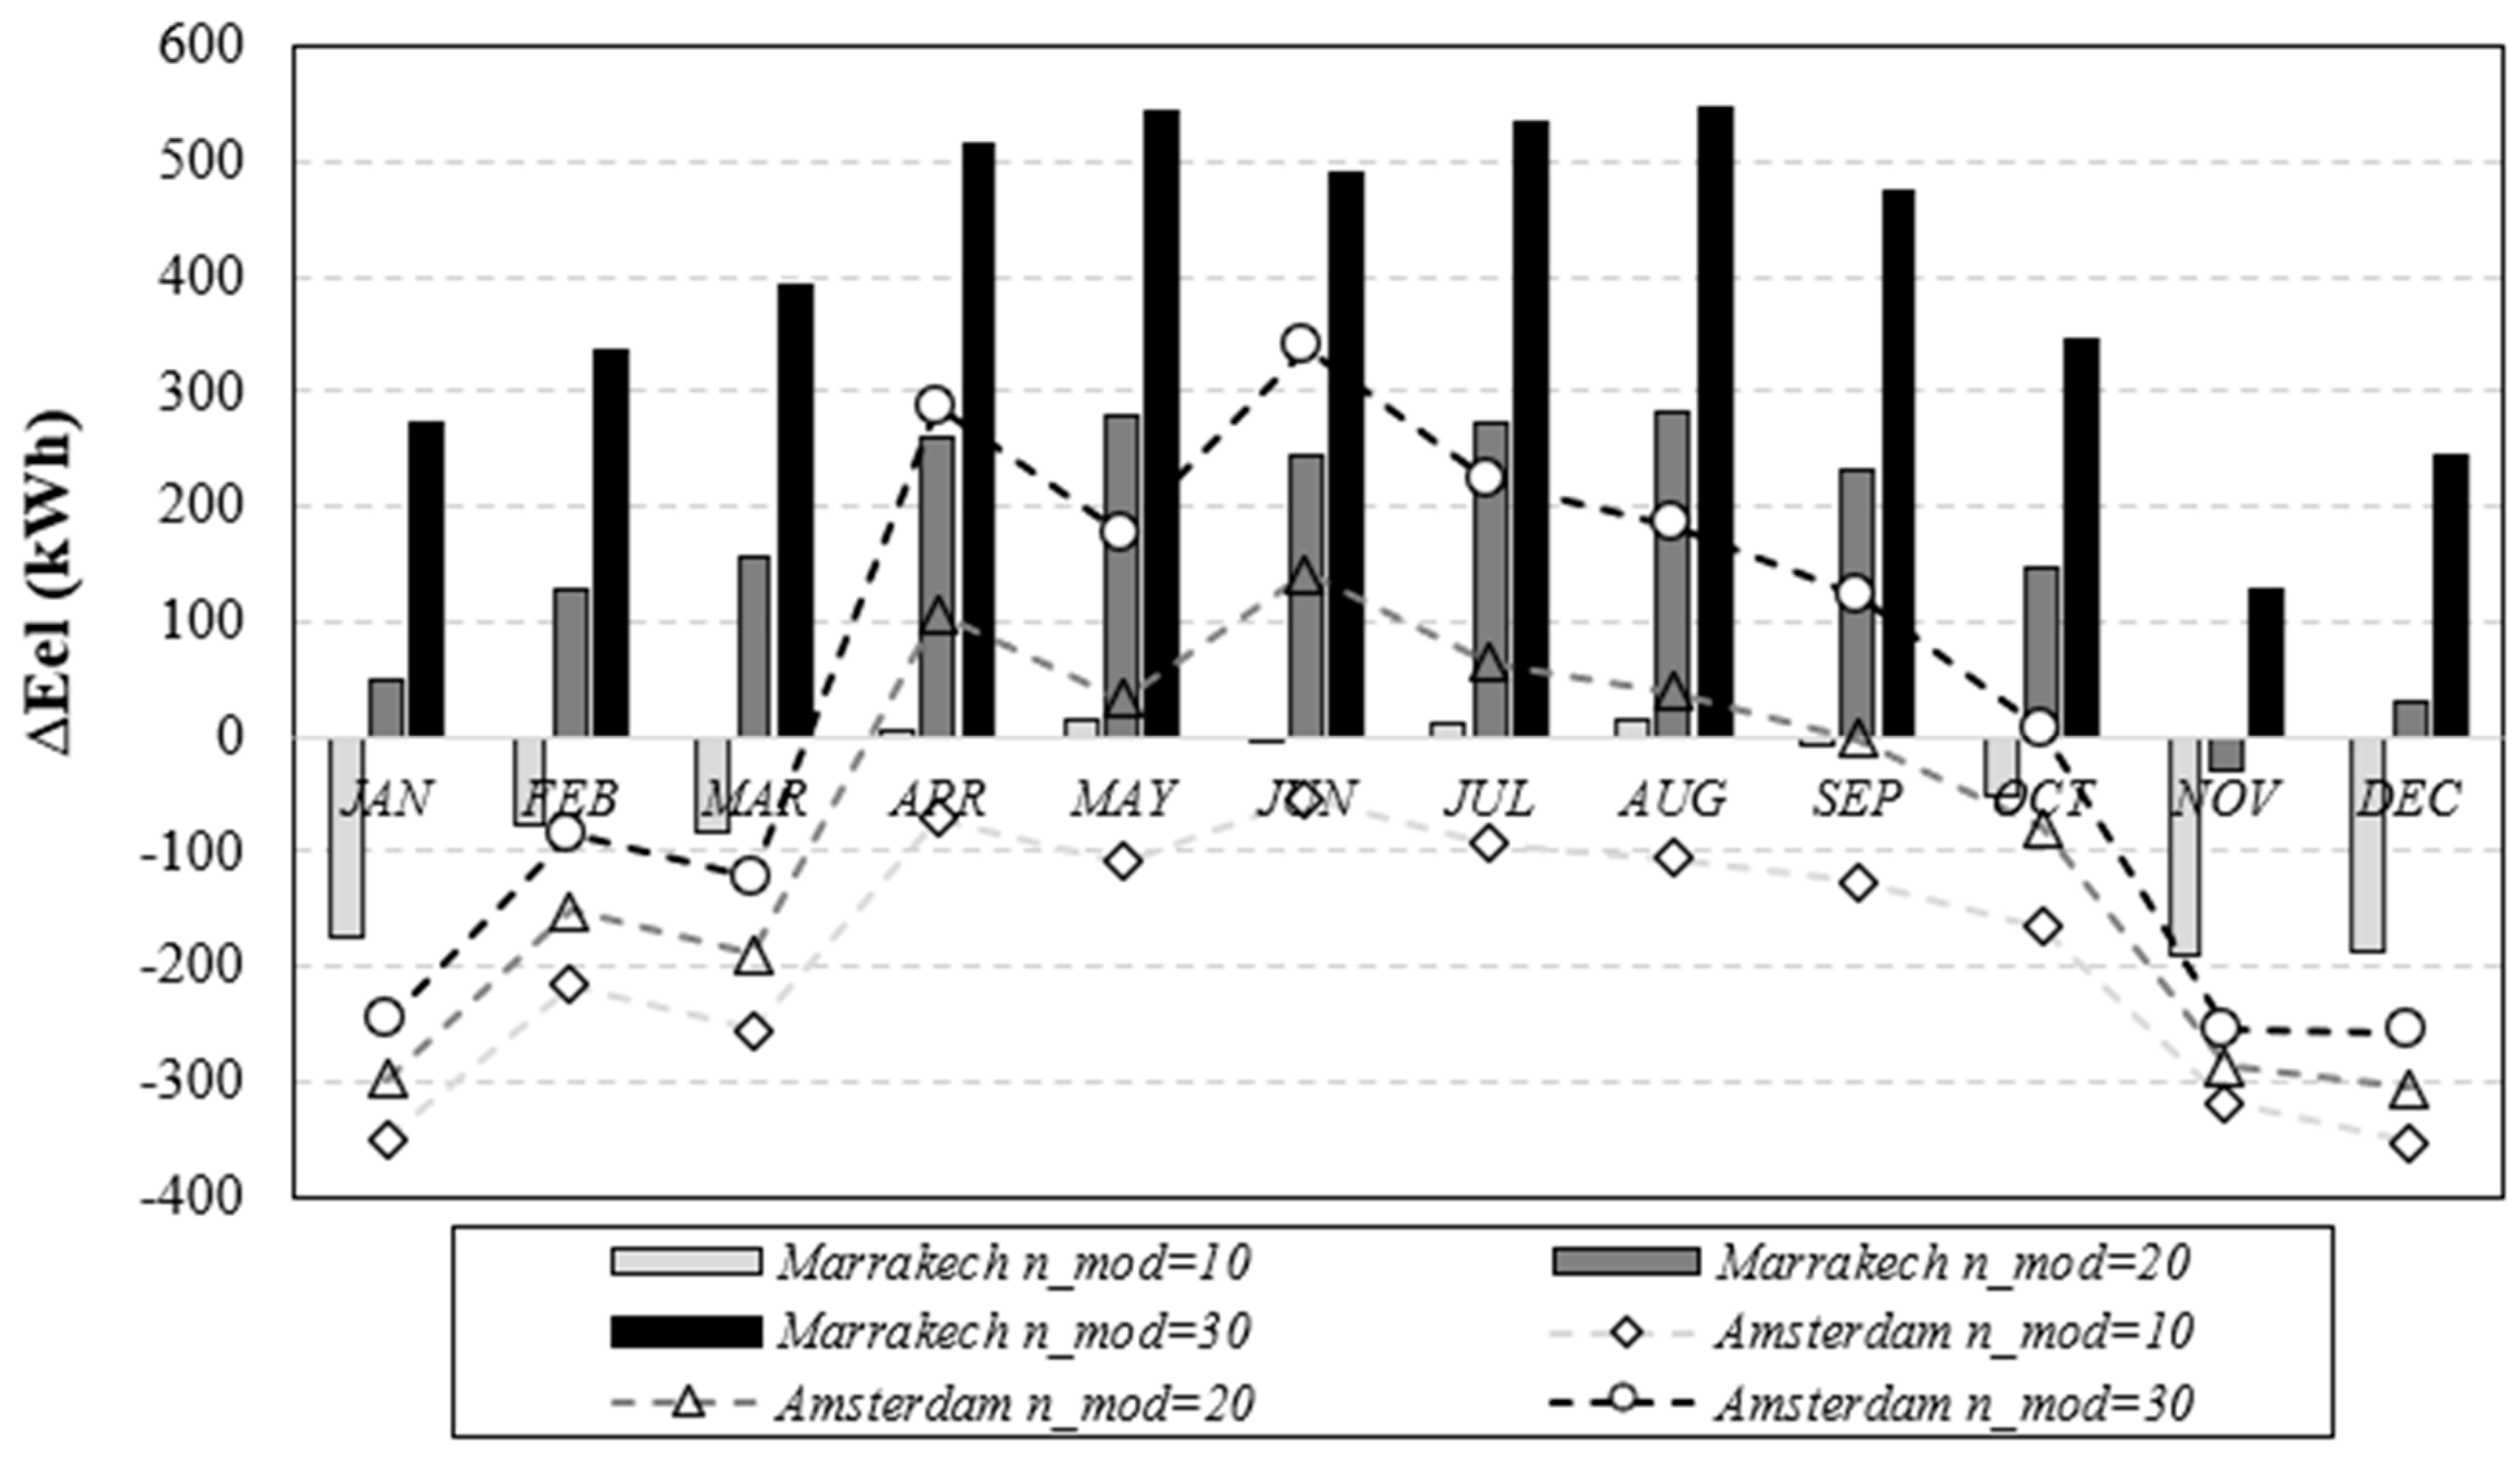
At Marrakech the thermal loads are much lower than in Amsterdam because of higher temperatures. Moreover, in the summer season, unlike in Amsterdam, cooling energy is necessary. The experimental CPV/T system described in Section 2, with an optical concentration factor equal to 90 and 60 cells, has been considered as single module. Once known the annual hourly values of Tenv and DNI, it is possible to calculate, by means of Equations (2) and (3), respectively the electrical ( P e l , m o d ) and thermal ( Q t h , m o d ) powers supplied by a single module and then the module monthly and annual production for each city. The power and energy producibility of the CPV/T system depend on the modules number according to Equations (4) and (5). It is interesting to study monthly the difference between necessary and produced energy varying the modules number in the two extreme cases: Marrakech and Amsterdam. As shown in Figure 8, at Marrakech 10 modules are enough to satisfy the electrical load only between April and August. If 20 modules are adopted, the CPV/T electrical producibility could exceed the load almost every month. A further increase of the modules number can determine an overproduction of energy not required by the user.
On the contrary, at Amsterdam the CPV/T system electrical producibility is highly variable during the year, with peaks in summer season and very low values in winter season. Therefore, the electrical load can’t match in each month but only between April and September. The electrical energy surplus of the CPV/T system is sold to the energy network.
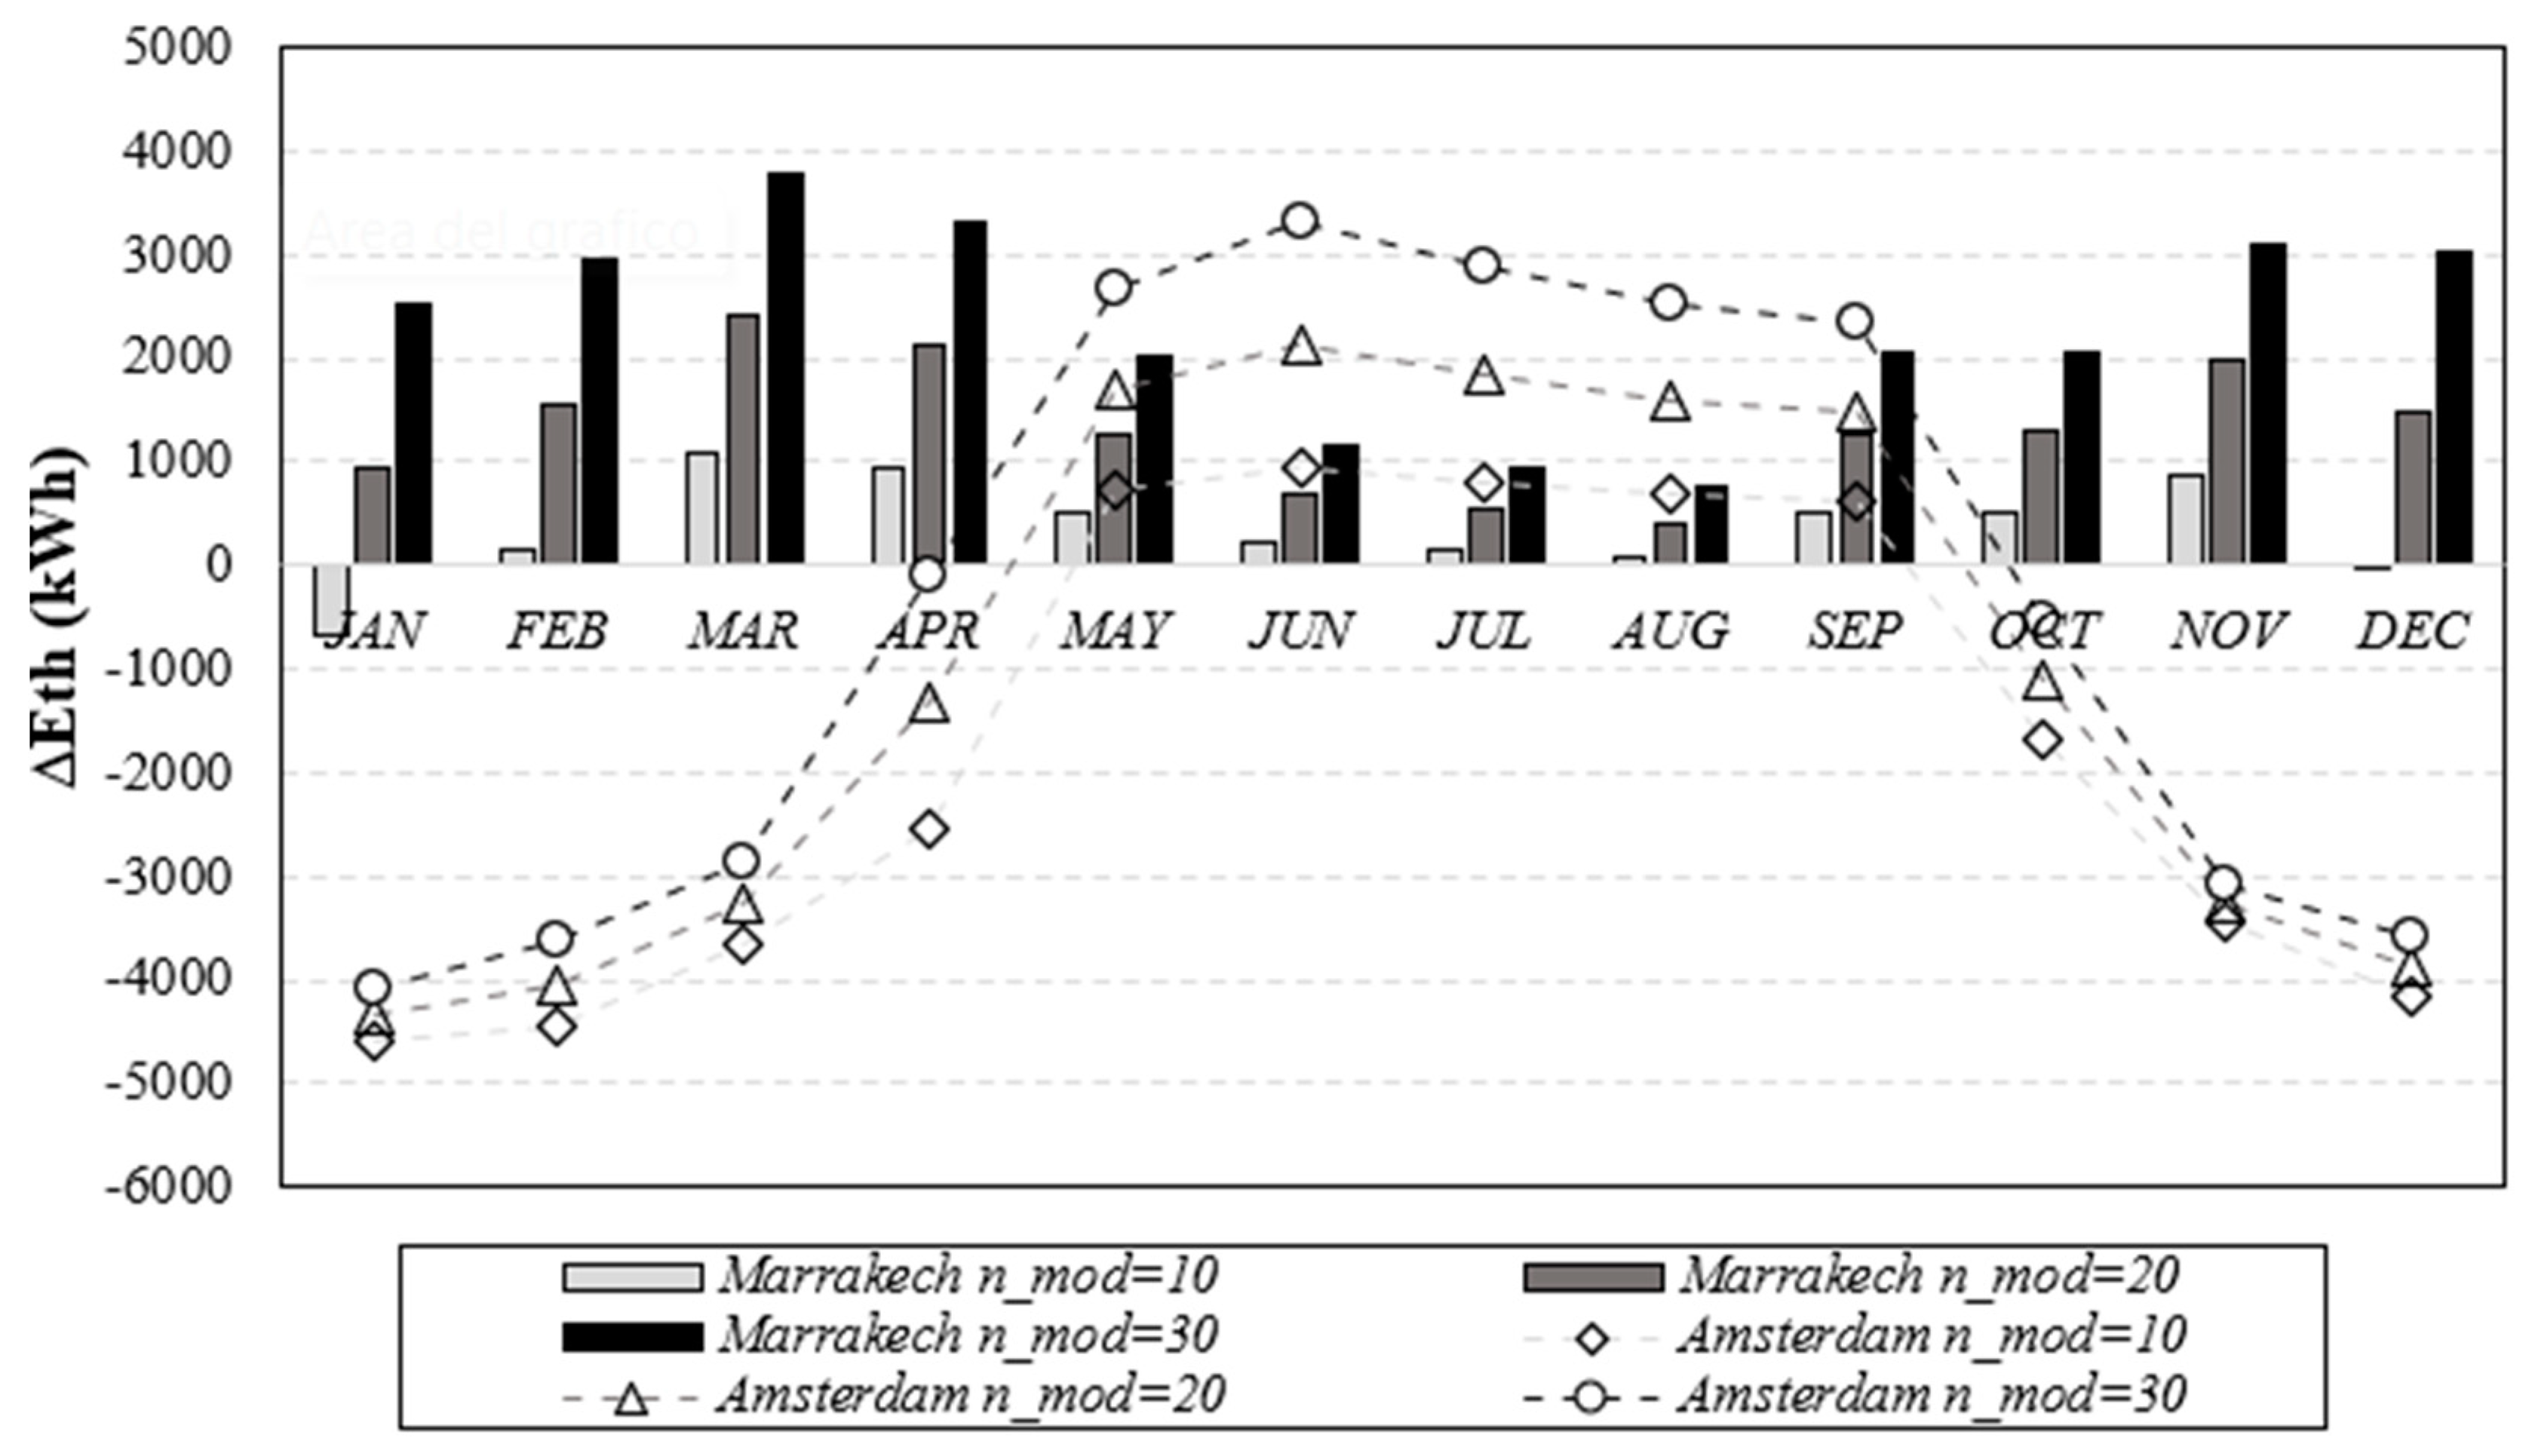
Figure 9 shows the monthly difference between the CPV/T system thermal producibility and the thermal loads for a different number of modules.
In this evaluation it has been considered only the middle-temperature useful to supply residential hot water or winter heating. It can be noted that at Marrakech 10 modules could be enough to cover the thermal energy needs almost all the year. On the contrary, at Amsterdam the thermal load in winter is high and only partially is covered by a CPV/T system. The low values of DNI, due to high cloud cover, affects the thermal producibility; between May and September the CPV/T system thermal output exceeds the thermal load also with 10 modules.
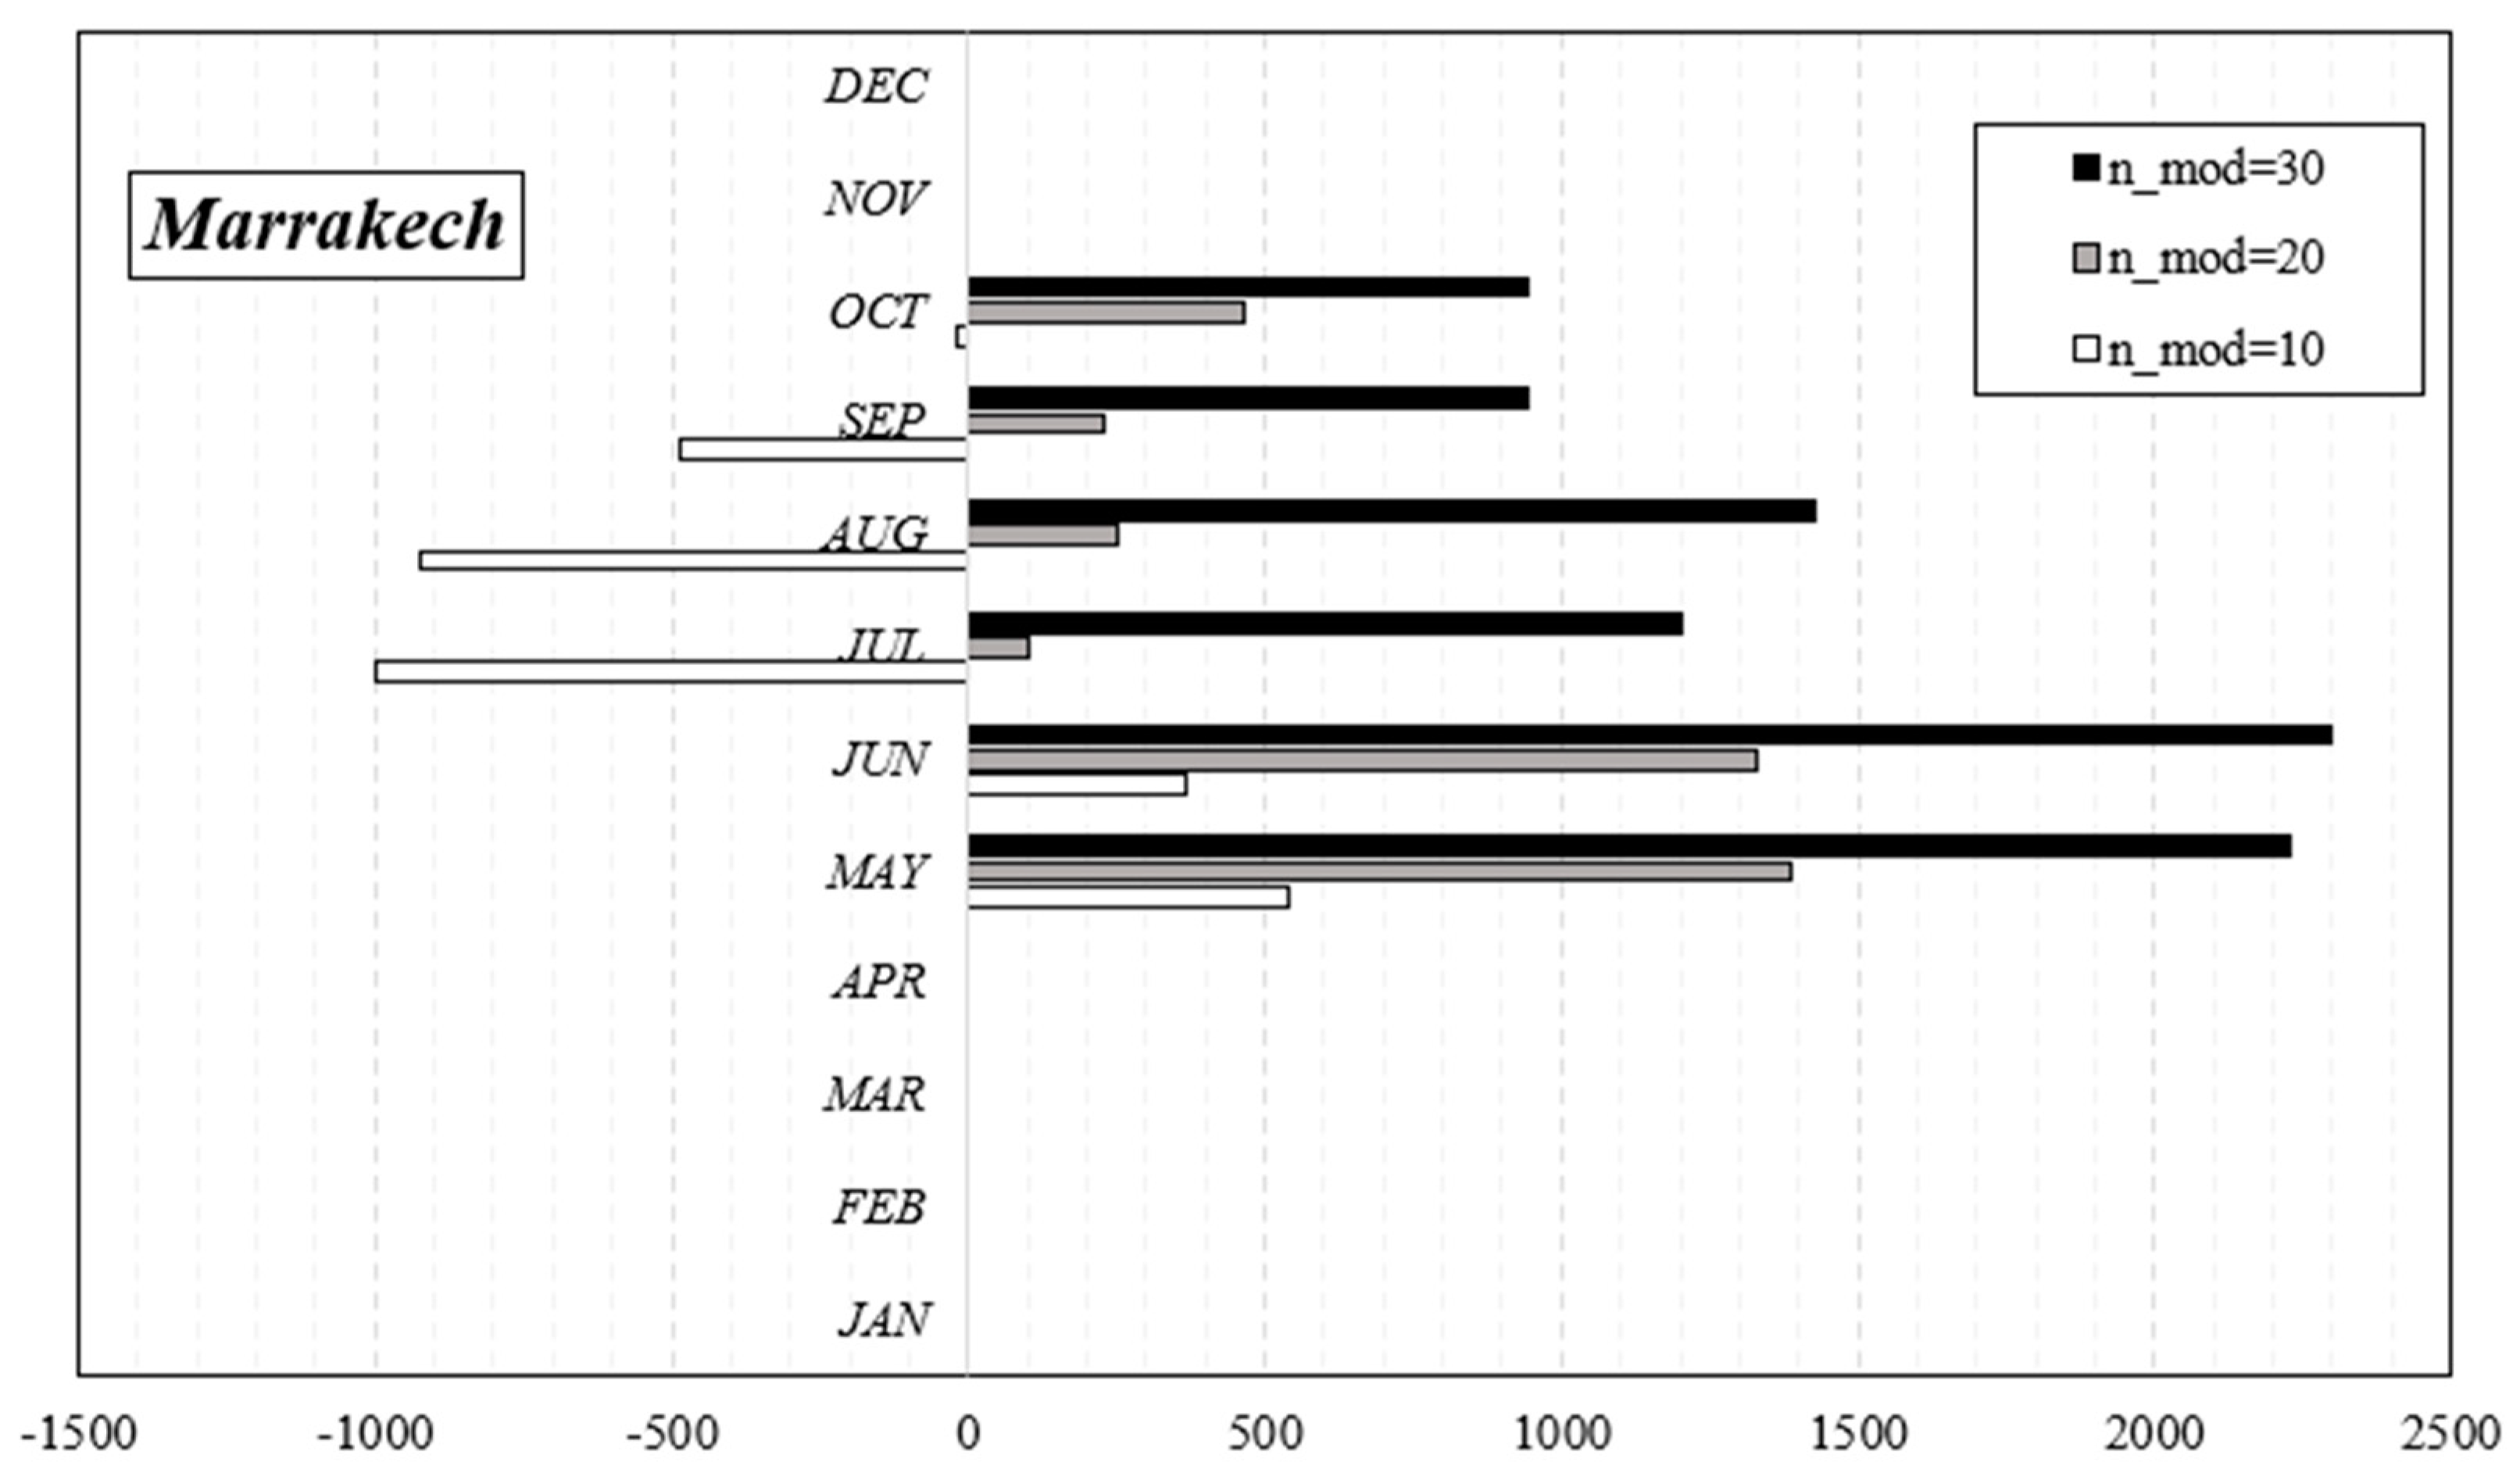
The higher temperatures which can be reached by the cooling fluid in the summer season at Marrakech allow the production of cooling energy too. The thermal energy available at temperatures higher than 80 °C can be used to produce cooling energy by coupling the CPV/T system to an AHP. The difference between the CPV/T system cooling outputs and the cooling loads for a different number of modules at Marrakech is reported in Figure 10 on a monthly basis; in particular, 20 modules allow to cover the cooling needs.
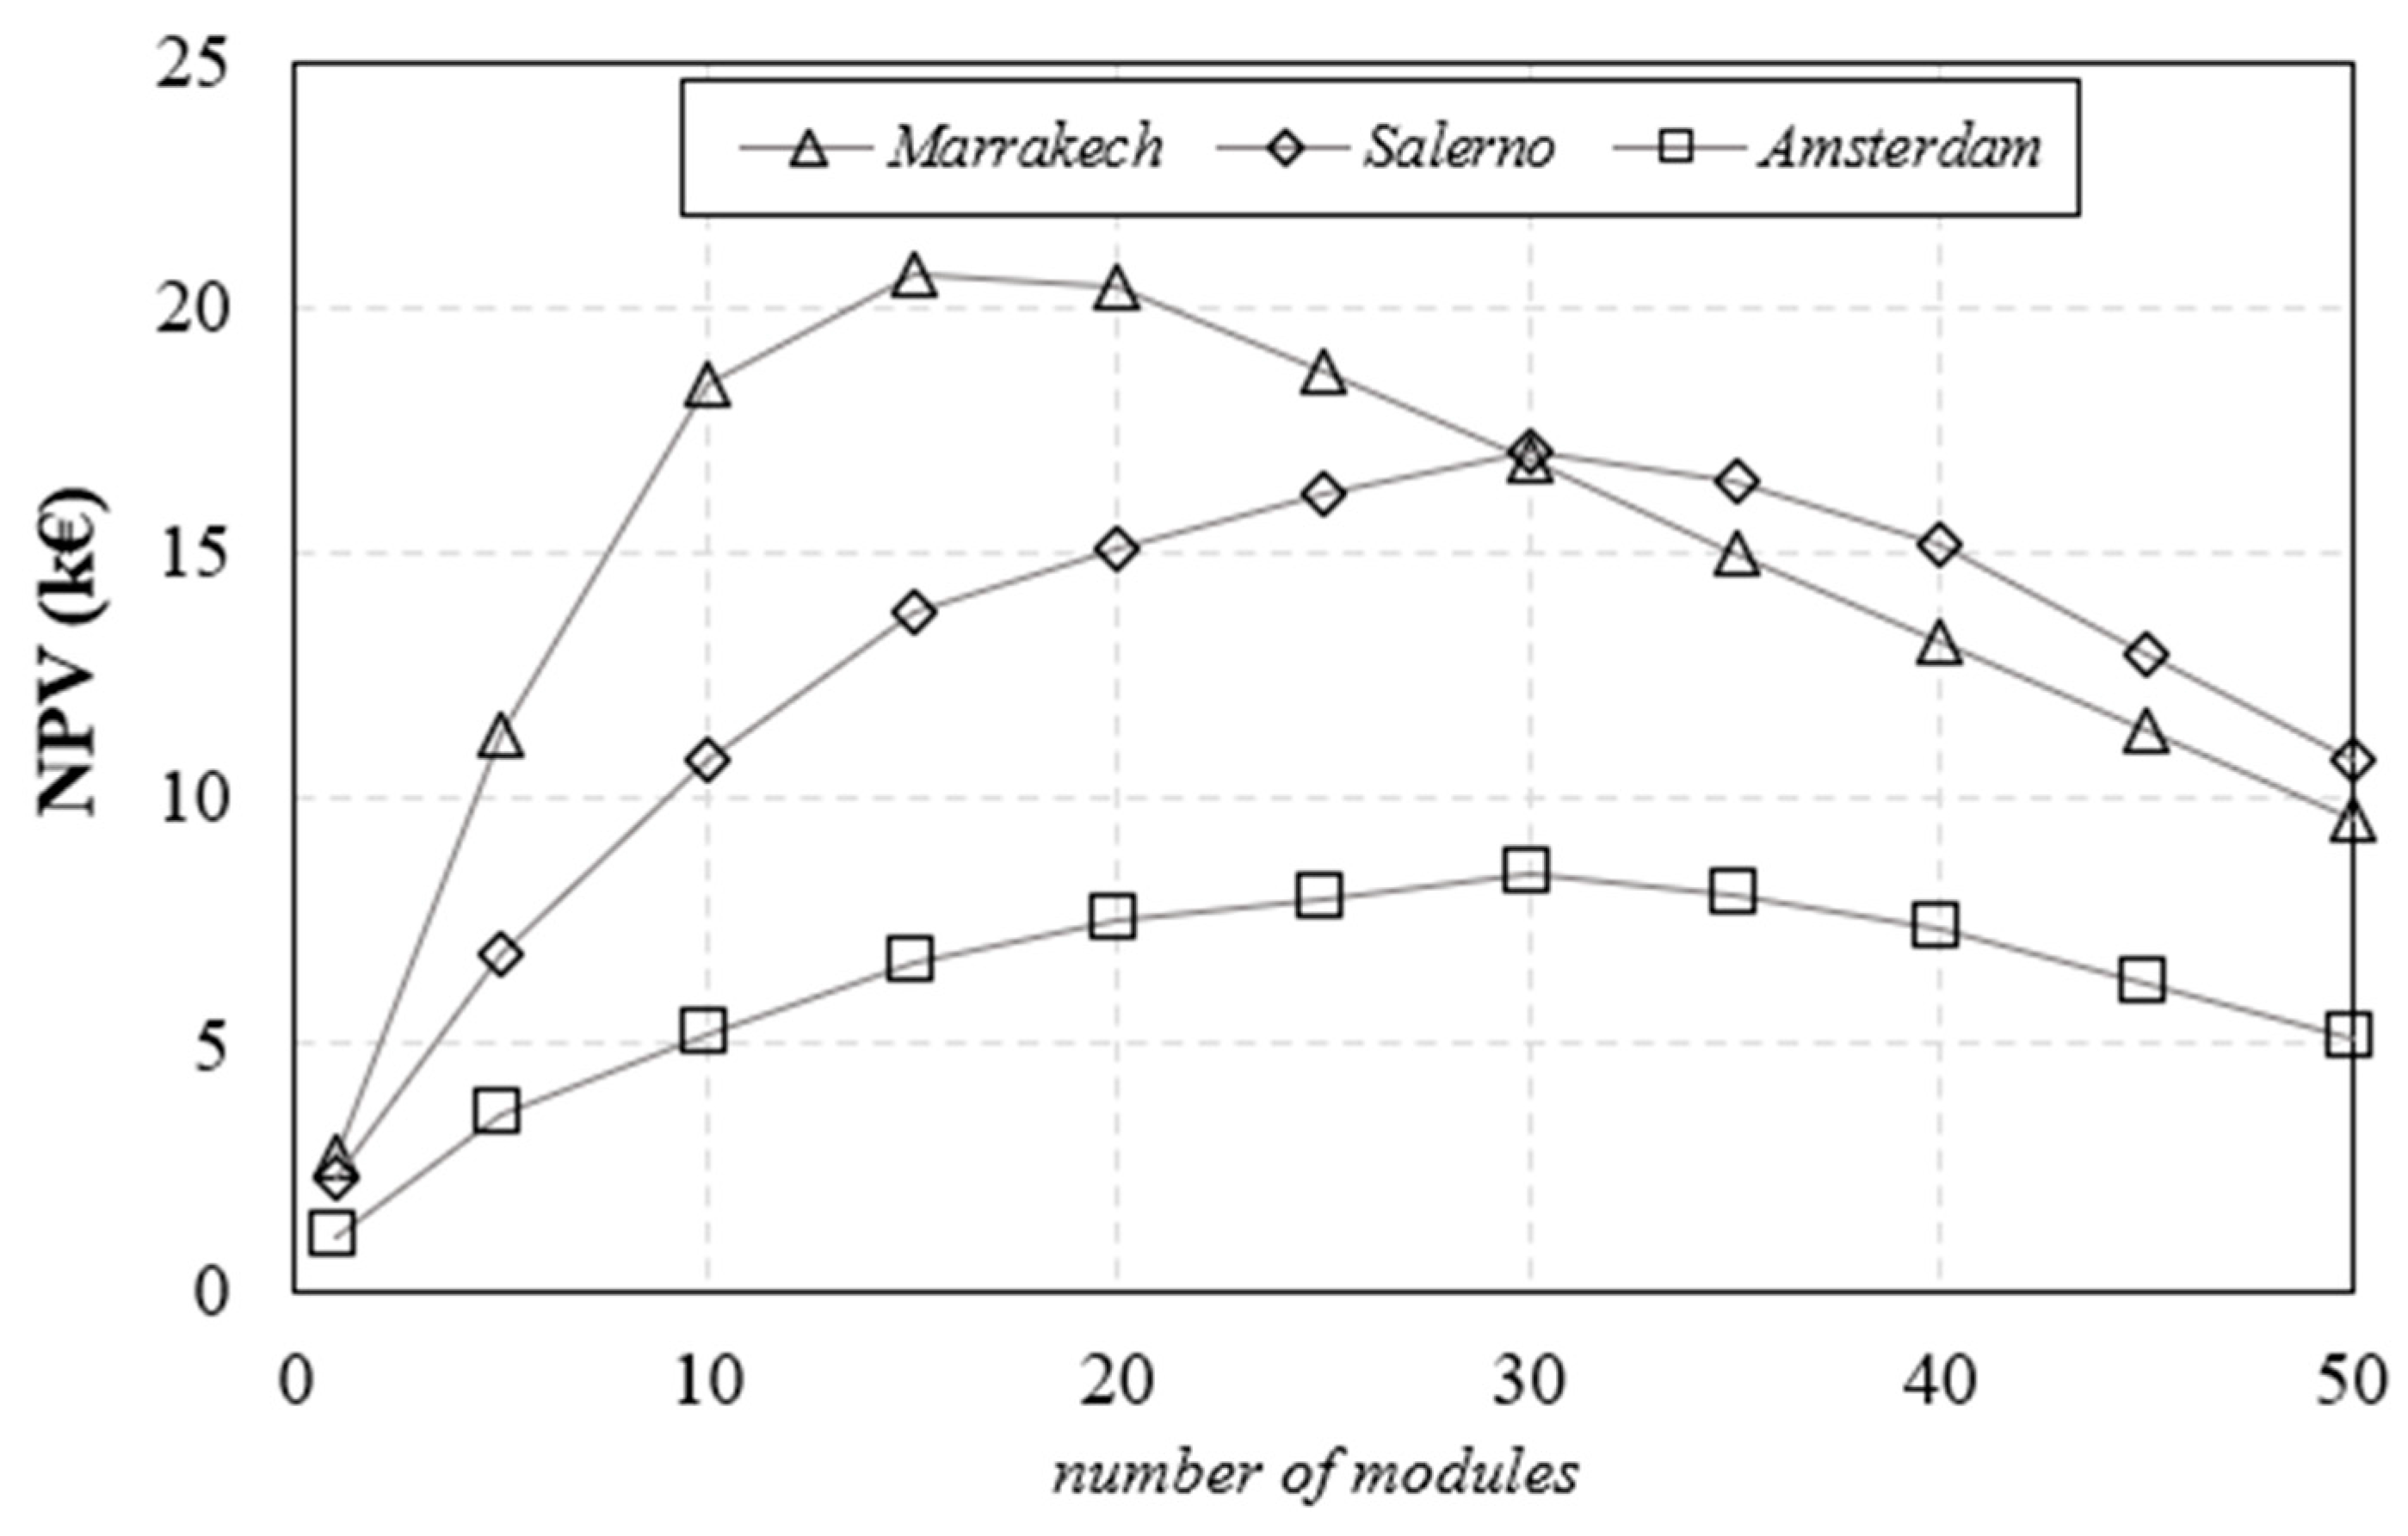
The optimal modules number for each city has been determined to maximize the investment profitability in terms of NPV. The NPV values calculated at the 20th year, average useful life of CPV/T system, in terms of the modules number, are shown in Figure 11. For each city, the NPV value increases with the modules number until it reaches its maximum value. A further increase of the CPV system size determines an electric energy surplus that can be sold to the energy network at price lower than purchase price, thus decreasing the cash flows. An oversized system determines also a thermal and cooling energy surplus causing losses. The optimal modules number is different for the three cities and equal to 15 for Marrakech and 30 for Salerno and Amsterdam.
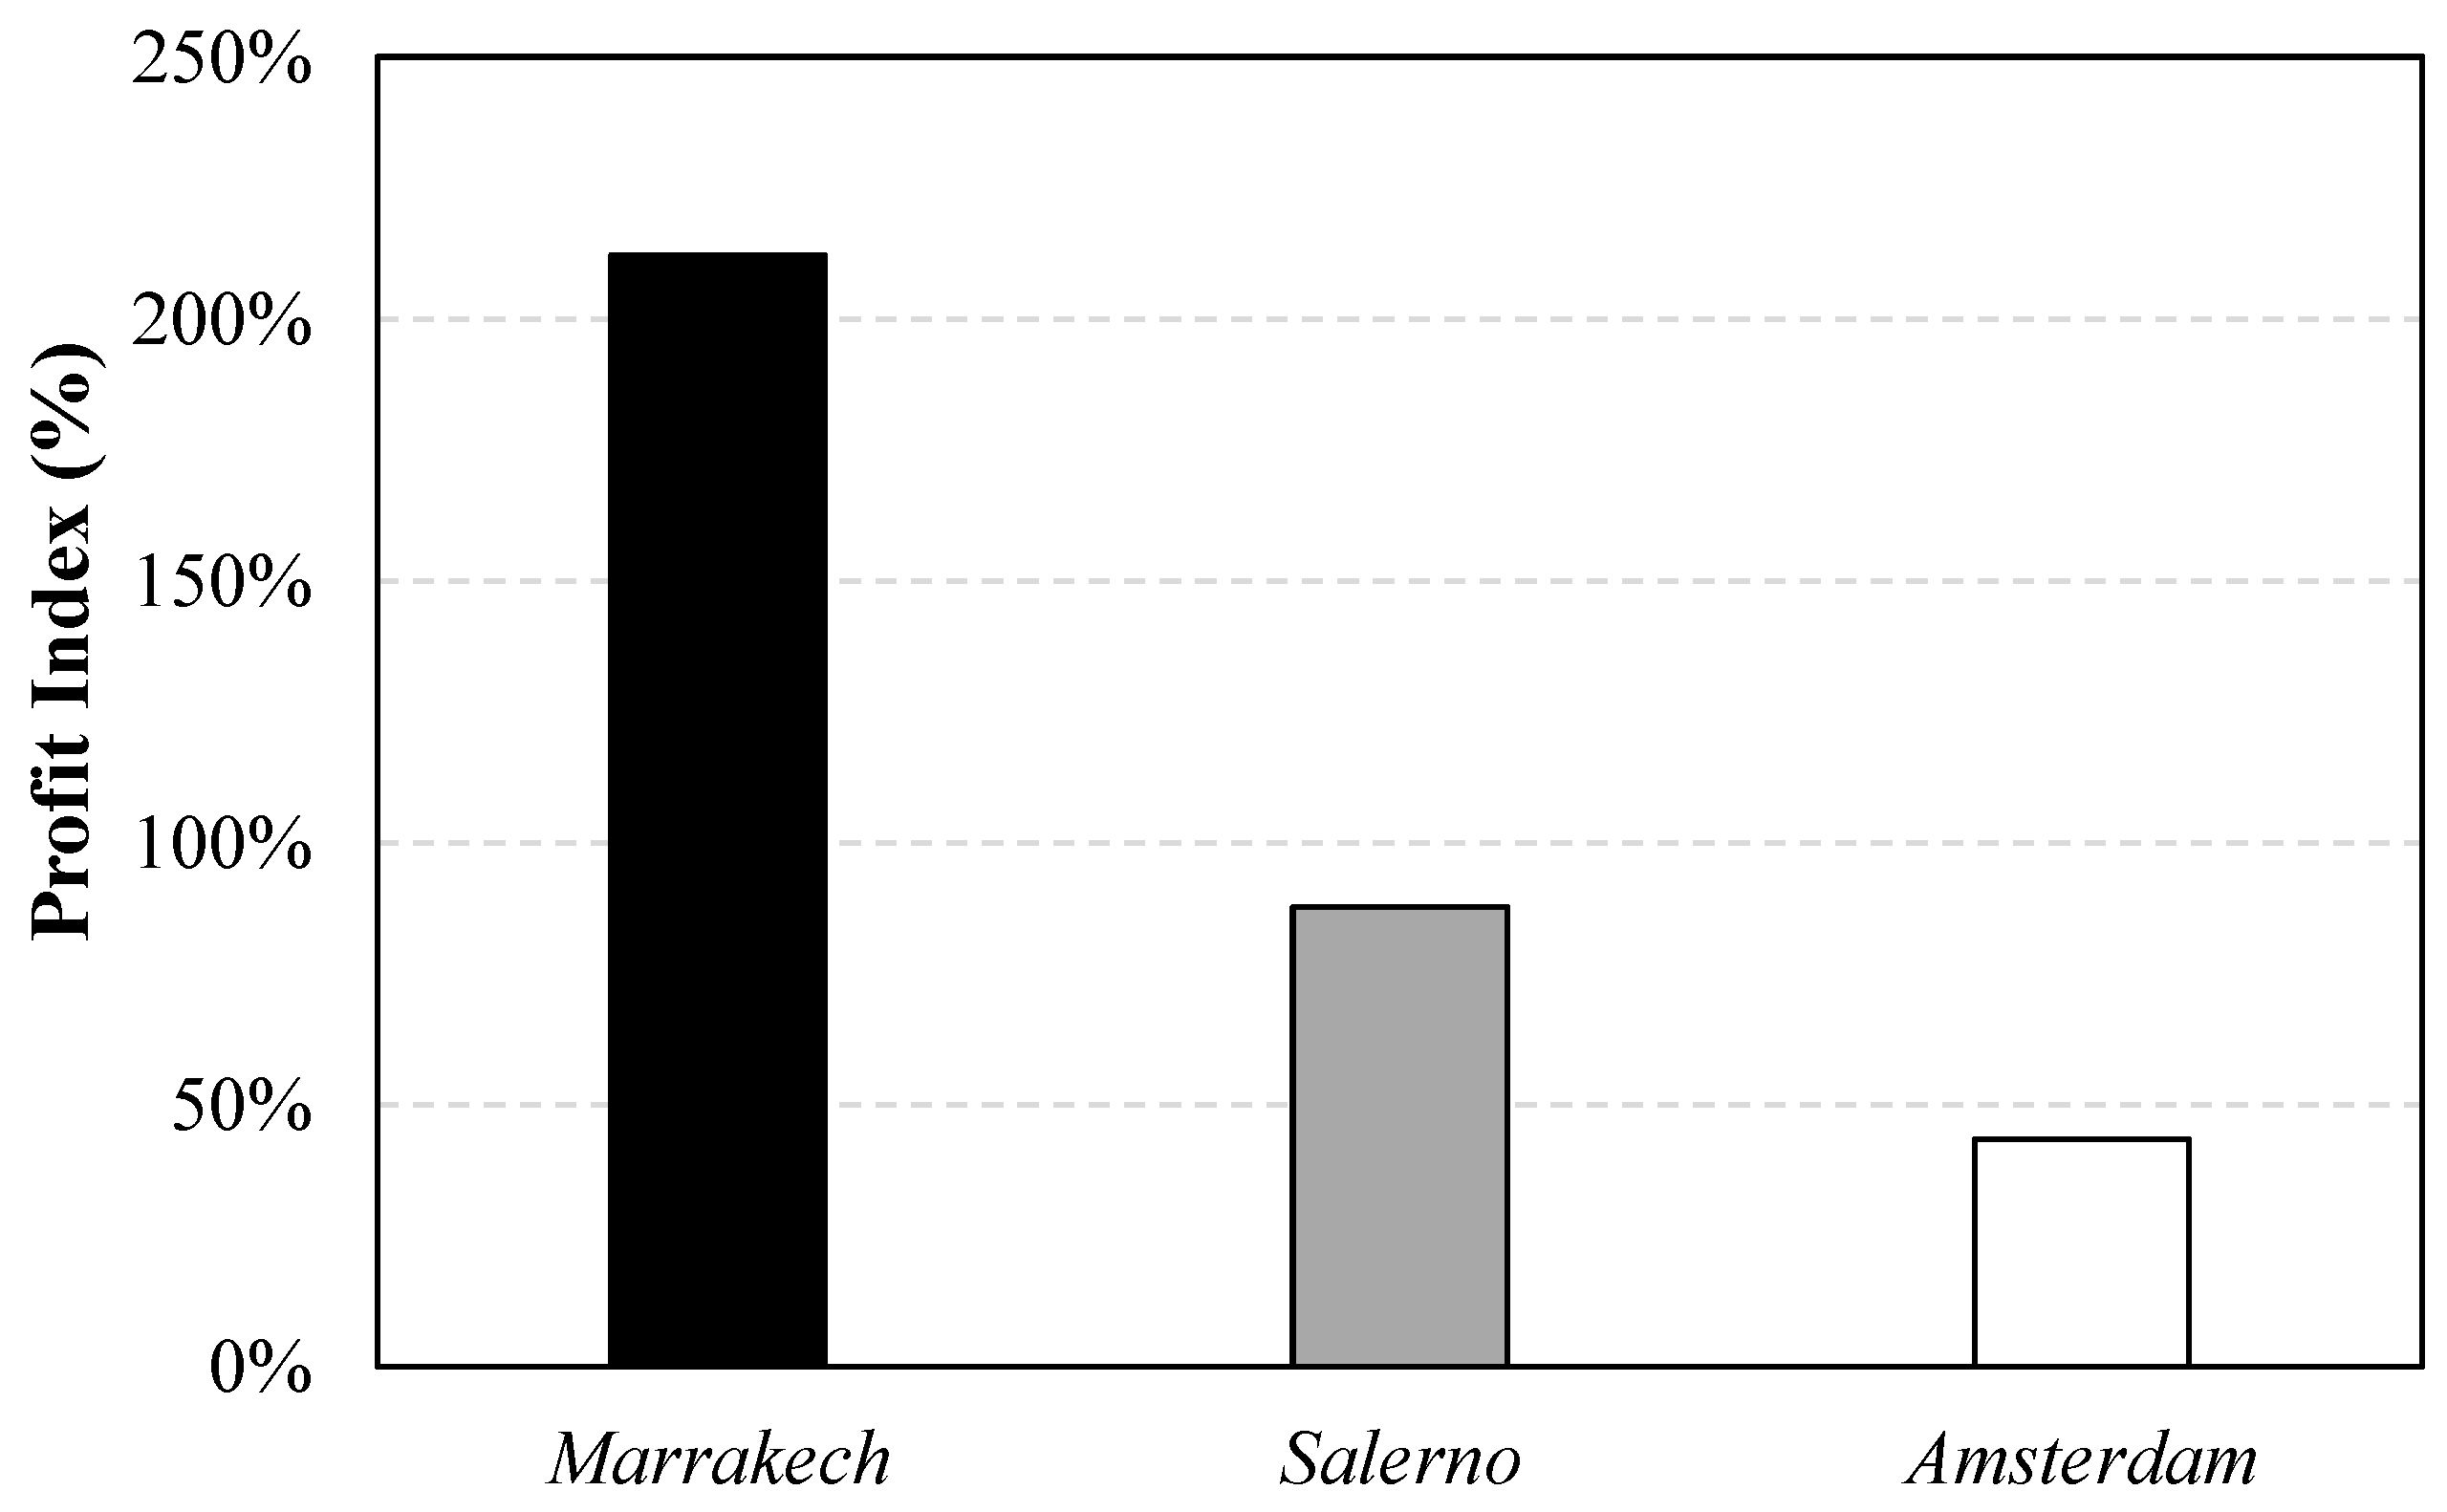
The NPV values are also different. NPV presents the maximum value, about 20.7 k€, for a CPV/T system installed at Marrakech where the annual climatic conditions are most suitable. On the contrary, at Amsterdam, despite the good conditions in terms of TJ cell temperature [30], the high cloudy days’ number decreases the DNI and then the electric and thermal production of a CPV/T system. For this reason, the values of NPV are low with a maximum of 8.50 k€ in correspondence of 30 modules. The NPV trend over the years corresponding to the optimal modules number is shown in Figure 12 for each city. Moreover, the DPBP is equal to about 6 years for Marrakech, 10 years for Salerno and 14 for Amsterdam. Finally, the Profit Index (PI) corresponding to the optimal modules number, has been calculated for each city. The results are shown in Figure 13 where it can be observed that the most profitable investment is obtainable to Marrakech where PI is equal to about 212%.
The investment is quite convenient also in Salerno, with a PI equal to 88%, but not at Amsterdam because its PI is equal to only 43%.

5. Conclusions

In this paper the main aim was to evaluate the energy performance of line-focus CPV/T system applied to the residential user when the installation site varies.
The installation site strongly influences the operation of CPV/T systems whose energy efficiency is strictly dependent on climatic conditions and therefore on parameters such as Tenv, DNI and daily sunlight hours. For this reason, the energy performance of these systems has been evaluated in three different cities characterized by very different climatic conditions, such as Amsterdam, Marrakech, and Salerno.
The proper evaluation of the energy performance of these systems has allowed, for each city considered, to optimize the solution from economic point of view. This optimization has been obtained by the determination of optimal sizing of the CPV/T system aimed at reducing its cost and payback time.
Hence, a model that links electrical power with TJ cell temperature and solar radiation concentrated on solar cells, has been experimentally determined to evaluate the CPV/T system energy performances, together with an equation that links T c e l l , T e n v and R c e l l . Once calculated P e l , m o d , it has been possible to calculate also the recoverable thermal power by energy balance on CPV/T module.
First, a comparison between the three cities for typical winter and summer sunny days, has been presented. Results have shown that T c e l l at Marrakech is almost always the highest, reaching a peak of about 92 °C in summer day. Because of the higher temperatures, the module electric power on hot summer days presents values lower than winter day with maximum values respectively equal to 134 W and 146 W. The recovered thermal power reaches its maximum value of 850 W in winter at Marrakech. Due to the highest values of T c e l l , Marrakech presents the highest potential from the cogeneration point of view. Since the electrical and thermal producibilities depend also on the daily hours of sunlight, they are higher in summer with maximum values respectively of about 1600 Wh and 4000 Wh per module.
Successively, considering the actual annual hourly distribution of DNI and Tenv for each locality, a CPV/T system applied to a residential user of 120 m2 with 4 persons, has been sized. For each locality, the same monthly electrical, thermal and cooling loads considering the different climate conditions, have been considered. At Marrakech, the CPV/T system electrical producibility is not very variable during the year and 20 modules are sufficient to match the electrical load. In Amsterdam, the electric load can be satisfied only between April and September. From a thermal point of view, at Marrakech 10 modules are sufficient to cover the thermal energy needs almost all the year. Moreover, the temperatures reached by the cooling fluid in summer, higher than 80 °C, also allow the production of cooling energy by coupling the CPV/T system with an AHP. On the contrary, at Amsterdam, the thermal loads in the winter period are excessively high to be entirely covered with a CPV/T system.
Moreover, the modules’ optimal number has been determined for each city to maximize the investment profitability in terms of NPV at the 20th year, average useful life for a CPV system. The most profitable investment is at Marrakech where with 15 modules the NPV assumes its maximum value equal to 20.7 k€, with DPBP of 6 years and PI equal to 212%. The investment is quite convenient also in Salerno, with NPV of 17.1 k€, DPB of 10 years, and PI equal to 88%. Finally, the investment is not profitable in Amsterdam, with NPV and PI equal respectively to 43%.

Author Contributions

Conceptualization, C.R. and A.P.; methodology, C.R. and A.P; software, C.R., A.P., D.D. and F.M.; validation, C.R., A.P., D.D. and F.M.; formal analysis, C.R., A.P., D.D. and F.M.; investigation, C.R., A.P., D.D. and F.M.; resources, C.R., A.P., D.D. and F.M.; data curation, C.R., A.P., D.D. and F.M.; writing—original draft preparation, C.R., A.P., D.D. and F.M.; writing—review and editing, C.R., A.P., D.D. and F.M.; visualization, C.R., A.P., D.D. and F.M.; supervision, C.R.; project administration, C.R.; funding acquisition, C.R. All authors have read and agreed to the published version of the manuscript.

Funding

This research received no external funding.

Data Availability Statement

Not applicable.

Conflicts of Interest

The authors declare no conflict of interest.

Nomenclature

AArea (m2)
AHPAbsorption Heat Pump
CFCash Flow (€/year)
COPCoefficient of Performance
CPVConcentrating Photovoltaic system
CPV/TConcentrating Photovoltaic and Thermal system
CS Cost saving (€/year)
CConcentration factor
CoptOptical concentration ratio
c cool Unit purchase cost of cooling energy (€/kWh)
c el Unit purchase cost of electrical energy (€/kWh)
c th Unit purchase cost of thermal energy (€/kWh)
c mod Cost per module (€/mod)
DNIDirect Normal irradiance (W/m2)
DPBPDiscount Pay-Back Period (year)
E Energy (kWh)
η Efficiency
f Non-ideal tracking system factor
GGains from the sale of surplus energy (€/year)
HT High Temperature
I 0 Initial investment (€)
LCV Low Calorific Value (kWh/kg)
LT Low Temperature
MT Middle Temperature
n Number
NPVNet Present Value (€)
PElectric power (W)
PVPhotovoltaic
p e Electrical energy selling price to the energy network (€/kWh)
QThermal power (W)
RcellConcentrated solar radiation incident on TJ cell (W/m2)
r Discount rate
TTemperature (°C)
TJ Triple-Junction cell
PI Profit Index
UL CPV system Useful Life (year)
Subscripts
c cell
elelectric
envenvironmental
invinverter
losslosses
m monthly
modmodule
optoptical
ththermal
tubecoolant flow tube
U user

References

  1. Rejeb, O.; Shittu, S.; Ghenai, C.; Li, G.; Zhao, X.; Bettayeb, M. Optimization and Performance Analysis of a Solar Concentrated Photovoltaic-Thermoelectric (CPV-TE) Hybrid System. Renew. Energy 2020, 152, 1342–1353. [Google Scholar] [CrossRef]
  2. Burhan, M.; Shahzad, M.W.; Oh, S.J.; Ng, K.C. Long Term Electrical Rating of Concentrated Photovoltaic (CPV) Systems in Singapore. Energy Procedia 2019, 158, 73–78. [Google Scholar] [CrossRef]
  3. Renno, C.; D’Agostino, D.; Minichiello, F.; Petito, F.; Balen, I. Performance Analysis of a CPV/T-DC Integrated System Adopted for the Energy Requirements of a Supermarket. Appl. Therm. Eng. 2019, 149, 231–248. [Google Scholar] [CrossRef]
  4. Smil, V. Energy: A Beginner’s Guide. 2006. Available online: https://vaclavsmil.com/2017/02/21/energy-a-beginners-guide-beginners-guides-2nd-edition/ (accessed on 23 September 2022).
  5. Soni, M.S.; Gakkhar, N. Techno-Economic Parametric Assessment of Solar Power in India: A Survey. Renew. Sustain. Energy Rev. 2014, 40, 326–334. [Google Scholar] [CrossRef]
  6. Wang, G.; Chen, Z.; Hu, P.; Cheng, X. Design and Optical Analysis of the Band-Focus Fresnel Lens Solar Concentrator. Appl. Therm. Eng. 2016, 102, 695–700. [Google Scholar] [CrossRef]
  7. Luque, A.; Sala, G.; Luque-Heredia, I. Photovoltaic Concentration at the Onset of Its Commercial Deployment. Prog. Photovolt. Res. Appl. 2006, 14, 413–428. [Google Scholar] [CrossRef]
  8. Baharoon, D.A.; Rahman, H.A.; Omar, W.Z.W.; Fadhl, S.O. Historical Development of Concentrating Solar Power Technologies to Generate Clean Electricity Efficiently–A Review. Renew. Sustain. Energy Rev. 2015, 41, 996–1027. [Google Scholar] [CrossRef]
  9. García-Domingo, B.; Piliougine, M.; Elizondo, D.; Aguilera, J. CPV Module Electric Characterisation by Artificial Neural Networks. Renew. Energy 2015, 78, 173–181. [Google Scholar] [CrossRef]
  10. Wang, G.; Yao, Y.; Chen, Z.; Hu, P. Thermodynamic and Optical Analyses of a Hybrid Solar CPV/T System with High Solar Concentrating Uniformity Based on Spectral Beam Splitting Technology. Energy 2019, 166, 256–266. [Google Scholar] [CrossRef]
  11. Jiang, S.; Hu, P.; Mo, S.; Chen, Z. Optical Modeling for a Two-Stage Parabolic Trough Concentrating Photovoltaic/Thermal System Using Spectral Beam Splitting Technology. Sol. Energy Mater. Sol. Cells 2010, 94, 1686–1696. [Google Scholar] [CrossRef]
  12. Ju, X.; Xu, C.; Han, X.; Du, X.; Wei, G.; Yang, Y. A Review of the Concentrated Photovoltaic/Thermal (CPVT) Hybrid Solar Systems Based on the Spectral Beam Splitting Technology. Appl. Energy 2017, 187, 534–563. [Google Scholar] [CrossRef]
  13. Algareu, A.O.; Mahmoud, S.; Al-Dadah, R.K. Electrical Characterization of Photovoltaic Cell with Low-Concentration Ratio Square Aperture Concentrator. Int. J. Energy Res. 2017, 41, 2332–2344. [Google Scholar] [CrossRef]
  14. Lokeswaran, S.; Mallick, T.K.; Reddy, K.S. Design and Analysis of Dense Array CPV Receiver for Square Parabolic Dish System with CPC Array as Secondary Concentrator. Sol. Energy 2020, 199, 782–795. [Google Scholar] [CrossRef]
  15. Xu, N.; Ji, J.; Sun, W.; Han, L.; Chen, H.; Jin, Z. Outdoor Performance Analysis of a 1090× Point-Focus Fresnel High Concentrator Photovoltaic/Thermal System with Triple-Junction Solar Cells. Energy Convers. Manag. 2015, 100, 191–200. [Google Scholar] [CrossRef]
  16. Renno, C.; Petito, F.; Gatto, A. Artificial Neural Network Models for Predicting the Solar Radiation as Input of a Concentrating Photovoltaic System. Energy Convers. Manag. 2015, 106, 999–1012. [Google Scholar] [CrossRef]
  17. Burhan, M.; Shahzad, M.W.; Ng, K.C. Sustainable Cooling with Hybrid Concentrated Photovoltaic Thermal (CPVT) System and Hydrogen Energy Storage. Int. J. Comput. Phys. Ser. 2018, 12, 40–51. [Google Scholar] [CrossRef]
  18. Li, M.-F.; Tang, X.-P.; Wu, W.; Liu, H.-B. General Models for Estimating Daily Global Solar Radiation for Different Solar Radiation Zones in Mainland China. Energy Convers. Manag. 2013, 70, 139–148. [Google Scholar] [CrossRef]
  19. Renno, C. Theoretical and Experimental Evaluation of the Working Fluid Temperature Levels in a CPV/T System. Energies 2020, 13, 3077. [Google Scholar] [CrossRef]
  20. Alves, P.; Fernandes, J.F.P.; Torres, J.P.N.; Costa Branco, P.J.; Fernandes, C.; Gomes, J. From Sweden to Portugal: The Effect of Very Distinct Climate Zones on Energy Efficiency of a Concentrating Photovoltaic/Thermal System (CPV/T). Sol. Energy 2019, 188, 96–110. [Google Scholar] [CrossRef]
  21. Yang, F.; Wang, H.; Zhang, X.; Tian, W.; Hua, Y.; Dong, T. Design and Experimental Study of a Cost-Effective Low Concentrating Photovoltaic/Thermal System. Sol. Energy 2018, 160, 289–296. [Google Scholar] [CrossRef]
  22. Han, X.; Xu, C.; Ju, X.; Du, X.; Yang, Y. Energy Analysis of a Hybrid Solar Concentrating Photovoltaic/Concentrating Solar Power (CPV/CSP) System. Sci. Bull. 2015, 60, 460–469. [Google Scholar] [CrossRef] [Green Version]
  23. Han, X.; Zhao, G.; Xu, C.; Ju, X.; Du, X.; Yang, Y. Parametric Analysis of a Hybrid Solar Concentrating Photovoltaic/Concentrating Solar Power (CPV/CSP) System. Appl. Energy 2017, 189, 520–533. [Google Scholar] [CrossRef]
  24. Ben Youssef, W.; Maatallah, T.; Menezo, C.; Ben Nasrallah, S. Modeling and Optimization of a Solar System Based on Concentrating Photovoltaic/Thermal Collector. Sol. Energy 2018, 170, 301–313. [Google Scholar] [CrossRef]
  25. Renno, C. Experimental and Theoretical Analysis of a Linear Focus CPV/T System for Cogeneration Purposes. Energies 2018, 11, 2960. [Google Scholar] [CrossRef] [Green Version]
  26. Burhan, M.; Shahzad, M.W.; Ng, K.C. Long-Term Performance Potential of Concentrated Photovoltaic (CPV) Systems. Energy Convers. Manag. 2017, 148, 90–99. [Google Scholar] [CrossRef]
  27. Aprea, C.; Renno, C. An Air Cooled Tube-Fin Evaporator Model for an Expansion Valve Control Law. Math. Comput. Model. 1999, 30, 135–146. [Google Scholar] [CrossRef]
  28. Available online: https://re.jrc.ec.europa.eu/pvg_tools/en/tools.html#MR (accessed on 23 September 2022).
  29. Renno, C.; Petito, F. Triple-Junction Cell Temperature Evaluation in a CPV System by Means of a Random-Forest Model. Energy Convers. Manag. 2018, 169, 124–136. [Google Scholar] [CrossRef]
  30. Matlab R2019, The MathWorks. Available online: https://it.mathworks.com/products/matlab.html (accessed on 23 September 2022).
  31. Renno, C. Thermal and Electrical Modelling of a CPV/T System Varying Its Configuration. J. Therm. Sci. 2019, 28, 123–132. [Google Scholar] [CrossRef]
  32. Shakouri, M.; Ghadamian, H.; Hoseinzadeh, S.; Sohani, A. Multi-objective 4E analysis for a building integrated photovoltaic thermal double skin Façade system. Solar Energy 2022, 233, 408–420. [Google Scholar] [CrossRef]
  33. Renno, C.; Petito, F.; D’Agostino, D.; Minichiello, F. Modeling of a CPV/T-ORC combined system adopted for an industrial user. Energies 2020, 13, 33476. [Google Scholar] [CrossRef]
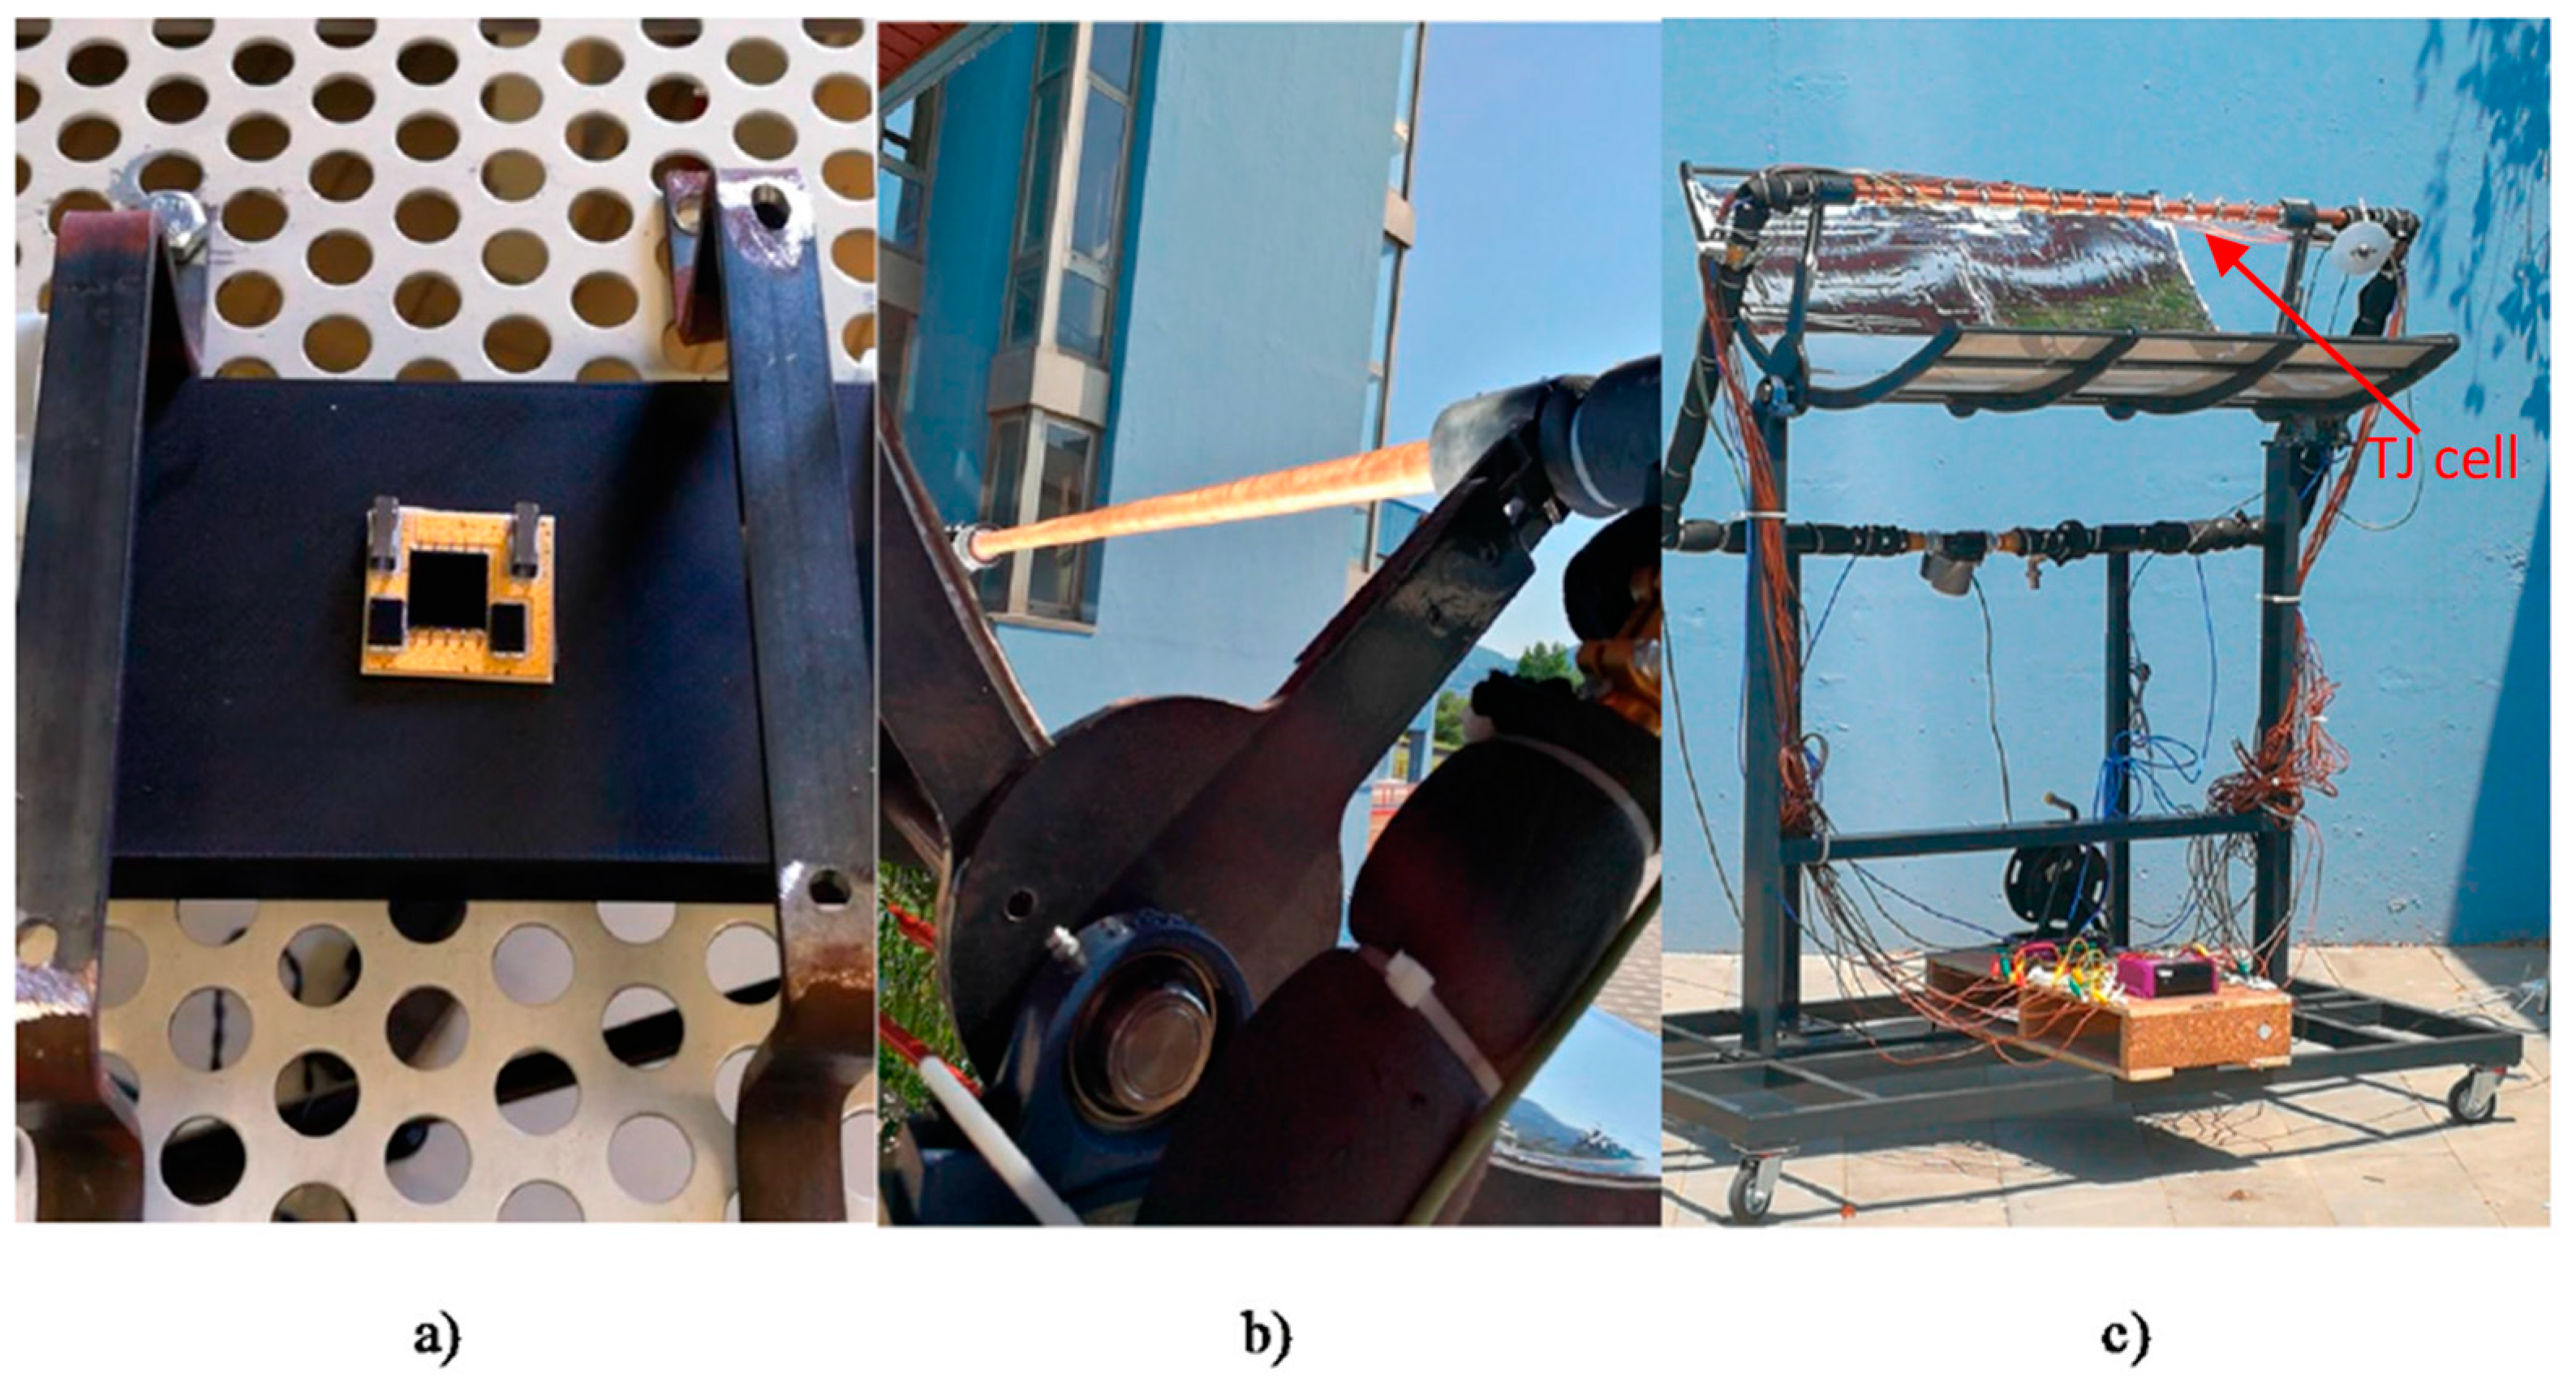
Figure 1. Photo of the line-focus experimental plant: Triple-Junction cell (a), cooling fluid circuit (b), experimental CPV/T system (c).
Energies 16 02115 g001
Figure 2. Increase of the TJ cell temperature due to solar concentration.
Energies 16 02115 g002
Figure 3. Electrical power supplied by the CPV/T module as function of Rcell and Tcell.
Energies 16 02115 g003
Figure 4. Average hourly values of Tcell for typical winter (a) and summer sunny days (b) for each city.
Energies 16 02115 g004
Figure 5. Average hourly values of Pel,mod for typical winter (a) and summer sunny days (b) for each city.
Energies 16 02115 g005
Figure 6. Average hourly values of Qth,mod for typical winter (a) and summer sunny days (b) for each city.
Energies 16 02115 g006
Figure 7. Daily thermal producibility for each city for winter day and summer day.
Energies 16 02115 g007
Figure 8. Difference between CPV/T system electrical producibility and electrical loads for different modules number at Marrakech and Amsterdam.
Energies 16 02115 g008
Figure 9. Difference between CPV/T system thermal producibility and thermal loads for different modules number at Marrakech and Amsterdam.
Energies 16 02115 g009
Figure 10. Difference between CPV/T system cooling producibility and cooling loads for different modules number at Marrakech.
Energies 16 02115 g010
Figure 11. 20th year NPV value varying the modules number.
Energies 16 02115 g011
Figure 12. NPV trends over the years corresponding to the optimal modules number for each city.
Energies 16 02115 g012
Figure 13. Values of Profit Index for each city.
Energies 16 02115 g013
Table 1. Parameters of the triple-junction cell.
ParametersValue
MaterialInGaP/GaAs/Ge
Dimensions10 mm × 10 mm
ηr (at 25 °C, 50 W/cm2–1000 suns)39.0%
Temperature coefficient (σt)−0.04%/K
Table 2. Values of the coefficients of experimental equations describing the trends of Tcell and Pel,cell.
Equation A B C D R2
Equation (2)12.4810.9794--0.9552
Equation (3)--1.4193500.510.9479
Table 3. Daily electrical producibility Eel,mod (Wh) for each locality for winter and summer days.
JanuaryJuly
Marrakech11991336
Salerno9641500
Amsterdam7551644
Table 4. Values of the parameters used in the sizing of CPV/T system.
ParameterValue
Useful life for a CPV system: U L 20 years
Cost per module: c m o d 650 €/mod
Purchase cost of electricity: c e l 0.20 €/kWh
Electricity selling price: p e 0.06 €/kWh
LCV Methane: L C V M e t h a n e 9.60 kWh/Sm3
η Boiler: η B o i l e r 0.900
Methan price: c M e t h a n e 0.800 €/Sm3
Thermal energy cost: c t h 0.0926 €/kWh
COPf3.00
Cooling energy cost: c c o o l 0.0667 €/kWh
COPf of AHP0.700
discount index: r 0.015
Table 5. Monthly electrical, thermal, and cooling loads for the residential user at Marrakech and Amsterdam.
Marrakech Amsterdam
MonthEel (kWh)Eth (kWh)Ecool (kWh)Eel (kWh)Eth (kWh)Ecool (kWh)
January4002250040048500
February2801250028048500
March320250032040500
April250250025037500
May2502503002502500
June2502506002502500
July25025021002502500
August25025021002502500
September25025012002502500
October25025050025022500
November350250035036500
December4001550040044500
Disclaimer/Publisher’s Note: The statements, opinions and data contained in all publications are solely those of the individual author(s) and contributor(s) and not of MDPI and/or the editor(s). MDPI and/or the editor(s) disclaim responsibility for any injury to people or property resulting from any ideas, methods, instructions or products referred to in the content.