Article

Evaluation of Shale Oil Mobility for the Eocene Shahejie Formation in Liutun Sag, Dongpu Depression, Bohai Bay Basin

1
Key Laboratory of Tectonics and Petroleum Resources, China University of Geosciences, Ministry of Education, Wuhan 430074, China
2
Research Institute of Petroleum Exploration & Development, Petrochina, Beijing 100083, China
*
Author to whom correspondence should be addressed.
Energies 2023, 16(5), 2101; https://doi.org/10.3390/en16052101
Submission received: 18 January 2023 / Revised: 12 February 2023 / Accepted: 20 February 2023 / Published: 21 February 2023

Abstract

:
Previous studies have shown that shale oil mobility depends on the relative content of free oil and adsorbed oil. However, the research on how to establish a shale oil mobility evaluation is relatively insufficient. This study aims to use pyrolysis data before and after extraction to accurately identify the content of free oil and adsorbed oil, analyze the influencing factors of shale oil mobility, characterize the hydrocarbon generation and expulsion process, and evaluate shale oil mobility. We utilized an integrated mineralogical and geochemical dataset from the PS18-1 well in the Liutun Sag, Dongpu Depression, Bohai Bay Basin. The results show that the adsorption capacity of type I organic matter (OM) on shale oil is greater than that of type II OM, the OM abundance is of great significance to shale oil mobility, and that quartz and feldspar can promote shale oil mobility. The Tmax corresponding to the threshold of hydrocarbon expulsion is 438~440 °C, and the oil saturation index (OSI) is about 158 mg/g TOC. There are four small intervals: a (3257 m~3260 m), b (3262 m~3267 m), c (3273 m~3278 m), and d (3281 m~3282 m) meeting the conditions of hydrocarbon expulsion. Large-scale hydrocarbon expulsion occurred in interval a, a small amount of hydrocarbon expulsion in interval b, a large amount of hydrocarbon expulsion in interval c, and almost no hydrocarbon expulsion in interval d. Based on the crossplot of S1 and TOC, combined with other parameters such as OSI, hydrocarbon generation potential (HGP), and free and adsorbed oil, we established an evaluation chart of shale oil mobility and divided it into five categories: A, B, C, D, and E. While categories A and C have good mobility and great resource potential, categories B and D have relatively poor mobility and medium resource potential, and category E has little mobility and is an invalid resource.

1. Introduction

Oil and gas are the most important energy resources, which are closely coupled to a nation’s standard of living and productivity. Unconventional oil and gas have been an important development direction for the oil and gas industry [1,2,3,4,5]. Shale oil, one of the important unconventional oil and gas resources, widely exists in the continental basins of China. Successful commercial exploitation in North America proves the great commercial value of shale oil and provides a reference for the exploration and development of shale oil in China. Shale oil refers to the liquid hydrocarbons existing in micro- and nanopores in various ways, such as free state and adsorption state [1]. Compared with conventional crude oil, shale oil has either not experienced migration or only experienced short-distance primary migration, which results in a difference in its molecular composition from conventional crude oil [1,6,7]. After years of research, significant progress has been made in the exploration and development of continental shale oil in China, such as enrichment mechanism, occurrence state, seepage mechanism, and driving mechanism [8,9]. Recent studies have shown that the content of organic matter (OM) in shale not only affects oil and gas migration and reservoir space [10,11], it also has a strong correlation with the adsorption capacity of residual hydrocarbons [12,13,14]. The shale oil occurrence state mainly includes two forms, namely free state and adsorption state [15,16]. The free state shale oil mainly exists in pores and fractures, while the adsorption-state shale oil is mainly adsorbed on the mineral surface and in kerogen. Kerogen adsorption generally includes kerogen surface adsorption, noncovalent bond adsorption between shale oil and kerogen, and envelope mutual dissolution of organic macromolecules [17]. It has been shown that the adsorption capacity of kerogen and minerals strongly affects the amount of retained fluid in the shale resource system and the critical point when oil is saturated, which is very important for the development of shale oil [18,19,20,21]. Since shale oil mobility is mainly determined by the content of free-state hydrocarbons [6], therefore, how to accurately characterize the content of free-state hydrocarbons and the process of hydrocarbon generation and expulsion are of great significance.
Shale oil mobility refers to the amount of shale oil that can flow freely in the shale oil system, reflecting the amount of shale oil that can be extracted from the reservoir and directly affecting the development of shale oil. Up to now, there is no unified standard and method for evaluating shale oil mobility, and rock pyrolysis and organic solvent extraction are the commonly used methods [22,23,24,25]. Chen et al. (2019) divide shale oil into three types of resources (i.e., immovable, restricted, and movable) based on pyrolysis data and the kinetic model of hydrocarbon generation, so as to quantitatively describe the mobility of shale oil resources. Generally, the S1 peak represents free hydrocarbon volatilized at a temperature of 300 °C, while the S2 peak mainly represents thermally cracked hydrocarbons broken down at a temperature of 650 °C and 850 °C [23,24,26]. Other studies have shown that the kerogen type and maturity have a significant impact on hydrocarbon adsorption, and it has been considered that the Tmax can be used as an indicator of maturity [27]. According to the theory, the higher the maturity of the OM, the higher the activation energy of the residual OM for hydrocarbon generation. The temperature required for hydrocarbon generation is gradually increased, and thus the Tmax is higher. Therefore, the Tmax can be used as an indicator of maturity.
Many studies have also shown that S1 is indexed for free oil, while S2 does not fully represent the hydrocarbon generation potential (HGP) [25,27,28]. Some macromolecular compounds such as bitumen and the heavy hydrocarbons adsorbed on the surface of kerogen should be taken into account as well [28,29,30]. For example, Han et al. (2015) find that the content of shale oil increases by about 54% when considering the extractable components of S2 in Barnett Shale sequences, and thus, the residual hydrocarbon generation potential (RHGP) is overestimated [19]. Jarvie (2012) proposes to use the pyrolysis and extraction datum to estimate the extractable components in S2, and further evaluates the relative content of total oil [31]. This method has been widely used in other places to evaluate the relative content of total oil [19,30,32]. The extraction method cannot accurately distinguish the free state from the adsorbed state. Moreover, there will be a loss of light hydrocarbons in the preparation of samples. Obviously, there is a big error in directly using pyrolysis or extraction method to evaluate the shale oil mobility.
In this study, to evaluate shale oil mobility, we first use the pyrolysis data before and after extraction to maximize the identification accuracy of free oil and adsorbed oil. Then, we evaluate the influence of the OM characteristics (e.g., abundance, type, and maturity), minerals, and shale oil composition on the adsorbed oil and the free oil, Finally, we analyze the process of hydrocarbon generation and expulsion, identify the threshold of hydrocarbon expulsion and evaluate shale oil mobility in the studied interval

2. Geological Background

The Dongpu depression is located at the southwest end of the Bohai Bay basin, and it is a typical Mesozoic-Cenozoic continental faulted basin in eastern China [33]. The depression generally presents an NNE trend, about 140 km long, wide in the south (62 km), and narrow in the north (14–18 km), with an area of about 5300 km2 [34,35]. The Liutun sag is located in the west of the Dongpu depression, and adjacent to the Guancheng sag in the north, the Huzhuangji slope in the southwest, the Mazhai slope in the west, and the Wenmingzhai uplift in the east (Figure 1). Faults with various trends are relatively developed at the edge of the sag due to the influence of large faults such as Wenxi, Changyuan, and Xingzhuang on both sides.
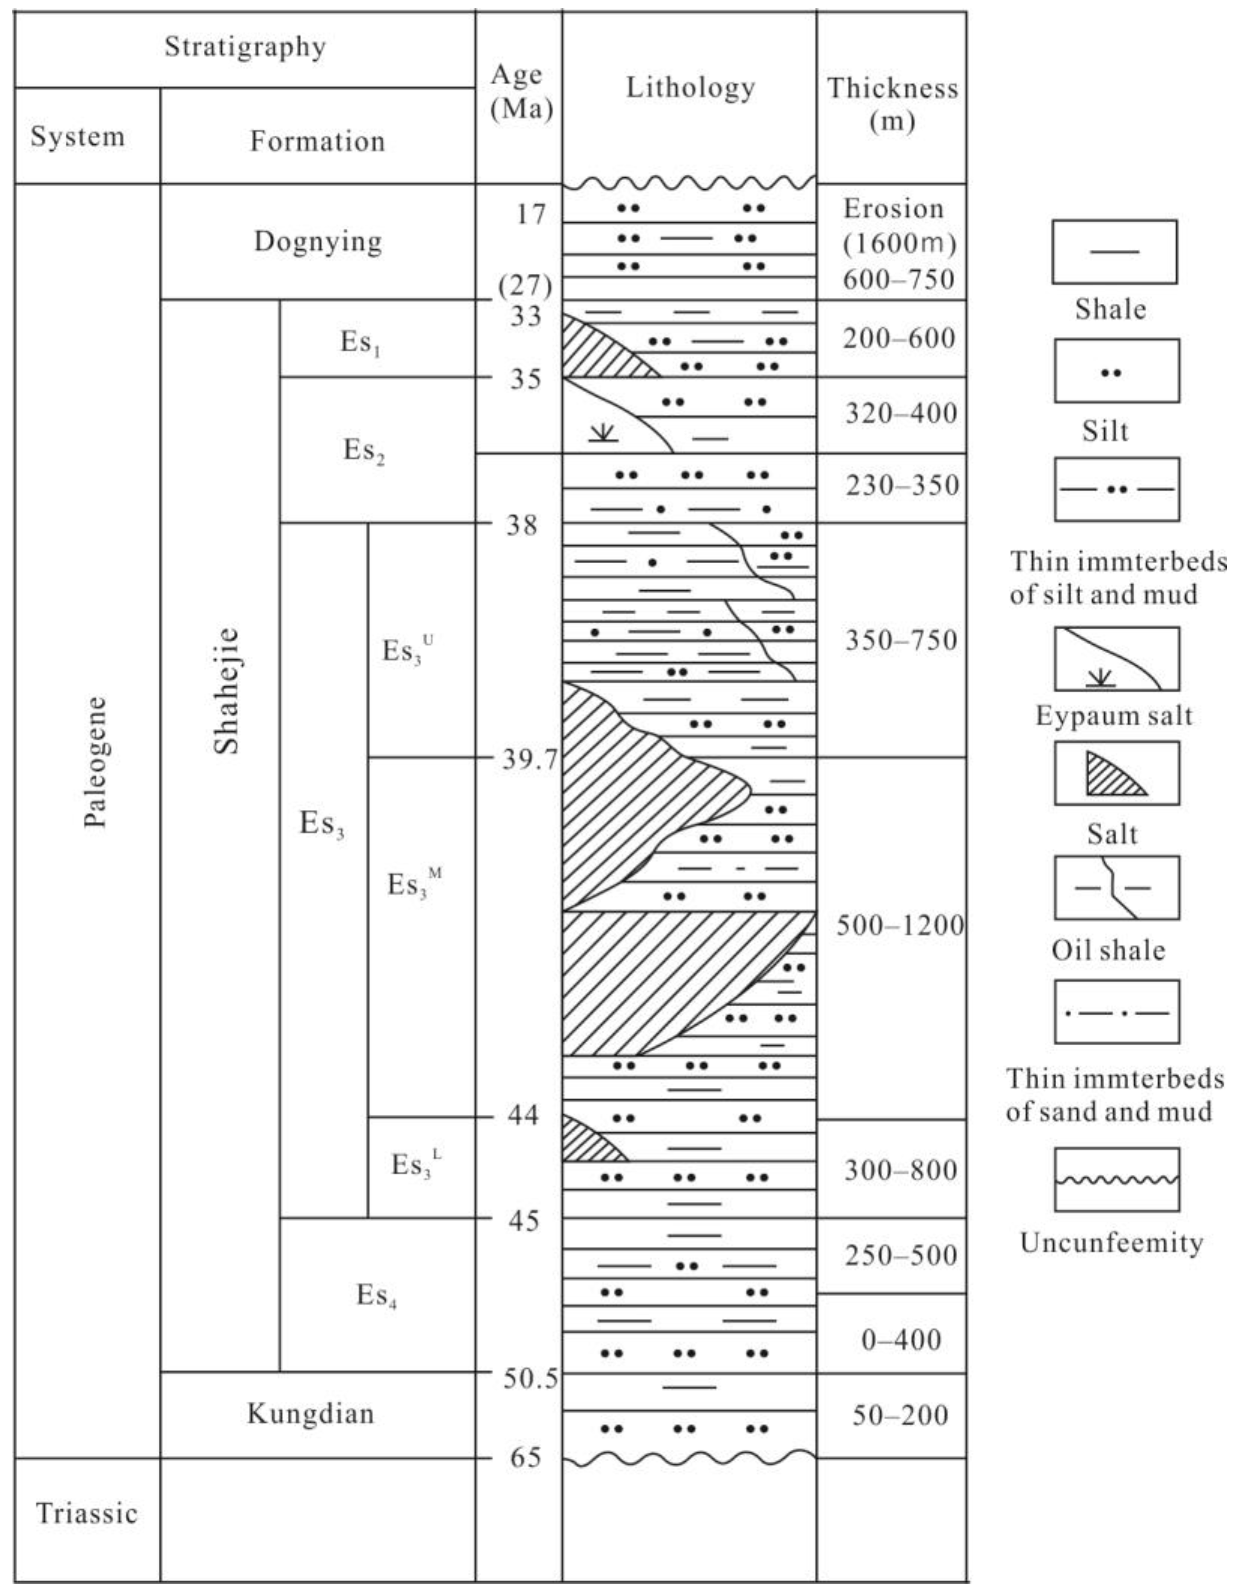
During the Paleogene, the Bohai Bay Basin was in the rifting period, and experienced the initial stage, development stage, peak stage, and shrinkage stage, and developed the Kongdian Formation, the Shahejie Formation, and the Dongying Formation in turn [36]. In the Neogene, the basin entered the depression period from the rifting period, developing the Guantao Formation, the Minghuazhen Formation, and the Plain Formation in the Quaternary [33]. Among them, the Shahejie Formation can be divided into four members. From bottom to top, they are the fourth member of the Shahejie formation (Es4), the third member of the Shahejie formation (Es3), the second member of the Shahejie Formation (Es2), and the first member of the Shahejie formation (Es1). Four sets of salt-rock formations were developed in the Shahejie formation from bottom to top (Figure 2), which is of great significance for the preservation of shale oil.
The upper subinterval of the Es3 member is the interbedded sedimentary stratum (dark mudstone and carbonate) at the peak stage of the rifting period for the basin [31]. It has a wide distribution range and large sedimentary thickness and is the target stratum of this paper.

3. Samples and Methods

The samples in this study came from the upper subinterval of the Es3 member in the Liutun sag of the Dongpu depression, and continuous coring was carried out at a depth of 3258 to 3286.6 m in the well PS18-1. Each sample was divided into three parts to obtain three groups of samples (i.e., pyrolysis group, extraction group, and mineral group). The samples in the pyrolysis group were crushed into powder (120 mesh), and then the experiment was carried out directly by Electronic Balance and Rock-eval 6. The experiment mainly includes two steps: first, the sample is pyrolyzed under the protection of nitrogen; second, the products released by pyrolysis (hydrocarbons, including S1 peak and S2 peak) are monitored by a flame ion detector (FID), and the CO and CO2 released by pyrolysis and oxidative combustion are monitored by an infrared retector (IR). The initial temperature of the pyrolyzer is set at 300 °C and maintained for three minutes, and then the products are identified by FID and IR to obtain S1 (hydrocarbon) and S3 (organic CO and CO2). After that, the temperature is increased to 650 °C at 25 °C/min and the temperature is allowed to drop to 300 °C. In this way, the products are identified by FID and IR to obtain S2 and S3 (organic CO and CO2). Finally, the residue is placed in the air to rise to 850 °C for combustion at 20 °C/min, so as to obtain inorganic CO2. All the pyrolysis experiments were performed under the same instrument and condition. The samples in the extraction group were crushed into powder and then extracted with dichloromethane. After obtaining the extracts, the solvent was volatilized under an environment of low temperature. The extracts were added to hexane to fully dissolve the saturated hydrocarbon, aromatic and nonhydrocarbon fractions, and to fully precipitate the asphaltenes, which were then filtered out through a funnel. The filtrate was added to the silica gel/alumina chromatography column (2:1), and then the components in the chromatography column were washed successively to obtain saturated hydrocarbons and aromatic hydrocarbons, respectively. Then, the extracted residue was subjected to the above pyrolysis to obtain the pyrolysis data after extraction. The samples in the mineral group were crushed into powder, and the minerals were analyzed by X-ray diffraction with a D8 advance to quantitatively identify the contents of various minerals.
The principle of pyrolysis is that the different OM have different physical properties. For example, most gaseous hydrocarbons are directly lost, and a small amount of gaseous hydrocarbons that are adsorbed onto the minerals or dissolved in oil are directly volatilized in the initial stage of pyrolysis. For liquid hydrocarbons, with the increase in pyrolysis temperature, first small molecular hydrocarbons are volatilized (free oil), following macromolecular hydrocarbons (free oil), then hydrocarbons adsorbed on minerals and kerogen are separated, and finally, kerogen is pyrolyzed to produce hydrocarbons. The separation of the adsorbed oil (especially the heavy hydrocarbons adsorbed on the kerogen) and the pyrolysis of the kerogen are carried out simultaneously. So, how to distinguish the separation of adsorbed oil from the pyrolysis of kerogen is the key to quantitatively evaluating the content of adsorbed oil. Based on the pyrolysis data before and after extraction, this study accurately evaluates the content of free oil and adsorbed oil and discusses the threshold of hydrocarbon expulsion. Since the polarity of the solvent used was relatively strong and the sample was crushed into powder, the residue of extracted samples does not contain adsorbed oil. So, the S2-1 obtained from pyrolysis (after extraction) is the pyrolysis of kerogen. Therefore, the content of adsorbed oil is (S2-S2-1), and S1 obtained from pyrolysis (before extraction) can represent free oil.

4. Results

4.1. Pyrolysis and Extraction

The pyrolysis data before and after extraction are shown in Table 1. It can be seen that for the pyrolysis before extraction, the maximum temperature of pyrolysis (Tmax) was between 428~444 °C, and the average Tmax was 436.8 °C; S1 is 0.23~12 mg/g, with an average value of 4.17 mg/g; and S2 is 0.76~31.03 mg/g, with an average of 12.76 mg/g. For pyrolysis after extraction, the Tmax-1 is between 430~447 °C, and the average Tmax-1 is 439.8 °C; S1-1 is 0.01~0.2 mg/g, with an average value of 0.06 mg/g; S2-1 is 0.73~23.89 mg/g, with an average value of 9.43 mg/g. Compared to the pyrolysis before extraction, S1-1 content was very low and almost negligible (possibly organic solvents or hydrocarbons remaining on the rock surface), S2-1 content decreased slightly, and both HI-1 and OI-1 increased. This indicates that shale oil mobility in the studied interval changed greatly. The content of free oil was higher than that of adsorbed oil, and most of the hydrogen and oxygen elements were concentrated in kerogen.
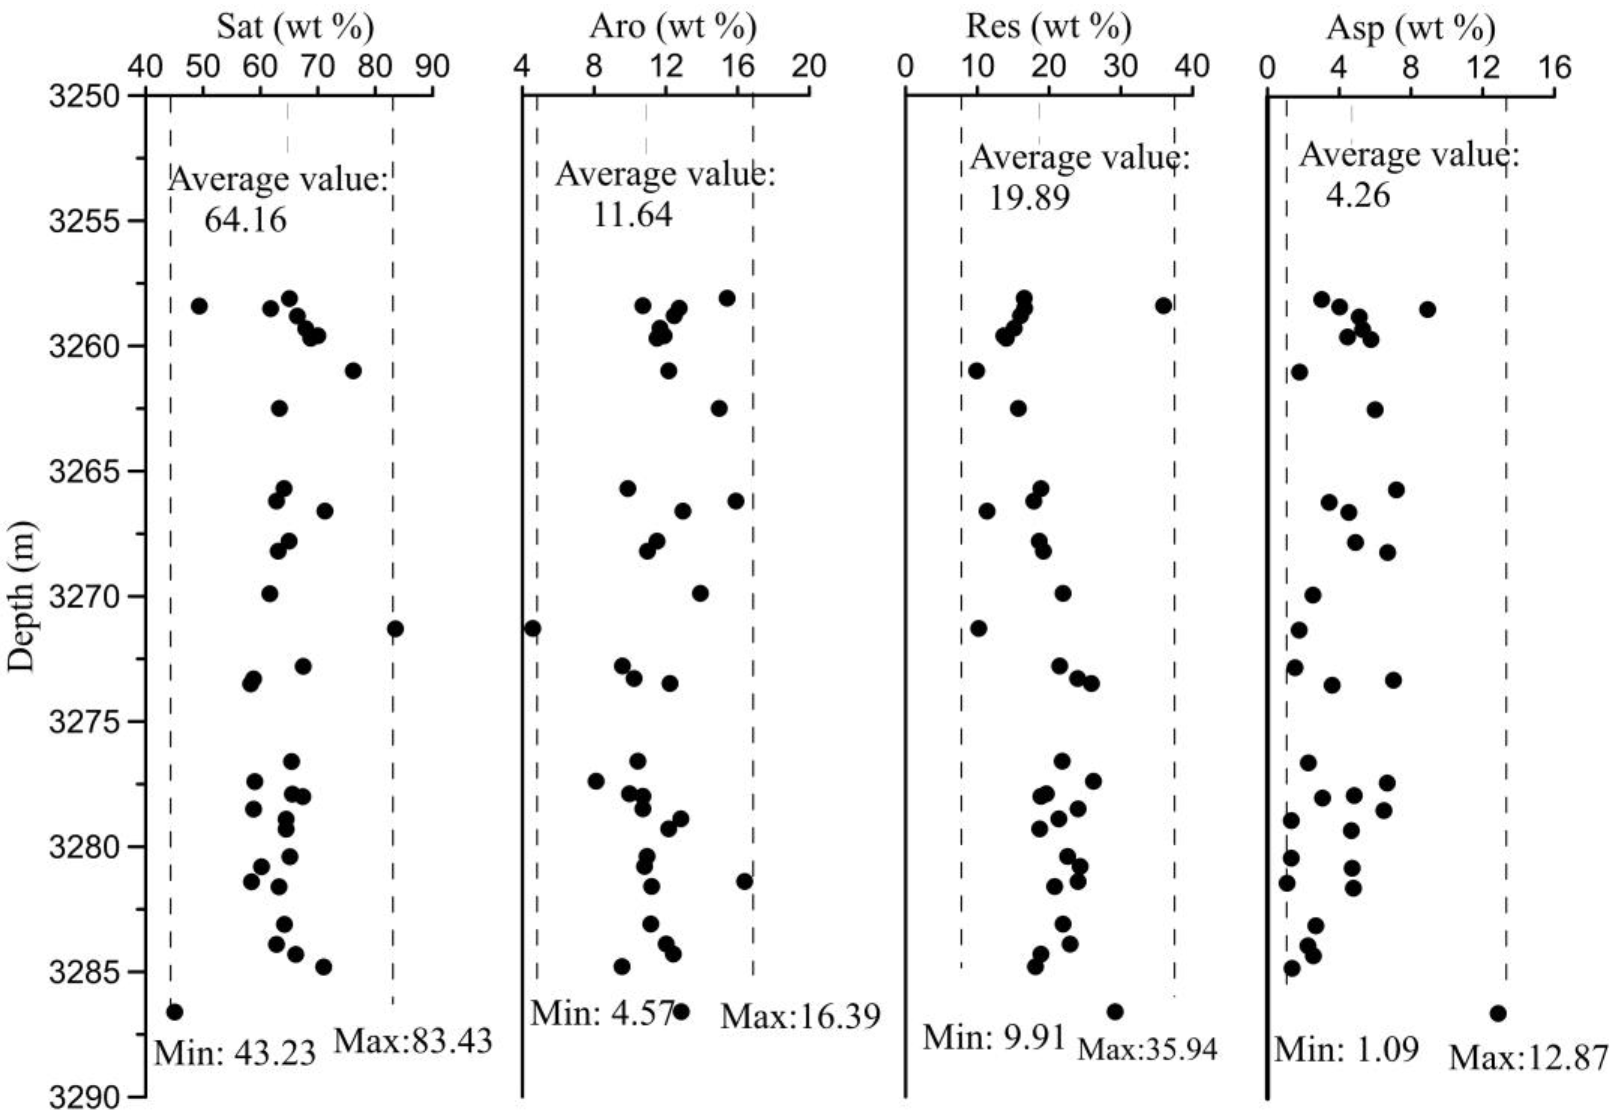
The saturated hydrocarbon is the largest component, up to 83.43% with an average value of 64.16%, while the aromatic hydrocarbons content ranged from 4.57% to 16.39%, with an average value of 11.64% (Figure 3). The total hydrocarbon content was between 57.92~88.29%, with an average value of 75.81%. Nonhydrocarbon was the second largest component, ranging from 9.91% to 35.94%, with an average value of 19.89%. The asphaltene content was the lowest, ranging from 1.09% to 12.87%, with an average value of 4.26%.

4.2. Mineral Analysis

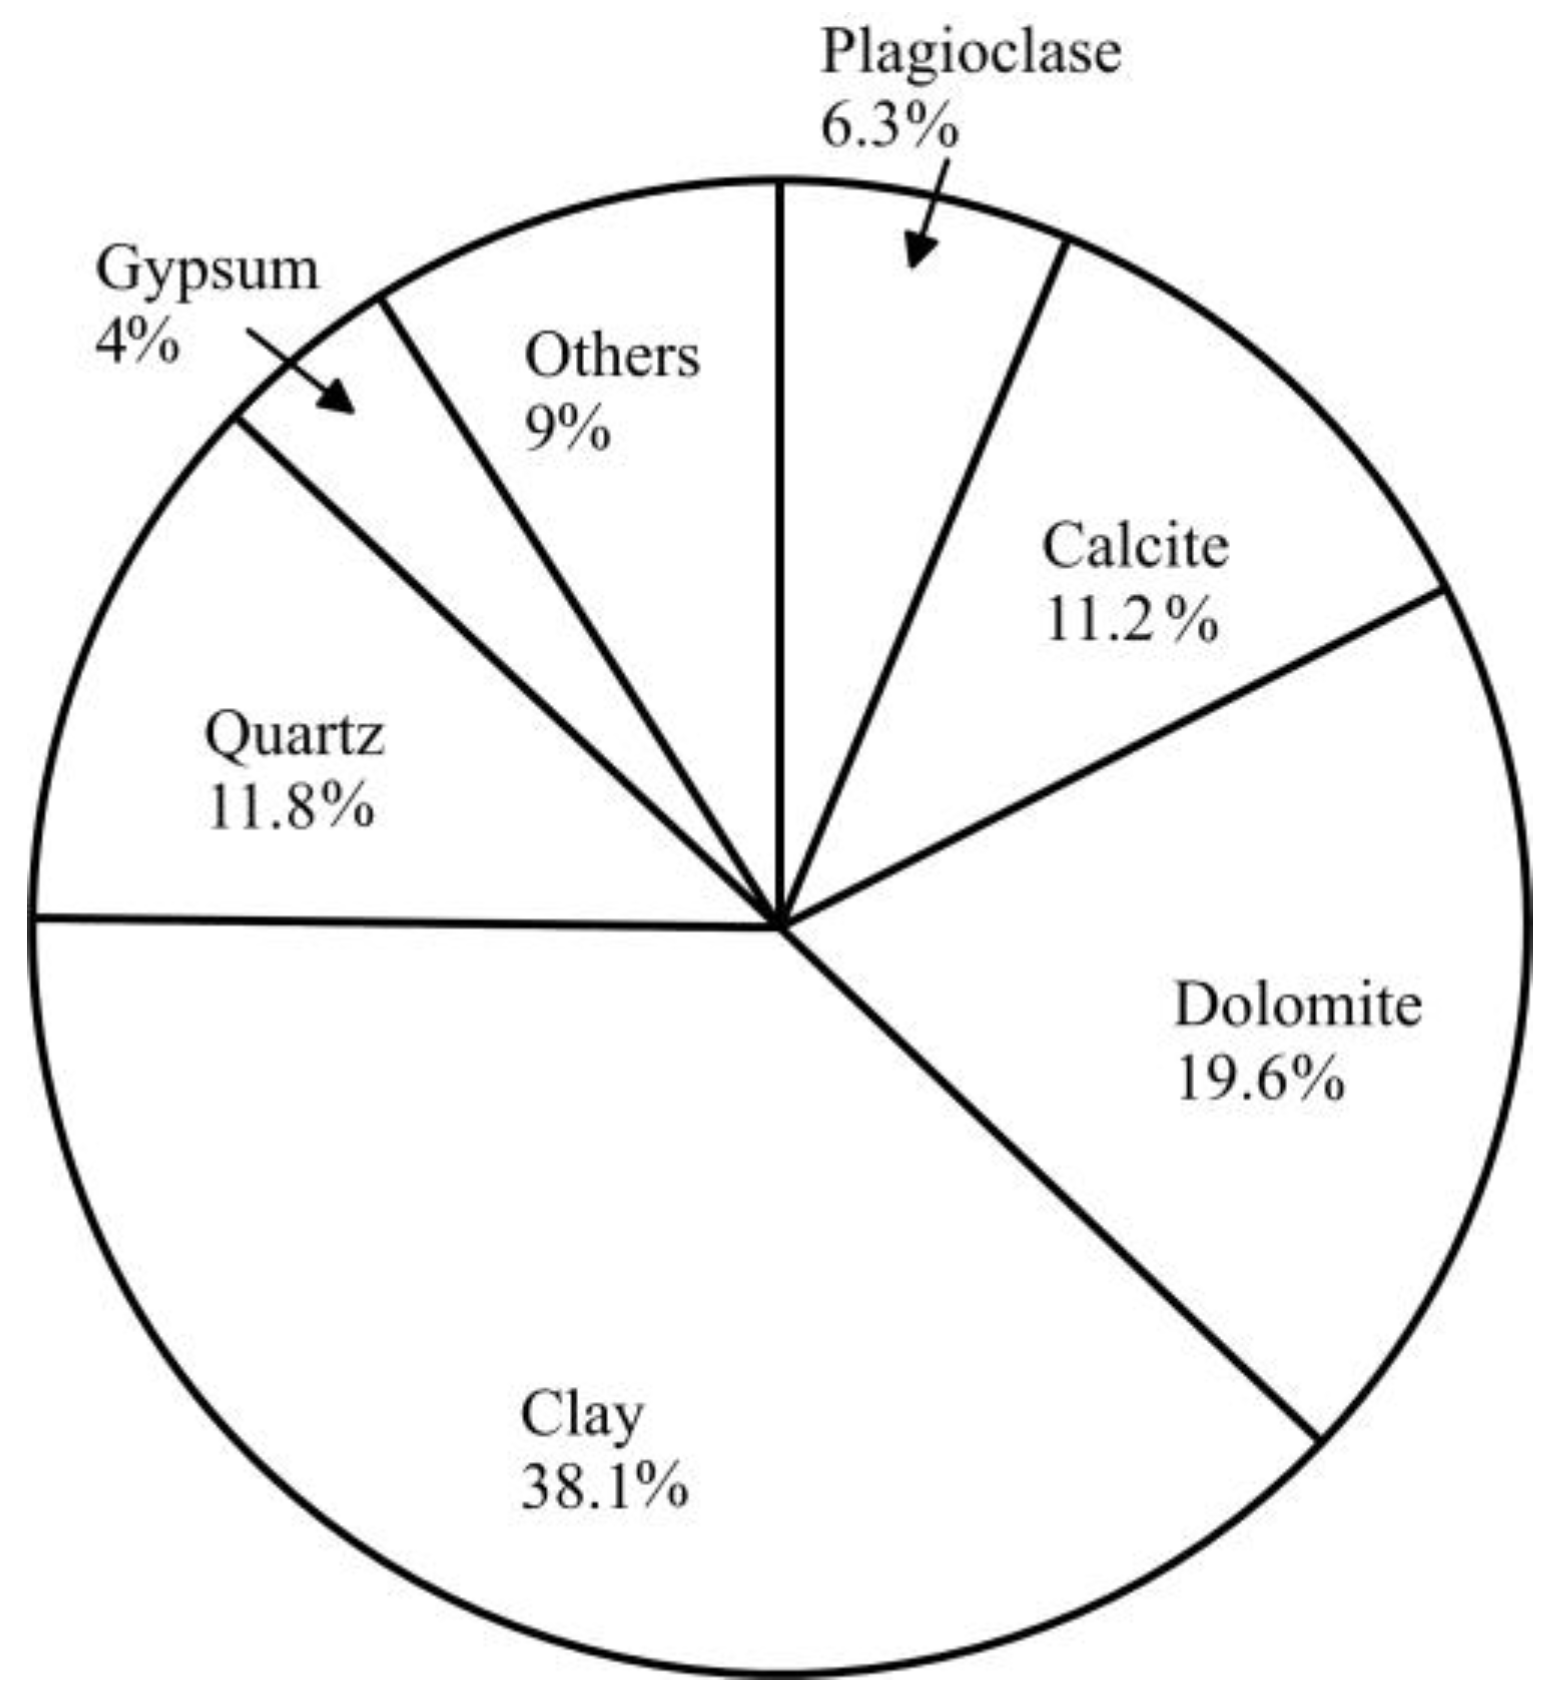
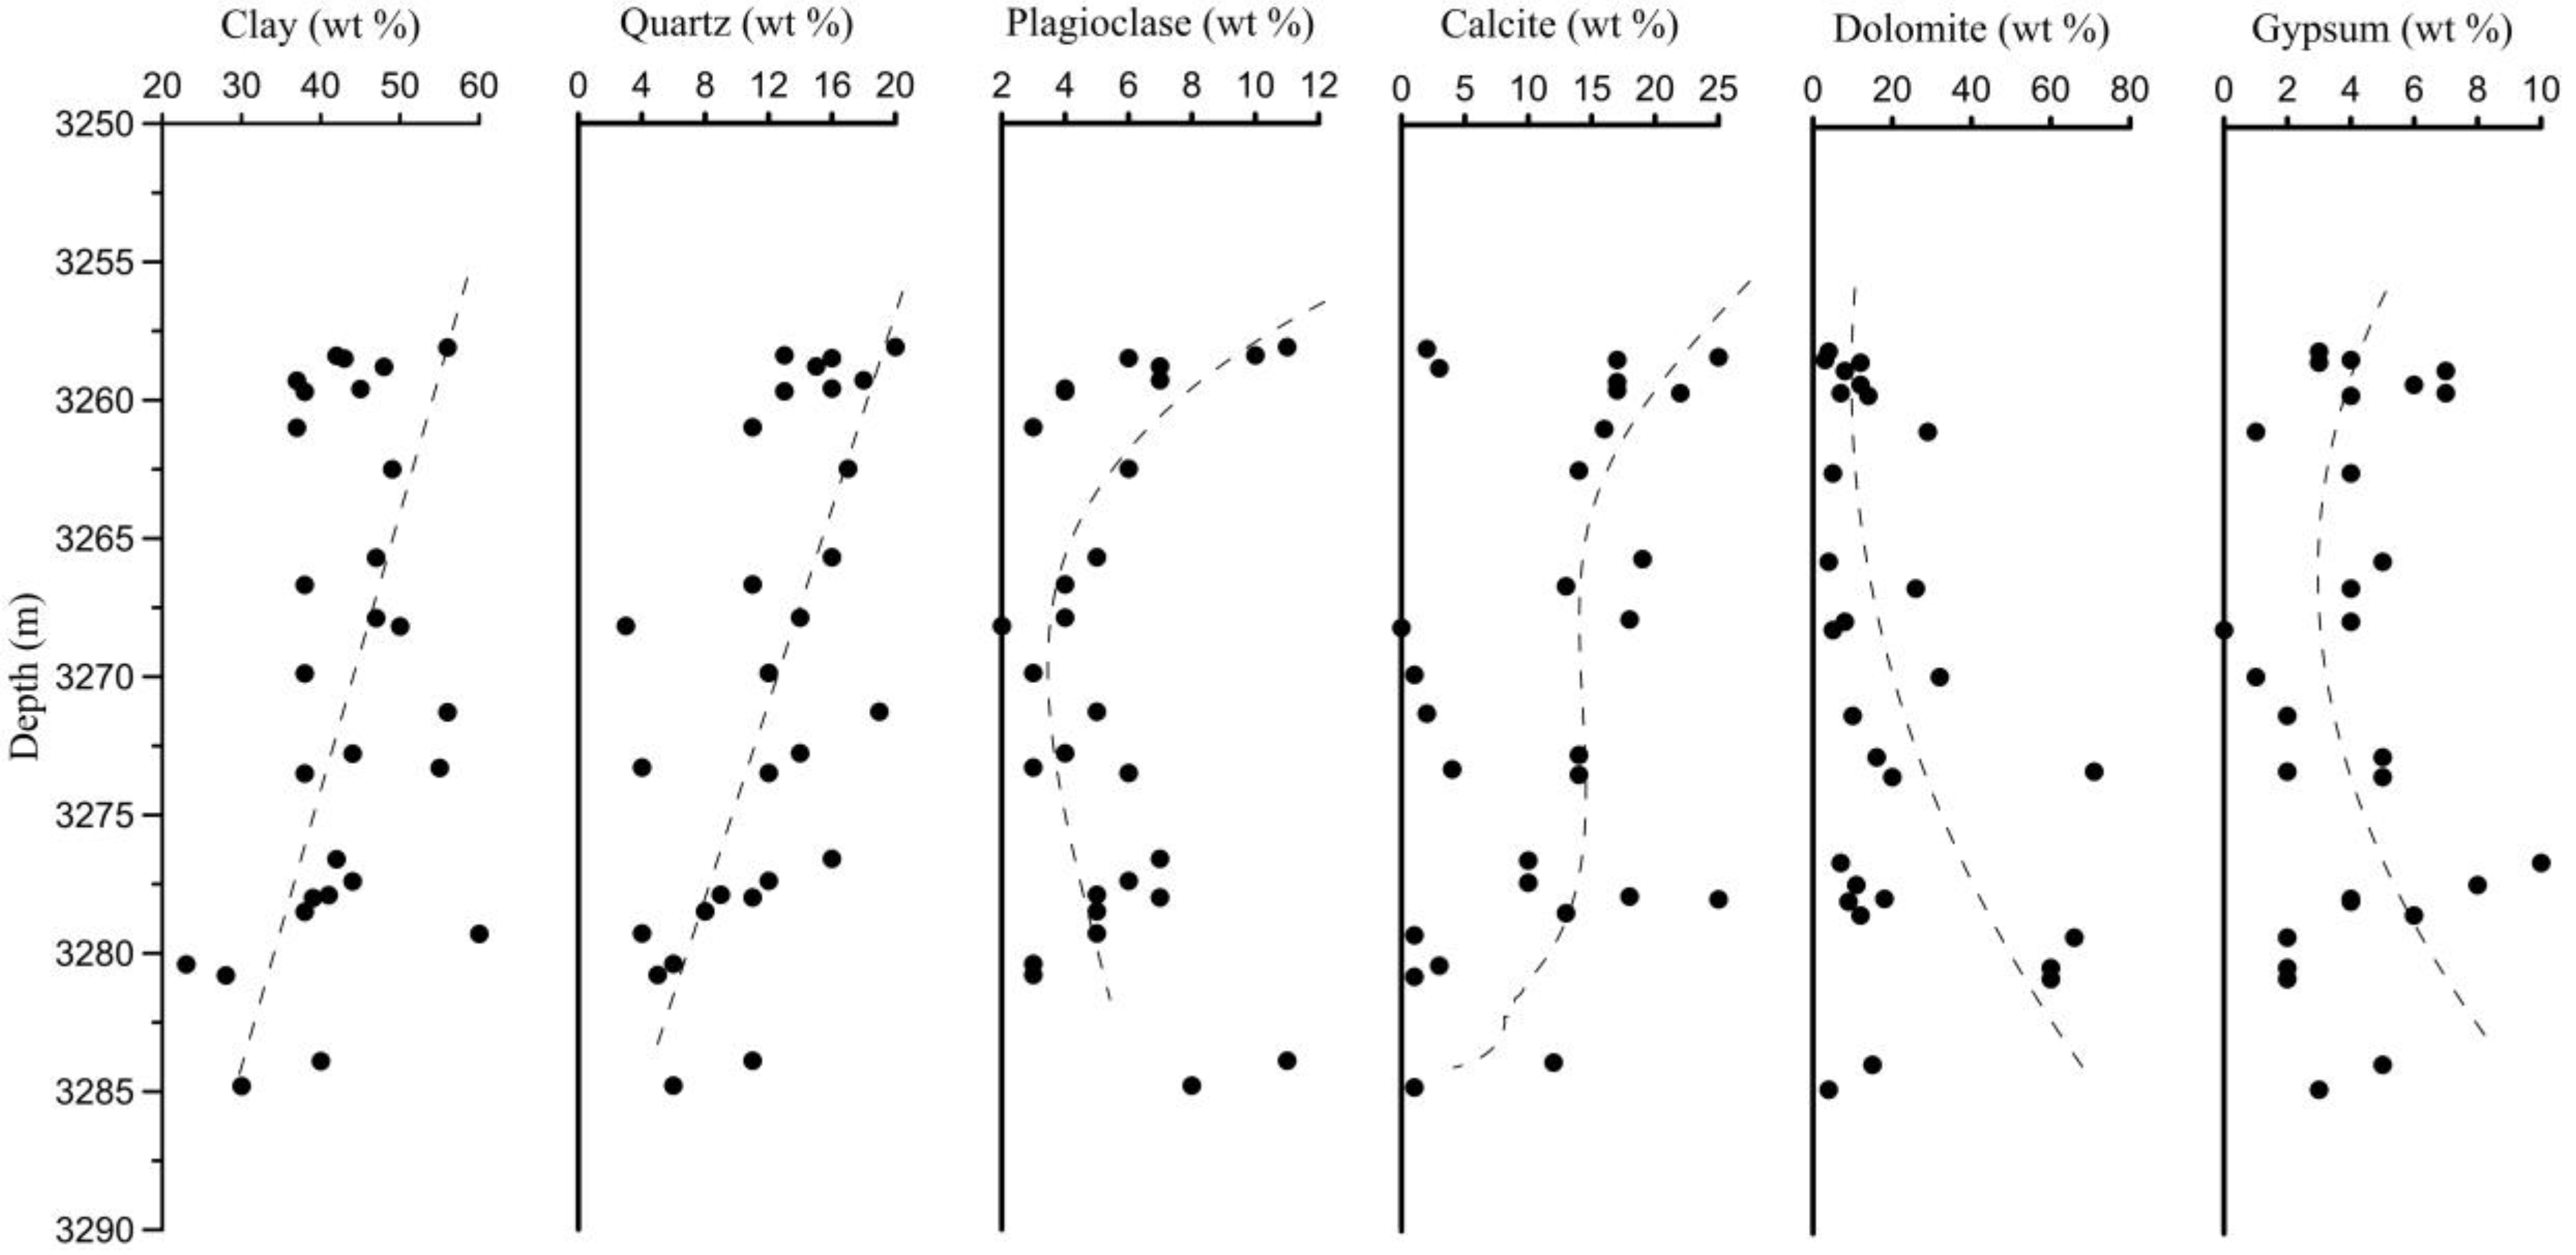
The minerals in the studied interval are mainly composed of clay and quartz, with a sum of 50.8%, and an average content of plagioclase, calcite, and dolomite of 6.3%, 11.2%, and 19.6%, respectively (Figure 4). In addition, there was a small amount of siderite, halite, pyrite, gypsum, and anhydrite. Generally, the content of minerals was relatively stable and shows periodic rhythmic changes (Figure 5). Furthermore, the content of clay, quartz, plagioclase, and calcite tended to decrease slightly, and the content of dolomite and gypsum tended to increase slightly with an increasing burial depth.

4.3. Organic Matter Type and Maturity

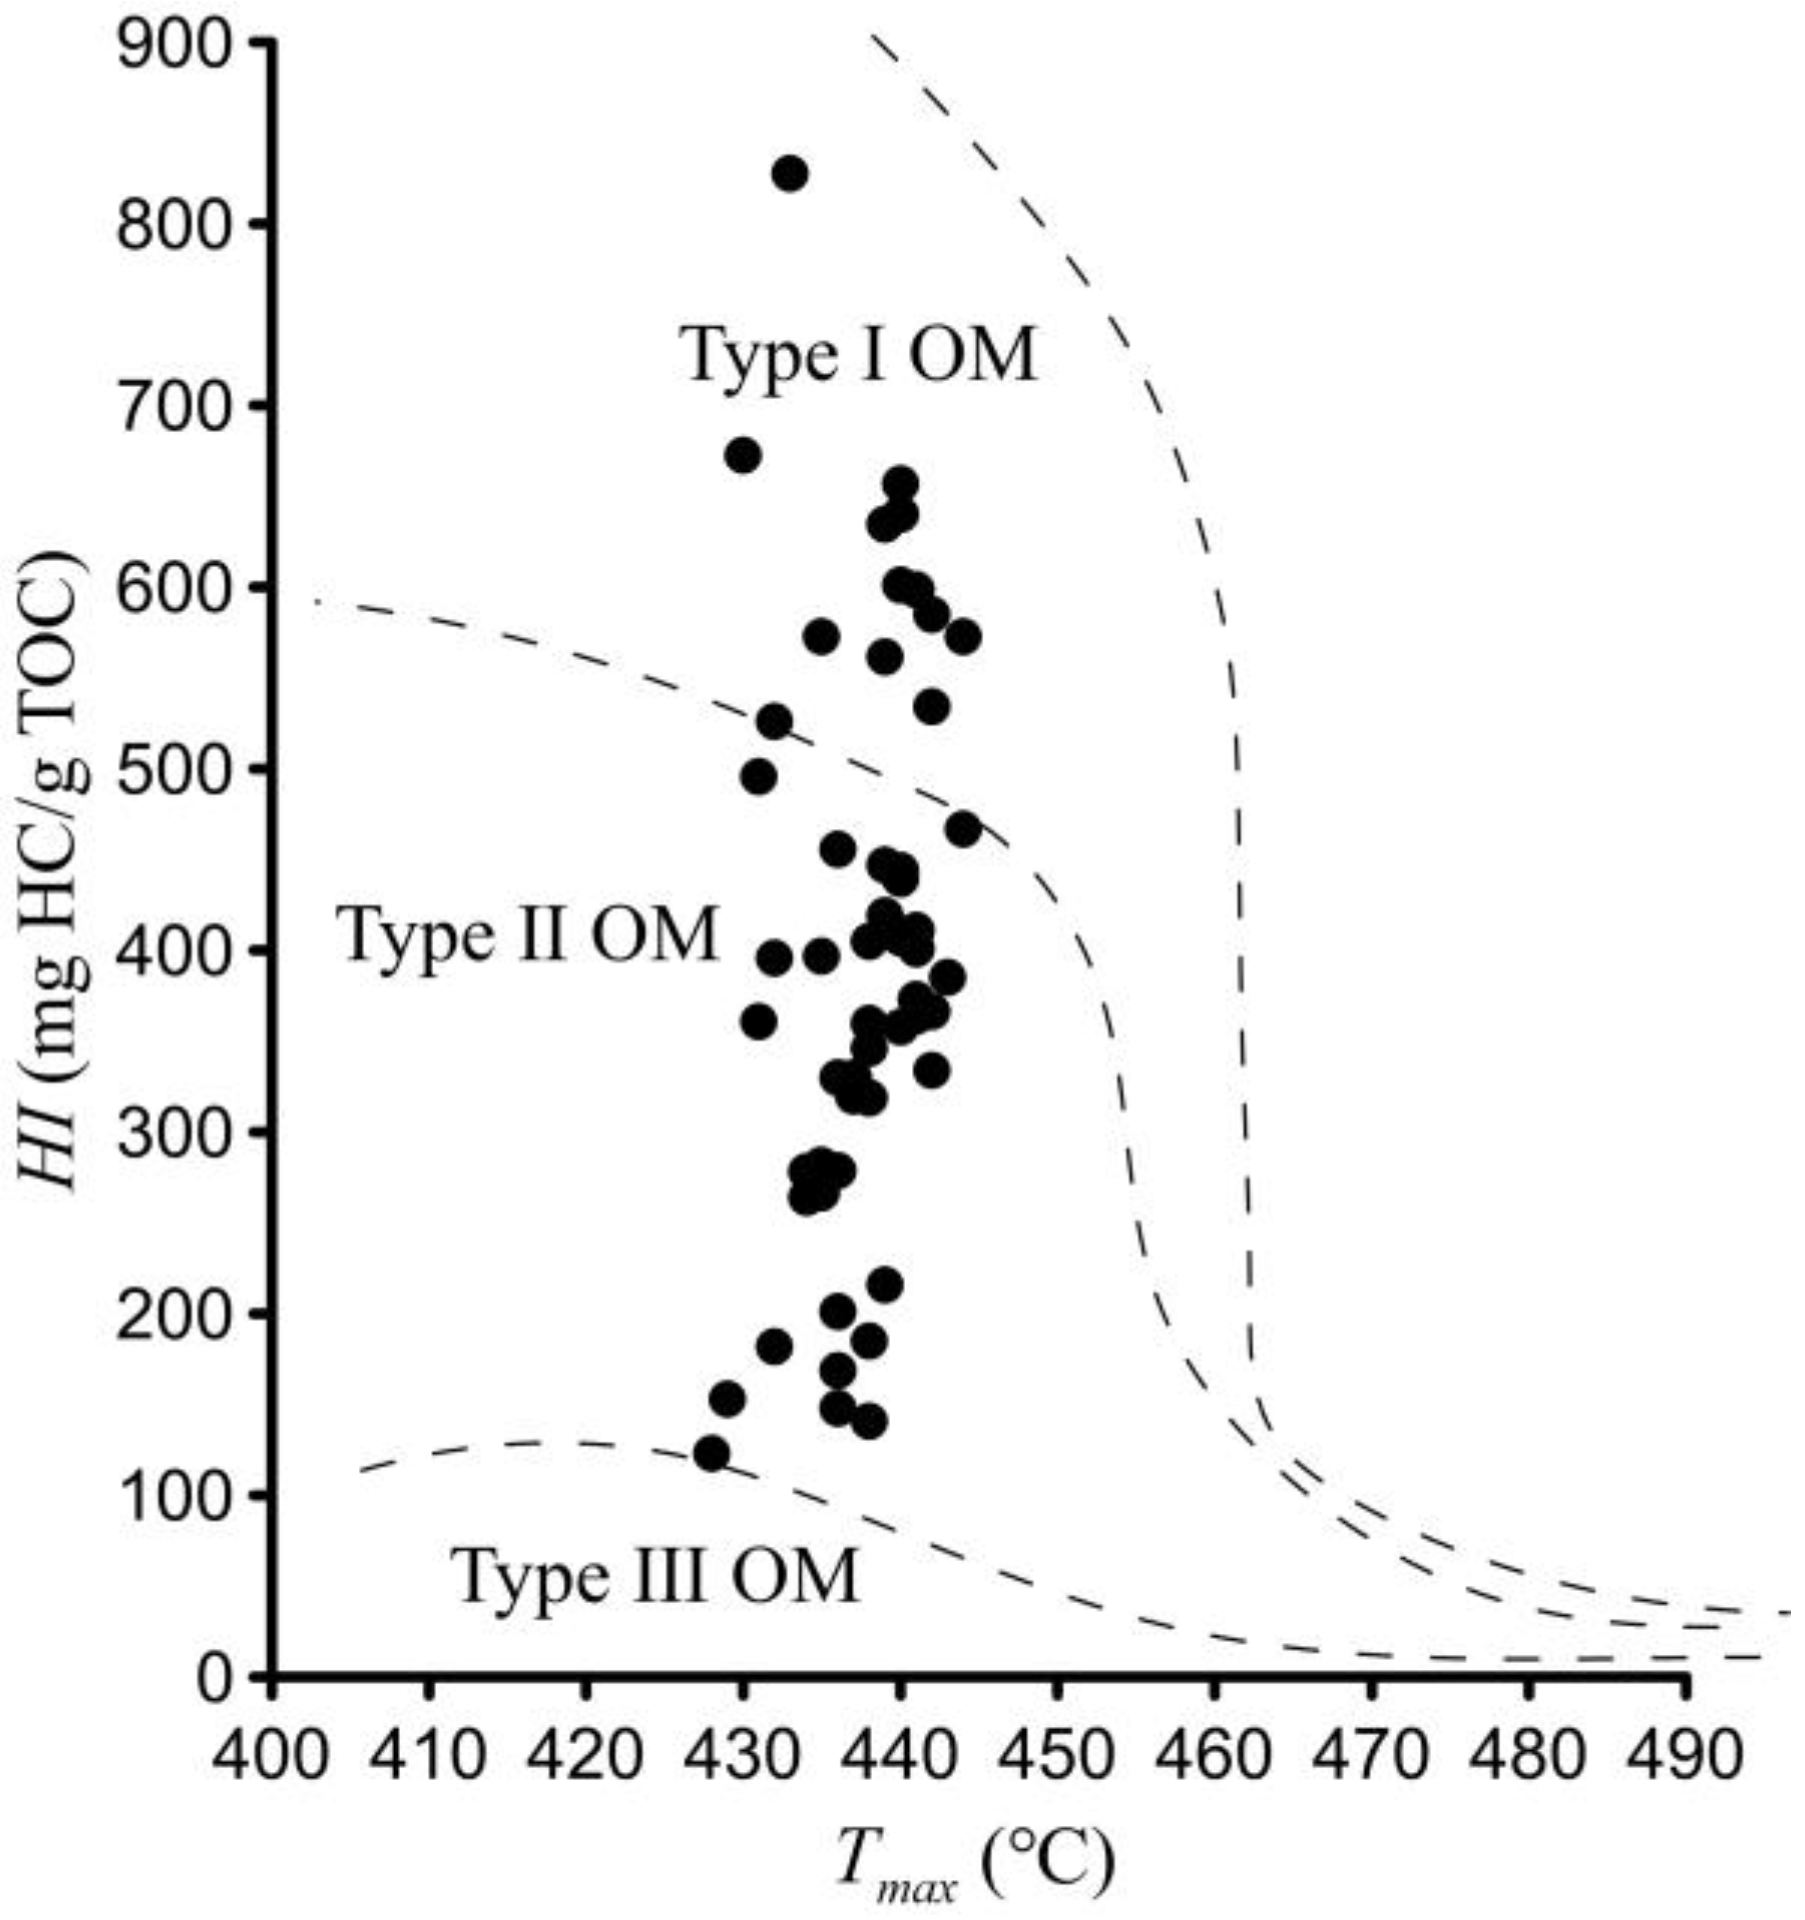
It can be seen that the OM maturity had a large span (Tmax is between 428 °C and 444 °C), ranging from immature through low maturity to mature and that most of them belong to the stage of thermal degradation. Further, the sulfur content of the pyrolysis product varied widely, which further verifies that the OM maturity had a large span (Table 1). Pyrolysis parameters are commonly used in the classification of kerogens. In this field, Tissot and Espitalie of the FPI (French Petroleum Institute) jointly developed new pyrolysis technologies to evaluate source rocks and their maturity stages (based on hydrogen index and oxygen index) from the perspective of quality and quantity and proposed a thermal evolution model of organic matter in sedimentary rocks [23,26,27]. In this study, according to the cross-plot of pyrolysis parameters HI and Tmax (Figure 6), type I and type II OM are mainly developed in the studied interval.

4.4. Shale Oil Occurrence State

The shale oil occurrence states mainly included the adsorption state and the free state. Accurately characterizing the content of these two types of oil is a precondition for the evaluation of shale oil mobility. For OM-rich shale, previous studies have confirmed that kerogen adsorption was dominant relative to mineral adsorption [6,9,17]. In this study, there are two key points for the quantitative characterization of adsorbed oil. One is the determination of the boundary between free oil and adsorbed oil, and the other is the determination of the boundary between adsorbed oil and kerogen in the process of rock pyrolysis. The pyrolysis curve is a combined response of free oil, adsorbed oil, and kerogen-derived hydrocarbon. S1 represents free oil and S2 represents the sum of adsorbed oil and kerogen-derived hydrocarbon. The pyrolysis curve after extraction represents the kerogen degradation (S1-1 may be residual hydrocarbons (adsorbed oil) or organic solvents, with an average value of 0.06 mg/g, and S2-1 is the kerogen-derived hydrocarbon). Therefore, (S2-S2-1) represents all adsorbed oil, and S1 can be regarded as all free oil. According to Table 1, the content of adsorbed oil is 0.12~10.32 mg/g, with an average content of 3.55 mg/g, and the content of free oil is 0.23~12 mg/g, with an average content of 4.14 mg/g. The content of free oil was slightly higher than the adsorbed oil.
According to the changing trend between the adsorbed oil ((S2-S2-1)/TOC) and free oil (S1/TOC) per unit of TOC (Figure 7), it can be seen that with the increase of (S2-S2-1)/TOC, S1/TOC begins to increase sharply. When the (S2-S2-1)/TOC reaches 100 mg/g TOC, S1/TOC no longer increases sharply (stable at around 150 mg/g TOC). This shows that free oil begins to discharge from the oil generation system at the time (S2-S2-1)/TOC reaches 100 mg/g TOC. The free oil in the system is saturated, however, the adsorbed oil is not saturated, part of the newly generated shale oil is adsorbed, and the other part is discharged from the system.

5. Discussion

5.1. Factors Affecting the Shale Oil Occurrence State

There are many factors affecting the shale oil occurrence state. According to previous studies [17,23,37], it can be summarized into two categories. One is the mineral type and content, especially the clay minerals, which have a great impact on the shale oil occurrence state. The other is the OM abundance, type, and maturity. Different OM abundances and types have different adsorption capacities to shale oil, and the shale oil components produced by different maturities and their impacts on reservoir space are different.

5.1.1. Mineral Composition

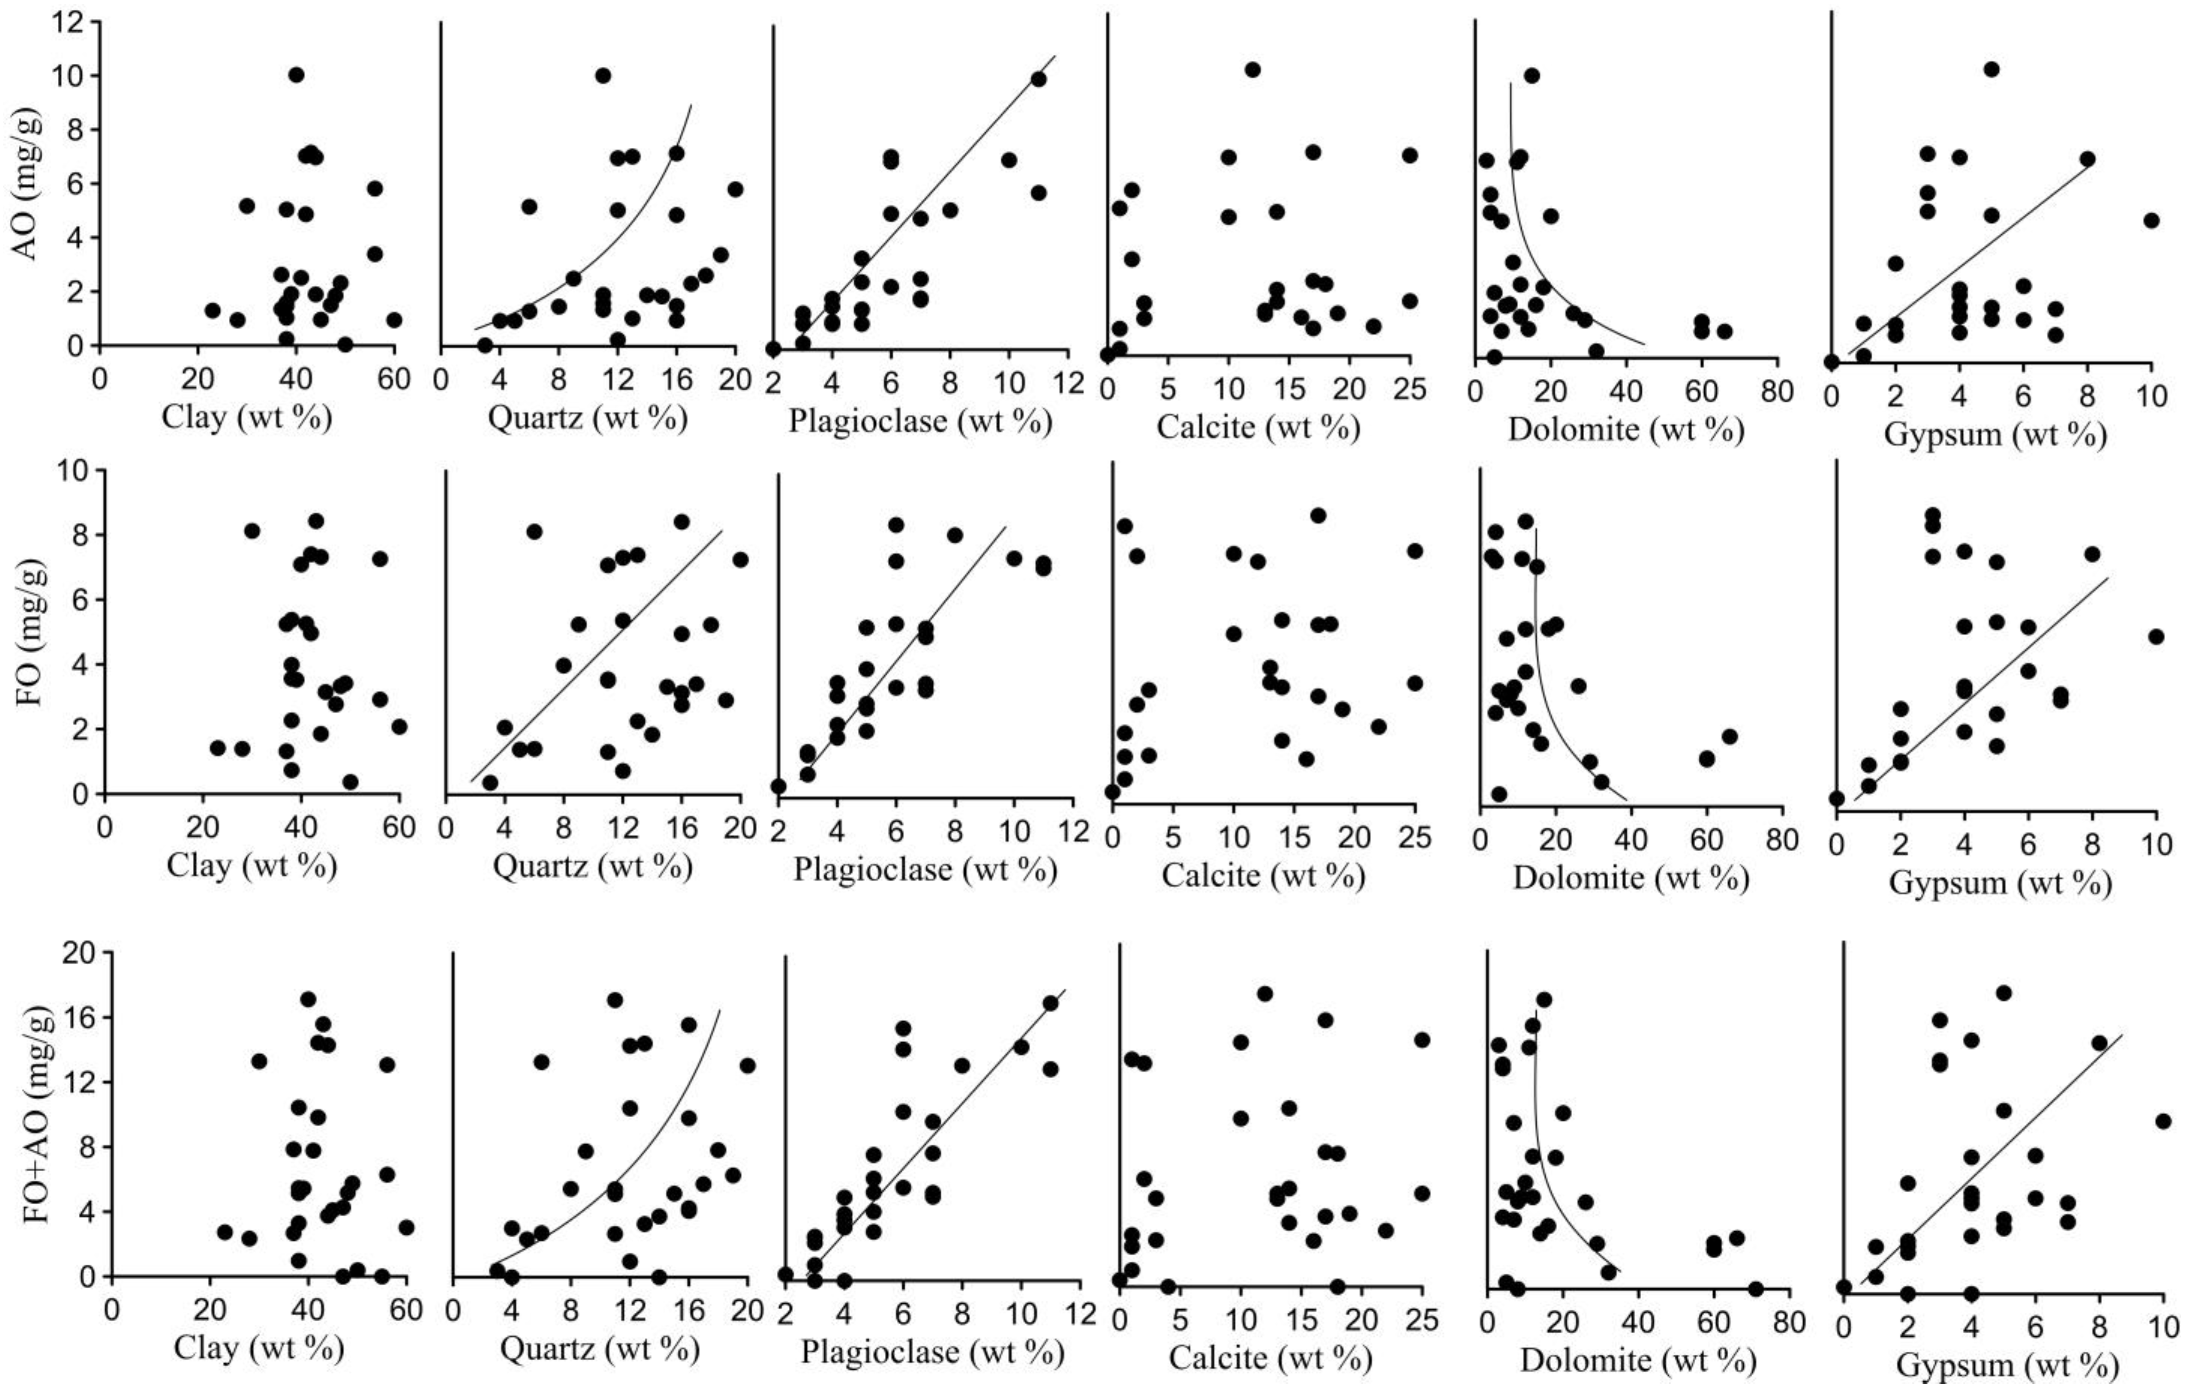
The minerals in the studied interval mainly included clay, quartz, plagioclase, calcite, dolomite, and gypsum. We analyze the correlation of minerals with adsorbed oil, free oil, and total oil (adsorbed oil + free oil), respectively (Figure 8), so as to determine the influence of these six minerals on the shale oil occurrence state.
According to Figure 8, the overall correlation is relatively weak. Clay content has no obvious correlation with adsorbed oil, free oil, and total oil. Quartz content has a certain positive correlation with free oil, adsorbed oil, and total oil. Plagioclase content has an obvious positive correlation with adsorbed oil, free oil, and total oil. Calcite and dolomite content have no obvious correlation with adsorbed oil and free oil, while gypsum has a certain positive correlation with free oil, adsorbed oil, and total oil. Based on these correlations, we infer that the minerals in the studied interval have a weak adsorption capacity for shale oil. Among many minerals, plagioclase, quartz, and gypsum have a certain influence on shale oil mobility, while the influence is not large.

5.1.2. Organic Matter Type, Abundance, and Maturity

OM type plays an important role in hydrocarbon composition and hence affects the mobility of source rocks during maturation [38]. The hydrocarbon composition generated from type II OM is rich in aromatics and NSO compounds, which usually results in the retention of heavy compounds and the formation of viscous shale oil. On the contrary, the oil generated from type I and III OM contains a large amount of paraffin with a relatively low content of aromatics and NSO compounds, and the shale oil is more mobile compared with that from type II OM [39]. In addition, the oil mobility ability increases with the increase of TOC for type II OM, while there was no obvious effect of TOC on the oil mobility for type III OM [40].
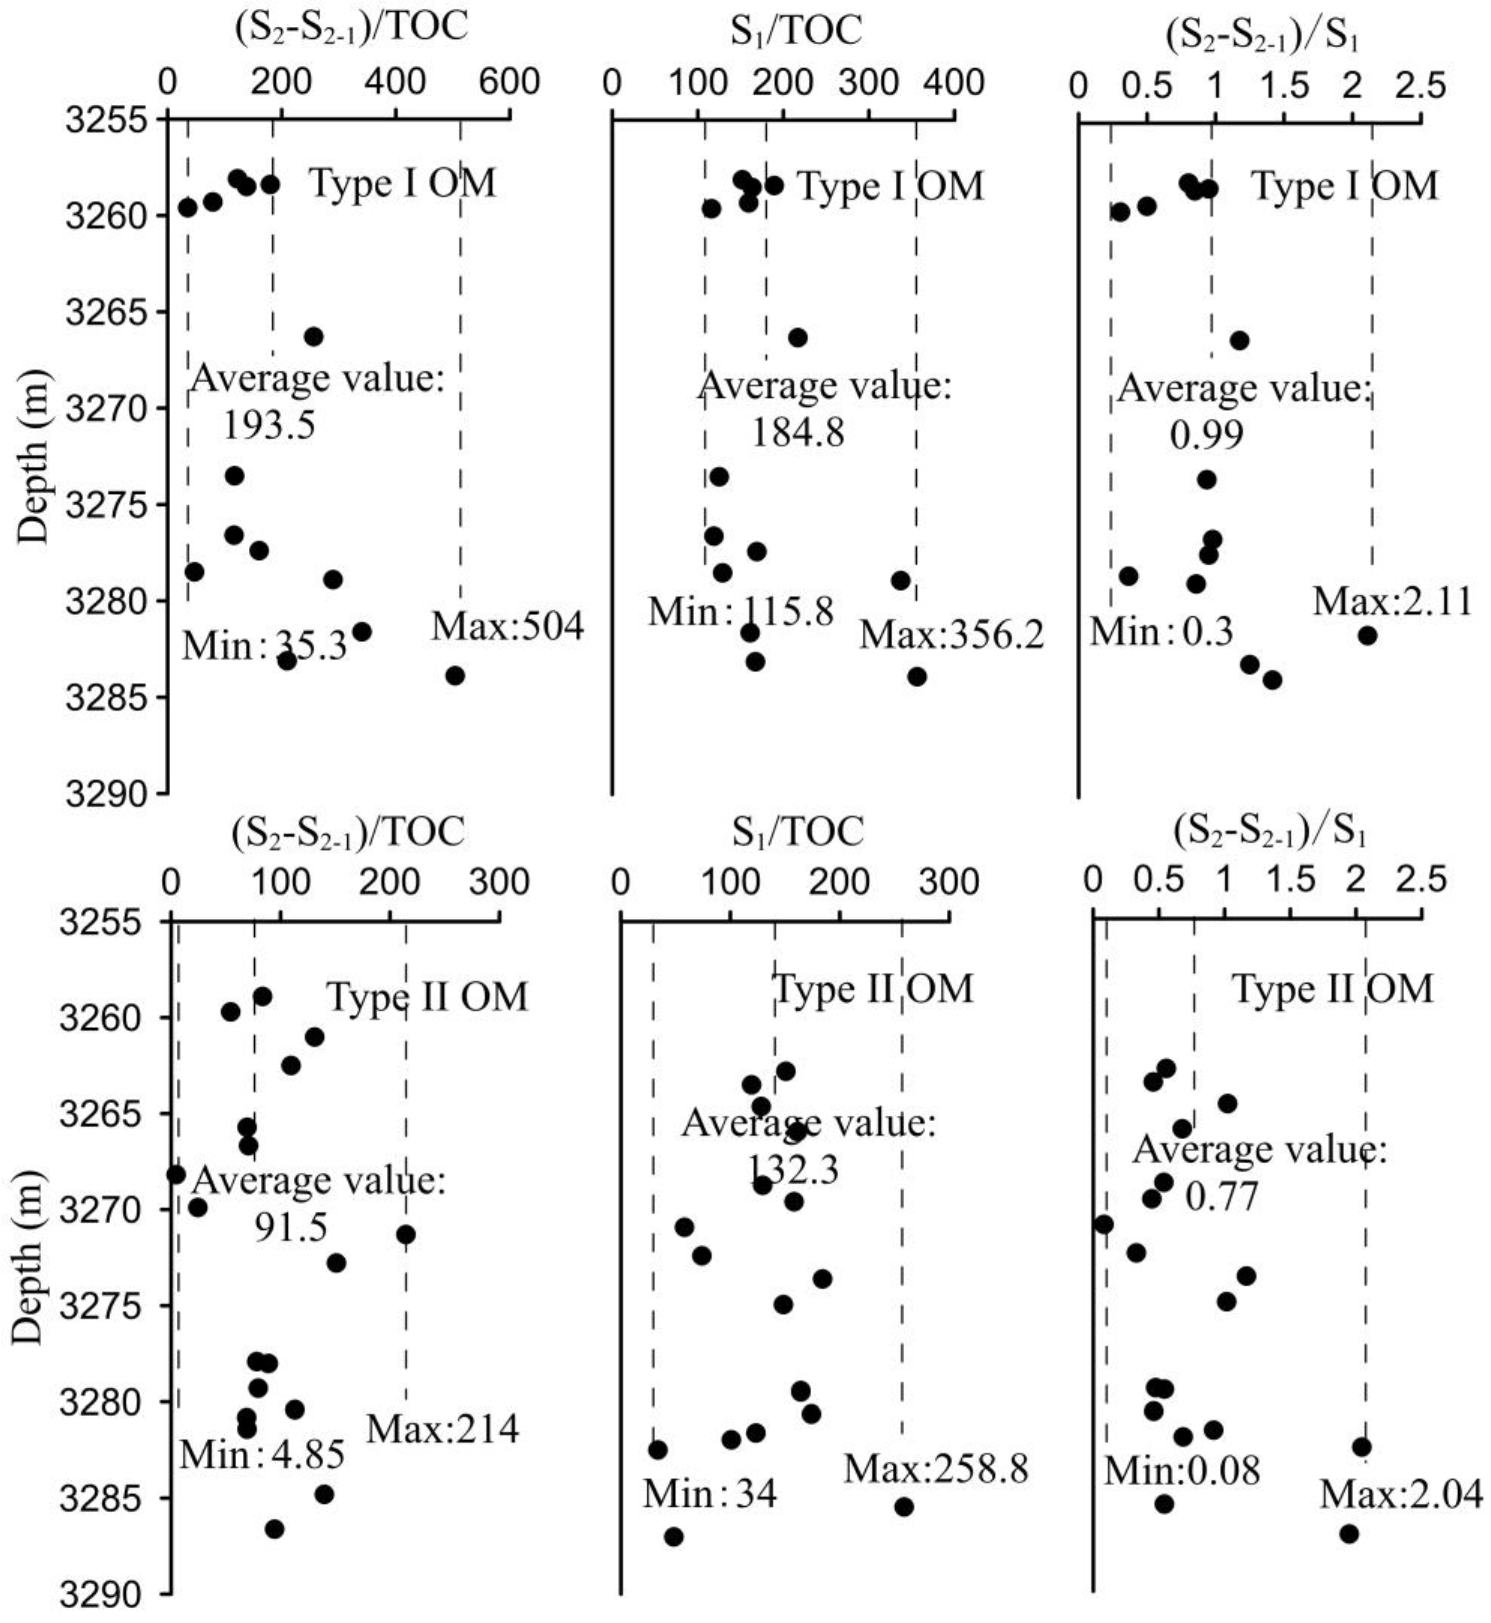
It has been proven that the studied interval mainly develops type I and II OM, and type III OM is not developed. According to the above analysis, it can be seen that the contents of adsorbed oil and free oil for type II OM are relatively low, with an average content of 1.66 mg/g and 2.59 mg/g, respectively, while the contents of adsorbed oil and free oil for type I OM are relatively higher, with an average of 6.22 mg/g and 6.26 mg/g, respectively. In order to further determine the influence of the OM types on the adsorbed oil, the TOC should be considered. In addition, the adsorbed oil or free oil cannot be analyzed separately. Therefore, the OM types and the content of adsorbed oil ((S2-S2-1)/TOC), free oil (S1/TOC) per unit TOC, and the ratio between the two ((S2-S2-1)/S1) are compared one by one (Figure 9).
The results show that the (S2-S2-1)/TOC for type II OM is between 4.85 and 214 mg/g TOC, with an average value of 91.5 mg/g TOC; and the S1/TOC is between 34 and 258.8 mg/g TOC, with an average value of 132.3 mg/g TOC; while (S2-S2-1)/S1 is between 0.08 and 2.04, with an average value of 0.77. However, for type I OM, the (S2-S2-1)/TOC is between 35.3 and 504 mg/g TOC, with an average value of 193.5 mg/g TOC; and the S1/TOC between 115.8 and 356.2 mg/g TOC, with an average value of 184.8 mg/g TOC; while the (S2-S2-1)/S1 is between 0.3 and 2.11, and the average value is 0.99. The values of (S2-S2-1)/TOC, S1/TOC, and (S2-S2-1)/S1 for type I OM are all higher than those for type II OM. Among many parameters, the ratio ((S2-S2-1)/S1) between free oil and adsorbed oil can best describe the OM adsorption capacity for shale oil. It is further inferred that the adsorption capacity of type I OM (average value of (S2-S2-1)/S1 is 0.99) is stronger than that of type II OM (average value of (S2-S2-1)/S1 is 0.77), and this is consistent with previous studies [39,40].
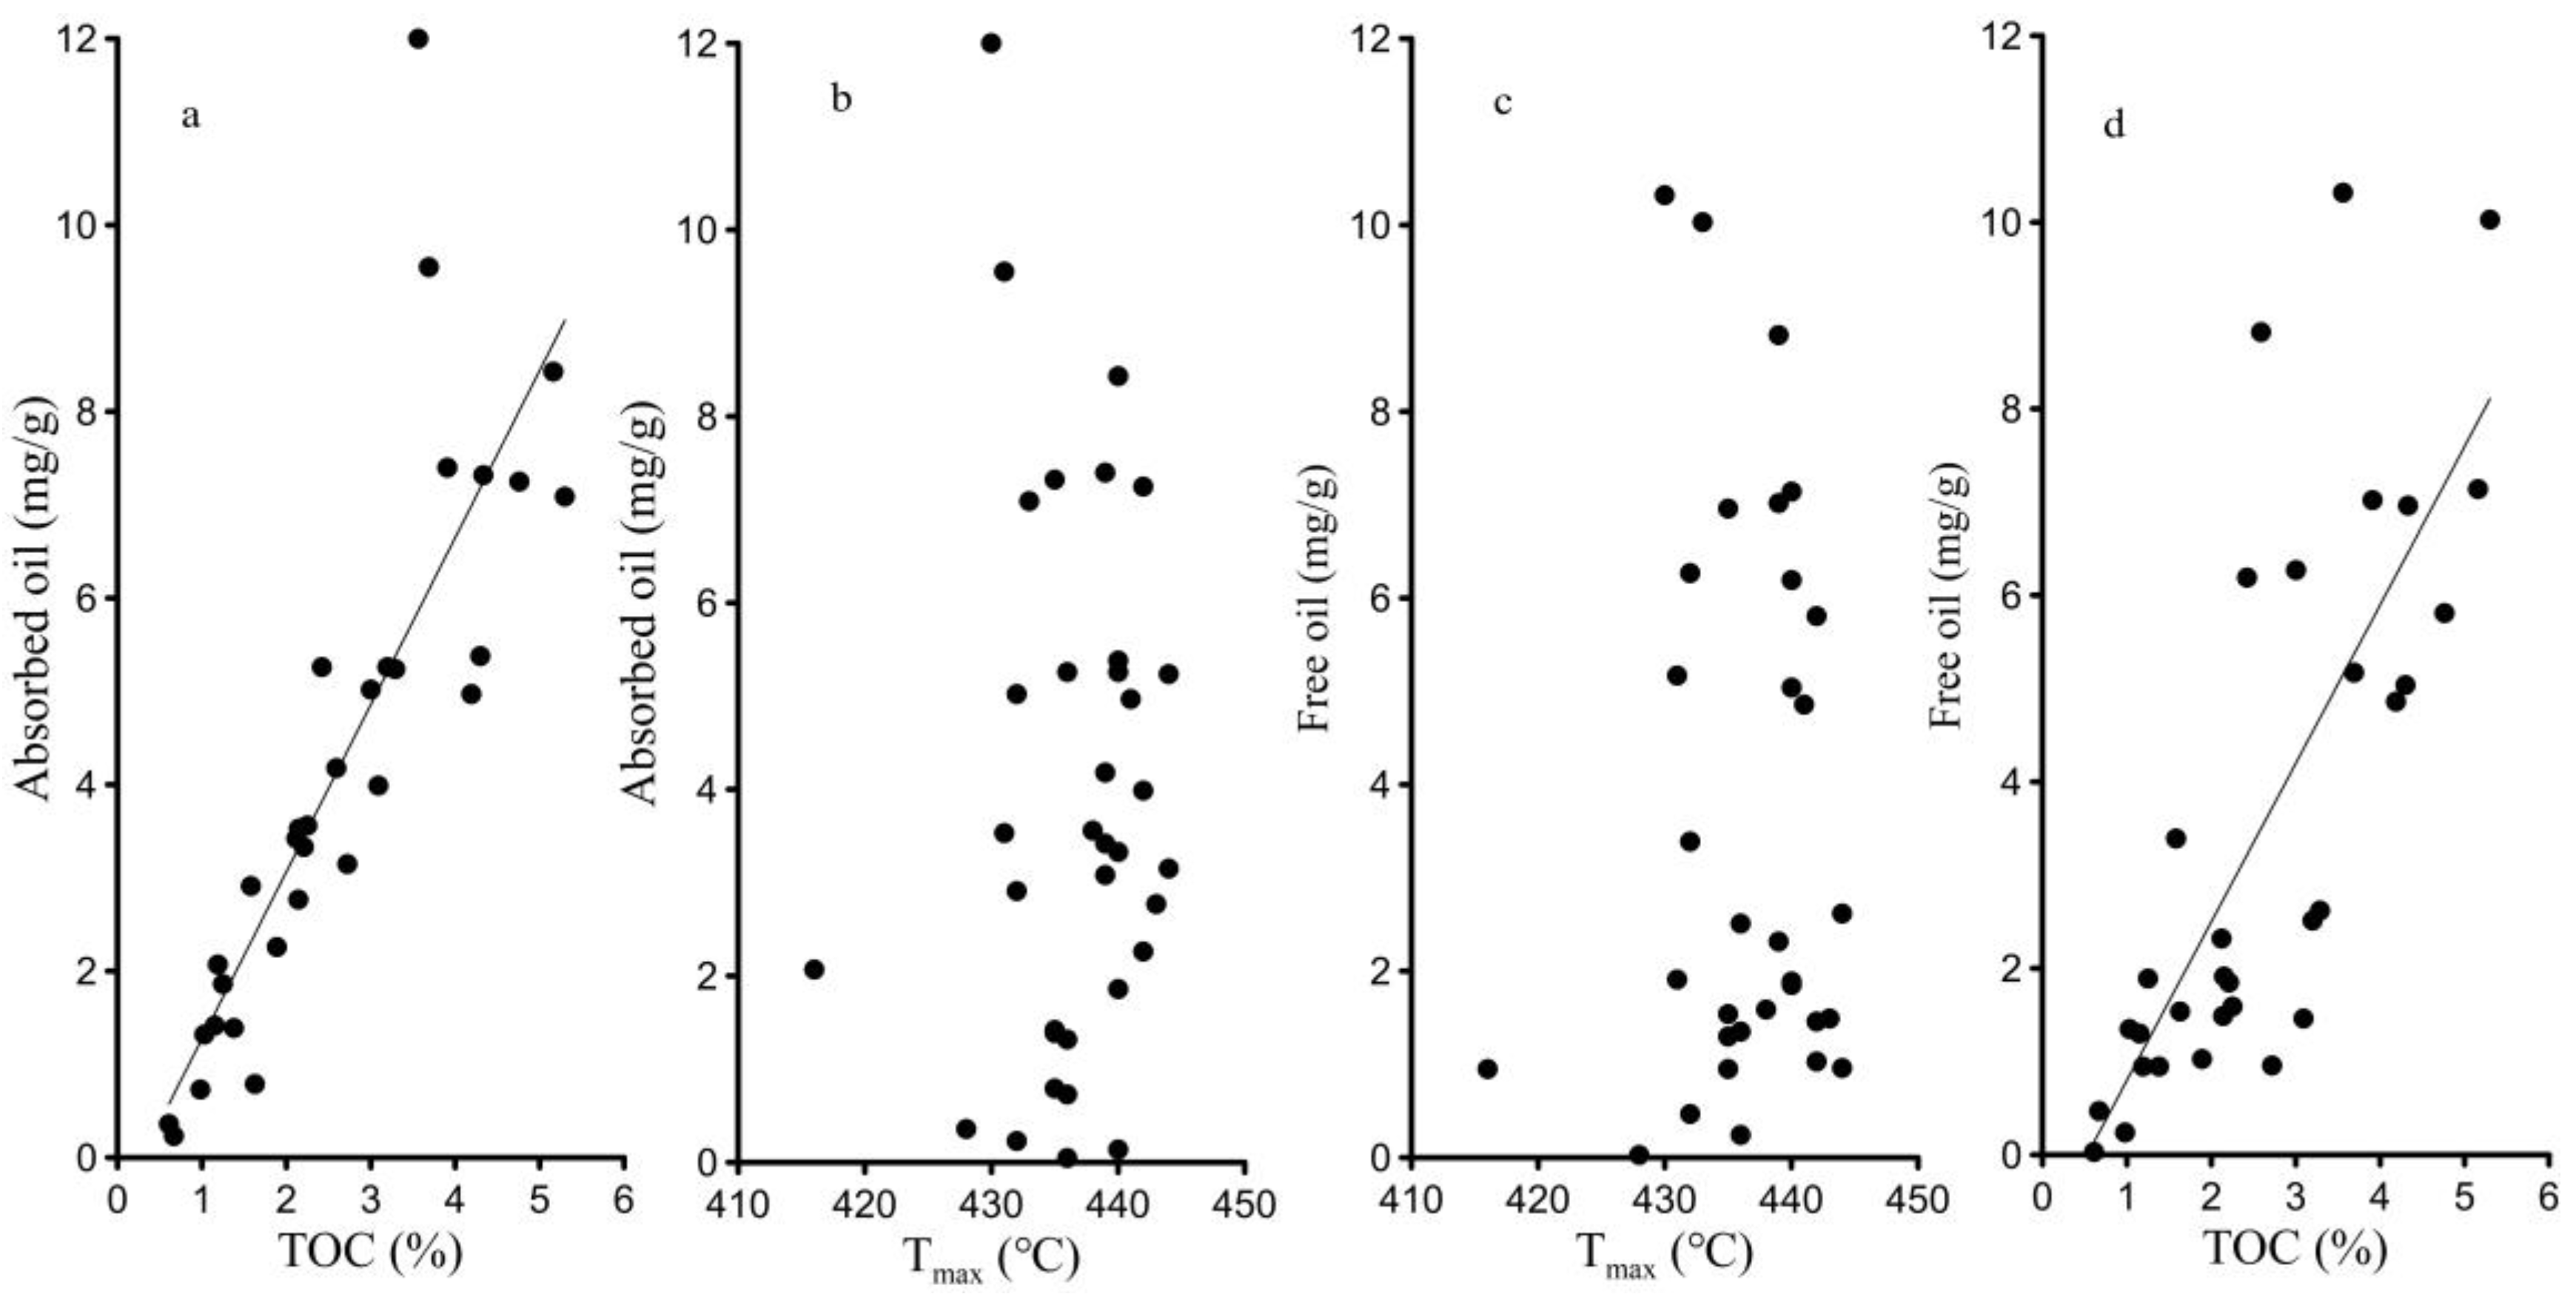
In addition, we found that the contents of adsorbed oil and free oil gradually increased with the increase of TOC, showing a good positive correlation (Figure 10a,d). It can be inferred that OM abundance is crucial to the shale oil occurrence state and mobility. According to Figure 10b,c, it can be seen that the adsorbed oil and free oil increased sharply with the increase of maturity, whereas the correlation was very poor, indicating that the maturity had little effect on the shale oil occurrence state and mobility.

5.1.3. Shale Oil Composition

The OM in the source rock is of great significance for the retention and migration of oil and gas. It has been confirmed by the hydrocarbon diffusion experiments that kerogen adsorption can cause the fractionation of the oil components [21,41]. The fractionation efficiency is mainly controlled by the TOC content and kerogen type [21], and pore size is of great significance to the oil components’ fractionation as well. The migration capacity of the components in crude oil are different (saturated hydrocarbon > aromatic hydrocarbon > NSO compound > asphaltene, light hydrocarbon > heavy hydrocarbon), and the longer the migration distance, the more likely the fractionation of shale oil components will occur [42]. In this study, we determined the relationship between the shale oil occurrence state and its composition (aromatic hydrocarbon, saturated hydrocarbon, nonhydrocarbon, and asphaltene) (Figure 11). Figure 11 shows that the shale oil components have no obvious relationship with the adsorbed oil and free oil. All points show a scattered and disordered distribution, indicating that the component had a relatively weak influence on the shale oil occurrence state and mobility. At the same time, it also shows that the shale oil in the studied interval does not undergo large-scale component fractionation.

5.2. Shale Oil Intrasource Migration

The biggest features of shale oil are in situ retention and accumulation, and they generally have experienced short-distance intrasource migration. With the increase in maturity, the immature kerogen begins to crack and generates bitumen first, followed by oil and gas, accompanied by coke bitumen, charcoal, and other byproducts, which have significant impacts on the OM connectivity [23,43,44,45]. Immature OM exists in the form of randomly distributed kerogen [46,47], and its connectivity is mainly related to OM abundance. When OM is in two important transformation stages (the cracking of OM to generate bitumen, and the further cracking of bitumen to generate petroleum), a large amount of liquid petroleum is generated and migrated [48,49]. However, this migration is conditional, and it is called the threshold of hydrocarbon expulsion.
The research on the shale oil migration mechanism has received attention for a long time [20]. The diffusion of hydrocarbon molecules through the kerogen network can form the primary accumulation, and this diffusion depends on the ratio of bitumen to kerogen and is limited to relatively small hydrocarbon molecules. Diffusion is an important and slow migration mechanism for immature or early mature source rocks [50]. Hydrocarbon molecules continuously produced by kerogen diffuse into pores or fractures through the kerogen network. When pores or fractures are saturated, hydrocarbon molecules migrate rapidly in interconnected pores or fractures. Previous studies have shown that hydrocarbon molecules begin to flow when the oil saturation in pores is between 15~25% [51,52,53]. Mann et al. (1994) point out that oil migration is at its peak when the oil saturation in the pores is between 40~60% [52]. Most hydrocarbon molecules percolate in a discrete petroleum phase, which is called dispersed flow. It is driven by the gradient of pressure and buoyancy in macropores and fractures. These gradients are mainly caused by burial-induced compaction, which is further enhanced by the increased volume from the transition of solid kerogen to the liquid petroleum phase [53,54]. The above studies show that there is a threshold for hydrocarbon migration.

5.2.1. The Threshold of Hydrocarbon Expulsion

In the process of hydrocarbon generation and expulsion, determining the threshold of hydrocarbon expulsion is very important. Jarvie (2012, 2014) systematically counts the S1 and TOC data of major oil-producing shale formations in North America, such as Bakken, Eagle Ford, Marcellus, and Montney, and shows that there is a specific threshold for crude oil flow in shale formations. They use the oil saturation index (OSI) to represent the threshold. It has been pointed out that when the OSI reaches 100 mg/g TOC, the generated hydrocarbons overcome the adsorption ability of OM-rich shale, and thus the excess hydrocarbons can be expelled out of the source rocks [3,31].
Many studies directly apply this threshold of hydrocarbon expulsion without considering that most of the shales in China are lacustrine deposits, while the value of 100 mg/g TOC obtained by Jarvie (2012) is based on the marine shale formation in North America. Therefore, the difference in geological conditions makes the threshold of hydrocarbon expulsion unsuitable for the lacustrine shale. Many scholars redetermine the threshold of oil expulsion for the lacustrine shale through the evolution law of many parameters such as hydrocarbon generation potential (HGP) [4,23,55]. In this study, according to a large number of pyrolysis data in upper Es3 members, Tmax is used as the scale for the degree of thermal evolution (maturity). We analyzed the correlation of OSI and HGP changing with Tmax, further completed the analysis of the whole process for hydrocarbon generation and expulsion, and identified the threshold of hydrocarbon expulsion. At the same time, we analyzed the law of total oil, chloroform bitumen “A” and total hydrocarbon changing with Tmax, so as to verify each other and obtain a more accurate threshold of hydrocarbon expulsion (Figure 12).
During the experiment, we first determined the threshold of oil expulsion according to the relationship between HGP and Tmax. The corresponding Tmax was identified as shown in Figure 12b. Then we determined the OSI corresponding to the threshold of oil expulsion according to the relationship between OSI and Tmax (Figure 12a). Similarly, Tmax corresponding to the threshold of hydrocarbon expulsion can be obtained according to the relationship diagram of the total oil with Tmax (Figure 12c), chloroform bitumen A with Tmax (Figure 12d), and total hydrocarbon with Tmax (Figure 12e).
According to Figure 12a,b, when Tmax reaches 428~430 °C, the upper Es3 member begins to enter the stage of oil generation, and the OSI and HGP increase rapidly. When Tmax reaches 430~440 °C, the changes of OSI and HGP are basically the same, which is in a stable stage. When Tmax is between 438~440 °C, it reaches the peak of oil generation and then begins to decline. That is, after 440°C, a large amount of oil is expelled. Combined with the law that the total oil, chloroform bitumen A, and total hydrocarbon change with the Tmax (Figure 12c–e), it can be verified that when Tmax is about 430 °C, the upper Es3 member begins to generate oil, and when Tmax is about 440 °C, it is at the peak of oil generation and begins to discharge oil. Then, count the OSI corresponding to Tmax in the range of 438~440 °C, and calculate the OSI corresponding to the threshold of oil expulsion.
According to the statistics of 10 groups of OSI corresponding to Tmax in this temperature range (438~440 °C), the average OSI is 158 mg/g TOC. This value is basically the same as the OSI (about 150 mg/g TOC) determined in Figure 7, which further verifies the accuracy of the threshold. That is, when the OSI reaches 158 mg/g TOC, the shale pore will be saturated and the excess hydrocarbons will be discharged out of the system.

5.2.2. The Process of Hydrocarbon Expulsion

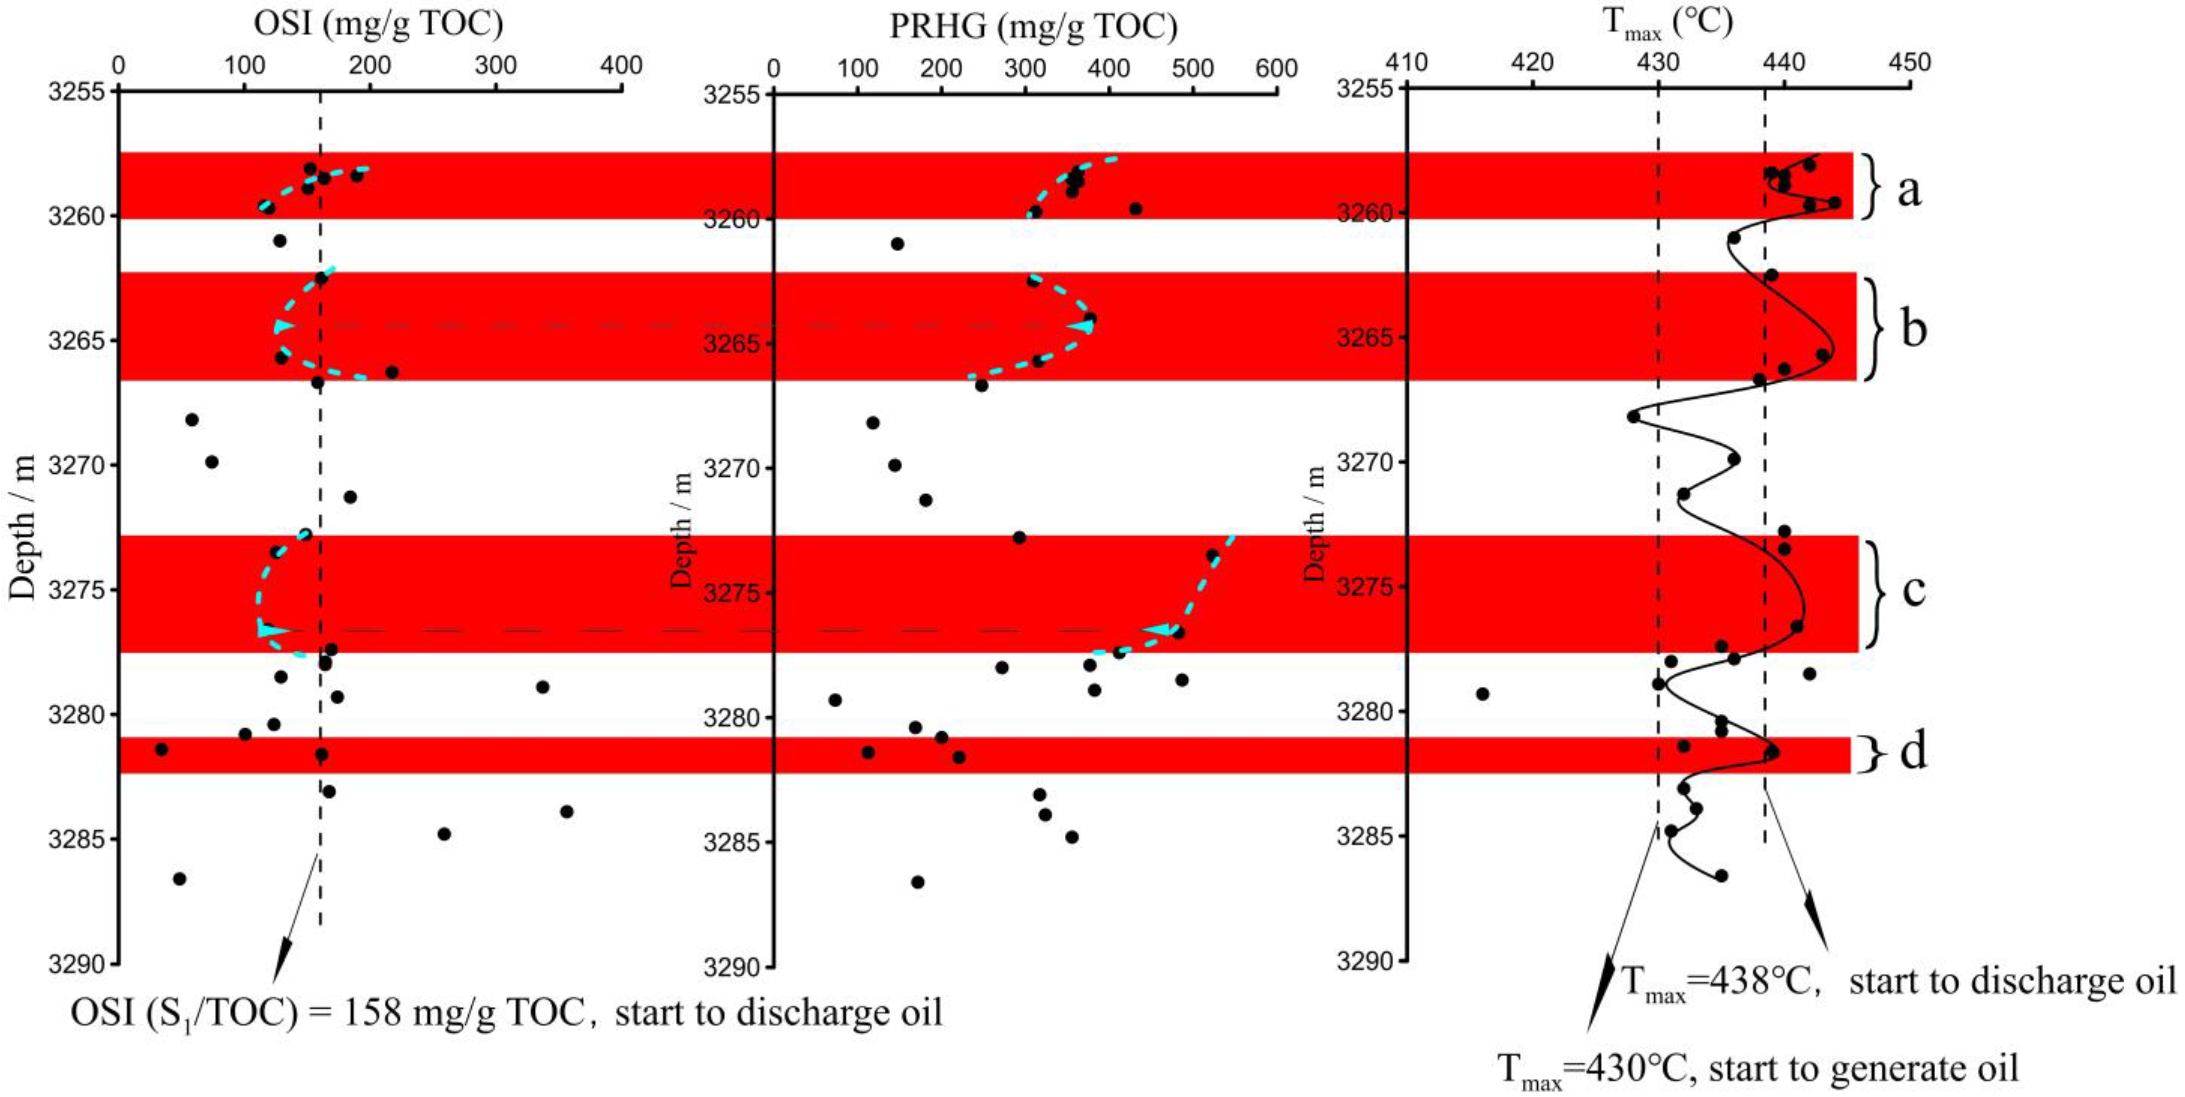
In order to further clarify which small intervals in the upper Es3 member have experienced oil discharge, the OSI, residual hydrocarbon generation potential (RHGP, kerogen), and Tmax are projected onto the depth profile (Figure 13) to analyze the hydrocarbon expulsion process. The results show that there are four small intervals meeting the conditions for oil expelled, namely interval a (3257 m~3260 m), interval b (3262 m~3267 m), interval c (3273 m~3278 m), interval d (3281 m~3282 m).
For interval a, the OSI and RHGP have both decreased, indicating that a large amount of kerogen has been degraded to generate and expel hydrocarbons. Especially at 3260 m, which corresponds to low OSI, low RHGP, and high Tmax, indicating that a large amount of kerogen is degraded to generate oil and migrated a great deal. For interval b, the OSI first decreased and then increased and RHGP first increased and then decreased, indicating that the amount of degraded kerogen first decreased and then increased. The ability to expel hydrocarbons was weak. Most of the generated hydrocarbons stayed in place and a small amount of hydrocarbons were discharged from the pore system. For interval c, the OSI was mostly below 158 mg/g TOC and it first decreased and then increased, while the RHGP was relatively high and it showed a significant downward trend. This suggests that kerogen is degraded in large quantities. A small part of the generated hydrocarbons stayed in place, and most of them were discharged from the pore system. The maturity in interval d was relatively low, and it had not reached the conditions for large-scale hydrocarbon expulsion. The RHGP was significantly increased, indicating that the degradation of kerogen was weakened, and oil is not discharged while the OSI of individual points is relatively high. It may be caused by the migration of other layers.

5.2.3. The Evaluation of Shale Oil Mobility

Previous publications showed that only when the OSI exceeds 100 mg/g TOC, it has a certain potential for exploration and development [3,32]. Huang et al. (2020) not only determined that the threshold of hydrocarbon expulsion for shale in the Yanchang Formation is 70 mg/g TOC, they also referred to the important role of TOC in the evaluation of shale oil mobility [56]. In addition, most of the OSI of the intersalt strata in the Qianjiang sag of China can reach hundreds or even higher, however, it is found that some strata with low content of free hydrocarbon (S1) have not actually achieved good oil and gas production [4,6,57], which further verifies the limitation of relying on a single OSI to evaluate. In this study, we systematically evaluated the shale oil mobility in the upper Es3 member by integrating various parameters such as the threshold of hydrocarbon expulsion, the content of adsorbed oil, the content of free oil, and the TOC.
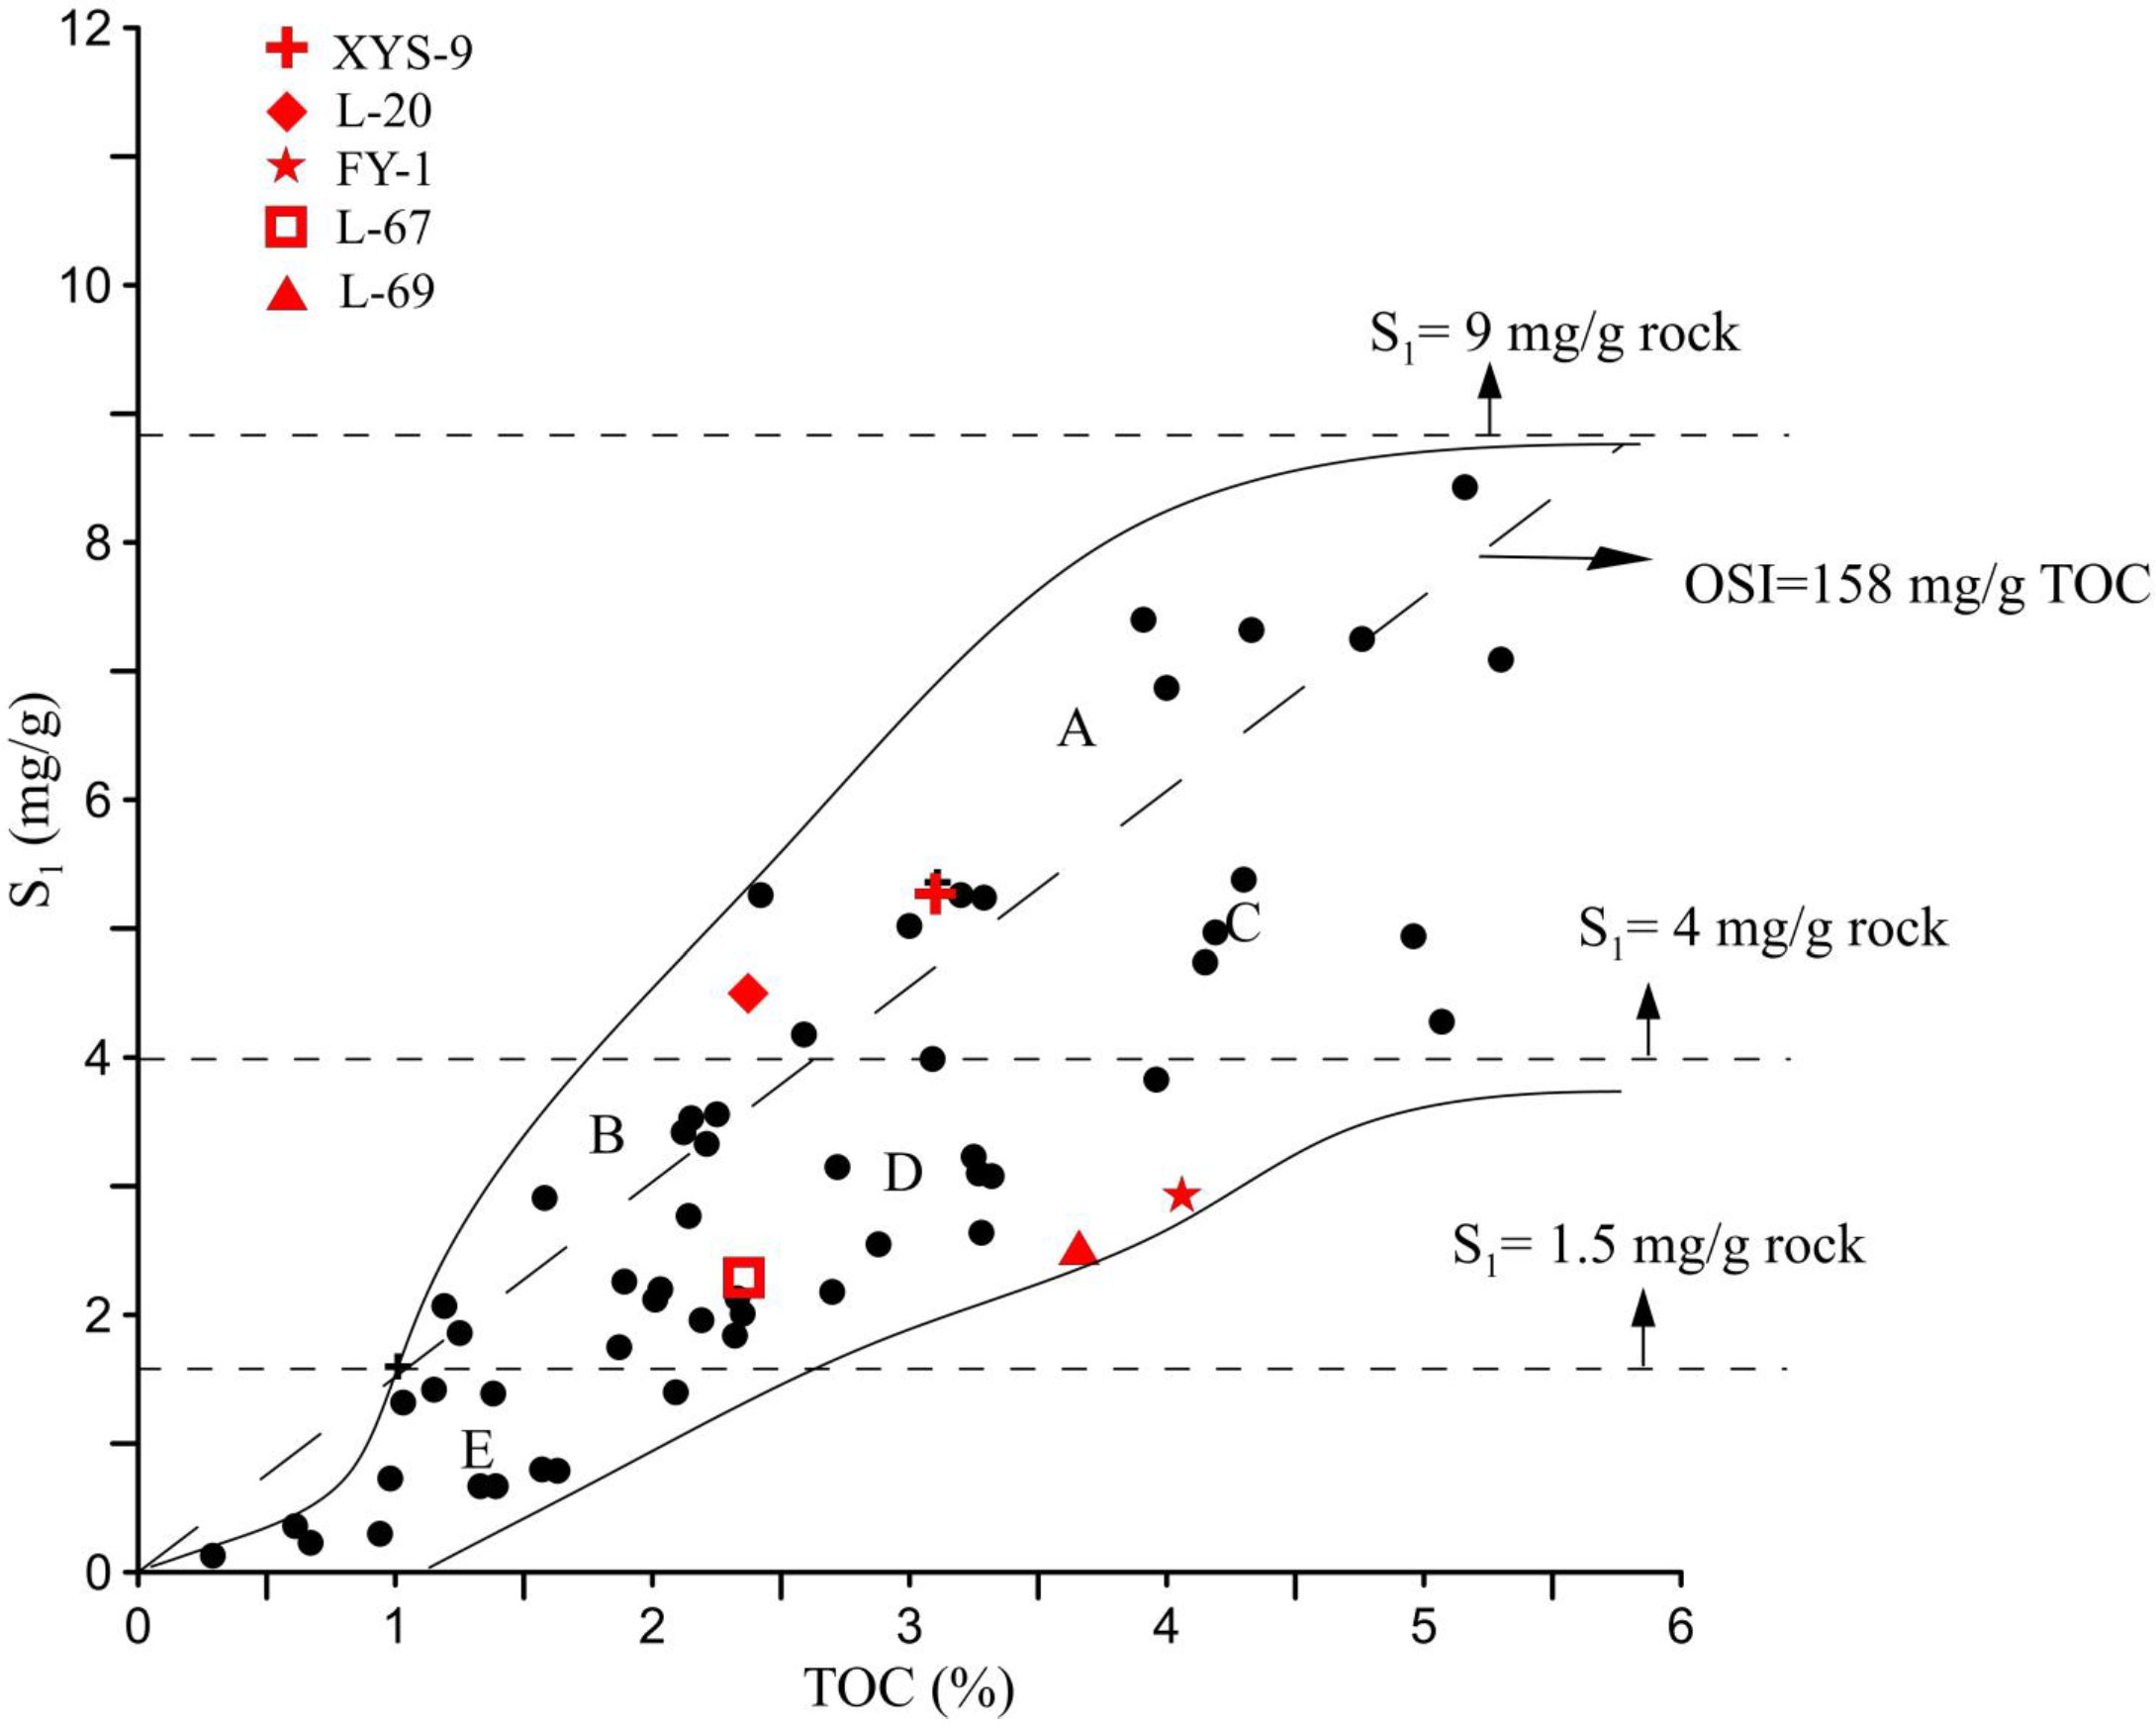
Based on the cross-plot of S1 and TOC, combined with the threshold of hydrocarbon expulsion (OSI = 158 mg/gTOC), free oil, adsorbed oil, and other parameters established above, we have established the evaluation chart for shale oil mobility, and then completed the evaluation of shale oil mobility (Figure 14, Table 2). According to Figure 14, the free oil (S1) shows obvious three-stage characteristics. When the TOC is greater than 4%, S1 is at a stable high value; when the TOC is between 1~4%, S1 rises rapidly; when the TOC is less than 1%, S1 is at a stable low value.
Therefore, the shale oil in the studied interval can be divided into five categories (Figure 14): A, B, C, D, and E. The upper envelope was about 9 mg/g and the lower envelope was about 4 mg/g. For category A, the free oil was greater than 4 mg/g with an average value of 6.96 mg/g; the adsorbed oil (S2-S2-1) was 2.51~10.32 mg/g with an average content of 6.3 mg/g; the OSI was greater than 158 mg/g TOC, and the RHGP (S2-1) was 5.72~23.89 mg/g with an average value of 13.95 mg/g. For category B, the free oil is 1.5~4 mg/g with an average value of 2.81 mg/g; the adsorbed oil was 0.95~3.39 mg/g with an average value of 2.03 mg/g; the OSI was greater than 158 mg/g TOC, and the RHGP is 0.87~6.56 mg/g with an average value of 4.34 mg/g. For category C, free oil was greater than 4 mg/g with an average value of 6.17 mg/g; adsorbed oil was 4.86~10.03 mg/g with an average value of 6.4 mg/g; the OSI was less than 158mg/g TOC, and the RHGP was between 6.44~22.49 mg/g with an average value of 17.79 mg/g. For category D, free oil was 1.5~4 mg/g with an average value of 2.89 mg/g; adsorbed oil was 0.96~1.89 mg/g with an average value of 2.03 mg/g; the OSI was greater than 158 mg/g TOC, and the RHGP was 3.66~15.04 mg/g with an average value of 8.49 mg/g. However, for category E, free oil (average value is 1.0) and adsorbed oil (average value is 0.84) are both less than 1.5 mg/g; the OSI was also less than 158 mg/g TOC, and the RHGP was 0.73~2.8 mg/g with an average value of 1.7 mg/g, which can be regarded as ineffective resources.
In order to verify the validity of this model, the rock pyrolysis parameters S1 and TOC of five wells in Jiyang Depression, including L-69, L-67, XYS-9, FY-1, and L-20, were collected through literature research, as well as the oil test data of corresponding intervals (Table 3) [58,59]. The average S1 and TOC of the five wells were projected into the model (Figure 14). It can be seen that the two wells with the highest oil rate were located in area A, while the other three Wells with poor oil rates were located in D, which fully verifies the effectiveness of the model. To sum up, category A and category C have good mobility and can be called effective resources. Category B and category D have relatively poor mobility, however, they have a certain potential and can be called potential resources. Category E has the worst mobility and the lowest content of organic matter, so it can be regarded as having ineffective resources (Table 2).

6. Conclusions

The studied interval mainly develops type I and II OM, and the content of free oil (average 4.14 mg/g) is slightly higher than adsorbed oil (average 3.55 mg/g). The adsorption capacity of minerals to shale oil is relatively weak. The influence of brittle minerals such as quartz and feldspar on the shale oil occurrence state and mobility is stronger than that of clay minerals. The whole process of hydrocarbon generation and expulsion shows that when Tmax is around 430 °C, the upper Es3 member begins to generate oil. When Tmax is around 438 °C, it is at the peak of oil generation and begins to discharge oil. Based on this, the OSI corresponding to the threshold of hydrocarbon expulsion is calculated to be 158 mg/g TOC. In small interval a (3257 m~3260 m), a large amount of kerogen is degraded to generate and expel hydrocarbons. In small interval b (3262 m~3267 m), the ability to generate and expel hydrocarbons is weak, most of the generated hydrocarbons are retained in situ, and a small amount of hydrocarbon is discharged from the pore system. In small interval c, the ability to generate and expel hydrocarbons is relatively strong, a small amount of generated hydrocarbons is retained in situ, and most of them are discharged from the pore system. The maturity of small interval d is relatively low, the degradation of kerogen is weakened, and oil is not discharged, but the OSI of individual points is relatively high. It may be caused by oil migration from other layers. The evaluation chart of shale oil mobility shows that five categories of A, B, C, D, and E are developed in the studied interval. Category A and category C have good mobility and can be called effective resources. Category B and category D have relatively poor mobility. However, they have a certain potential and can be called potential resources. Category E has the worst mobility and can be regarded as an ineffective resource.

Author Contributions

Methodology, Q.Y. and H.P.; Validation, H.P.; Formal analysis, X.Y.; Investigation, Q.Y. and X.Y.; Writing—original draft, Q.Y.; Writing—review & editing, H.P. and H.L.; Project administration, H.P., H.L. and H.C.; Funding acquisition, H.P. and H.C. All authors have read and agreed to the published version of the manuscript.

Funding

This research was funded by the PetroChina Innovation Foundation (grant number 2019D-5007-0105) and the National Natural Science Foundation of China (NSFC) (grant number 42072176).

Data Availability Statement

All relevant data are within the paper.

Acknowledgments

In particular, we are very grateful to the reviewers for their constructive suggestions and comments.

Conflicts of Interest

The authors declare no conflict of interest.

References

  1. Zhou, Q.F.; Yang, G.F. Definition and application of tight oil and shale terms. Oil Gas Geol. 2012, 4, 541–544, (In Chinese with English abstract). [Google Scholar]
  2. Zhi, D.M.; Tang, Y.; Yang, Z.F.; Guo, X.G.; Zheng, M.G.; Wan, M.; Huang, L.L. Geological characteristics and accumulation mechanism of continental shale oil in Jimusaer sag, Junggar Basin. Oil Gas Geol. 2019, 40, 524–534, (In Chinese with English abstract). [Google Scholar]
  3. Jarvie, D.M. Components and processes affecting producibility and commerciality of shale resource systems. Geol. Acta 2014, 12, 307–325. [Google Scholar]
  4. Chen, J.P.; Sun, Y.G.; Zhong, N.N. The efficiency and model of petroleum expulsion from the lacustrine source rocks within geological frame. Acta Geol. Sin. 2014, 88, 2005–2032. [Google Scholar]
  5. Radwan, A.E.; Husinec, A.; Benjumea, B.; Kassem, A.A.; Abd El Aal, A.K.; Hakimi, M.H.; Thanh, H.V.; Abdel-Fattah, M.I.; Shehata, A.A. Diagenetic overprint on porosity and permeability of a combined conventional-unconventional reservoir: Insights from the Eocene pelagic limestones, Gulf of Suez, Egypt. Mar. Pet. Geol. 2022, 146, 105967. [Google Scholar] [CrossRef]
  6. Jiang, Q.G.; Li, M.W.; Ma, Y.Y. Molecular geochemical evaluation of shale oil mobility: A case study of shale oil in Jiyang Depression. Pet. Geol. Exp. 2018, 40, 849–854. [Google Scholar]
  7. Li, J.J.; Liu, Z.; Li, J.Q.; Lu, S.F.; Zhang, T.Q.; Zhang, X.W.; Yu, Z.Y. Fractal characteristics of continental shale pores and its significance to the occurrence of shale oil in China: A case study of Biyang Depression. Fractals 2018, 26, 1840008. [Google Scholar] [CrossRef] [Green Version]
  8. Niu, D.M.; Li, Y.L.; Zhang, Y.F.; Sun, P.C.; Wu, H.G.; Fu, H.; Wang, Z.Q. Multi-scale classification and evaluation of shale reservoirs and ‘sweet spot’ prediction of the second and third members of the Qingshankou Formation in the Songliao Basin based on machine learning. J. Pet. Sci. Eng. 2022, 216, 110678. [Google Scholar] [CrossRef]
  9. Li, H.; Lu, J.L.; Wang, B.H.; Lu, K.; Zhou, Y.; Wang, M.; Zhao, L.J.; Song, Z.C. Controlling factors of continental shale oil mobility and resource potential in Dongpu Sag, Bohai Bay Basin. Pet. Geol. Exp. 2020, 4, 632–638. [Google Scholar]
  10. Evenick, J.C.; McClain, T. Method for characterizing source rock organofacies using bulk rock composition. AAPG Mem. 2013, 103, 71–80. [Google Scholar]
  11. Peng, J.W.; Pang, X.Q.; Shi, H.S. Hydrocarbon generation and expulsion characteristics of Eocene source rocks in the Huilu area, northern Pearl River Mouthbasin, South China Sea: Implications for tight oil potential. Mar. Pet. Geol. 2016, 72, 463–487. [Google Scholar] [CrossRef]
  12. Li, Y.; Wu, H.; Zhang, Y.; Liao, Z.; Hu, W.; Fu, H.; Li, Z. Reservoir diversity and its genetic mechanism in the Es4 abnormally high-porosity zone of deep sandstone in the Bonan step-fault zone, Bonan Sag, Bohai Bay Basin, China. J. Pet. Sci. Eng. 2020, 191, 107216. [Google Scholar] [CrossRef]
  13. Demaison, G.J.; Moore, G.T. Anoxic environments and oil source bed genesis. AAPG Bull 1980, 64, 1179–1209. [Google Scholar] [CrossRef]
  14. Hu, T.; Pang, X.Q.; Wang, Q.F. Geochemical and geological characteristics of Permian Lucaogou Formation shale of the well Ji174, Jimusar Sag, Junggar Basin, China: Implications for shale oil exploration. Geol. J. 2017, 4, 1–15. [Google Scholar] [CrossRef]
  15. Zhang, J.C.; Lin, L.M.; Li, Y.X. Classification and evaluation of shale oil. Earth Sci. Front. 2012, 19, 322–331. [Google Scholar]
  16. Zou, C.N.; Yang, Z.; Cui, J.M.; Zhu, R.K.; Hou, L.H. Formation mechanism, geological characteristics and development strategy of nonmarine shale oil in China. Pet. Explor. Dev. 2013, 40, 14–26, (In Chinese with English abstract). [Google Scholar] [CrossRef]
  17. Jiang, Q.G.; Li, M.W.; Qian, M.H.; Li, Z.M.; Li, Z.; Huang, Z.K. Quantitative characterization of shale oil in different occurrence states and its application. Pet. Geol. Exp. 2016, 38, 842–849. [Google Scholar]
  18. Espitalié, J.; Madec, M.; Tissot, B. Role of mineral matrix in kerogen pyrolysis: Influence on petroleum generation and migration. AAPG Bull. 1980, 64, 59–66. [Google Scholar]
  19. Han, Y.; Mahlstedt, N.; Horsfield, B. The Barnett Shale: Compositional fractionation associated with intraformational petroleum migration, retention, and expulsion. AAPG Bull. 2015, 99, 2173–2202. [Google Scholar] [CrossRef] [Green Version]
  20. Pepper, A.S.; Corvi, P.J. Simple kinetic models of petroleum formation. Part III modeling an open system. Marine and Petroleum Geology 1995, 12, 417–452. [Google Scholar] [CrossRef]
  21. Sandvik, E.I.; Young, W.A.; Curry, D.J. Expulsion from hydrocarbon sources; the role of organic absorption. Org. Geochem. 1992, 19, 77–87. [Google Scholar] [CrossRef]
  22. Sarmiento, M.F.; Ducros, M.; Carpentier, B.; Lorant, F.; Cacas, M.-C.; Pegaz-Fiornet, S.; Wolf, S.; Rohais, S.; Moretti, I. Quantitative evaluation of TOC, organic porosity and gas retention distribution in a gas shale play using petroleum system modeling: Application to the Mississippian Barnett Shale. Mar. Pet. Geol. 2013, 45, 315–330. [Google Scholar] [CrossRef]
  23. Tissot, B.P.; Welte, D.H. Petroleum Formation and Occurrence, 2nd ed.; Springer: Berlin/Heidelberg, Germany, 1984; Volume 2, pp. 699–702. [Google Scholar]
  24. Behar, F.; Beaumont, V.; Penteado, H.L.D. Rock-Eval 6 technology: Performances and developments. Oil Gas Sci. Technol.-Rev. IFP 2001, 56, 111–134. [Google Scholar] [CrossRef]
  25. Chen, Z.H.; Li, M.W.; Jiang, C.Q.; Qian, M. H Shale oil resource potential and its mobility assessment: A case study of Upper Devonian Duvernay shale in Western Canada Sedimentary Basin. Oil Gas Geol. 2019, 40, 459–468, (In Chinese with English abstract). [Google Scholar]
  26. Espitalié, J.; Laporte, J.L.; Madec, M.; Marquis, F.; Leplat, P.; Paulet, J.; Boutefeu, A. Méthode rapide de caractérisation des roches mères, de leur potentiel pétrolier et de leur degré d’évolution. Rev. L institut Français Pet. Ann. Combust. Liq. (Rev. Inst. Fr. Pét.) 1977, 32, 23–43. [Google Scholar] [CrossRef]
  27. Espitalié, J. Use of Tmax as a maturation index for different types of organic matter. Comparison with vitrinte reflectance. In Thermal Modeling in Sedimentary Basins; Burrus, J., Ed.; Editions Technip: Paris, France, 1986; pp. 475–496. [Google Scholar]
  28. Claypool, G.E.; Reed, P.R. Thermal-analysis technique for source-rock evaluation: Quantitative estimate of organic richness and effects of lithologic variation. AAPG Bull. 1976, 60, 608–626. [Google Scholar]
  29. Clementz, D.M. Effect of oil and bitumen saturation on source-rock pyrolysis. AAPG Bull. 1979, 63, 2227–2232. [Google Scholar]
  30. Delvaux, D.; Martin, H.; Leplat, P.; Paulet, J. Geochemical characterization of sedimentary organic matter by means of pyrolysis kinetic parameters. Org. Geochem. 1990, 16, 175–187. [Google Scholar] [CrossRef]
  31. Jarvie, D.M. Shale resource systems for oil and gas: Part 2—Shale-oil resource systems. In Shale Reservoirs—Giant Resources for 21st Century; Beyer, J.A., Ed.; AAPG Memoir; American Association of Petroleum Geologists: Mattulsa, OK, USA, 2012; Volume 97, pp. 89–119. [Google Scholar]
  32. Zink, K.G.; Scheeder, G.; Stueck, H.L.; Biermann, S.; Blumenberg, M. Total shale oil inventory from an extended Rock-Eval approach on non-extracted and extracted source rocks from Germany. Int. J. Coal Geol. 2016, 163, 186–194. [Google Scholar] [CrossRef]
  33. Zhang, W.C.; Yang, D.X.; Chen, Y.J. Sedimentary Structural Characteristics and Hydrocarbon Distributed Rules of Jizhong Depression. Acta Geol. Sin. 2008, 8, 1103–1112. [Google Scholar]
  34. Zhang, H.; Li, S.; Xu, T. Characteristics and formation mechanism for the saline lacustrine oil from the north Dongpu sag. Geoscience 2017, 31, 768–778, (In Chinese with English abstract). [Google Scholar]
  35. Zhang, H.; Xu, T.; Zhang, Y. Development characteristics and significance of high quality source rocks of salty lake in Dongpu Depression. Fault-Block Oil Field 2017, 24, 437–441, (In Chinese with English abstract). [Google Scholar]
  36. Zhang, K.X.; Qi, J.F.; Zhao, Y.B. Structure and Evolution of Cenozoic in Dongpu Sag. Xinjiang Pet. Geol. 2007, 6, 714–717, (In Chinese with English abstract). [Google Scholar]
  37. Li, Z.M.; Liu, P.; Qian, M.H.; Li, M.W. Quantitative comparison of different occurrence oil for lacustrine shale: A case from cored interval of shale oil special drilling wells in Dongying depression, Bahai Bay basin. J. China Univ. Min. Technol. 2018, 43, 566–576, (In Chinese with English abstract). [Google Scholar]
  38. Penteado, H.L.B.; Behar, F. Geochemical characterization and compositional evolution of the Gomo Member source rocks in the Reconcavo Basin. AAPG Mem. 2000, 73, 179–194. [Google Scholar]
  39. Vandenbroucke, M.; Largeau, C. Kerogen origin, evolution and structure. Org. Geochem. 2007, 38, 719–833. [Google Scholar] [CrossRef]
  40. Rudkiewicz, J.L.; Behar, F. Influence of kerogen type and TOC content on multiphase primary migration. Org. Geochem. 1994, 21, 121–133. [Google Scholar] [CrossRef]
  41. Young, A.; McIver, R.D. Distribution of hydrocarbons between oils and associated fine-grained sedimentary rocks—Physical chemistry applied to petroleum geochemistry. AAPG Bull. 1977, 61, 1407–1436. [Google Scholar]
  42. Leythaeuser, D.; Schaefer, R.G.; Radke, M. Geochemical effects of primary migration of petroleum in Kimmeridge source rocks from Brae field area, North Sea. I: Gross composition of C15þ-soluble organic matter and molecular composition of C15þ-saturated hydrocarbons. Geochim. Cosmochim. Acta 1988, 52, 701–713. [Google Scholar] [CrossRef]
  43. Lewan, M.D. Laboratory simulation of petroleum formation, hydrous pyrolysis. In Organic Geochemistry; MEngel, H., Macko, S.A., Eds.; Plenum Press: New York, NY, USA, 1993; pp. 419–442. [Google Scholar]
  44. Hunt, J.M. Petroleum Geochemistry and Geology; W.H. Freeman and Company: New York, NY, USA, 1996; p. 746. [Google Scholar]
  45. Bohacs, K.M.; Passey, Q.M.; Rudnicki, W.L.; Lazar, O.R. The spectrum of fine-grained reservoirs from “shale-gas” to “shale oil”/tight liquids: Essential attributes, key controls, practical characterization. In Proceedings of the International Petroleum Technology Conference, Beijing, China, 26–28 March 2013. [Google Scholar]
  46. Cook, A.C.; Sherwood, N.R. Classification of oil shales, coals, and other organic-rich rocks. Org. Geochem. 1991, 17, 211–222. [Google Scholar] [CrossRef]
  47. Loucks, R.G.; Reed, R.M.; Ruppel, S.C.; Jarvie, D.M. Morphology, genesis, and distribution of nanometer-scale pores in siliceous mudstones of the Mississippian Barnett Shale. J. Sediment. Res. 2009, 79, 848–861. [Google Scholar] [CrossRef] [Green Version]
  48. Dahl, J.; Chen, R.T.; Kaplan, I.R. Alum Shale bitumen maturation and migration: Implications for Gotland’s oil. J. Pet. Geol. 1989, 12, 465–476. [Google Scholar] [CrossRef]
  49. Selby, D.; Creaser, R.A.; Dewing, K.; Fowler, M. Evaluation of bitumen as 187Re-187Os geochronometer for hydrocarbon maturation and migration: A test case from Polaris MVT deposit, Canada. Earth Planet. Sci. Lett. 2005, 235, 1–15. [Google Scholar] [CrossRef]
  50. Thomas, M.M.; Clouse, J.A. Primary migration by diffusion through kerogen: I. Model experiments with organic-coated rocks. Geochim. Cosmochim. Acta 1990, 54, 2775–2779. [Google Scholar] [CrossRef]
  51. Okui, A.; Waples, D.W. Relative Permeabilities and Hydrocarbon Expulsion from Source Rocks, Basin Modelling: Advances and Applications; Elsevier: Amsterdam, The Netherlands, 1993; pp. 293–301. [Google Scholar]
  52. Mann, U. An Integrated Approach to the Study of Primary Petroleum Migration. In Geological Society; Special Publications: London, UK, 1994; Volume 78, pp. 233–260. [Google Scholar]
  53. Modica, C.J.; Lapierre, S.G. Estimation of kerogen porosity in source rocks as a function of thermal transformation: Example from the Mowry Shale in the Powder River Basin of Wyoming. AAPG Bull. 2012, 96, 87–108. [Google Scholar] [CrossRef]
  54. Hunt, J.M.; Whelan, J.K.; Eglinton, L.B.; Cathles, L.M. Relation of shale porosities, gas generation, and compaction to deep overpressures in the U.S. Gulf Coast. In Abnormal Pressures in Hydrocarbon Environments; Law, B.E., Ulmishek, G.F., Slavin, V.I., Eds.; USGS Publications Warehouse: Virgina, VA, USA, 1998; pp. 87–104. [Google Scholar]
  55. Huang, Z.K.; Hao, Y.Q.; Li, S.J.; Wo, Y.J.; Sun, D.S.; Li, M.W.; Chen, J.P. Oil−bearing potential, mobility evaluation and significance of shale oil in Chang7 shale system in the Ordos Basin: A case study of well H317. Geol. China 2020, 47, 210–219, (In Chinese with English abstract). [Google Scholar]
  56. Li, J.J.; Wang, W.M.; Cao, Q.; Shi, Y.G.; Yan, X.T. Impact of hydrocarbon expulsion efficiency of continental shale upon shale oil accumulations in eastern China. Mar. Pet. Geol. 2015, 59, 467–479, (In Chinese with English abstract). [Google Scholar]
  57. Welte, D. Migration of hydrocarbons. Facts and theory. In Migration of Hydrocarbons in Sedimentary Basins; Doligez, B., Ed.; Technip: Paris, France, 1987; pp. 393–413. [Google Scholar]
  58. Wang, Y.S.; Li, Z.; Gong, Z.; Hao, Y.Q.; Hao, X.F.; Wang, Y. Discussion on evaluation method of shale oil and gas in Jiyang depression: A case study on Luo jia area in Zhanhua sag. Acta Pet. Sin. 2013, 34, 83–91. [Google Scholar]
  59. Li, J.B. Study on Occurrence Mechanism and Mobility of Shale Oil: A Case Study of Shahejie Formation in Jiyang Depression. Ph.D. Thesis, China University of Petroleum (Huadong), Qingdao, China, 2020. (In Chinese with English abstract). [Google Scholar]
Figure 1. Regional structural location of the Liutun sag in the Dongpu depression. (a) regional location map of the Dongpu depression in Bohai Bay Basin, China; (b) regional location map of the Liutun sag in the Dongpu depression; (c) regional tectonic geological map of the Liutun sag [36].
Energies 16 02101 g001
Figure 2. Simplified stratigraphic histogram of the Liutun sag in the Dongpu depression, Bohai Bay Basin [36,37].
Energies 16 02101 g002
Figure 3. Variation of components in an extract with depth. Sat: saturated hydrocarbon; Aro: aromatic hydrocarbons; Res: Nonhydrocarbon; Asp: asphaltene.
Energies 16 02101 g003
Figure 4. The average mineral content in Es3 source rocks of well PS-18-1, Liutun sag, Dongpu Depression.
Energies 16 02101 g004
Figure 5. Changes in the content of various minerals with depth.
Energies 16 02101 g005
Figure 6. Chart for identifying the types of organic matter—a cross plot of Tmax and HI; where Tmax is the maximum temperature of pyrolysis and HI is the hydrogen index.
Energies 16 02101 g006
Figure 7. The trend of S1/TOC versus (S2-S2-1)/TOC; where S1/TOC is the content of free oil per unit of TOC and (S2-S2-1)/TOC is the content of adsorbed oil per unit of TOC.
Energies 16 02101 g007
Figure 8. Correlation analysis of minerals with adsorbed oil, free oil, and total oil (adsorbed oil + free oil) respectively. AO: adsorbed oil; FO: free oil; AO + FO: total oil (adsorbed oil + free oil).
Energies 16 02101 g008
Figure 9. Changes of adsorbed oil ((S2-S2-1)/TOC, mg HC/g TOC) and free oil (S1/TOC, mg HC/g TOC) per unit TOC and the ratio ((S2-S2-1)/S1) of two with depth.
Energies 16 02101 g009
Figure 10. Influence of the abundance (TOC) and maturity (Tmax) of organic matter on the occurrence state of shale oil; (a,d) show the influence of TOC on adsorbed oil and free oil; (b,c) are the influence of Tmax on adsorbed oil and free oil.
Energies 16 02101 g010
Figure 11. Correlation analysis between the shale oil components, free oil, and adsorbed oil, respectively. FO: free oil; AO: adsorbed oil; Sat: saturated hydrocarbons; Aro: aromatic hydrocarbons; Res: nonhydrocarbons; Asp: asphaltenes.
Energies 16 02101 g011
Figure 12. The whole process of hydrocarbon generation and expulsion. (Tmax represents the thermal evolution degree of organic matter, and the higher the Tmax, the higher the maturity of organic matter). OSI: oil saturation index (S1/TOC); HGP: hydrocarbon generation potential ((S1 + S2)/TOC); FO +AO: free oil + absorbed oil; CBA: chloroform bitumen “A”; TH: total hydrocarbon. (a,b) are used to identify the hydrocarbon expulsion threshold, and (ce) are used to verify the hydrocarbon expulsion threshold.
Energies 16 02101 g012
Figure 13. Analysis of hydrocarbon generation and expulsion for upper Es3 members in the studied area. a, b, c, and d all represent the small intervals in which the maturity of organic matter meets the conditions for hydrocarbon expulsion; OSI: oil saturation index (S1/TOC) and also known as free oil per unit TOC; RHGP: residual hydrocarbon generation potential (S2-1/TOC, kerogen); Tmax: maximum temperature of pyrolysis and represents the degree of thermal evolution.
Energies 16 02101 g013
Figure 14. Classification and evaluation of shale oil mobility. A and C represent good mobility, which can be called effective resources; B and D represent relatively poor mobility, but have certain potential, which can be called potential resources; E represents the worst mobility, which can be regarded as an invalid resource. OSI: oil saturation index (S1/TOC).
Energies 16 02101 g014
Table 1. Pyrolysis data before and after extraction from the Es3 source rocks of well PS-18-1 in the Liutun sag, Dongpu Depression.
DepthPyrolysis before ExtractionPyrolysis after Extraction
TmaxS1S2HIOITOCSTmax-1S1-1S2-1HI-1OI-1
3258.14427.2527.8584.6672.904.760.8214450.1322.021146.870.31
3258.44397.424.8634.7843.483.910.4594430.1117.8787.6188.50
3258.54408.4331.0601.3624.615.160.6494420.1823.891264.095.24
3258.84403.339.71439.3776.922.210.2394420.037.86992.42218.43
3259.34445.2418.8572.6444.383.290.3794470.0416.221933.2172.82
3259.64443.1512.7466.9165.072.720.2744440.0411.74798.64113.61
3259.74422.266.93366.6773.541.890.1794440.035.9656.28194.66
32614361.322.87278.64117.481.030.2224390.061.5249.6751.63
3262.54393.428.88418.8773.582.1234410.076.56321.5785.78
3265.74432.778.24385.0572.432.140.394470.026.75406.63111.45
3266.24405.2615.8656.6161.572.420.1374410.019.7326.6071.72
3266.64383.567.17318.6780.892.250.274410.25.58221.4385.71
3268.24280.360.76122.98519.420.610.2254250.070.7322.3281.96
3269.94360.731.66168.70250.000.981.264380.051.4247.9798.31
3271.34322.916.25395.57143.671.580.6494390.042.86262.39286.24
3272.84401.865.55444.00116.001.250.5754390.053.66338.89247.22
3273.54405.3827.5640.2337.444.30.6874420.0822.494149.4424.35
3276.64414.9725.1598.5727.684.190.8224430.0720.221312.9161.04
3277.44357.3224.8572.7534.874.330.184380.1217.84731.15106.56
3277.94365.2614.6455.3161.883.20.4744380.0612.06648.39126.34
32784313.537.76360.9396.742.1514350.035.85328.65163.48
3278.54423.9916.5533.9849.513.090.1394440.0315.04624.07100.41
3278.94301223.9672.4736.803.560.3534340.1213.621761.9360.93
3279.34162.071.82152.94129.41.193.744170.080.8757.24192.76
3280.44351.423.24281.74126.01.150.3014360.051.94140.58250.72
3280.84351.393.71268.84128.21.380.2784400.062.7676.4592.80
3281.44320.231.23181.951010.30.670.1584360.020.7658.02263.36
3281.64394.1814.5561.3960.622.590.2074420.025.72136.1978.81
3283.14325.0215.8526.0083.6730.34390.029.51270.17100.57
3283.94337.0916.5827.64116.581.990.114380.026.44178.3991.41
3284.84319.5518.3495.6644.443.690.5734340.113.12640.0071.71
3286.64350.794.34266.26107.981.630.2994400.022.880.9244.51
Tmax is the maximum temperature of pyrolysis, S1 is free hydrocarbon volatilized at a temperature of 300 °C, S2 is the sum of adsorbed hydrocarbon and degradation of kerogen; HI is hydrogen index (HI = S2 × 100/TOC); OI is oxygen index (OI = S3 × 100/TOC). Tmax-1 is the maximum temperature for the pyrolysis after extraction, S is sulfur; S1-1, S2-1, HI-1, and OI-1 are the parameters of pyrolysis after extraction.
Table 2. Comprehensive evaluation of shale oil mobility.
CategoryFree Oil
(mg/g)
Absorbed Oil
(mg/g)
OSI
(mg/gTOC)
PRHG-Kerogen (mg/g)Mobility EvaluationResource Evaluation
A>42.51~10.32>1585.72~23.89First-classEffective resources
B1.5~40.95~3.39>1580.87~6.56Third-classPotential resources
C>44.86~10.03<1586.44~22.49Second-classEffective resources
D1.5~40.96~1.89<1583.66~15.04Fourth-classPotential resources
E<1.50.03~1.54<1580.73~2.8Fifth-classIneffective resources
OSI: oil saturation index; RHGP: residual hydrocarbon generation potential.
Table 3. Statistical table of pyrolysis parameters and oil test parameters in the Jiyang sub-basin [58,59].
WellDepth (m)Sub-BasinIntervalAverage TOC (wt%)Average S1 (mg/g Rock)Oil Rate (t/day[b/day])
XYS-93388–3405JiyangEs33.395.0038.5 (283.1)
L-202869–2880JiyangEs32.454.589.2 (67.5)
FY-13199–3210JiyangEs34.193.052.41 (17.68)
L-673287–3310JiyangEs32.372.292.1 (15.4)
L-693040–3066JiyangEs33.832.610.85 (5.87)
Disclaimer/Publisher’s Note: The statements, opinions and data contained in all publications are solely those of the individual author(s) and contributor(s) and not of MDPI and/or the editor(s). MDPI and/or the editor(s) disclaim responsibility for any injury to people or property resulting from any ideas, methods, instructions or products referred to in the content.