Review

Site Selection of Combined Offshore Wind and Wave Energy Farms: A Systematic Review

by
Shabnam Hosseinzadeh
1,2,
Amir Etemad-Shahidi
1,2,3,* and
Rodney A. Stewart
1,2
1
School of Engineering and Built Environment, Griffith University, Southport, QLD 4222, Australia
2
Cities Research Institute, Griffith University, Southport, QLD 4222, Australia
3
School of Engineering, Edith Cowan University, Joondalup, WA 6027, Australia
*
Author to whom correspondence should be addressed.
Energies 2023, 16(4), 2074; https://doi.org/10.3390/en16042074
Submission received: 16 January 2023 / Revised: 13 February 2023 / Accepted: 18 February 2023 / Published: 20 February 2023
(This article belongs to the Special Issue Wind and Wave Energy Resource Assessment and Combined Utilization)

Abstract

:
Growing energy demand worldwide and onshore limitations have increased interest in offshore renewable energy exploitation. A combination of offshore renewable energy resources such as wind and wave energy can produce stable power output at a lower cost compared to a single energy source. Consequently, identifying the best locations for constructing combined offshore renewable energy farms is crucial. This paper investigates the technical, economic, social, and environmental aspects of Combined Offshore Wind and Wave Energy Farm (COWWEF) site selection. Past literature was evaluated using a systematic review method to synthesize, criticize, and categorize study regions, dataset characteristics, constraints, evaluation criteria, and methods used for the site selection procedure. The results showed that most studied regions belong to European countries, and numerical model outputs were mainly used in the literature as met-ocean data due to the limited coverage and low spatiotemporal resolution of buoy and satellite observations. Environmental and marine usage are the main constraints in the site selection process. Among all constraints, shipping lanes, marine protected areas, and military exercise areas were predominately considered to be excluded from the potential sites for COWWEF development. The technical viability and economic feasibility of project deployment are emphasized in the literature. Resource assessment and distance to infrastructures were mostly evaluated among techno-economic criteria. Wind and wave energy power are the most important criteria for evaluating feasibility, followed by water depth, indicators of variability and correlation of the energy resources, and distance to the nearest port. Multi-Criteria Decision-Making (MCDM) methods and resource-based analysis were the most-used evaluation frameworks. Resource-based studies mainly used met-ocean datasets to determine site technical and operational performance (i.e., resource availability, variability, and correlation), while MCDM methods were applied when a broader set of criteria were evaluated. Based on the conducted review, it was found that the literature lacks evaluation of seabed conditions (seabed type and slope) and consideration of uncertainty involved in the COWWEF site selection process. In addition, the market analysis and evaluation of environmental impacts of COWWEF development, as well as impacts of climate change on combined exploitation of offshore wind and wave energy, have rarely been investigated and need to be considered in future studies. Finally, by providing a comprehensive repository of synthesized and categorized information and research gaps, this study represents a road map for decision-makers to determine the most suitable locations for COWWEF developments.

1. Introduction

Presently, population growth and industrialization have led to a rise in energy demand across the globe. Traditional fossil energy resources are limited and will be depleted in the future. In addition, burning fossil fuels has caused air pollution and raised environmental concerns. The Paris Agreement was adopted to reduce emissions to net zero by 2050. The international community also completed the rulebook of this agreement by signing the Glasgow Climate Pact. A decade of climate action and support is therefore an aim for the 2020s [1]. For these reasons, the trend toward using clean and sustainable alternatives, namely renewable energy resources, has increased [2].
Renewable energy resources’ share of the world’s total energy consumption was approximately 13% in 2020 [3]. Biomass, geothermal, solar, hydropower, wind, and marine are renewable energy resources, the environmental impacts of which are insignificant compared to conventional energy sources and, therefore, are appropriate to supply the future clean energy demand [4]. The global renewable energy generation’s largest share at the end of 2020 was hydropower (57%), followed by wind energy (21%), solar power (11%), and others (11%). Among renewables, wind and solar energy’s contributions to the world energy capacity have been significant [5].
In recent years, offshore renewable power plant developments have become popular due to their power capacity and generation potential as well as limited onshore space. Several countries are progressively undertaking new projects regarding offshore wind power plant development [6]. The abundance of available space, low noise, and less visual impact encourage planners to develop offshore wind energy farms with fewer constraints on wind turbine (WT) size and less environmental impact [7]. The wind on open seas supplies a high level of power generation [8]. The reduced turbulence in offshore areas because of lower surface roughness, compared to onshore wind, provides higher offshore wind speed. Significant energy potential is thus expected in offshore areas, as the power is proportional to cubic wind speed [9]. However, the primary concern in offshore wind farms is their accessibility during unsuitable weather conditions [10].
Ocean wave energy is a widely untapped renewable energy source and has the potential to influence worldwide energy production [11]. The wave energy resource is power-dense and continuous and thus reliable for energy production [11,12]. Higher wave energy density signifies more energy extraction from a smaller ocean volume at a lower cost [13]. Low visibility and marine environment protection by attracting wave energy are other advantages of Wave Energy Converters (WECs). Nevertheless, the WECs’ development has been slow due to technical issues and economic obstacles [14]. The survivability in extreme conditions and optimization of efficiency are existing challenges in exploiting wave energy [15,16].

1.1. Combined Offshore Wind and Wave Energy Farms

Due to increasing levels of investment in offshore renewable energy systems, enhanced site selection methods are required to minimize the costs. Offshore renewable energy resource (wind and wave) variations, which come from their characteristics of randomness and intermittency, adversely affect energy generators’ efficiency and hence lead to higher energy costs [17]. The synergy of renewable energy resources is an efficient solution to resolve challenges presented by standalone renewables and optimize energy exploitation. Coupling complementary renewable energy options ensures greater reliability of energy supply by reducing the variation of power output and downtime period [17,18]. Integrating offshore wind and wave energy extraction makes the energy output more reliable and higher than the sum of disconnected farms [17]. Sharing space, grid connection, and infrastructures (e.g., foundations) in coupled wind and wave energy farms reduces construction and maintenance costs and improves efficiency [19]. In addition, joint exploitation of wind and wave energy resources reduces the structural load and makes it easier to access offshore wind power systems [20,21].

1.2. Site Selection Process

The crucial step prior to renewable energy farm development is site selection. To ensure the success of combined offshore wind and wave energy projects, selecting the most appropriate location for the plants’ installation makes power production more favorable from technical, economic, social, and environmental perspectives. Various constraints and objectives must be considered for optimal and practical renewable energy farms. The main concern is reducing costs while having the highest efficiency [22,23]. Other marine usage areas, such as fisheries and shipping routes, should be considered to reduce environmental impacts. In order to identify sustainable siting, many conflicting criteria and aspects of technical constraints, economic feasibility, and environmental and social impacts need to be evaluated [24]. Hence, a transparent and reliable framework is required to integrate these conflicting factors and make a final decision [25]. These inconsistent criteria make site selection a Multi-Criteria Decision-Making (MCDM) problem.

1.3. Existing Literature and Purpose of the Study

The literature is devoted to trends in renewable energy studies and technological advancements. A systematic review [26] highlighted the key criteria for assessing the feasibility of offshore wind energy deployment. In [27], all factors to optimize onshore and offshore wind power locations were categorized, underlining the differences between their decision criteria. The evaluation of trends in offshore wind energy research by [28] highlighted the use of GIS as a common site selection tool. In [29], site selection procedures in both onshore and offshore wind energy were analyzed. The application of MCDM methods for site selection of renewable energy resources was reviewed in [30], and the used Exclusion (EX) and Evaluation (EV) criteria were summarized. In [31], the restrictive and deterministic factors and methodologies for the site selection of onshore wind power plants were assessed.
As noted, most review papers examine standalone renewable energy farms’ site selections. In the case of combined offshore renewable energy exploitation, only the technological aspect of energy systems is investigated in the literature. For example, a review of synergetic technologies capable of hybridization with wave energy was conducted by [32]. Moreover, the structural options and technological aspects of combined offshore wind and wave energy systems were reviewed by [33]. In contrast with the existing abovementioned review papers, the main novelty of this paper is comprehensively reviewing the site selection process for combined offshore wind and wave energy exploitation. In this review, different perspectives of COWWEF deployment (technical, economic, social, and environmental) in the context of site selection are discussed to efficiently reduce its associated cost and negative environmental and social impacts while maximizing energy production efficiency. Regarding the growing number of studies in this field, having an overview of performed studies draws a roadmap for the future. In this way, the studied regions, the met-ocean dataset characteristics, the exclusion and evaluation criteria, and the applied methodologies for site selection analysis of COWWEF are categorized and synthesized in this paper. Practitioners and decision-makers can use the comprehensive information provided in this study to identify the optimal sites for the installation of joint wind–wave power plants. The following research questions summarizing the most critical aspects of the selection of suitable locations for the COWWEF are addressed in this paper:
  • Where are the studied regions?
  • Which types of met-ocean datasets were employed (i.e., observational or modeled, resolution, and duration)?
  • What exclusion criteria restrict the selection process?
  • What evaluation criteria influence the determination of hotspots?
  • Which methodologies were used for site selection?
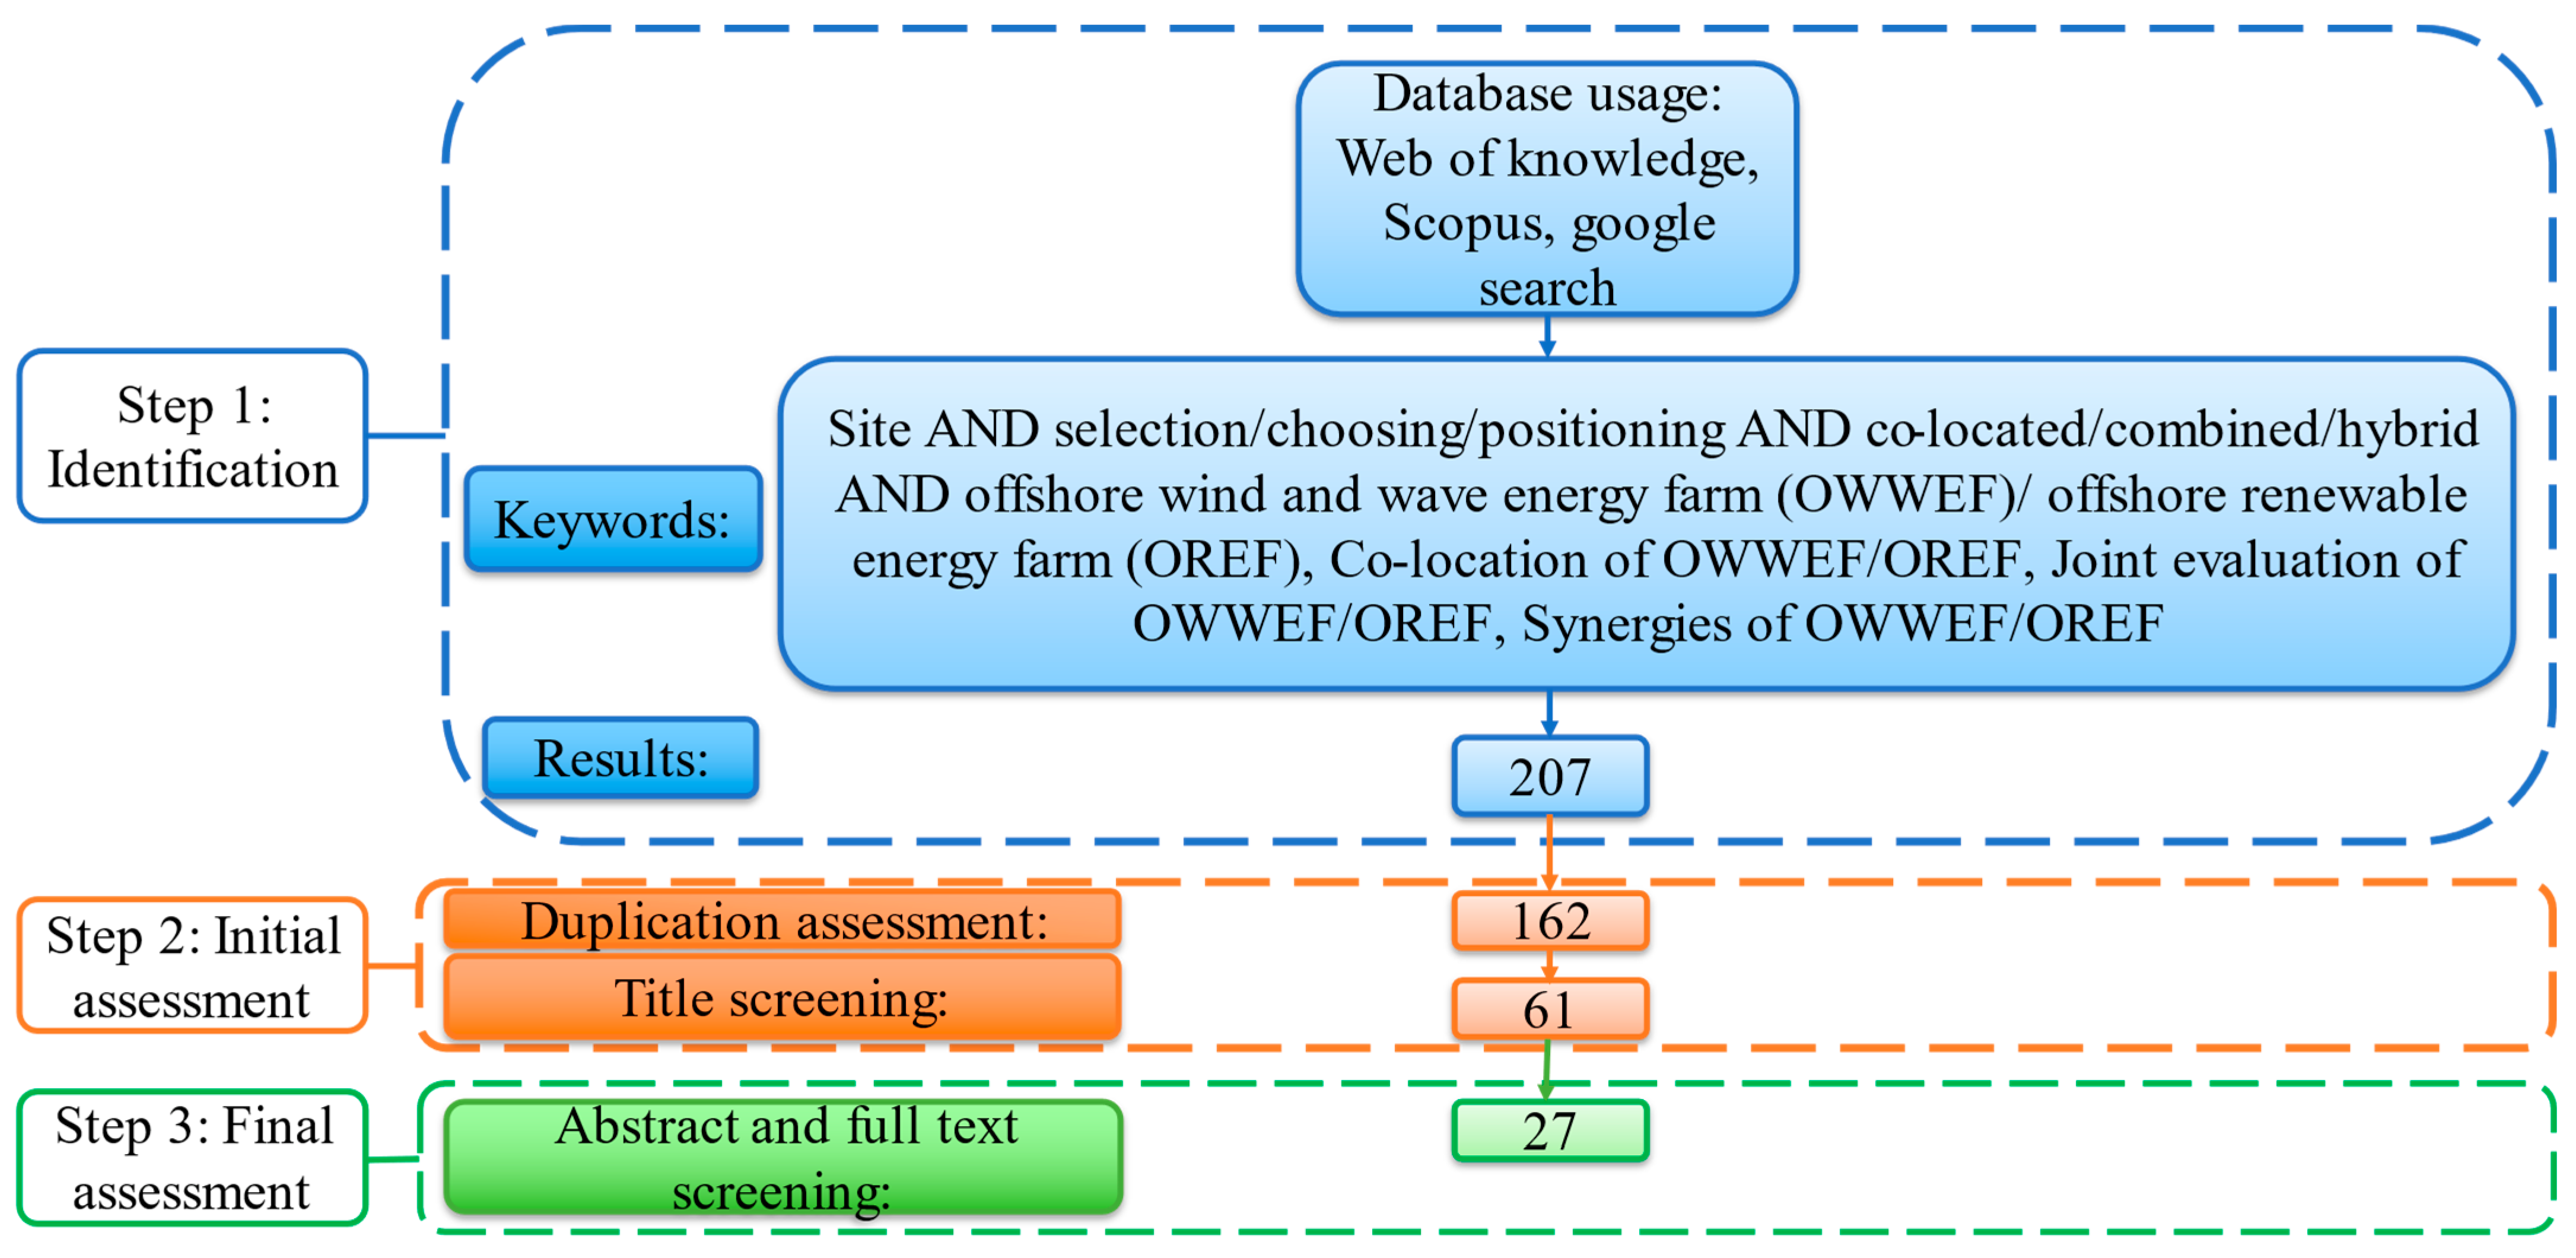
2. Methods

In order to answer the questions outlined in the previous section, this study was conducted according to the guidelines of the Systematic Literature Review (SLR). Systematic reviews seek objective and impartial responses to specific questions [34]. For this purpose, a systematic method defined as a priori in studies identification and selection, data extraction, and result analysis was employed. In the systematic review process, it is necessary to map the review’s objectives and the process of finding studies prior to proceeding with the systematic review [35]. A search strategy was therefore developed to systematically find articles following the guidelines used in the literature [31]. Figure 1 illustrates the main steps taken to obtain the results. As can be seen from the figure, this Systematic Literature Review (SLR) includes three steps: identifying relevant papers, excluding irrelevant and duplicated studies, and checking the publications’ eligibility and inclusions. The following subsections describe these steps.

2.1. Step 1: Identification

First, the identification of records was performed through the Web of Knowledge database, Scopus, and Google searches. Choosing the Web of Knowledge and Scopus search platforms was based on the wide range of high-quality journals available there, which raise the quality of the results obtained for this study. Google searches can also be helpful for finding relevant project reports. The keywords were selected based on the review purpose and the most common keywords used in the topic area. A series of pilot searches were conducted by trial and error to refine the keywords used in the search string. Terms that did not contribute any additional results to the automatic search were removed. Based on the search results, the existing publications were found from 2009 to 2022.

2.2. Step 2: Exclusion of Irrelevant and Duplicated Studies (Initial Assessment)

According to the obtained results from the first step, 207 publications were found. As the first stage of the initial assessment, removing duplicate studies using the Mendeley reference manager resulted in 162 documents. The remaining publications were reviewed through a practical screening method, including establishing exclusion and inclusion criteria. For separating the publications that contributed information and answered the research questions considered in this study from those that did not, the exclusion criteria were applied. Therefore, the title of each paper was checked considering the following exclusion criteria: Is the publication about offshore renewable energy (wind and wave)? Is the site selection issue or resource assessment discussed? If not, the publication was excluded. This process yielded 61 publications, as most did not properly fit the keyword-assigned theme.

2.3. Step 3: Checking the Eligibility of Publications (Final Assessment)

The final assessment was conducted to verify the eligibility of the remaining publications. This phase was conducted based on reading the abstract and screening the full text of the articles to find answers to the research questions. The inclusion criteria were as follows: Does the publication discuss COWWEF site selection? Have the factors for site selection been mentioned? Does the publication include a methodology for the optimal positioning of COWWEF? Eventually, 27 relevant publications were found and considered for review in this paper.
The final selected studies were analyzed to answer the research questions, and a spreadsheet was created to categorize studies in terms of study regions, met-ocean data specifications, EX and EV criteria, and methodologies.

3. Results and Discussion

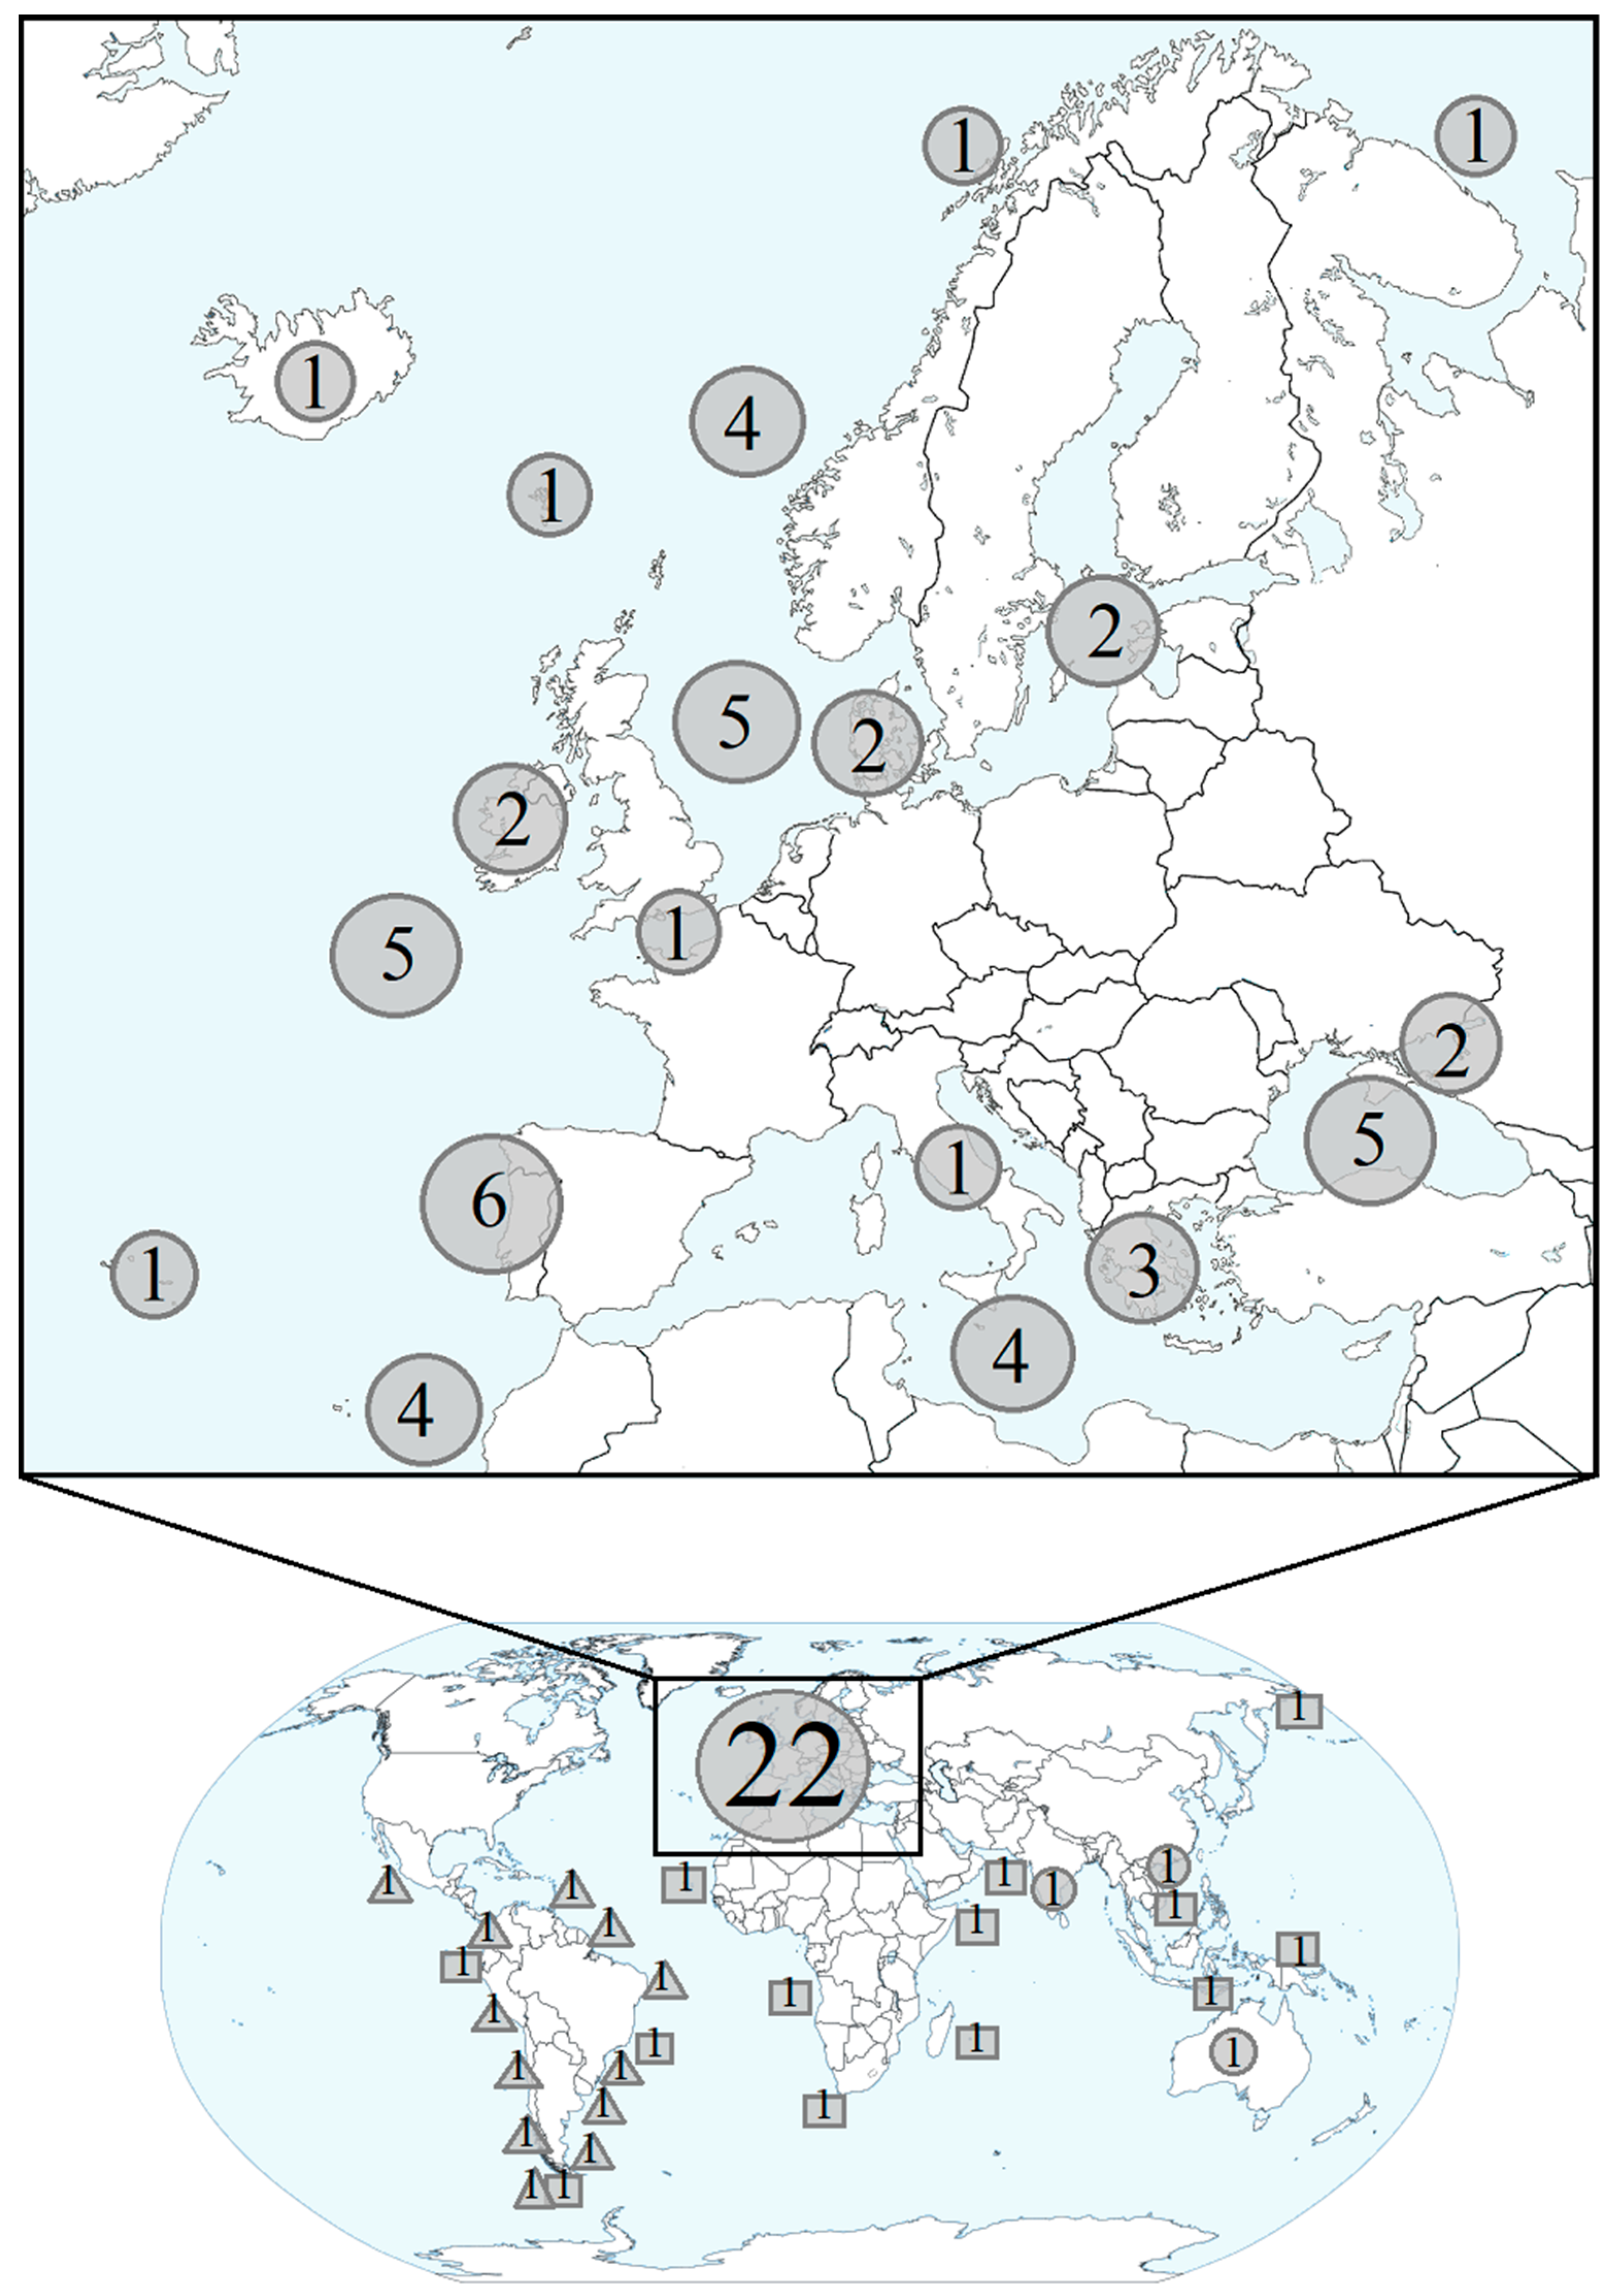
3.1. The Studied Regions

Figure 2 illustrates the geographic locations of selected papers for positioning COWWEFs. European offshore areas were assessed for site selection purposes in most of the studies (22), while a few studies included other continents [36,37,38,39,40,41]. This is because of the European Union’s long-term strategies to increase energy security [42]. In addition, aesthetic concerns and a lack of available shallow-water locations in European areas have driven the need to deploy offshore WTs. These areas are known for stronger and more consistent prevailing winds [43]. Certain technical obstacles in the wave energy industry must be eliminated to achieve energy efficiency, cost-effectiveness, safety, and durability [42]. The aforementioned reasons led to trends in developing COWWEFs, to simultaneously exploit energy resources. This can reduce the associated cost by enhancing the energy yield, producing reliable energy, and using shared grid infrastructures [33].

3.2. Used Met-Ocean Dataset for Site Selection

Buoy and satellite data are sparse and only available for a limited number of periods [44]. A significant advantage of satellite measurements is coverage of large areas, whereas buoys are only capable of sampling in a single location. On the other hand, buoys can take measurements constantly with a high temporal resolution. In contrast, many ocean-sensing instruments placed on polar-orbiting satellites cannot continuously monitor the same location [45]. In order to provide data in the absence of these long-term observations with high temporal and spatial resolution, numerical models have mainly (93%) been used in the literature. Table 1 displays the details of the used dataset (mainly ECWMF) in the literature. The temporal resolutions of data vary among 1, 3, and 6 h and daily time scales. However, they mostly have hourly resolutions. The spatial resolution used in existing studies varies from 17 m to 83.25 km.

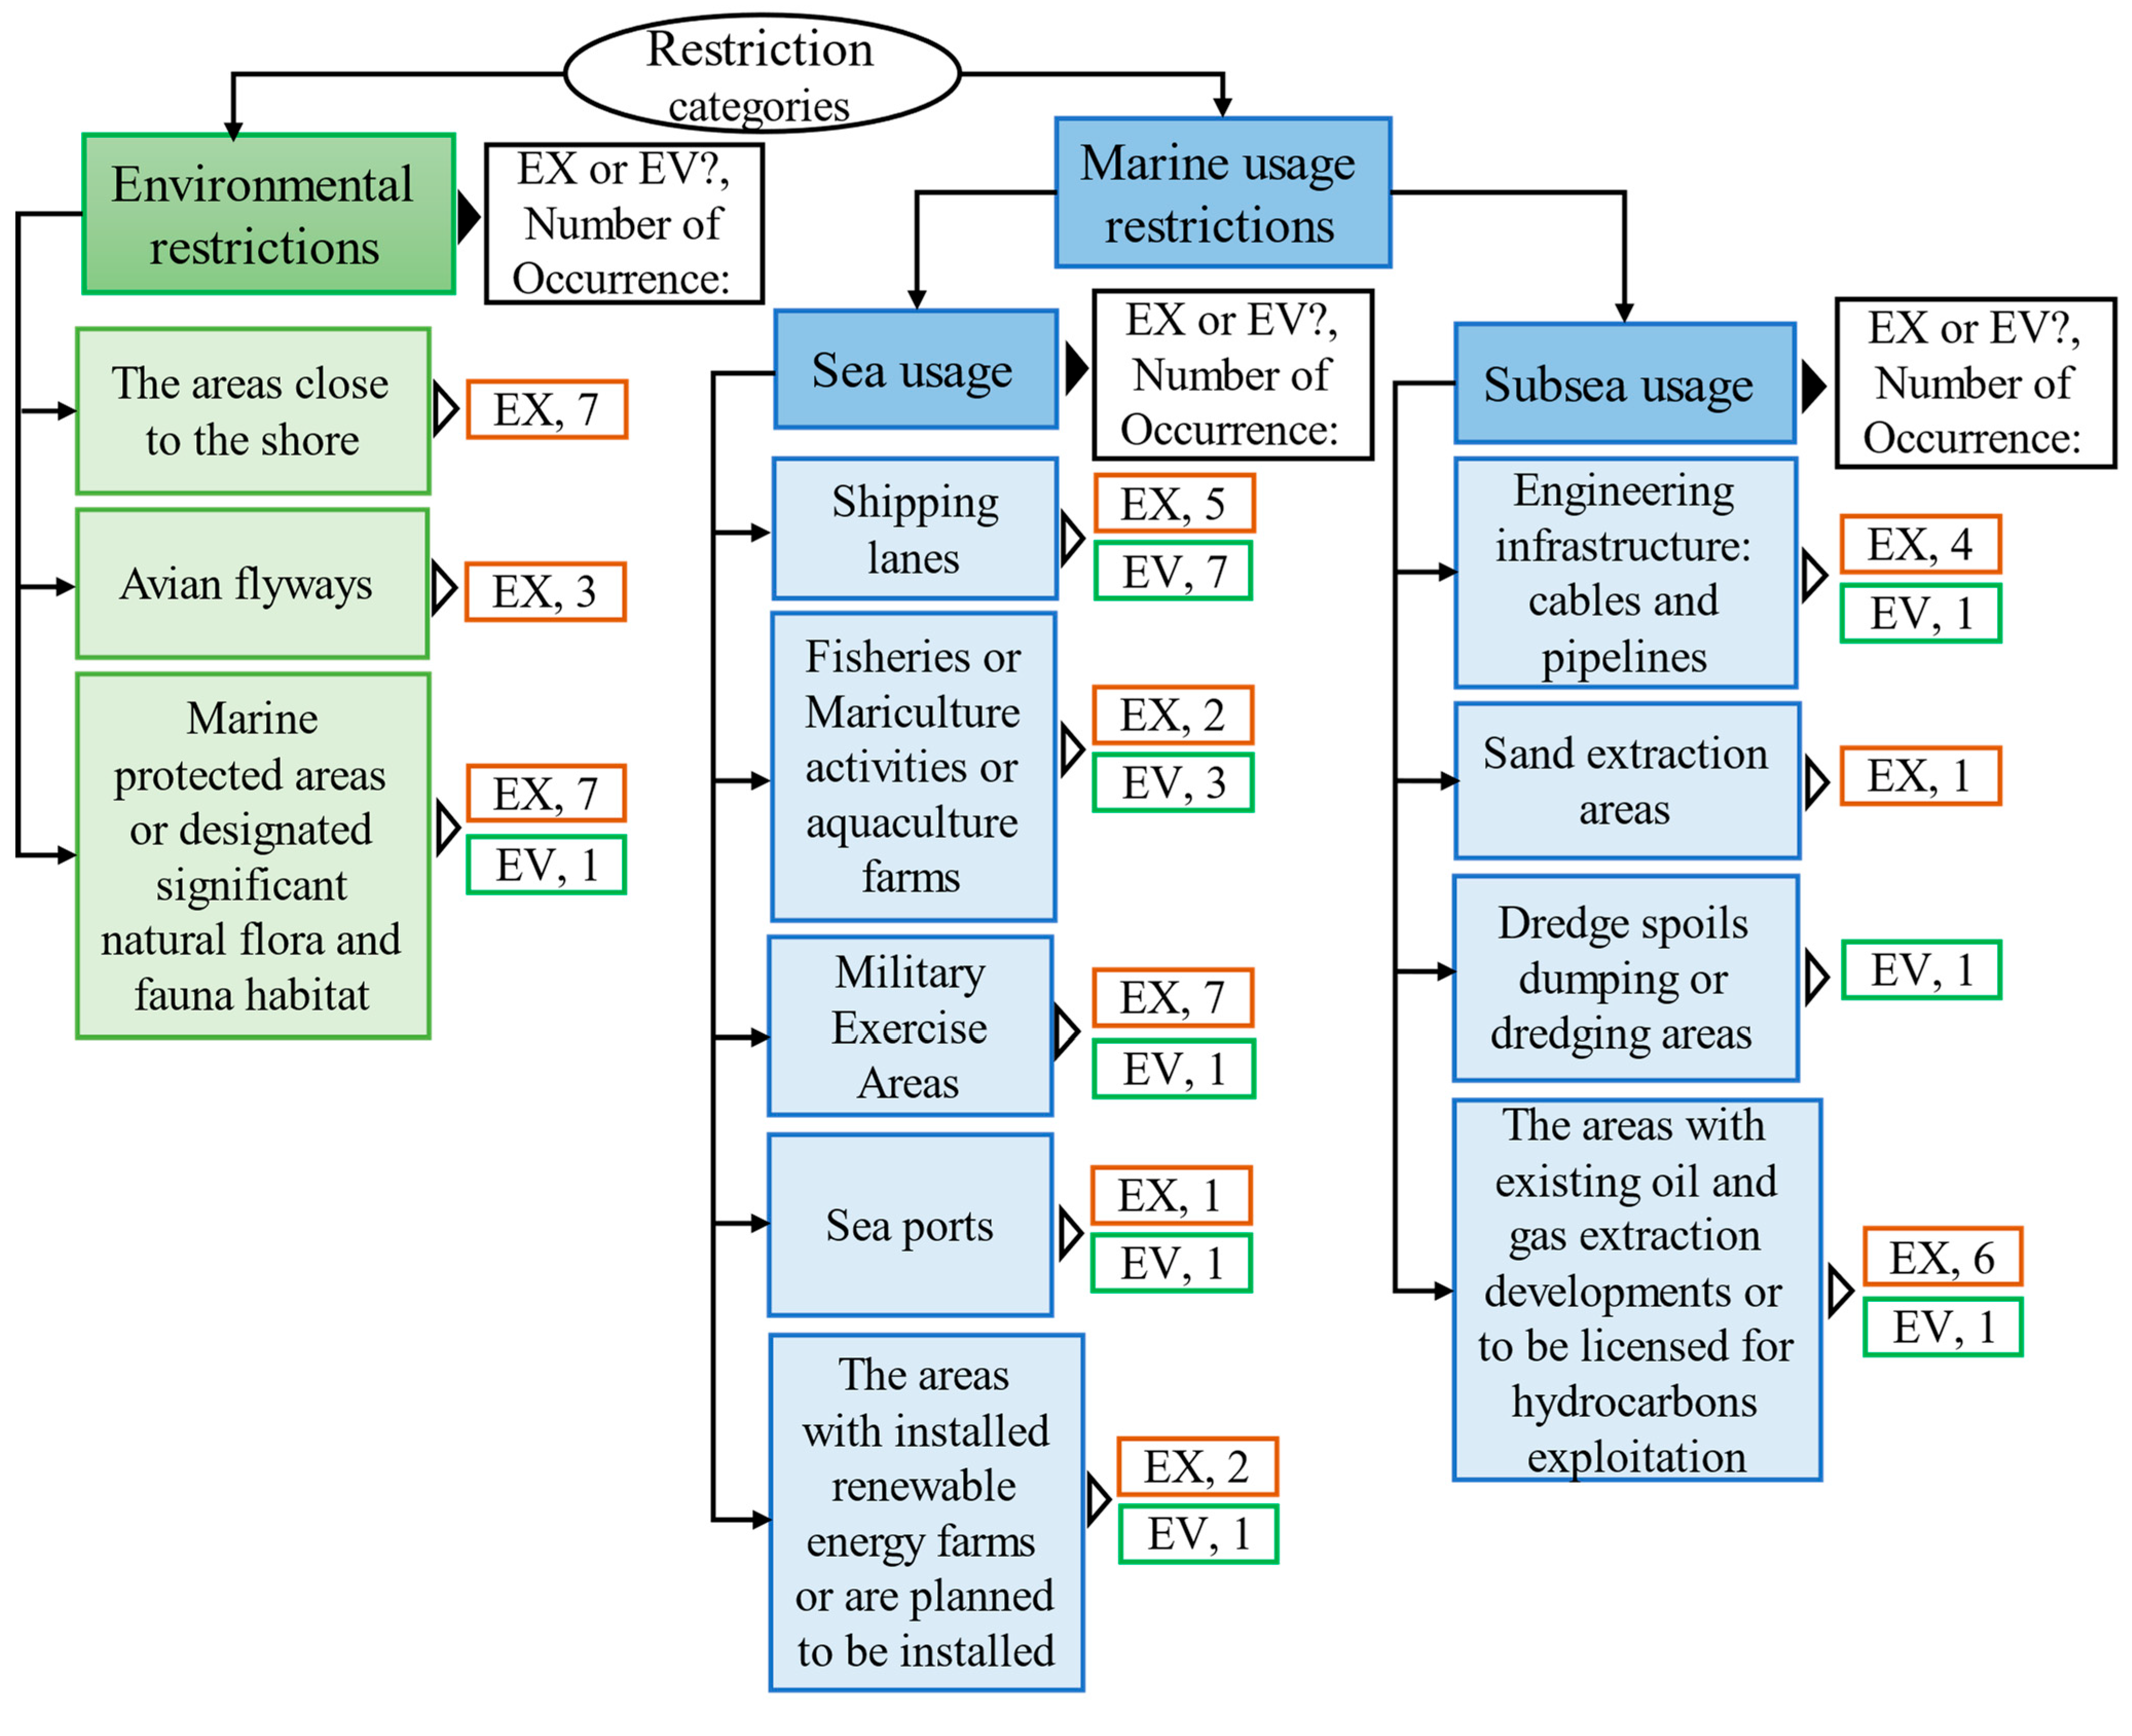
3.3. Restricted Areas for Site Selection

Some restrictions prevent farms from operating in the desired location. These may exclude or reduce the suitability of certain areas. Considering these restrictions could therefore result in a competition for space between new development and current users [51]. Investigation of existing studies revealed 12 restricted areas for offshore renewable energy developments in two categories: environmental and marine (i.e., sea and subsea) usage restrictions. The restricted areas were excluded in most studies. However, in a few studies, some areas were evaluated and assigned a low score in the site selection process (e.g., [46,51,57]). The two types of considerations are Exclusion (EX) and Evaluation (EV). Figure 3 outlines all restrictions in the existing studies, the consideration type in the literature (i.e., EX or EV), and their frequency of occurrence. The criteria values mentioned in the literature (e.g., minimum distance to the shore and shipping density) were noted in the text. Future studies could use these values to select the COWWEF location. However, planners should ensure that the laws of each country are followed to avoid potential disputes.
Figure 3 shows that the main restriction is related to the usage of the sea and subsea. Among the 12 listed restricted areas, the most cited ones are the shipping lanes, military exercise areas, marine protected areas, and areas close to the shore (due to visual and noise impact). In some studies, all shipping routes have been excluded from the analysis (e.g., [20,39,47]). However, in most studies (e.g., [42,46,54,56,62]), Shipping Density (SD) was used as an EV criterion. Defined as the number of ship tracks in a 1 km2 cell in [19], the SD was used as both EX and EV by [19,40]. In this way, high-traffic areas (e.g., SD > 25 and >75 [19] and >20 [40]) were excluded, and the shipping density in other areas was scored. In addition, giving the lowest weight to the SD by [62] allows the negotiability of shared use of an area.
Aquaculture farms and fisheries should also be considered. Using heavy towed fishing gear may damage transmit cables. Additionally, snagging fishing gear on cables could cause a ship to capsize or sink. Fishing vessels equipped with appropriate fishing gear may be allowed into COWWEFs if local fishers and offshore renewable energy operators reach an agreement [63]. In [50], the authors evaluated overlapping areas with fisheries and prioritized the region with a lower load of fisheries (see also [46,56]). Unlike the aforementioned studies, in which the lower load of fisheries was allowed to exist along with COWWEF, the coexistence of aquaculture farms with COWWEFs was considered unfeasible in [40]. In [62], the authors stated that fishing ports could be used for the operation and maintenance servicing of renewable energy devices but may not have a suitable draft for installation vessels. Areas with military exercise activities are also deemed unsuitable [42]. Most studies excluded these areas [40,42]. However, a low priority to these zones was assigned by [56] rather than excluding them. Sea ports were also excluded to avoid navigation interference [40]. The main port was given a low score due to the consideration of other marine users [56]. Furthermore, the areas planned to be installed or with installed renewable energy farms as existing sea usage were excluded in [42,54]. In contrast, these areas were given a low score by [56]. The construction of a power plant cannot be considered in the vicinity of existing subsea infrastructures such as cables and pipelines. Safety distances of 500 [50] and 920 m [39] were regarded as an exclusion zone. In [40], the cables and natural gas pipelines were excluded from the feasible areas (see also [62]). However, the areas with the above features were somehow evaluated and given a low score by [56]. Dredging zones and areas allocated to sand, oil, and gas extractions should not be selected, as they are already occupied. The need for access to the platforms should be considered when planning offshore renewable energy projects near oil and gas platforms [63]. The overlapping of these areas with the areas of high wind and wave energy resources was investigated by [50]. The sites to be licensed for the exploitation of hydrocarbons were considered ineligible for deploying COWWEFs in [42,54]. The oil and gas exploitation zones were removed from the eligible areas in some studies [39,40,62]. In addition, although dredging and oil and gas extraction regions were not excluded, a low preference was given to them by [56].
Mitigating the environmental impact of offshore renewable energy developments was also considered in the site selection. The areas close to the shore are considered environmentally restricted due to the visual and noise impact of offshore renewable energy farm developments. The literature thus proposed a minimum distance of 10 km [40,48], 15 km [19,39], 20 km [62], and 25 km [42,54] from shore. Bird corridors, marine protected areas, and natural flora and fauna habitats are highly sensitive. Some authors excluded avian flyways in the site selection process [20,47,50] due to the possibility of collisions of birds with WT blades. Marine-protected areas were eliminated from the eligible areas in most studies to protect the natural habitat [19,39,40,42,50,54,62]. In order to ensure safety, a 1 km buffer zone around marine protected areas was considered by [19]. In [56], natural marine habitats were given a low preference for renewable developments.
As can be seen from Figure 3, there is a consensus among most of the studies to completely exclude the abovementioned restricted areas other than shipping lanes, aquaculture farms, and dredging areas from eligible locations for COWWEF deployment. Considering the coexistence of lower loads of fisheries and shipping lanes with the energy farms can be related to the different policies of countries or the specific condition of the area which dictates this consideration. In terms of dredging areas and some others (areas with cables and pipes, oil, and gas extraction platforms, installed devices, and marine protected areas), a low score was assigned by [56]. However, this quantification does not guarantee excluding those areas from the final proposed suitable locations. While the mentioned areas are required to exclude, there is no way to coexist with the areas planned for renewable energy farm development. Therefore, this is a disadvantage of the applied method in [56] for quantifying restricted areas.

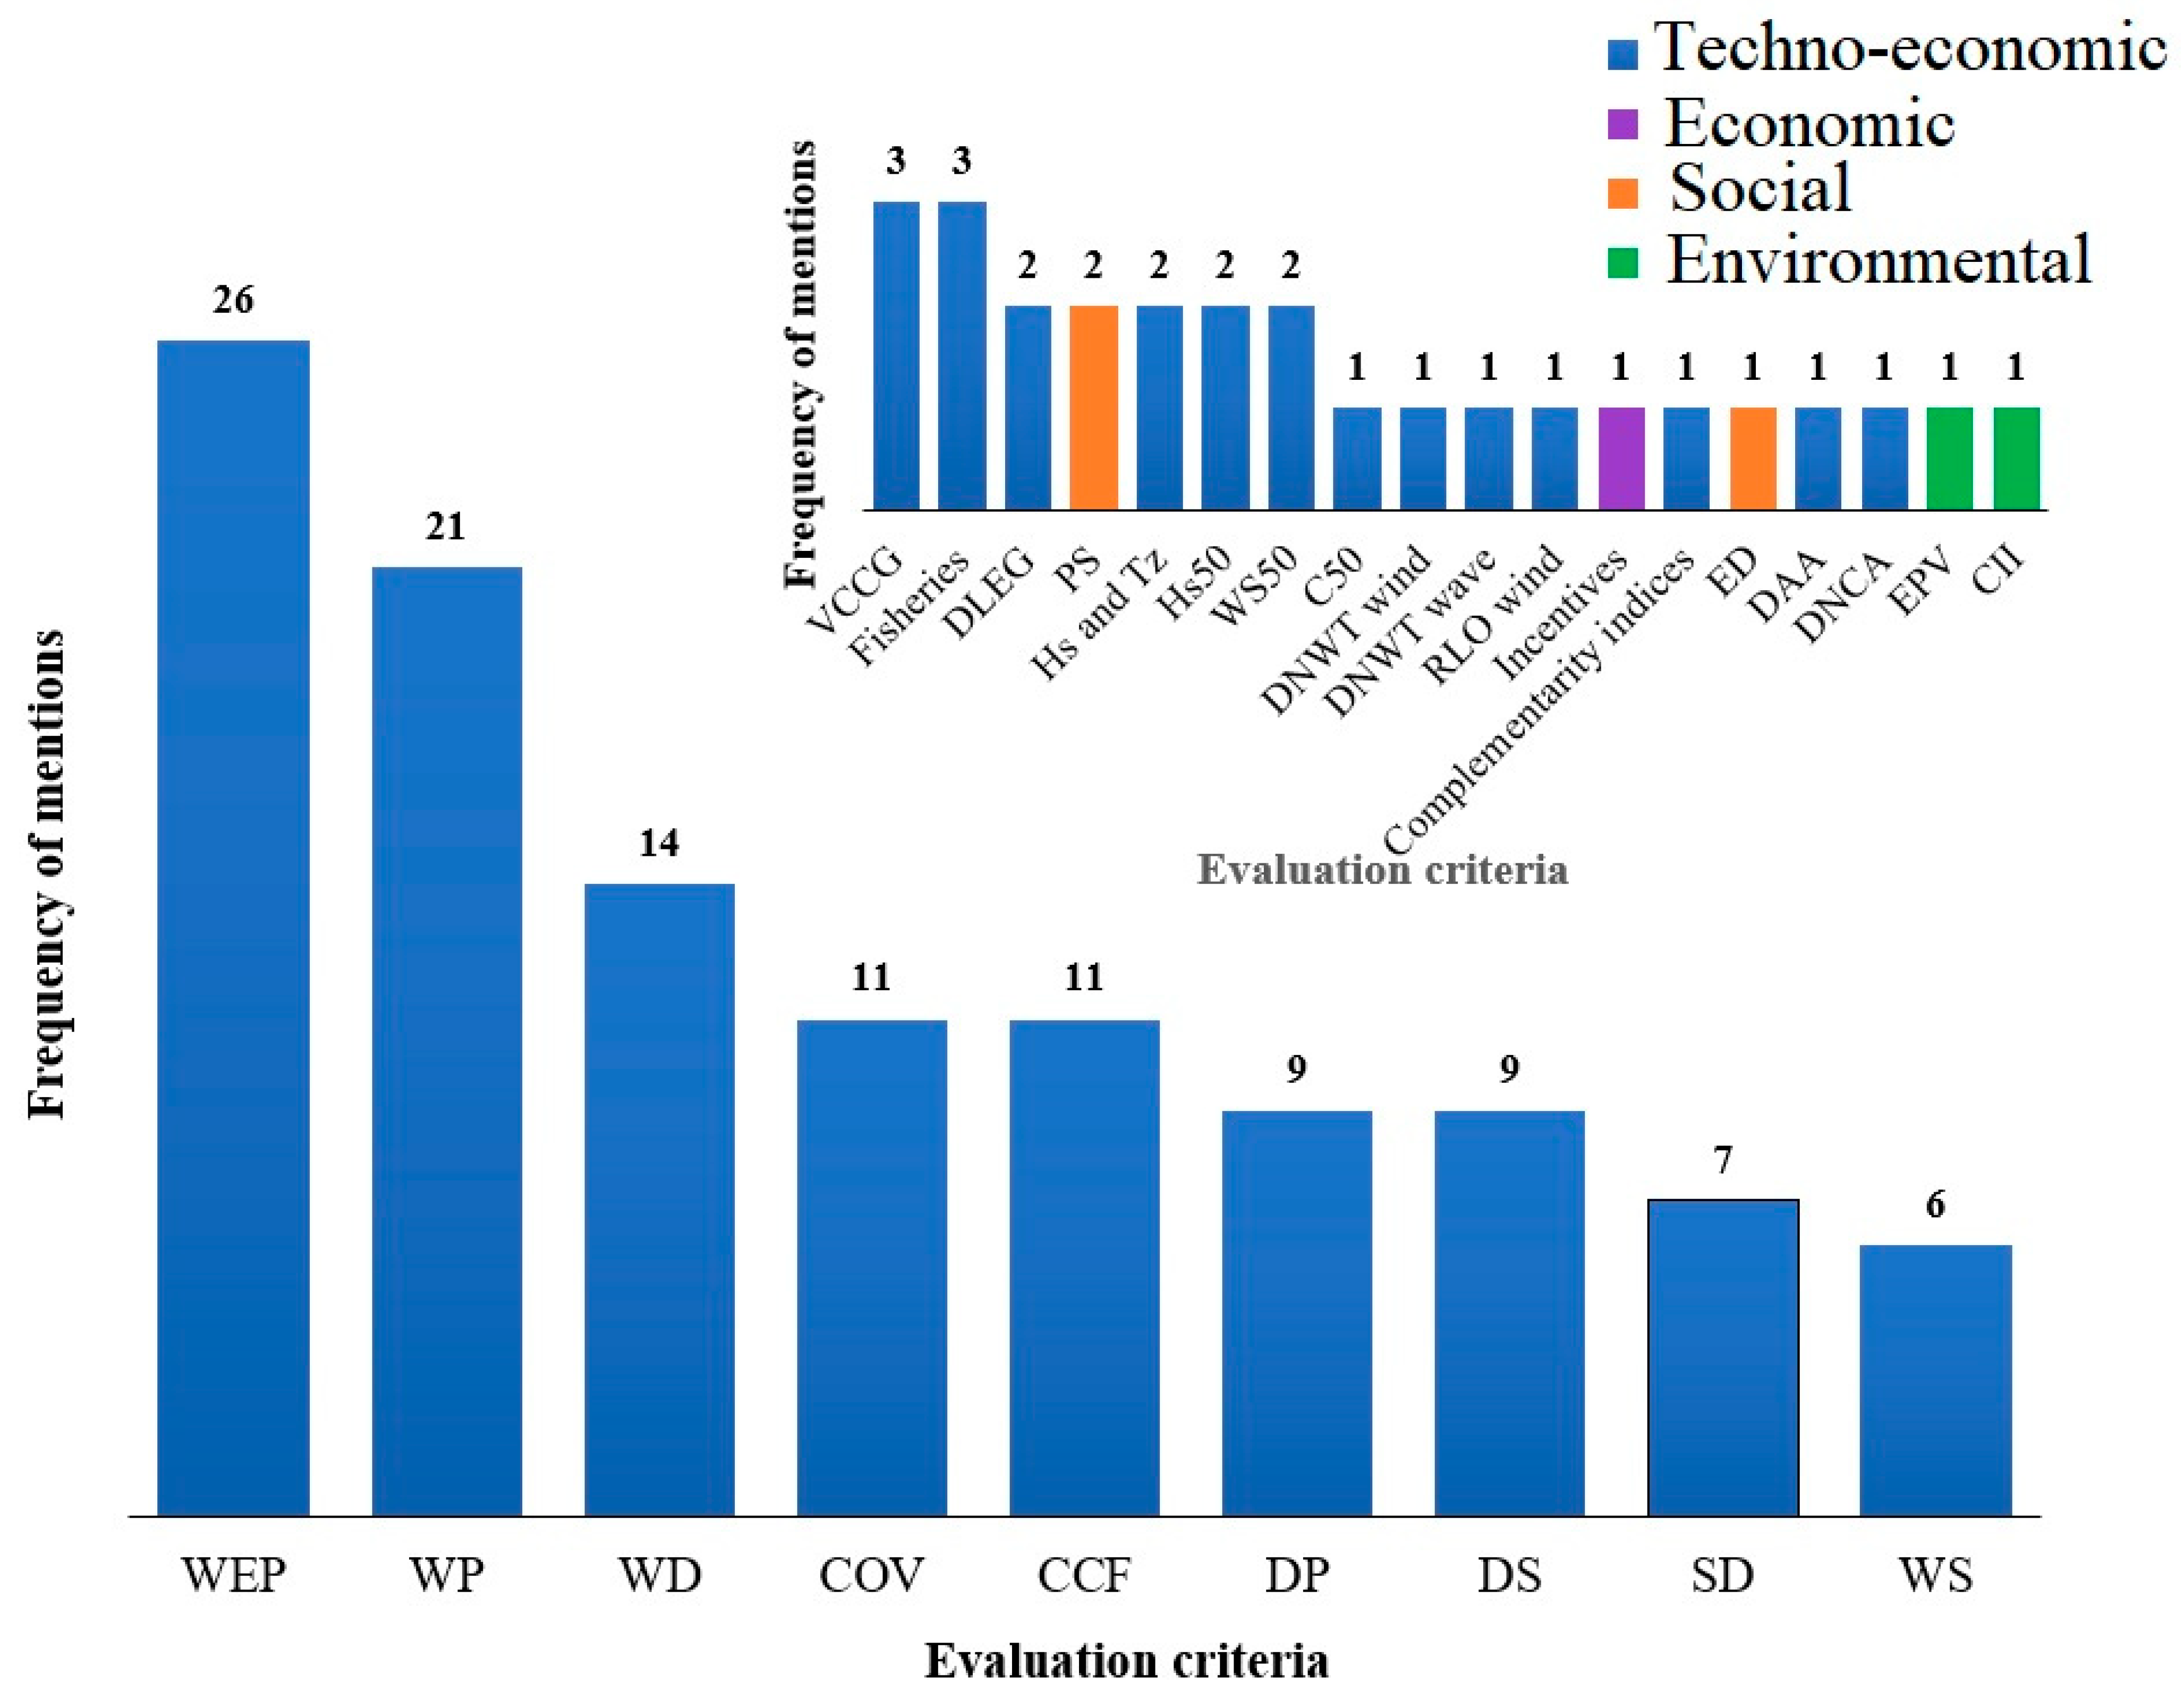
3.4. Criteria for Evaluation in the Site Selection Procedure

In addition to the restrictions mentioned above, considering different perspectives of COWWEF site selection, including technical, economic, social, and environmental, using the relevant criteria, this study investigates the technical viability, economic feasibility, social acceptability, and environmental safety of the project deployment. Table 2 summarizes the criteria and their frequency of occurrence to evaluate the preferred siting of COWWEFs. More details, including the formula used for calculating some criteria and the acceptable range of criteria values, can be found in the Appendix A (Table A1). As can be seen from Table 2, the main objectives of consideration of the used criteria are: techno-economic analysis including (1) assessing the wind and wave climate data in terms of resources richness, variability, and complementarity, (2) considering the structural (device survivability) and technical (foundation/anchoring design of devices, installation, operation, and maintenance) feasibility of developments, (3) checking the accessibility of energy devices as an indicator of transmission cost and energy dissipation; economic analysis of feed-in tariff; socio-economic analysis with evaluation of the possibility of supplying energy demand; environmental analysis including (1) assessing the environmental impact of COWWEFs, and (2) examining the impact of human activities and environmental vulnerabilities in the site selection process. Therefore, the economic aspect of the project development is evaluated indirectly using three categories of criteria: techno-economic, economic, and socio-economic. However, the direct economic analysis is performed using the calculation of the Levelized Cost of Energy (LCOE), which is beyond the scope of this paper. In addition, based on Table A1 in the Appendix, the lower and upper limits of the acceptable range for each criterion vary in different studies due to each studied region’s local regulations, policy, and the considered energy-generation devices. For example, in [19], the areas with wind speed less than the minimum operational values of hypothetical devices (i.e., 6–7 m/s) were eliminated from the analysis (see also [42,54,62]). In terms of wave power density, a minimum value of 30 and 20 kw/m for the wave and wind dominated combined devices, respectively, was set by [19]. For other criteria, including water depth, distance from shore, port, local electrical grid, aquaculture, and nature conservation area, the locations with values out of the acceptable range were considered ineligible (see Table A1). The details of the used criteria in different categories of Table 2 and Table A1, considering different aspects of COWWEF development, are discussed in the below subsections.

3.4.1. Techno-Economic Criteria

The most crucial aspect of site selection of renewable energy farms is the assessment of energy resource richness or availability. As shown in Table 2 and Table A1, wind speed, wave height, and period are the main indicators used to calculate wind and wave energy power. As can be seen from the tables, wind and wave power are calculated in most studies to evaluate the energy resource’s potential, while a few researchers directly used wind speed and wave parameters for the assessment of resource richness (e.g., [19,42,54,59,62]).
In [41], wave parameters and wind and wave energy power were used to assess the availability of energy resources. In this way, the percentage of time in which WP and Hs are in the acceptable ranges (WP ≥ 400 and Hs ≤ 5) was used to calculate the wind energy potential suitability index (SI Wind R). In the case of wave energy resource evaluation, a suitability index (SI Wave R) was defined based on the weighted average of the percentage of time in which wave energy power (WEP), significant height (Hs), and peak wave period (Tp) were in the acceptable ranges (WEP ≥ 15, 1 ≤ Hs ≤ 6, and 5 ≤ Tp ≤ 14).
The DNWT index was used by [59] to investigate the availability of energy resources considering the operational range of WTs and WECs. The typical cut-in and cut-off thresholds for WS are 4 and 25 ms−1, respectively [59,64,65]. In [66], the upper and lower limits of 8 and 1 m for Hs were used, respectively, representing the power outage level due to extreme wave conditions and calm periods. In addition, the rich level occurrence (RLO) index was used by [59] to measure the frequency of wind power density higher than 200 Wm−2. In [38], the mean capacity factor of different percentages of combined hypothetical WT and WEC (CF comb) was considered as an EV criterion to represent the efficiency of offshore renewable energy exploitation. In addition, the non-production time or Downtime (DT) of mixed offshore wind and wave energy farms (in which the energy devices are not operating) was considered to reflect the zero-power production amount [38].
Variability in wave and wind conditions plays a significant role in determining a location because peak-to-average ratios are a key cost factor [50]. The energy extraction devices are run in a specific range of wind and wave power so that their fluctuations and frequent on/off lower their efficiency leading to higher electricity costs [17]. Several statistical indicators were used to analyze the variability of energy resources: Standard Deviation (SD), Coefficient of Variation (COV), Total Harmonic Distortion (THD), Kurtosis (K) and Skewness (S), Monthly Variation (MV), and Seasonal Variation (SV) (see Table 2). The COV (i.e., the ratio of standard deviation to mean value) is the most cited index (37%) used in the literature. The THD with the same meaning has also been used to check the variability of offshore wind and wave energy resources separately and of mixed offshore wind and wave energy resources [36,37,51]. The THD for the hybrid offshore wind and wave energy farm is defined as the summation of wind and wave power’s SDs divided by the summation of mean values of wind and wave. In addition, the COV index was obtained based on power production in the case of different percentages of using specific WT and WEC combinations by [38]. S and K are the other indicators used [39,52,53,55] to assess the variability of energy resources. S and K show how symmetric and heavy-tailed the data distribution is compared to a normal distribution. The variability of energy resources in the monthly and seasonal scales has also been evaluated in some existing studies using indices MV and SV (see Table 2). These indices show the differences between the normalized most energetic and least energetic months (or seasons).
Another aspect of resource assessment performed for the COWWEF site selection is checking their complementarity. This assessment was conducted by calculating the cross-correlation function (CCF) index between wind and wave power and the event-based approach (see Table 2). Using the CCF index, the correspondence of wind and wave energy resources at time lag t is measured. To avoid interruptions in power generation and to have uniform power output in COWWEF, the CCF at time = 0 (C (0)) and the lag time corresponding to the maximum value of CCF (C max) were used. The lower C (0) and longer lag time were introduced as the best-case scenario (e.g., [38]). Based on the event-based approach, various availability scenarios of wave and wind energy resources were considered by [61] to define four indices (i.e., ECV, VCW, SWV, and UWV). The WCV index was estimated as the frequency of occurrence of the mean annual wind power density above the corresponding lower threshold and the mean annual wave power density below the corresponding lower threshold. The frequency of occurrence of the mean annual wave power density above the corresponding lower threshold and the mean annual wind power density below the corresponding lower threshold was called VCW. The wind and wave power synergy index (SWV) was defined as the frequency of occurrence of the mean annual wave power above the corresponding threshold or the mean annual wind power below the corresponding threshold. The wind and wave power joint non-availability index (UWV) indicates the frequency of occurrence of both mean annual wind and wave power below their corresponding thresholds. The UWV index can be helpful for the exclusion of areas with lower availability of both energy resources, while the others, especially the SWV, reflect the degree of complementarity of wind and wave energy resources.
To check the survivability of energy devices, the 50-year return period of wind speed (WS50), significant wave height (Hs50), current velocity (C50), and water depth (WD) were assessed in the literature [41,59]. Accordingly, the WS50, Hs50, C50, and WD thresholds were used to ensure the WT’s structural survivability, while three indices of Hs50, C50, and WD were considered to assess the safety of WECs (see Table 2). In addition, WS50 and Hs50 were considered as EV criteria for site selection of wind and wave energy farms, respectively.
Water Depth (WD) is the main physical parameter impacting the site’s suitability. A minimum depth is required based on the structural design of the considered energy-generation device (e.g., draft size) [19]. The (fixed or floating) foundation design [46]; difficulties in cabling layout in deeper water > 100 m [19]; effective design of mooring lines and anchors for floating systems; cost-related issues; and viability of WECs under extreme environmental conditions limit the depth of installation [42]. A relatively limited depth range (e.g., up to 60 m) is adequate for installing fixed-bottom hybrid offshore renewable energy systems [42]. The use of other foundations (e.g., floating systems) has been tested for deeper waters, but there is still a need to refine and develop these designs [50]. As shown in Table 2, the eligible WD range for implementing hybrid offshore wind and wave energy farms is approximately 25–500 m.
Ports provide the infrastructure that enables offshore renewable energy to be installed. The ideal locations are consequently those with the shortest distances to ports due to lower installation, operation, and maintenance costs [40]. Port drafts should be between 10 and 15 m to install offshore renewable energy farms [62]. Constraints for the maximum value of the Distance from Port vary between 50 and 500 m [19,41,42,54]. In some references, only qualitative analysis regarding selecting the feasible areas close to the ports was considered [20,40,47,50]. To check the site accessibility in terms of weather conditions along with DP, two indicators representative of sea state (i.e., WS and Hs) were considered [41].
In some cases, in addition to the visual and noise impact of offshore wind and wave energy farms, looking for an appropriate amount of energy resources leads to moving further from the shore. Nonetheless, the installation and maintenance costs limit the maximum distance from the shore [40]. The evaluated maximum distance range from the shore in the literature varies between 30 and 444 km (see Table 2). In addition, in some studies, the area close to the shore was selected without mentioning the maximum distance from the shore [20,47,50].
A suitable marine area’s score is boosted by its proximity to an electrical grid, as this would eliminate long-distance transmission losses and reduce cabling costs [40]. The maximum distance to the electrical grid is 70 km [40] and 500 km [41]. In some studies, proximity to the high voltage capacity of grid connections was assessed. Based on the available capacity of the local grid, four grid capacities in decreasing preference have thus been defined: 220–400 kV, 220 kV, 150 kV, and 66 kV [42,54]. In addition, the total range of the high capacity of grids in Europe was considered to be between 220 and 500 kV [62].

3.4.2. Economic Criteria

The impact of various feed-in tariffs was assessed by [62] as one of the funding incentives available for offshore wind and wave energy developments. This criterion could be helpful for the study region surrounded by different countries that each offer different prices for a unit of electricity produced.

3.4.3. Socio-Economic Criteria

Meeting the energy demand by installing a hybrid offshore wind–wave renewable energy extraction project is crucial for the project’s economic viability and social acceptance. This could be more vital in remote areas such as islands to check the project’s potential to cover the region’s energy requirements. In [42], the Population Served (PS) criterion was used to serve a municipality’s population. It was assumed that if one or more of a municipality’s ports were located within a distance less than 100 km from the centroid of an eligible marine area, the prefecture’s population could be served. In addition, the average annual electricity consumption was directly considered by [40] as an evaluation criterion.

3.4.4. Environmental Criteria

The lower the environmental impact, the more suitable the location for offshore renewable energy farm developments. In addition to the aforementioned environmentally restricted area for exclusion, other EV criteria have been proposed to reduce the negative environmental impact of COWWEF installations [40,54]. In [54], the environmental performance value (EPV; [67]) was used to explicitly quantify the environmental impacts of COWWEFs. In particular, EPV was calculated by implementing four steps: (i) identifying key environmental components; (ii) assigning a weight of importance to each of the environmental components for two time periods (i.e., existing and future); (iii) assessing the impact significance of the project (i.e., nature of impact including positive or negative, magnitude, permanence, reversibility, and manageability of impact) during different phases of its life cycle (i.e., construction, operation, and decommissioning); and (iv) calculating the EPV. Experts are involved in each step to calculate the EPV for each location. To consider the impact of the project on the abiotic, natural, and anthropogenic environment, 18 components were defined: climate, bioclimate, morphology, aesthetic features, geology, tectonics, soils, natural environment, land uses, built environment, historical and cultural environment, socio-economic environment, infrastructures, atmospheric environment, acoustic environment noise, vibrations, electromagnetic fields, surface waters and groundwater. The EPV criterion was calculated based on the considered value for component weights in Step 2 and defined scaling for assessing the impact significance of the project in Step 3 [54]. The calculated range of EPV is between -164 and 54, which represent extremely negative and extremely positive impacts, respectively. The EPV value thus shows the nature and magnitude of the impact of COWWEF on the aforementioned 19 environmental components, both in the present and future, during three phases of the project life cycle. One of the disadvantages of the EPV criterion is that it cannot be used for prioritizing a large number of locations in a wide study region, as the experts’ opinions are required to calculate the mentioned criterion for each location.
To consider the human activities in marine areas and natural habitat vulnerabilities, the Cumulative Impact Index CII was defined by [56], which is expressed as multiplying the Vulnerability Index (VI) by the Cumulative Pressure Index (CPI). These two variables (i.e., VI and CPI) were defined based on the presence or absence and the frequency of occurrences of human activities and vulnerability elements. A low value of the CII represents the site’s suitability.
The power-generation equipment would create low-frequency noise, which could negatively affect marine life [68]. Sufficient distance from the marine fauna and flora habitat should be considered to reduce the negative impact on the marine environment and protect nature and wildlife. Hence, distance from the aquaculture farms and nature conservation areas (e.g., natural parks and reserves) was considered by [40] as an EV criterion.

3.4.5. The Frequency of Occurrence of Determinant EV Criteria

All determinant EV criteria (including the criteria related to restrictions given in Figure 3, which have been used for evaluation, and the other relevant criteria mentioned in Table 2), their relevant category, and their frequency of occurrence in the existing studies are listed in Figure 4 to identify which aspect of project deployment has mostly been focused on and which aspect has not been paid attention to or what is the research gap in terms of criteria consideration. As seen from the figure, twenty-seven determinant EV criteria were used for the site selection. Studies were conducted in countries with varied climate and environmental conditions, local policies, and data availability. Hence, different criteria were used in different studies for site selection purposes. In addition, the techno-economic criteria representative of the energy resources, bathymetry, variability and correlation of energy resources, distance to port, shore, and shipping density are the most cited (>5 times) in the literature. In comparison, the evaluation of the environmental impacts of COWWEF has rarely been performed in the literature and is yet to be further investigated.

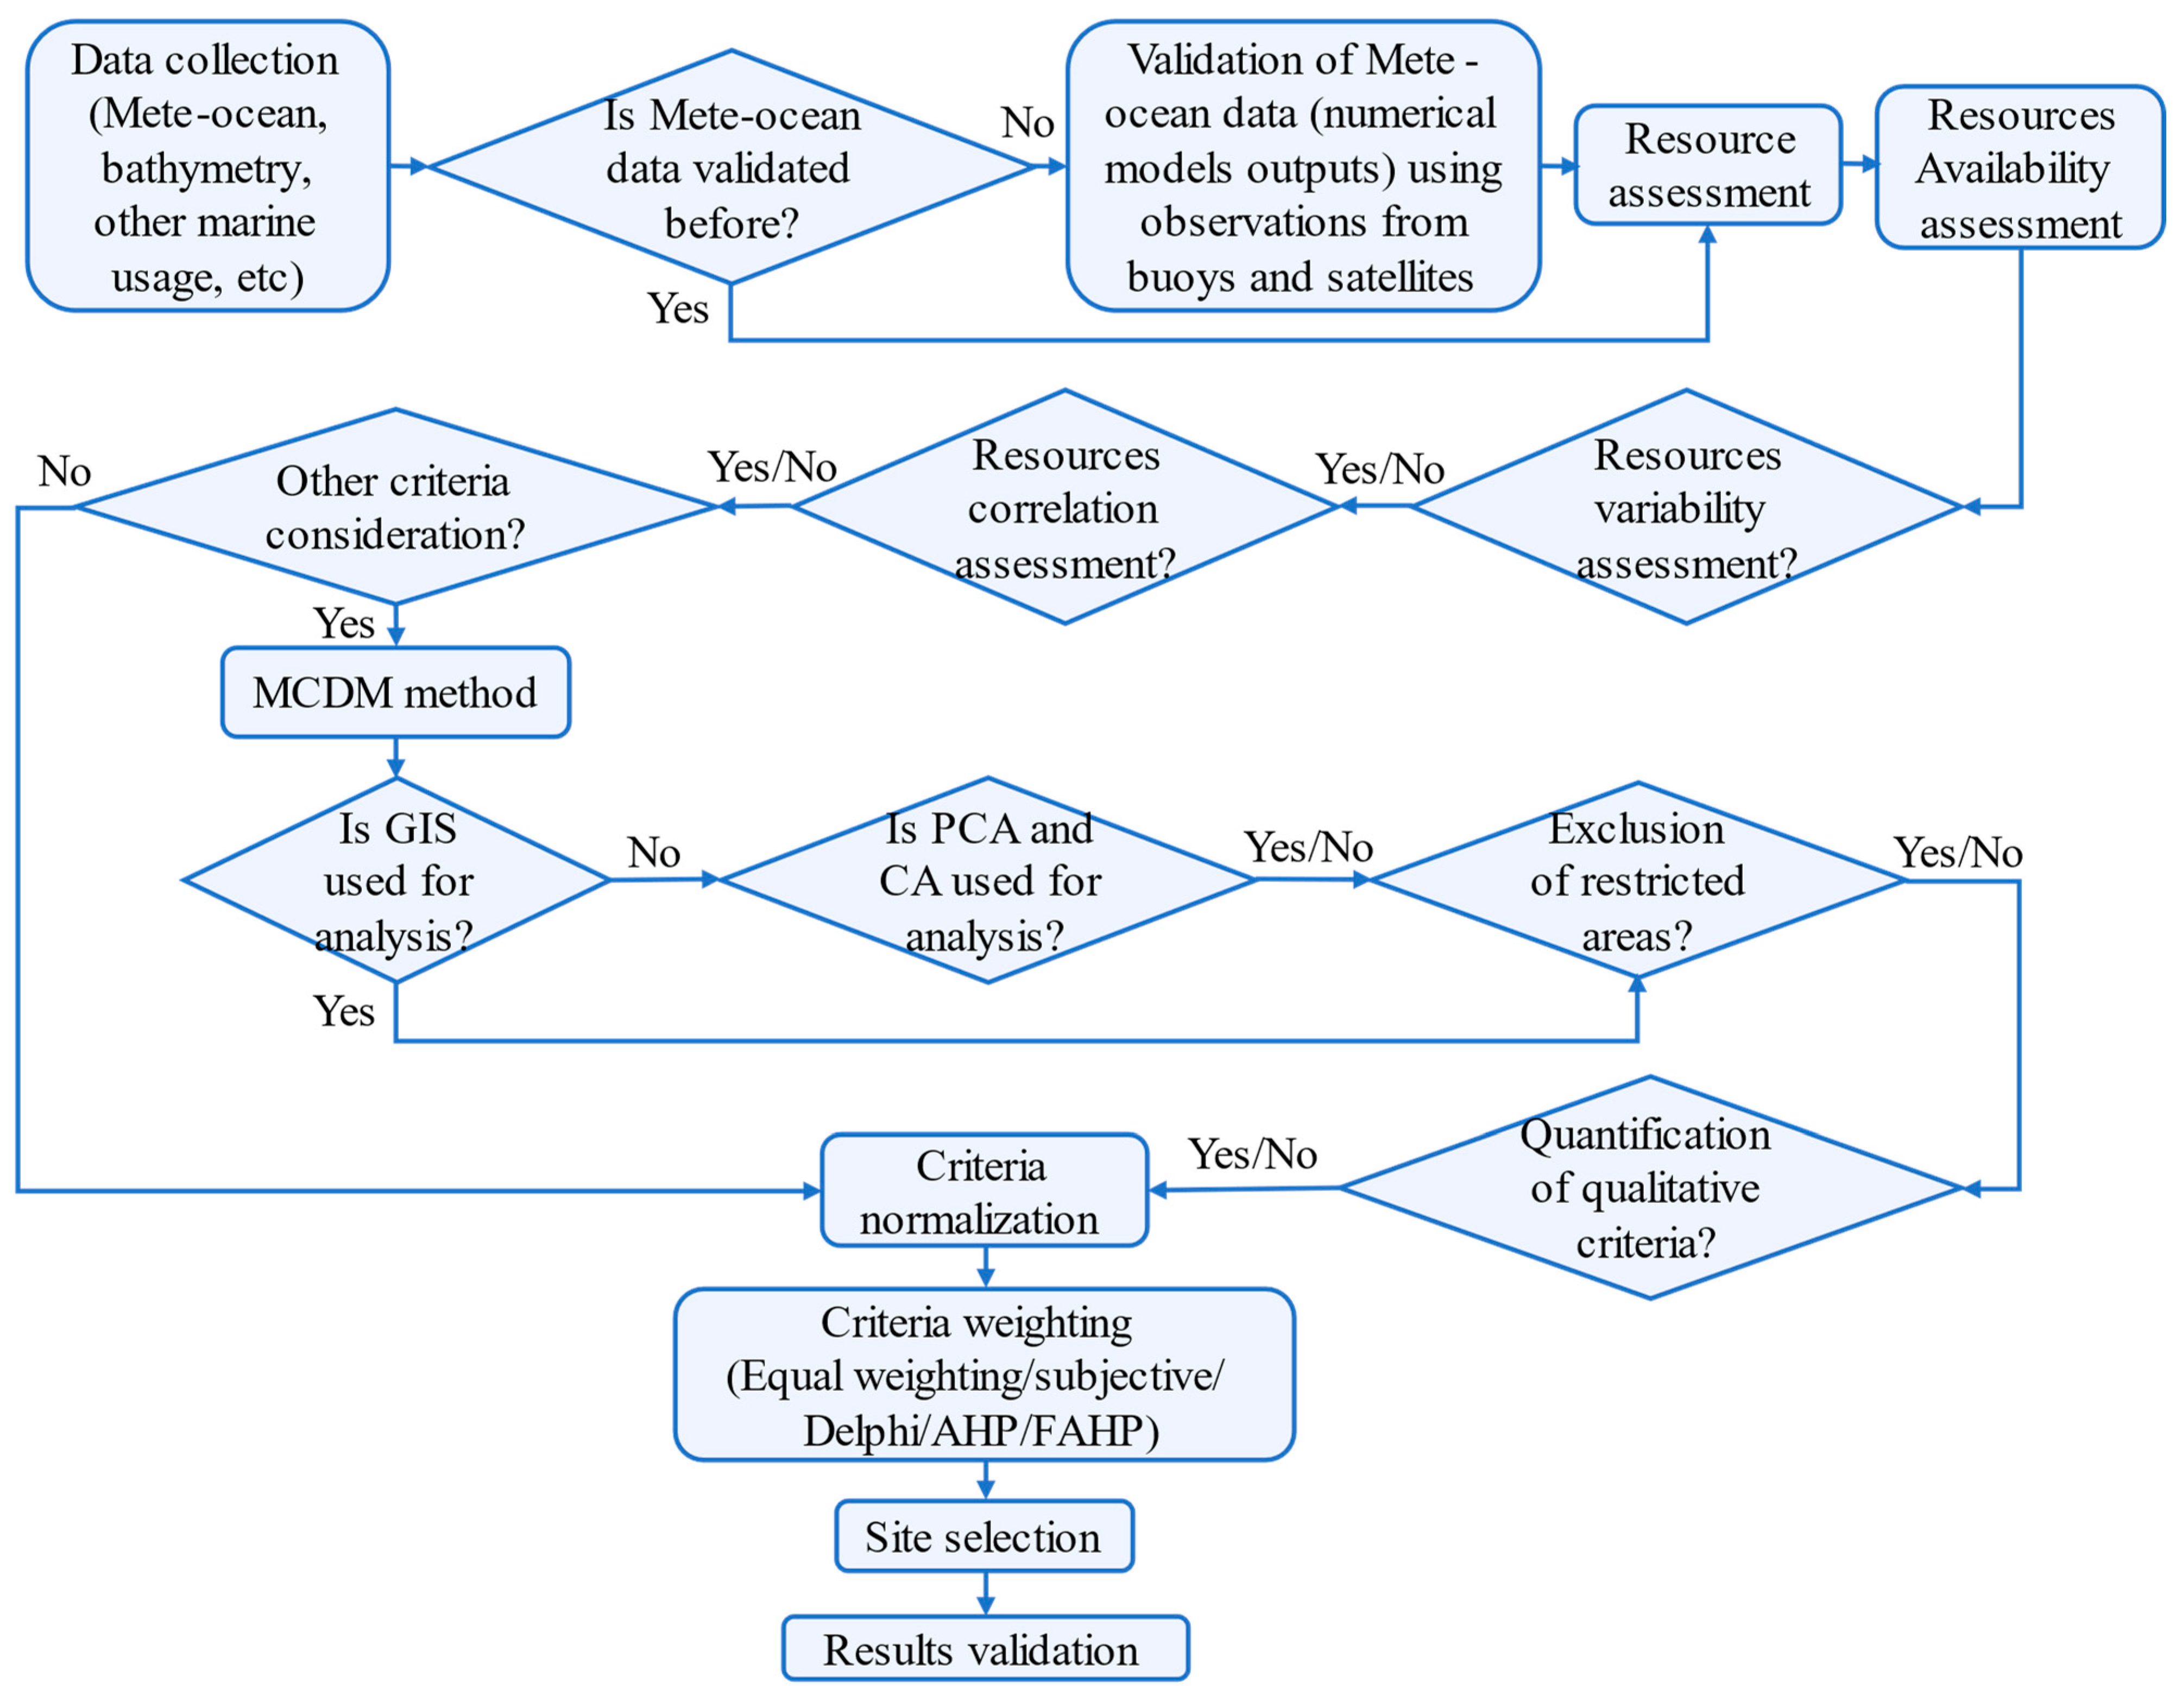
3.5. Methodologies for Site Selection of Combined Offshore Wind and Wave Energy Farm

Site selection should be multifaceted and include technical, economic, social, and environmental criteria. It is thus a complex decision-making problem that needs systematic analysis of these criteria and the use of appropriate analysis methods. Figure 5 presents a flowchart of the methodologies used for the site selection of COWWEF. Table 3 gives the details of the methods and analysis applied in each study.

3.5.1. Data Collection

As shown in Figure 5, the first step of feasibility analysis is to collect the data (e.g., met-ocean, bathymetry, restricted areas map). After collecting all data, the met-ocean dataset, including wind speed and wave parameters, should be validated to ensure its reliability. Satellite measurements [36] and buoy observations [48] were used to validate the numerical wind and wave model outputs. However, most studies used previously validated numerical data.

3.5.2. Site Selection Method

Two general methods are used for site selection, namely resource-based and MCDM (see Table 3). The former method is focused on the site’s energy-generation potential and considers the availability, variability, and correlation of wind and wave energy resources. Less than half of the studies were performed in this way, investigating both variability and correlation of energy resources and the availability of resources. The disadvantage of resource-based assessments is that they do not consider important constraints and socio-environment criteria. In order to consider different conflicting criteria in a decision-making process, MCDM methods are used. These methods have been applied to evaluate different aspects of renewable energy farm developments, including the selection of the best renewable energy technology for a specific area [69], the selection of the best site for the exploitation of specific renewables (the studies reviewed in this paper), and selection of a suitable energy converter device for a specific area [14]. MCDM site selection methods went beyond considering only energy generation opportunities to cover various other criteria. Important geographical features of the studied region, distance to relevant infrastructure, other sea uses, and various other aspects were considered in the various MCDM studies. Considering that many high-resource-potential COWWEF sites have local constraints and approval challenges, MCDM methods appear more useful for selecting sites that are likely to pass more detailed feasibility assessments and government approval processes.
Table 3 and Figure 5 convey that, in some cases, a combination of MCDM methods with GIS or statistical approaches (e.g., Principal Component Analysis (PCA) and Clustering Analysis (CA)) were applied for COWWEF site selection problems. Developers often utilize GIS in many stages of the development process [19]. Using this tool, the overlay maps, which are composed of several layers of information, are analyzed through logical and mathematical operators to determine the ideal location. Many GIS software applications allow the user to customize the application’s functions [31]. Combining the MCDM method with GIS could thus facilitate a spatial planning process that would allow the evaluation of numerous site alternatives in an accurate, systematic, and integrated way, thereby reducing subjectivity in decisions [42].
The PCA method enables selecting only a few components to describe the entire dataset with the minimum amount of information loss. Thus, the wind and wave statistics were reduced in dimensionality using PCA in [46,56]. In addition, to analyze the similarities of meteoclimatic data groups, the CA method, including hierarchical (HCA) and nonhierarchical K-means, was employed in the abovementioned studies. Through these classification methods, the most favorable meteoclimatic conditions in terms of frequency of occurrence [46] and the existing correlation [56] between offshore wind and wave energy resources were identified to be used for site selection.

3.5.3. Exclusion of Restricted Area and Quantification of the Qualitative Criteria

The existing criteria must either be used as an EX or EV criterion. In most studies, the areas with other marine usage have been excluded (see Section 3.2). Additionally, to conduct site selection analysis, all criteria should be made quantifiable. Qualitative criteria require a verifiable method to transform qualitative assessments into a value that can be combined with other quantitative site selection criteria. Thus, after excluding restricted areas, quantification of qualitative criteria is the next step of COWWEF site selection (see Figure 5). Data quantification was performed in two studies [54,56]. In [56], the area with other marine usages as qualitative criteria was quantified and assigned a score. The impact of offshore renewable energy developments on the environment (i.e., EPV) was quantified by [54] by proposing the EPV criterion. The nature, lingual magnitude, degree of reversibility, permanency, and manageability of the impact were considered to calculate the EPV value.

3.5.4. Normalizing the Criteria Values

In multi-criteria analysis, a decision can be made based on criteria whose units of measure cannot be expressed in the same way. Different criteria magnitudes have different meanings, so in some cases, a high value represents the ideal scenario (i.e., a high value of wind and wave energy); in others, low values (i.e., distance to the shore and port) are better. To conduct the next quantitative operations, it is therefore necessary to convert all variables into directionless and dimensionless operable values. Criteria value normalization or data normalization refers to this process [30]. Table 3 shows that the normalization process was performed in 13 studies involving conflicting criteria and MCDM methods. The reason for not conducting normalization in some studies is that there were no multiple criteria with different units and directions to be normalized, or there was no consideration and comparison of all criteria in one step to select the ideal location. The next step after climate data assessment, exclusion, and quantifying the qualitative criteria is normalizing the criteria (see Figure 5). Normalization allows all criteria to be reduced on a standard scale (0 to 100, 0 to 10, or 0 to 1), with 0 being the worst-case scenario and 1, 10, or 100 being the best-case scenario. The ranking of the criteria values between the worst and the best scenario was conducted based on the number of categories defined for each criterion and the interpolation method.
Extremum processing [30] was also used in some studies [38,39,48,50] as follows:
x ij   = x ij   m j M j     m j
where x ij is the i-th sample of the j-th criterion, x ij is the normalized criteria value, and Mj and mj refer to the maximum and minimum values of the j-th criterion, respectively. The formula below was used in the case of having high priority of the low value of a criterion:
x ij   = M j x ij M j m j
The following expression was used by [55,60] to make the used criteria directionless:
x ij     = 1 x ij
Additionally, the linear scaling expressed below was used in both aforementioned studies to make the proposed exploitability index (EI) dimensionless:
x ij = x ij M j
In [40], all the criteria values were divided into six categories and were assigned scores of 0 to 5 based on the increasing preference order of criterion values. The percentage of time with favorable energy production conditions and a parametrized function defined for the distance and risk-based criteria were also two methods of normalization used by [41] (see Table 2). The expression of the other method used to normalize the Suitability Index (i.e., the normalized probability range) is [41]
PR = min different   criteria max × 100

3.5.5. Weighting Method

The next step of the site selection process after normalizing the criteria values is to consider the relative importance of each criterion by weight allocation (see Figure 5). The weights must be rational and accurate. Table 3 displays various weighting methods, including equal weighting, authors’ subjectivity, Delphi method, analytical hierarchy process (AHP), and fuzzy AHP (FAHP). Equal weighting is the simplest method, as it does not require knowledge of the decision-makers’ priorities. Nevertheless, it is not the ideal method, as the relative importance of the criteria is ignored. Approximately 26% of existing studies have used this weighting method (see Table 3). In most studies, authors directly considered rank-order weights to the involved criteria based on their own experience and knowledge or on the structural features of hypothetical offshore renewable energy devices (e.g., [19]). These types of weighting are called authors’ subjectivity. The subjective weights in some studies are quantitative, while in other studies (i.e., mainly resource-based assessment studies), there are no values for the criteria weights, and the way the authors select the ideal location represents the considered importance of each criterion. Based on the last step of the Delphi classification method applied by [59], which includes a weighting approach to the criteria, experts’ opinions were collected to determine the weight coefficients. An average of the assigned weights to each criterion by those who were consulted was thus considered.
The analytic hierarchy process (AHP) initiated by [70] is one of the most popular decision-making techniques in sustainable energy planning and is extensively used for site selection purposes [2,71,72,73,74]. Based on Table 3, the AHP approach was applied in two studies [42,54] to calculate the weights of the criteria. This approach facilitates decision-making by providing a mathematical model that assists decision-makers in arriving at the logical choice. By comparing decision criteria pairwise, it uses a quantitative comparison approach that enables accurate weighing of subjective criteria. In AHP, verbal experts’ judgments are converted to numbers so that a nine-point scale is used to quantify one option’s merit compared to other options on a single scale. In this method, the robustness of the pairwise comparisons is assessed by calculating the consistency ratio (CR; [42]). In the case of inconsistency of pairwise comparisons, namely CR > 0.1, the judgments are therefore modified and repeated, which is the advantage of the AHP method.
To handle the uncertainties in the site selection decision-making process, the fuzzy set theory, introduced by [75], in combination with the MCDM methods, has been employed [76,77,78,79,80]. Presented by [81], FAHP was employed by [40] to obtain relative weights. Utilizing this approach can reduce uncertainties in expert opinions. The fuzzy logic captures how true something is. In this way, the relative importance of items in a pair is judged by decision-makers using linguistic terms. Unlike the AHP method, in which judgments are converted to crisp values, the linguistic experts’ opinions are converted into Triangular Fuzzy Numbers (TFNs). Each TFN consists of three terms, indicating the lowest, most probable value, and highest values [82]. A pairwise comparison matrix is therefore created according to the triangular fuzzy conversion scale. The fuzzy comparison matrix is converted into a crisp comparison matrix using the centroid defuzzification method [83]. The consistency of the crisp comparison matrix is then evaluated by calculating the CR as calculated in the AHP method. If inconsistency occurs, a new pairwise comparison judgment is created, and the procession must be continued until consistency is reached. Finally, the fuzzy weights of criteria are obtained using mathematical calculations that are converted into crisp weights using the centroid defuzzification method.

3.5.6. Site Selection

After quantifying and normalizing the criteria and assigning weights to each criterion, the final steps of the analysis are the selection of appropriate locations and ranking of the feasible areas. The weighted overlay approach was used to rank the suitability of the existing areas (e.g., [40,42,54]). Using the Weighted Linear Combination (WLC), the weighted criteria values of each location are summed to obtain a value representing the suitability of each site. However, based on the subjective weighting of most studies, the ranking was conducted step-by-step, from considering the most important criterion for the selection of a suitable location to the least important one (e.g., [20,47,58,61]). First, the preferable area was chosen based on the most important criterion, and the other criteria values were then checked in that location to select the final location.

3.5.7. Results Validation

Due to the inherent uncertainty that characterizes most decision-making processes, the result validation is another crucial step when conflicting criteria exist and MCDM methods are used (see Figure 5 and Table 3). This stage is performed to ensure the reliability of the results and final decision. Result validation consists of sensitivity analysis or other types of validation. By changing the criteria limits [19] or their assigned weights (e.g., [40,42,54,59]), the sensitivity analysis reveals a new result that should be compared with the previous one. In another validation method, the results are compared with those of other studies [41,58]. The effect of varying limitations of decision criteria (e.g., distance to the port and environmental exclusions) was investigated by [19]. This sensitivity analysis was performed due to the limited data available and the lack of a clear definition of the specific limits for the criteria (see Table 3). In addition, a particular sensitivity analysis method, namely the Monte Carlo approach, was used to evaluate the impact of the variability of the weight coefficients on the final decision [59]. With this method, the new weights were generated considering random numbers, previous weights assigned to each criterion, and their standard deviation. After random variation of weights, they were renormalized to ensure their summation was equal to 1, and the new weights were calculated. Finally, the defined classification index for identifying the ideal location was calculated according to the new weights, and the results were compared with the previous ones.

3.6. Key Challenges

  • The lack of met-ocean data with high resolution in most offshore areas around the world is one of the challenges researchers face during the site selection process. Although the global wind and wave models are available with coarse resolution, the detailed feasibility analysis of combined power plant installations at a local level requires data with fine resolution produced by running the numerical models. On the other hand, downscaling the data is always associated with uncertainty and errors, especially with the lack of in situ measurements. Therefore, the output of these models is not perfect.
  • Considering the uncertainty involved in the site selection process, which originates from the limited understanding of the problem, inconsistency in expert opinions and the stochastic feature of sea state and climate condition is another challenge that researchers should address. It should be mentioned that the uncertainty of experts’ options for weighting the criteria was reduced using the FAHP method [40] to select the optimal sites for COWWEF developments.
  • Environmental restrictions have been widely considered in the literature to exclude vulnerable areas from potential sites for COWWEF development. Nevertheless, there are still some environmental components that can physically or biologically be affected by energy devices. Therefore, assessing the possible environmental impacts of marine renewable energy farms remains challenging. The proposed EPV criterion by [54,67] can only be used to prioritize a limited number of locations for COWWEF developments, as the experts’ knowledge is required to calculate this criterion for each location.
  • Regarding the long lifespan of energy devices, climate change can impact the results of site selection analysis. For example, the change in the sea state and climate condition directly affects the potential energy resources in a region which may lead to different optimal locations for device installations. In addition, the water depth is affected by sea level rise and coastal erosions are caused by climate change. Although the impact of climate change on resources potential for site selection of COWWEF has rarely been evaluated [60], incorporating the variation of input criteria involved in the site selection procedure as a result of climate change is a challenging issue.

4. Conclusions and Recommendations for Future Work

This study provided a systematic literature review with a critical and comprehensive analysis of publications to identify the restrictions and the relevant criteria for determining the best location for COWWEF development. Furthermore, this review contributed to understanding the applied methods and datasets required for evaluating a project’s production capacity. Based on the obtained results, the main findings of this paper are summarized below:
  • Regarding study regions, mainly European offshore areas were (85%) evaluated to select the appropriate location for COWWEF.
  • Most of the literature (93%) relies on numerical models to provide long-term datasets with high spatial and temporal resolution due to the lack of measurements from buoys and satellites.
  • The restrictions, which were considered based on local laws, are related to marine and environmental usage. A total of 12 restricted areas were identified which featured shipping lanes, military exercise, and marine protected areas, and the areas close to the shore were the most frequently listed.
  • Twenty-seven EV criteria were identified from various technical, economic, social, and environmental perspectives. Among EV criteria, those representing wind and wave energy resource potential, bathymetry, variability, and correlation of wind and wave energy resources, as well as distance to infrastructures such as ports, were the most frequently considered.
  • Two approaches, namely MCDM (14 publications) and resource-based (13 studies), were applied to select the optimal sites for locating COWWEF. The GIS and statistical approaches, including PCA and CA, were also used in the literature in combination with MCDM methods.
Based on the performed review, some research gaps which highlight the direction for future research were identified as follows (see also Figure 6 for a summary of identified research gaps and recommendations for future works):
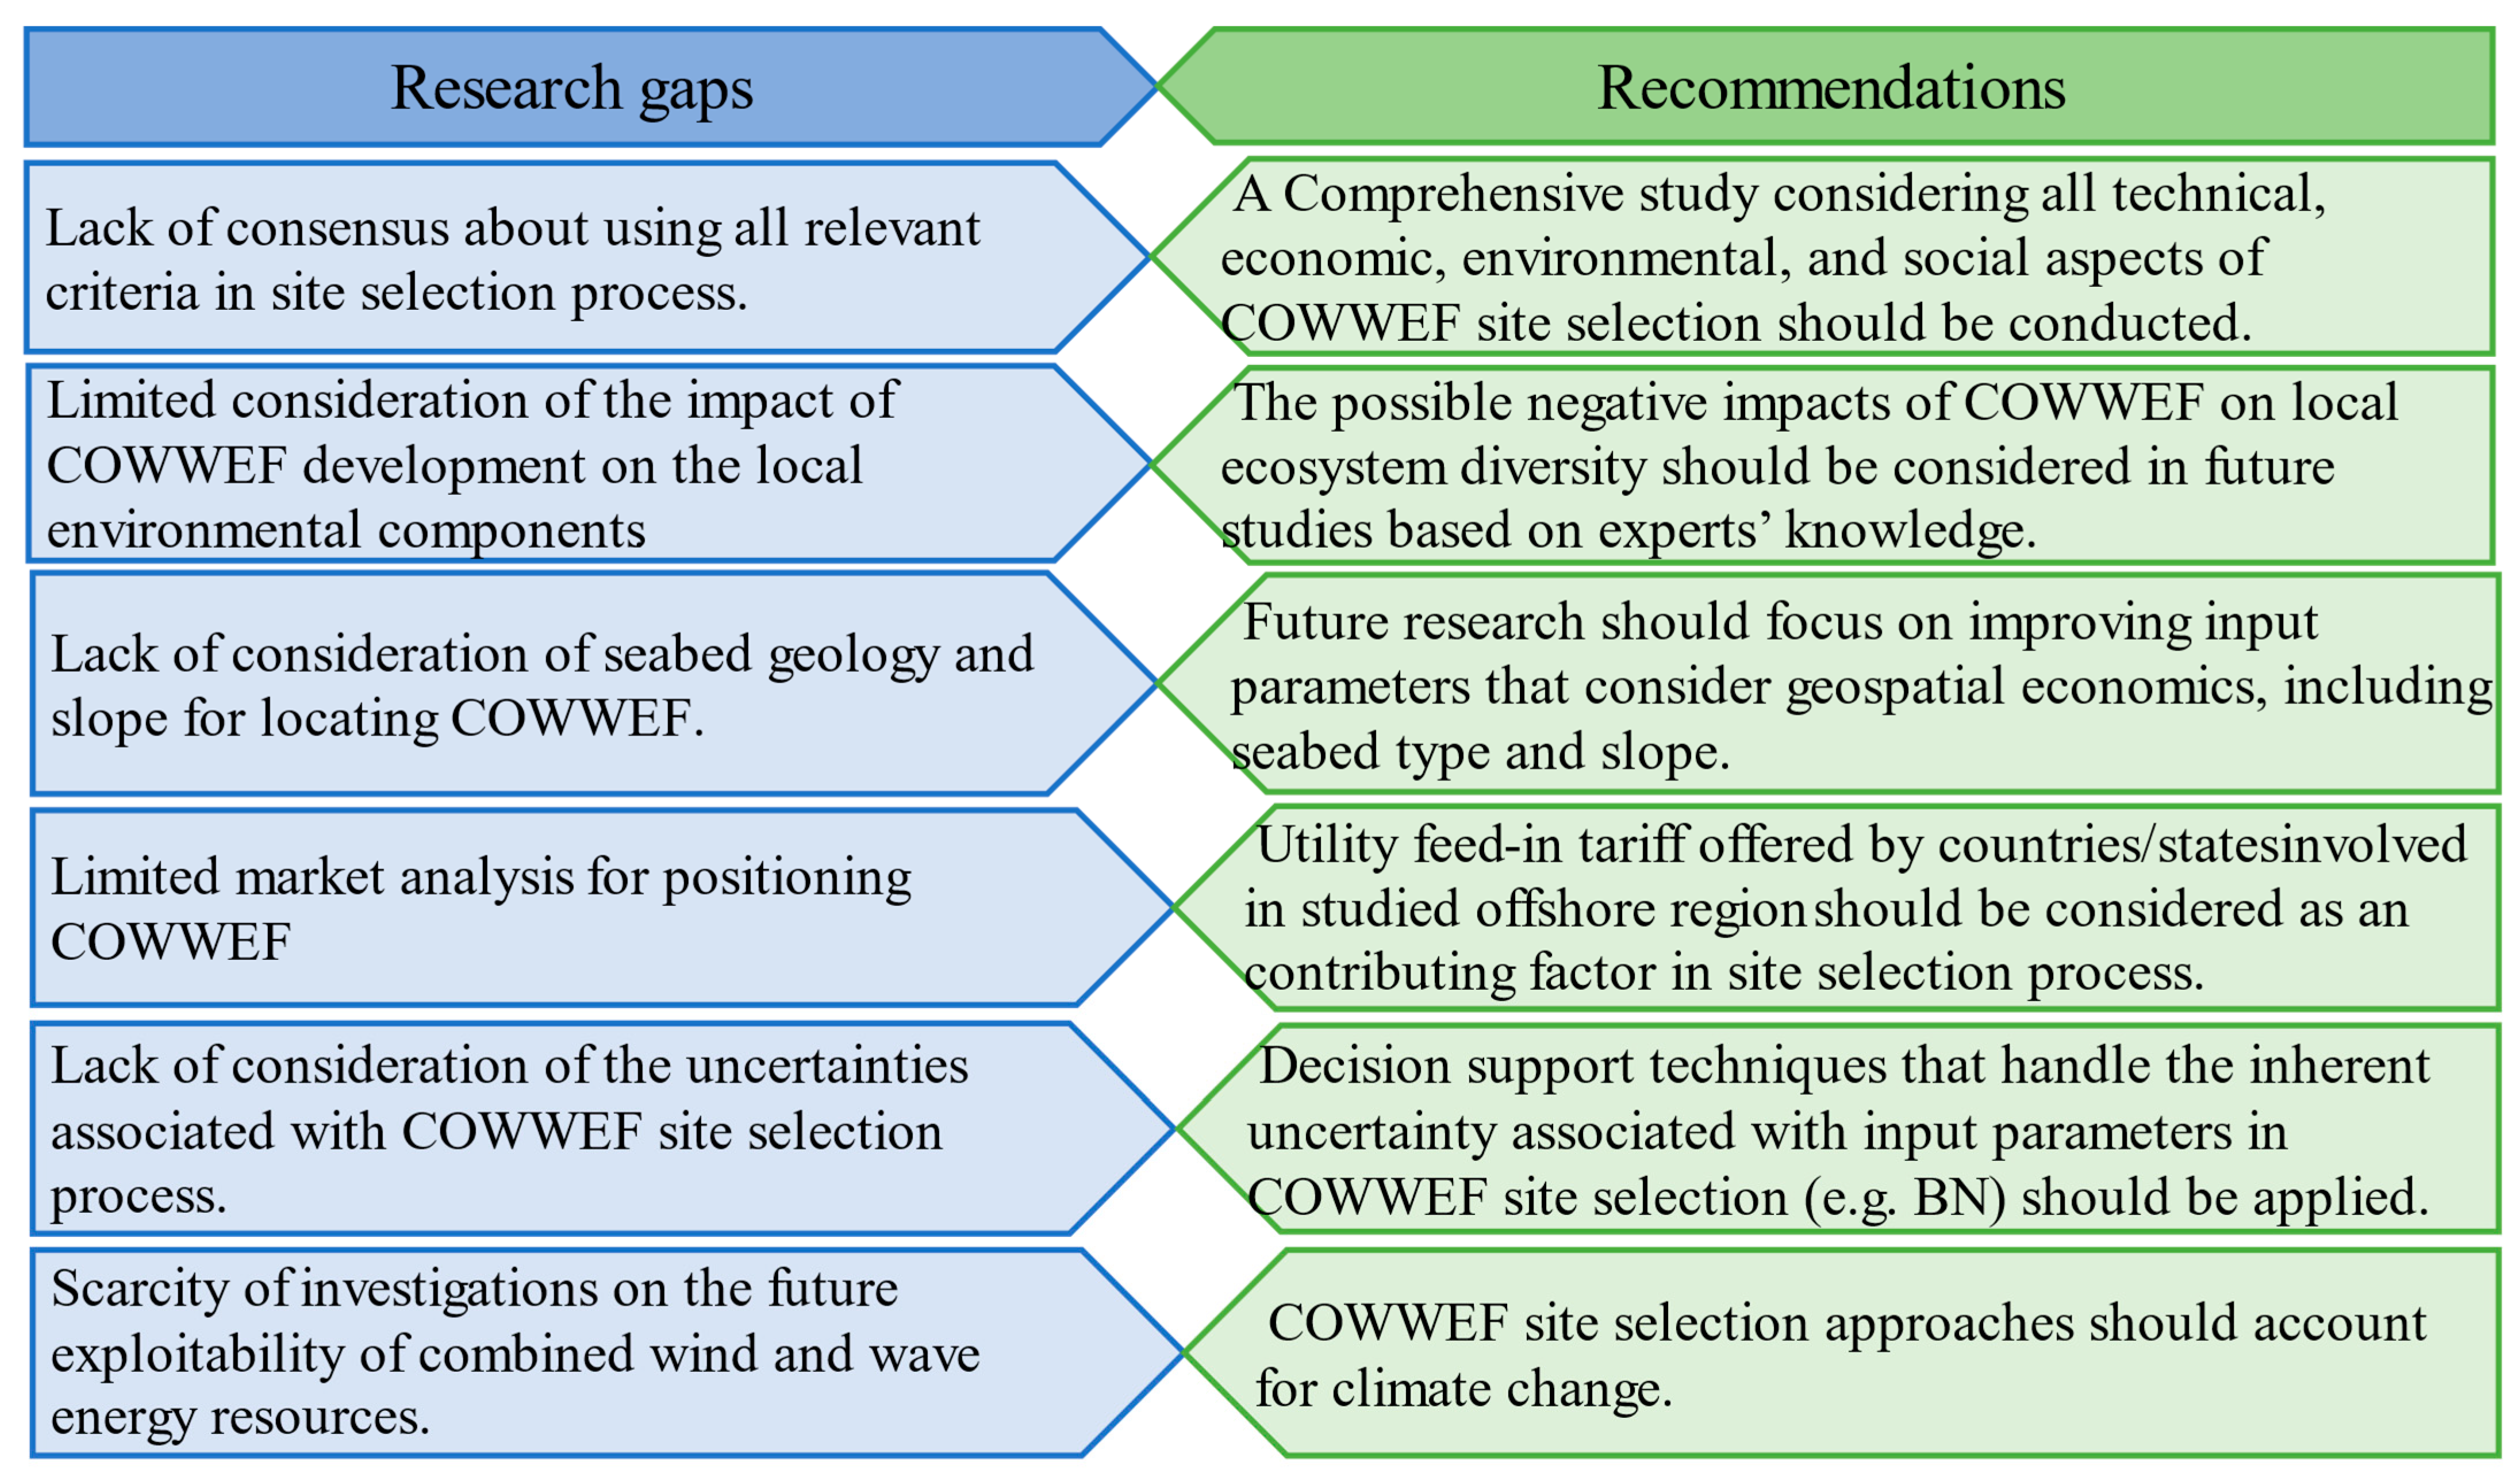
  • The literature lacks a consensus on using all the relevant criteria for the site selection process. A comprehensive framework for this purpose is yet to be established.
  • While most studies rely on other aspects, especially the techno-economic aspects of COWWEF site selection, more emphasis should be placed on the environmental impacts of the project development. This includes identifying and incorporating biological/physical impacts on the local environmental components in different phases of the project (i.e., construction, operation and maintenance, and decommissioning) into a decision-making analysis. The mentioned impacts can be considered based on experts’ knowledge about the studied region’s specific ecosystem diversity.
  • The seabed’s physical characteristics significantly influence the project’s cost in terms of the constructability of the structural foundation or deployment of the mooring cables. Sandy seabed and mild seafloor slopes are preferred as a rock-covered or steep slope can significantly increase costs. Future research should focus on improving input parameters considering geospatial economics, including seabed type and slope.
  • Market analysis has rarely been considered in the literature. Utility feed-in tariffs can be an efficient input parameter for the decision-making process, especially when the studied offshore area is surrounded by several countries or states offering different prices for the electricity generated from certain sources.
  • The site selection process is associated with a high level of uncertainty. The FAHP used in the literature only reduces the uncertainty of experts’ opinions for weighting the criteria [40]. Bayesian Network (BN) [84], which considers probabilities, is a suitable option for decision-making under uncertainty. It is aimed at solving problems with uncertainty due to inconsistency in the knowledge of experts, limited understanding of the problem, or stochastic phenomena [85]. The feature of scenario analysis using BN makes it useful to formulate probabilistic changes in the future [86,87].
  • Investigating the future exploitability of wind and wave energy resources is crucial, considering the long lifespan of energy-generation devices. This issue has rarely been addressed in the literature. Investigating the impact of climate change on the selection of optimal locations for COWWEF developments is recommended for future studies.
Researchers and decision-makers considering offshore renewable energy solutions will benefit from this comprehensive review study since it catalogs and synthesizes all information about COWWEF site selection and highlights some recommendations for future studies. This work aids researchers and practitioners in selecting the best COWWEF sites, ultimately helping society to transition to a renewable energy future.

Author Contributions

Conceptualization, S.H., A.E.-S. and R.A.S.; methodology, S.H., A.E.-S. and R.A.S.; formal analysis, S.H., A.E.-S. and R.A.S.; investigation, S.H., A.E.-S. and R.A.S.; resources, S.H., A.E.-S. and R.A.S.; writing—original draft preparation, S.H.; writing—review and editing, S.H., A.E.-S. and R.A.S.; visualization, S.H., A.E.-S. and R.A.S.; supervision, A.E.-S. and R.A.S.; funding acquisition, S.H. All authors have read and agreed to the published version of the manuscript.

Funding

This research was supported by Griffith University scholarships (GUPRS and GUIPRS) awarded to the first author to pursue her Ph.D.

Data Availability Statement

Not applicable.

Acknowledgments

The authors are grateful for the support of Griffith University and CRI in providing facilities and resources and awarding GUPRS and GUIPRS scholarships to the first author to pursue her Ph.D.

Conflicts of Interest

The authors declare no conflict of interest.

Nomenclature

AHPAnalytic Hierarchy Process
BN Bayesian Network
CA Clustering Analysis
CAWCR Center for Australian Weather and Climate Research
CFSR Climate Forecast System Reanalysis
CORDEX Coordinated Regional Downscaling Experiment
COWWEF Combined Offshore Wind and Wave Energy Farm
ECMWF European Center for Medium-Range Weather Forecasts
EV Evaluation
EX Exclusion
FAHP Fuzzy Analytic Hierarchy Process
GCM Global Climate Model
GIS Geographic Information System
MCDM Multi-Criteria Decision-Making
NASA National Aeronautics and Space Administration
NCEP National Center for Environmental Prediction
PCA Principal Component Analysis
RCM Regional Climate Model
RCP Representative Concentration Pathway
REMO Regional Climate Model
SLRSystematic Literature Review
SWAN Simulating Waves Near-shore
TFN Triangular Fuzzy Numbers
WAM Wave Model
WAsP Wind Atlas Analysis and Application Program
WRF Weather Research and Forecasting
WT Wind Turbine
WEC Wave Energy Converter

Appendix A

Table A1. Details of criteria, including definitions, formulae, and acceptable range.
CategorySub-CategoryCriteria, Parameters, and DefinitionsAcceptable RangeNo.
Techno-EconomicWind energy resource richnessWind Power, WP (W/m2) = 1 2 ρ V 3
V: Wind Speed, ρ : Air density
WP   2801
WP 501
-18
Wind Speed, WS (m/s)6   WS 82
WS (Annual average wind speed)1
WS 6–72
-1
SI Wind R = min (Ap, t Hs t ¯ )
Ap = t WP t ¯           f o r     t WP t ¯ < 0.7 1                 f o r   t WP t ¯ 0.7
tHs and tWP are the time in which Hs (m) and WP (W/m2) are respectively in the acceptable range
t ¯ = The total time of the data series (s)
0 SI Wind R   1
WP 400
Hs 5
1
DWNTwind (%)
Total time with useful wind speed (4   WS   25 (m/s)) in which wind turbine is producing electricity
DWNT WI  10
4   WS   25
1
RLOwind (%)
Rich Level Occurrence = Frequency of wind power higher than 200 W/m2 (WP > 200 W/m2)
RLOWI  10
WP > 200
1
Wave energy resource richnessWave Energy Power, WEP (kW/m)
WEP = ρ w g 2 H s 2 T e 64 π
ρ w is the seawater density, g is gravitational acceleration, H s is significant wave height, T e is the mean wave period
5   WEP 102
WEP 52
WEP 21
WEP 101
-18
WEP 20-301
Significant wave height, Hs (m),
and wave period, Tz (s)
-2
SIWave R= t WEP t ¯ 2 + t Hs t ¯ + t Tp t ¯ 4
tWEP, tHs, tTp are the time in which the WEP, Hs, and Tp are respectively in the acceptable range
t ¯ = The total time of the data series
0 SI Wave R   1
WEP 15
1 Hs 6
5 Tp   14
1
DWNTWave (%) = Total time with useful significant wave height (1   Hs   8 m) in which wave energy converter is producing electricityDWNT WA  101
Combined offshore wind-wave farm richnessMean Capacity Factor of combined energy farm, CFcomb-1
Downtime or non-production time of combined energy farm, DT-1
Resource variabilityCoefficient of Variation, COV
Or Total Harmonic Distortion, THD
-10
COV   1.91
Monthly Variation, MV = P Mmax P Mmin P year -4
MV 2.51
Seasonal Variation, SV = P Smax P Smin P year -4
Skewness, S-4
Kurtosis, K-3
Standard Deviation, SD-4
Resource complementarityCross-Correlation Factor, CCF-11
Wind-to-wave-power Complementarity Index (WCV), Wave-to-wind-power Complementarity Index (VCW), Synergy Index (SWV), Joint Non-availability Index (UWV)-1
Devices’ survivabilitySIWind S = min(f(Hs50), f(WS50), f(C50))
f(x) = 0.8 thld x + 1     f o r   x t h l d 0.2 x max thld max   f o r   x > t h l d
First, the acceptable range of WD was considered. Then, the SI Wind S was calculated based on the thresholds given in the acceptable range column for each used parameter
Hs50 (m), WS50 (m/s), and C50 (m/s) are 50-year return periods of significant wave height, wind speed, and current velocity, respectively
0 SI Wind S   1
WS50  40
Hs50 15
C50  2
WD 500
1
WS50WS50  271
SIWave S = min(f(Hs50), f(C50))
f(x) = 0.8 thld x + 1     f o r   x t h l d 0.2 x max thld max   f o r   x > t h l d
First, the acceptable range of WD was considered. Then, the SI Wave S was calculated based on the thresholds given in the acceptable range column for each used parameter
0 SI Wave S   1
Hs50 15
C50  2
WD 500
1
Hs50Hs50    211
Foundation/anchoring design of devicesWater Depth, WD (m)WD 5004
WD 3001
70-150 WD 2501
WD   35–501
25 WD 100 (50)1
WD 1001
WD 502
35   WD 751
50   WD 3501
-1
Logistics (Feasibility of installation, operation, and maintenance)SILog = min ( t WS t ¯ , t Hs t ¯ , f(DP))
f(x) = 0.8 thld x + 1     f o r   x t h l d 0.2 x max thld max   f o r   x > t h l d
The threshold of DP was given in the column representing an acceptable range of parameters
t WS, t Hs the time in which the WS and Hs are respectively in the acceptable range
t ¯ = The total time of the data series
0 SI Log 1
WS50  10
Hs50 2
DP 250
1
Distance from Port, DP (km)DP 2501
DP (O&M)  50–100–200
DP (Construction)  200–500
DP(O&M)  100 & DP(Construction)    500
1
50 DP   1002
-4
DP (Deep water)   500
DP (Shallow water) 130
1
Transmission cost and energy dissipationDistance from Shore, DS (km)-3
DS = 1001
DS   302
DS 4441
DS     50–100–1501
DS     2001
Distance to the Local Electrical Grid, DLEG (km)DLEG 5001
DLEG   701
Voltage Capacity of Closest available Grid, VCCG (kv)66–4002
220–5001
EconomicPrioritizing different countries based on the feed-in tariffIncentives: Feed-in tariffs of different countries located around the study region-1
Socio-EconomicSupplying energy demandPopulation Served, PSDP   1002
Electricity Demand, ED:
A candidate area’s electricity demand was estimated based on the local province’s average annual electricity consumption
-1
EnvironmentalImpact of offshore renewable energy farms on the environmentEnvironmental Performance Value, EPV−162   EPV 54
−162: Extremely negative
54: Extremely positive
1
Impact of considering human activities and environmental vulnerability in the site selection processCumulative Impact Index, CII = Multiplying the Cumulative Pressure Index (CPI) by the Vulnerability Index (VI)0 0.04, Low
0.05–0.33, Moderate
0.34–0.61, High
>0.62, Very high
1
Impact of noise on the
growth of marine animals due to
low frequency of sound waves
Distance from Aquaculture Area, DAA (km) 1 1
Impact of hitting birds by turbine bladesDistance from Nature Conservation Areas, DNCA (km): include natural parks, natural reserves, flora and fauna habitats that protect nature and wildlife 11

References

  1. UNFCCC. The Glasgow Climate Pact—Key Outcomes from COP26. unfccc.int. Available online: https://unfccc.int/process-and-meetings/the-paris-agreement/the-glasgow-climate-pact-key-outcomes-from-cop26 (accessed on 1 July 2022).
  2. Emeksiz, C.; Demirci, B. The Determination of Offshore Wind Energy Potential of Turkey by Using Novelty Hybrid Site Selection Method. Sustain. Energy Technol. Assess. 2019, 36, 100562. [Google Scholar] [CrossRef]
  3. Bp. Bp’s Statistical Review of World Energy 2021, 70th ed.; Whitehouse Associates: London, UK, 2021; p. 5. [Google Scholar]
  4. Mohammadi, S.; Maleki, A.; Ehsani, R.; Shakouri, O. Investigation of Wind Energy Potential in Zanjan Province, Iran. Renew. Energy Res. Appl. 2022, 3, 61–70. [Google Scholar] [CrossRef]
  5. Irena IREA. Statistics Time Series. 2022. Available online: https://www.irena.org/Statistics/View-Data-by-Topic/Capacity-and-Generation/Statistics-Time-Series (accessed on 1 June 2022).
  6. Golestani, N.; Arzaghi, E.; Abbassi, R.; Garaniya, V.; Abdussamie, N.; Yang, M. The Game of Guwarra: A Game Theory-Based Decision-Making Framework for Site Selection of Offshore Wind Farms in Australia. J. Clean. Prod. 2021, 326, 129358. [Google Scholar] [CrossRef]
  7. Sun, X.; Huang, D.; Wu, G. The Current State of Offshore Wind Energy Technology Development. Energy 2012, 41, 298–312. [Google Scholar] [CrossRef]
  8. Li, Y.; Huang, X.; Tee, K.F.; Li, Q.; Wu, X.P. Comparative Study of Onshore and Offshore Wind Characteristics and Wind Energy Potentials: A Case Study for Southeast Coastal Region of China. Sustain. Energy Technol. Assess. 2020, 39, 100711. [Google Scholar] [CrossRef]
  9. Deveci, M.; Özcan, E.; John, R.; Covrig, C.F.; Pamucar, D. A Study on Offshore Wind Farm Siting Criteria Using a Novel Interval-Valued Fuzzy-Rough Based Delphi Method. J. Environ. Manag. 2020, 270, 110916. [Google Scholar] [CrossRef] [PubMed]
  10. Breton, S.P.; Moe, G. Status, Plans and Technologies for Offshore Wind Turbines in Europe and North America. Renew. Energy 2009, 34, 646–654. [Google Scholar] [CrossRef]
  11. Khan, M.; Khalid, A.; Lughmani, W.A.; Khan, M.M. A Use Case of Exclusive Economic Zone of Pakistan for Wave Power Potential Estimation. Ocean Eng. 2021, 237, 109664. [Google Scholar] [CrossRef]
  12. Dunnett, D.; Wallace, J.S. Electricity Generation from Wave Power in Canada. Renew. Energy 2009, 34, 179–195. [Google Scholar] [CrossRef]
  13. Rusu, E. Wave Energy Assessments in the Black Sea. J. Mar. Sci. Technol. 2009, 14, 359–372. [Google Scholar] [CrossRef]
  14. Kamranzad, B.; Hadadpour, S. A Multi-Criteria Approach for Selection of Wave Energy Converter/Location. Energy 2020, 204, 117924. [Google Scholar] [CrossRef]
  15. Corsatea, T.D.; Magagna, D. Overview of European Innovation Activities in Marine Energy Technology JRC Science and Policy Reports; Publications Office of the European Union: Luxembourg, 2013. [Google Scholar]
  16. Leijon, M.; Danielsson, O.; Eriksson, M.; Thorburn, K.; Bernhoff, H.; Isberg, J.; Sundberg, J.; Ivanova, I.; Sjöstedt, E.; Ågren, O.; et al. An Electrical Approach to Wave Energy Conversion. Renew. Energy 2006, 31, 1309–1319. [Google Scholar] [CrossRef]
  17. Fusco, F.; Nolan, G.; Ringwood, J.V. Variability Reduction through Optimal Combination of Wind/Wave Resources—An Irish Case Study. Energy 2010, 35, 314–325. [Google Scholar] [CrossRef] [Green Version]
  18. Rashidi, M.M.; Mahariq, I.; Murshid, N.; Wongwises, S.; Mahian, O.; Alhuyi Nazari, M. Applying Wind Energy as a Clean Source for Reverse Osmosis Desalination: A Comprehensive Review. Alex. Eng. J. 2022, 61, 12977–12989. [Google Scholar] [CrossRef]
  19. Cradden, L.; Kalogeri, C.; Barrios, I.M.; Galanis, G.; Ingram, D.; Kallos, G. Multi-Criteria Site Selection for Offshore Renewable Energy Platforms. Renew. Energy 2016, 87, 791–806. [Google Scholar] [CrossRef] [Green Version]
  20. Veigas, M.; Carballo, R.; Iglesias, G. Wave and Offshore Wind Energy on an Island. Energy Sustain. Dev. 2014, 22, 57–65. [Google Scholar] [CrossRef]
  21. Erdinc, O.; Uzunoglu, M. Optimum Design of Hybrid Renewable Energy Systems: Overview of Different Approaches. Renew. Sustain. Energy Rev. 2012, 16, 1412–1425. [Google Scholar] [CrossRef]
  22. Jones, D.F.; Wall, G. An Extended Goal Programming Model for Site Selection in the Offshore Wind Farm Sector. Ann. Oper. Res. 2016, 245, 121–135. [Google Scholar] [CrossRef]
  23. Nobre, A.; Pacheco, M.; Jorge, R.; Lopes, M.F.P.; Gato, L.M.C. Geospatial Multi-Criteria Analysis for Wave Energy Conversion System Deployment. Renew. Energy 2009, 34, 97–111. [Google Scholar] [CrossRef]
  24. Tsoutsos, T.; Drandaki, M.; Frantzeskaki, N.; Iosifidis, E.; Kiosses, I. Sustainable Energy Planning by Using Multi-Criteria Analysis Application in the Island of Crete. Energy Policy 2009, 37, 1587–1600. [Google Scholar] [CrossRef]
  25. Gkeka-Serpetsidaki, P.; Tsoutsos, T. A Methodological Framework for Optimal Siting of Offshore Wind Farms: A Case Study on the Island of Crete. Energy 2022, 239, 122296. [Google Scholar] [CrossRef]
  26. Keivanpour, S.; Ramudhin, A.; Ait Kadi, D. The Sustainable Worldwide Offshore Wind Energy Potential: A Systematic Review. J. Renew. Sustain. Energy 2017, 9, 065902. [Google Scholar] [CrossRef]
  27. Gil-García, I.C.; García-Cascales, M.S.; Fernández-Guillamón, A.; Molina-García, A. Categorization and Analysis of Relevant Factors for Optimal Locations in Onshore and Offshorewind Power Plants: A Taxonomic Review. J. Mar. Sci. Eng. 2019, 7, 391. [Google Scholar] [CrossRef] [Green Version]
  28. Peters, J.L.; Remmers, T.; Wheeler, A.J.; Murphy, J.; Cummins, V. A Systematic Review and Meta-Analysis of GIS Use to Reveal Trends in Offshore Wind Energy Research and Offer Insights on Best Practices. Renew. Sustain. Energy Rev. 2020, 128, 109916. [Google Scholar] [CrossRef]
  29. Spyridonidou, S.; Vagiona, D.G. Systematic review of site-selection processes in onshore and offshore wind energy research. Energies 2020, 13, 5906. [Google Scholar] [CrossRef]
  30. Shao, M.; Han, Z.; Sun, J.; Xiao, C.; Zhang, S.; Zhao, Y. A Review of Multi-Criteria Decision Making Applications for Renewable Energy Site Selection. Renew. Energy 2020, 157, 377–403. [Google Scholar] [CrossRef]
  31. Rediske, G.; Burin, H.P.; Rigo, P.D.; Rosa, C.B.; Michels, L.; Siluk, J.C.M. Wind Power Plant Site Selection: A Systematic Review. Renew. Sustain. Energy Rev. 2021, 148, 111293. [Google Scholar] [CrossRef]
  32. Clemente, D.; Rosa-Santos, P.; Taveira-Pinto, F. On the Potential Synergies and Applications of Wave Energy Converters: A Review. Renew. Sustain. Energy Rev. 2021, 135, 110162. [Google Scholar] [CrossRef]
  33. Pérez-Collazo, C.; Greaves, D.; Iglesias, G. A Review of Combined Wave and Offshore Wind Energy. Renew. Sustain. Energy Rev. 2015, 42, 141–153. [Google Scholar] [CrossRef] [Green Version]
  34. Wassie, Y.T.; Adaramola, M.S. Potential Environmental Impacts of Small-Scale Renewable Energy Technologies in East Africa: A Systematic Review of the Evidence. Renew. Sustain. Energy Rev. 2019, 111, 377–391. [Google Scholar] [CrossRef]
  35. Babatunde, K.A.; Begum, R.A.; Said, F.F. Application of Computable General Equilibrium (CGE) to Climate Change Mitigation Policy: A Systematic Review. Renew. Sustain. Energy Rev. 2017, 78, 61–71. [Google Scholar] [CrossRef]
  36. Rusu, E.; Onea, F. Joint Evaluation of the Wave and Offshore Wind Energy Resources in the Developing Countries. Energies 2017, 10, 1866. [Google Scholar] [CrossRef] [Green Version]
  37. Rusu, E.; Onea, F. A Parallel Evaluation of the Wind and Wave Energy Resources along the Latin American and European Coastal Environments. Renew. Energy 2019, 143, 1594–1607. [Google Scholar] [CrossRef]
  38. Gao, Q.; Saeed Khan, S.; Sergiienko, N.; Ertugrul, N.; Hemer, M.; Negnevitsky, M.; Ding, B. Assessment of Wind and Wave Power Characteristic and Potential for Hybrid Exploration in Australia. Renew. Sustain. Energy Rev. 2022, 168, 112747. [Google Scholar] [CrossRef]
  39. Patel, R.P.; Nagababu, G.; Kachhwaha, S.S.; Kumar, S.V.V.A.; Seemanth, M. Combined Wind and Wave Resource Assessment and Energy Extraction along the Indian Coast. Renew. Energy 2022, 195, 931–945. [Google Scholar] [CrossRef]
  40. Zhou, X.; Huang, Z.; Wang, H.; Yin, G.; Bao, Y.; Dong, Q.; Liu, Y. Site Selection for Hybrid Offshore Wind and Wave Power Plants Using a Four-Stage Framework: A Case Study in Hainan, China. Ocean Coast. Manag. 2022, 218, 106035. [Google Scholar] [CrossRef]
  41. Weiss, C.V.C.; Guanche, R.; Ondiviela, B.; Castellanos, O.F.; Juanes, J. Marine Renewable Energy Potential: A Global Perspective for Offshore Wind and Wave Exploitation. Energy Convers. Manag. 2018, 177, 43–54. [Google Scholar] [CrossRef]
  42. Vasileiou, M.; Loukogeorgaki, E.; Vagiona, D.G. GIS-Based Multi-Criteria Decision Analysis for Site Selection of Hybrid Offshore Wind and Wave Energy Systems in Greece. Renew. Sustain. Energy Rev. 2017, 73, 745–757. [Google Scholar] [CrossRef]
  43. Kaldellis, J.K.; Apostolou, D.; Kapsali, M.; Kondili, E. Environmental and Social Footprint of Offshore Wind Energy. Comparison with Onshore Counterpart. Renew. Energy 2016, 92, 543–556. [Google Scholar] [CrossRef]
  44. Serri, L.; Sempreviva, A.; Pontes, T.; Murphy, J.; Lynch, K.; Airoldi, D.; Hussey, J.; Rudolph, C.; Karagali, I. Resource Data and GIS Tool for Offshore Renewable Energy Projects in Europe; Results FP7 ORECCA Proj. Work Packag. 2; Hydraulics & Maritime Research Centre: Cork, Ireland, 2012. [Google Scholar]
  45. Lichtenwalner, S. Ocean Data Labs. Available online: https://datalab.marine.rutgers.edu/2013/07/satellites-vs-buoys/ (accessed on 10 May 2022).
  46. Azzellino, A.; Ferrante, V.; Kofoed, J.P.; Lanfredi, C.; Vicinanza, D. Optimal Siting of Offshore Wind-Power Combined with Wave Energy through a Marine Spatial Planning Approach. Int. J. Mar. Energy 2013, 3–4, e11–e25. [Google Scholar] [CrossRef]
  47. Veigas, M.; Iglesias, G. Wave and Offshore Wind Potential for the Island of Tenerife. Energy Convers. Manag. 2013, 76, 738–745. [Google Scholar] [CrossRef]
  48. Astariz, S.; Iglesias, G. Selecting Optimum Locations for Co-Located Wave and Wind Energy Farms. Part I: The Co-Location Feasibility Index. Energy Convers. Manag. 2016, 122, 589–598. [Google Scholar] [CrossRef] [Green Version]
  49. Rusu, E. The Synergy between Wind and Wave Power along the Coasts of the Black Sea. Marit. Transp. Harvest. Sea Resour. 2018, 2, 1211–1217. [Google Scholar]
  50. Astariz, S.; Iglesias, G. The Collocation Feasibility Index—A Method for Selecting Sites for Co-Located Wave and Wind Farms. Renew. Energy 2017, 103, 811–824. [Google Scholar] [CrossRef] [Green Version]
  51. Onea, F.; Ciortan, S.; Rusu, E. Assessment of the Potential for Developing Combined Wind-Wave Projects in the European Nearshore. Energy Environ. 2017, 28, 580–597. [Google Scholar] [CrossRef]
  52. Kalogeri, C.; Galanis, G.; Spyrou, C.; Diamantis, D.; Baladima, F.; Koukoula, M.; Kallos, G. Assessing the European Offshore Wind and Wave Energy Resource for Combined Exploitation. Renew. Energy 2017, 101, 244–264. [Google Scholar] [CrossRef]
  53. Rusu, L.; Ganea, D.; Mereuta, E. A Joint Evaluation of Wave and Wind Energy Resources in the Black Sea Based on 20-Year Hindcast Information. Energy Explor. Exploit. 2018, 36, 335–351. [Google Scholar] [CrossRef]
  54. Loukogeorgaki, E.; Vagiona, D.G.; Vasileiou, M. Site Selection of Hybrid Offshore Wind and Wave Energy Systems in Greece Incorporating Environmental Impact Assessment. Energies 2018, 11, 2095. [Google Scholar] [CrossRef]
  55. Rusu, L. The Wave and Wind Power Potential in the Western Black Sea. Renew. Energy 2019, 139, 1146–1158. [Google Scholar] [CrossRef]
  56. Azzellino, A.; Lanfredi, C.; Riefolo, L.; Contestabile, P.; Vicinanza, D. Combined Exploitation of Offshore Wind and Wave Energy in the Italian Seas: A Spatial Planning Approach. Front. Energy Res. 2019, 7, 42. [Google Scholar] [CrossRef] [Green Version]
  57. Ferrari, F.; Besio, G.; Cassola, F.; Mazzino, A. Optimized Wind and Wave Energy Resource Assessment and Offshore Exploitability in the Mediterranean Sea. Energy 2020, 190, 116447. [Google Scholar] [CrossRef]
  58. Gaughan, E.; Fitzgerald, B. An Assessment of the Potential for Co-Located Offshore Wind and Wave Farms in Ireland. Energy 2020, 200, 117526. [Google Scholar] [CrossRef]
  59. Ribeiro, A.; Costoya, X.; de Castro, M.; Carvalho, D.; Dias, J.M.; Rocha, A.; Gomez-Gesteira, M. Assessment of Hybrid Wind-Wave Energy Resource for the NW Coast of Iberian Peninsula in a Climate Change Context. Appl. Sci. 2020, 10, 7359. [Google Scholar] [CrossRef]
  60. Lira-Loarca, A.; Ferrari, F.; Mazzino, A.; Besio, G. Future Wind and Wave Energy Resources and Exploitability in the Mediterranean Sea by 2100. Appl. Energy 2021, 302, 117492. [Google Scholar] [CrossRef]
  61. Kardakaris, K.; Boufidi, I.; Soukissian, T. Offshore Wind and Wave Energy Complementarity in the Greek Seas Based on ERA5 Data. Atmosphere 2021, 12, 1360. [Google Scholar] [CrossRef]
  62. Murphy, J.; Lynch, K.; Serri, L.; Airdoldi, D.; Lopes, M. Site Selection Analysis for Offshore Combined Resource Projects in Europe. Orecca 2011, 123, 1–117. [Google Scholar]
  63. Van der Wal, J.T.; Quirijns, F.J.; Leopold, M.F.; Slijkerman, D.M.E.; Jongbloed, R.H. Identification and Analysis of Interations between Sea Use Functions; Wageningen University & Research Publications: Wageningen, The Netherlands, 2009. [Google Scholar]
  64. Costoya, X.; DeCastro, M.; Santos, F.; Sousa, M.C.; Gómez-Gesteira, M. Projections of Wind Energy Resources in the Caribbean for the 21st Century. Energy 2019, 178, 356–367. [Google Scholar] [CrossRef]
  65. Costoya, X.; deCastro, M.; Carvalho, D.; Gómez-Gesteira, M. On the Suitability of Offshore Wind Energy Resource in the United States of America for the 21st Century. Appl. Energy 2020, 262, 114537. [Google Scholar] [CrossRef]
  66. Reeve, D.E.; Chen, Y.; Pan, S.; Magar, V.; Simmonds, D.J.; Zacharioudaki, A. An Investigation of the Impacts of Climate Change on Wave Energy Generation: The Wave Hub, Cornwall, UK. Renew. Energy 2011, 36, 2404–2413. [Google Scholar] [CrossRef] [Green Version]
  67. Vagiona, D. Environmental Performance Value of Projects: An Environmental Impact Assessment Tool. Int. J. Sustain. Dev. Plan. 2015, 10, 315–330. [Google Scholar] [CrossRef] [Green Version]
  68. Wu, Y.; Tao, Y.; Zhang, B.; Wang, S.; Xu, C.; Zhou, J. A Decision Framework of Offshore Wind Power Station Site Selection Using a PROMETHEE Method under Intuitionistic Fuzzy Environment: A Case in China. Ocean Coast. Manag. 2020, 184, 105016. [Google Scholar] [CrossRef]
  69. Shokatpour, M.H.; Alhuyi Nazari, M.; Haj Assad, M. El Renewable Energy Technology Selection for Iran by Using Multi Criteria Decision Making. In Proceedings of the 2022 Advances in Science and Engineering Technology International Conferences, ASET, Dubai, United Arab Emirates, 21–24 February 2022. [Google Scholar] [CrossRef]
  70. Saaty, T.L. The Analytic Hierarchy Process; McGraw-Hill: New York, NY, USA, 1980. [Google Scholar]
  71. Asadi, M.; Pourhossein, K. Wind Farm Site Selection Considering Turbulence Intensity. Energy 2021, 236, 121480. [Google Scholar] [CrossRef]
  72. Chaouachi, A.; Covrig, C.F.; Ardelean, M. Multi-Criteria Selection of Offshore Wind Farms: Case Study for the Baltic States. Energy Policy 2017, 103, 179–192. [Google Scholar] [CrossRef]
  73. Díaz, H.; Guedes Soares, C. A Novel Multi-Criteria Decision-Making Model to Evaluate Floating Wind Farm Locations. Renew. Energy 2022, 185, 431–454. [Google Scholar] [CrossRef]
  74. Kim, G.; Jeong, M.H.; Jeon, S.B.; Lee, T.Y.; Oh, H.Y.; Park, C.S. Determination of Optimal Locations for Offshore Wind Farms Using the Analytical Hierarchy Process. J. Coast. Res. 2021, 114, 439–443. [Google Scholar] [CrossRef]
  75. Zadeh, L.A. Fuzzy Sets. Inf. Control. 1965, 8, 338–353. [Google Scholar] [CrossRef] [Green Version]
  76. Wu, B.; Yip, T.L.; Xie, L.; Wang, Y. A Fuzzy-MADM Based Approach for Site Selection of Offshore Wind Farm in Busy Waterways in China. Ocean Eng. 2018, 168, 121–132. [Google Scholar] [CrossRef]
  77. Deveci, M.; Cali, U.; Kucuksari, S.; Erdogan, N. Interval Type-2 Fuzzy Sets Based Multi-Criteria Decision-Making Model for Offshore Wind Farm Development in Ireland. Energy 2020, 198, 117317. [Google Scholar] [CrossRef]
  78. Gil-García, I.C.; Ramos-Escudero, A.; García-Cascales, M.S.; Dagher, H.; Molina-García, A. Fuzzy GIS-Based MCDM Solution for the Optimal Offshore Wind Site Selection: The Gulf of Maine Case. Renew. Energy 2021, 183, 130–147. [Google Scholar] [CrossRef]
  79. Taoufik, M.; Fekri, A. GIS-Based Multi-Criteria Analysis of Offshore Wind Farm Development in Morocco. Energy Convers. Manag. X 2021, 11, 100103. [Google Scholar] [CrossRef]
  80. Tercan, E.; Tapkın, S.; Latinopoulos, D.; Dereli, M.A.; Tsiropoulos, A.; Ak, M.F. A GIS-Based Multi-Criteria Model for Offshore Wind Energy Power Plants Site Selection in Both Sides of the Aegean Sea. Environ. Monit. Assess. 2020, 192, 652. [Google Scholar] [CrossRef] [PubMed]
  81. Calabrese, A.; Costa, R.; Menichini, T. Using Fuzzy AHP to Manage Intellectual Capital Assets: An Application to the ICT Service Industry. Expert Syst. Appl. 2013, 40, 3747–3755. [Google Scholar] [CrossRef]
  82. Zhou, X.; Cheng, L.; Li, M. Assessing and Mapping Maritime Transportation Risk Based on Spatial Fuzzy Multi-Criteria Decision Making: A Case Study in the South China Sea. Ocean Eng. 2020, 208, 107403. [Google Scholar] [CrossRef]
  83. Yager, R.R. A Procedure for Ordering Fuzzy Subsets of the Unit Interval. Inf. Sci. 1981, 24, 143–161. [Google Scholar] [CrossRef]
  84. Pearl, J. Probabilistic Reasoning in Intelligent Systems: Networks of Plausible Inference; Morgan Kaufmann Publishers: San Francisco, CA, USA, 1988. [Google Scholar]
  85. Borunda, M.; Jaramillo, O.A.; Reyes, A.; Ibargüengoytia, P.H. Bayesian networks in renewable energy systems: A bibliographical survey. Renew. Sustain. Energy Rev. 2016, 62, 32–45. [Google Scholar] [CrossRef]
  86. Hosseini, S.; Sarder, M.D. Development of a Bayesian network model for optimal site selection of electric vehicle charging station. Int. J. Electr. Power Energy Syst. 2019, 105, 110–122. [Google Scholar] [CrossRef]
  87. Schoemaker, P.J.H. Scenario planning: A tool for strategic thinking. Long Range Plan. 1995, 28, 117. [Google Scholar] [CrossRef]
Figure 1. Flowchart for selection of existing studies based on systematic literature review guidelines.
Energies 16 02074 g001
Figure 2. Geographic locations of existing studies for combined offshore wind and wave energy site selection (the areas represented in the rectangle and the triangle are related to two studies with considerable numbers of studied sites around the world). Note that a study performed for all offshore areas around the world [41] is not shown in this figure.
Energies 16 02074 g002
Figure 3. Graphical representation of restrictions (EX and EV refer to consideration type of criteria in literature, namely exclusion and evaluation, respectively).
Energies 16 02074 g003
Figure 4. Frequency of occurrence of EV criteria in the literature.
Energies 16 02074 g004
Figure 5. Flow diagram of methodologies used for combined offshore wind–wave energy farm site selection.
Energies 16 02074 g005
Figure 6. A summary of research gaps and recommendations for future studies.
Energies 16 02074 g006
Table 1. Used met-ocean dataset details.
DatasetDurationResolution (Temporal and Spatial)Reference
Observational data from buoysJan 2002–Jan 2005Hourly[17]
ECMWF 40 (ERA-40) Global wave forecast dataset1987–2009Wind: 3 h, Wave: 6 h
The data were interpolated in an area divided into 300 cells of 22 × 12 km of grid size.
[46]
WAM and REMOJan 1958–Dec 20013 h
WAM: 9.25 km × 9.25 km
REMO: 55.5 km × 55.5 km
[47]
WAM and REMOJan 1958–Dec 20013 h
WAM: 9.25 km × 9.25 km
REMO: 55.5 km × 55.5 km
[20]
ECMWF version of WAM and SKIRON atmospheric model2001–2010Hourly, 5.55 km × 5.55 km[19]
WAsP and SWAN2005–2015Hourly
An area of 134 km × 167 km with a resolution of 300 m × 300 m and a nested grid covering 8.5 km × 8.5 km with a resolution of 17 m× 17 m
[48]
CFSR and SWAN1997–20163 h
Wind: 37.05 km × 37.05 km
Wave: 0.888 km × 0.888 km
[49]
ERA2001–20166 h, 83.25 km × 83.25 km[37]
SWAN and WAsPFeb 2005–Jan 2015Hourly, 2.775 km × 2.775 km[50]
ERAJan 2005–Dec 20146 h, 83.25 km × 83.25 km[51]
SKIRON-Eta and WAM1995–20043 h, 11.1 km × 11.1 km[37]
SKIRON and WAM2001–2010Hourly, 5 km × 5 km[52]
NCEP CFSR and GOW21979–2015Hourly
Wind: 33.3 km × 33.3 km in the period of 1979–2010 and 22.2 km × 22.2 km in the period of 2011–2015
Wave: 27.75 km × 27.75 km
[41]
NCEP-CFSR and SWANWind: 1997–2016
Wave: 1999–2013
3 h
Wind: 34.63 km× 34.63 km
Wave: 8.88 km × 8.88 km
[53]
SKIRON-Eta and WAM1995–20043 h, 11.1 km × 11.1 km[54]
NCEP-CFCR and SWAN1987–2016Wind: 34.6 km × 34.6 km
Wave: 148 m and 37 m
[55]
ECMWF ERA-Interim2005–2014Wind: 3 h
Wave: 6 h
60 km × 50 km
[56]
ECMWF ERA-InterimJan 2000–Dec 20166 h, 82 km × 82 km[36]
Wind: WRF 3.3.1 model forced by CFSR
Wave: WaveWatchIII forced by WRF
1979–2016Hourly, 10 km × 10 km[57]
Observational data from buoys2009–2019Hourly[58]
Wind: Reginal climate simulations within CORDEX project under the RCP8.5
Wave: Dynamically downscaled of SWAN simulations forced by MIROC5GCM
2026–2045Daily, 12.21 km × 12.21 km[59]
Hindcast wind: WRF forced by CFSR
Hindcast wave: WaveWatchIII
Forecast wind and wave:
Ensemble of nine models of GCM-RCM provided by EURO-CORDEX
under the climate change scenario of RCP8.5
Hindcast wind:
Jan 1979–Dec 2020
Forecast: 2030–2060 and 2070–2100
Hindcast of wind and wave:
Hourly, 10 km
Forecast wind:
6 h, 12.5 km
Forecast wave:
3 h, 14.1 km × 9.99 km
[60]
ERA5 produced by ECMWFJan 2000–Dec 2019Hourly
Wave: 55.5 km × 55.5 km
Wind: 27.75 km × 27.75 km
[61]
ECMWF2016–202013.88 km × 13.88 km[40]
Wind: NASA QuikSCAT satellite measurements
Wave: Furgo-OCEANOR wave data originated by ECMWF WAM
Wind: 1999–2010Hourly, 27.75 km × 27.75 km[62]
ERA5 the latest global
150 atmospheric reanalysis product from ECMWF WaveWatchIII
2000–2018Wind: Hourly, 31 km
Wave: 6 h, 11.1 km × 11.1 km
[39]
Wave: WaveWatchIII model undertaken by CAWCR
Wind: CFSR
2014–2020Hourly, 7 km × 7 km[38]
Table 2. Criteria used for evaluation, their relevant category, and frequency of mentions in the literature.
CategorySub-CategoryCriteriaNo.
Techno-EconomicWind energy resource richnessWind Power, WP20
Wind Speed, WS6
Suitability Index of wind resource calculated based on percentage of time in which WP and Hs (significant wave height) are in acceptable range, SIWind R1
Total time with useful WS, DWNTwind (%)1
Rich level occurrence, RLOwind (%)1
Wave energy resource richnessWave Energy Power, WEP (kW/m)25
Significant wave height, Hs (m) and mean wave period, Tz (s)2
Suitability Index of wave resource calculated based on percentage of the time in which the WEP, Hs, and Tp are in the acceptable range, SIwave R1
Total time with useful Hs, DWNTWave (%)1
Combined offshore wind–wave farm richnessMean Capacity Factor of combined energy farm, CFcomb1
Downtime or non-production time of combined energy farm, DT1
Resource variabilityCoefficient of Variation, COV11
Monthly Variation, MV5
Seasonal Variation, SV4
Skewness, S4
Kurtosis, K3
Standard Deviation, SD4
Resource complementarityCross-Correlation Factor, CCF11
Complementarity indexes1
Devices’ survivabilitySuitability Index of structural survivability of wind device calculated based on the acceptable range of 50-year return period of significant wave height (Hs50), Wind Speed (WS50) and current velocity (C50), SI Wind S1
50-year return period wind speed, WS501
Suitability Index of structural survivability of the wave device calculated based on the acceptable range of 50-year return period of significant wave height (Hs50) and current velocity (C50), SI Wind S1
50-year return period significant wave height, Hs501
Foundation/anchoring design of devicesWater depth, WD14
Logistics (feasibility of installation, operation, and maintenance)Suitability Index of logistics calculated based on the acceptable range of Distance from Port (DP), and the percentage of time in which WS and Hs are in the acceptable range, SI Log1
Distance from Port, DP9
Transmission cost and energy dissipationDistance from Shore, DS9
Distance to the Local Electrical Grid, DLEG2
Voltage Capacity of Closest available Grid, VCCG3
EconomicPrioritizing different countries based on the feed-in tariffIncentives: Feed-in tariffs of different countries located around the study region1
Socio-EconomicSupplying energy demandPopulation Served, PS2
Electricity Demand, ED1
EnvironmentalImpact of offshore renewable energy farms on the environmentEnvironmental Performance Value, EPV1
Impact of considering human activities and environmental vulnerability in the site selection processCumulative Impact Index, CII1
Impact of noise on the growth of marine animals due to low frequency of sound wavesDistance from Aquaculture Area, DAA1
Impact of hitting birds by turbine bladesDistance from Nature Conservation Areas, DNCA1
Table 3. COWWEF site selection analytical methods used in the literature.
Used MethodData ValidationVariabilityCorrelation Weighting MethodNormalizationGISCA and
PCA
Results ValidationReference
EqualSubjectiveDelphiAHPFAHPSensitivityOther
MCDM [46]
[47]
[20]
.[19]
[48]
[50]
[42]
[54]
[41]
[56]
[59]
[40]
[62]
[39]
Resource-based Analysis [17]
[60]
[61]
[49]
[51]
[37]
[52]
[53]
[55]
[36]
[57]
[58]
[38]
The signs of and mean that the mentioned method/criterion was used/not used in the corresponding reference.
Disclaimer/Publisher’s Note: The statements, opinions and data contained in all publications are solely those of the individual author(s) and contributor(s) and not of MDPI and/or the editor(s). MDPI and/or the editor(s) disclaim responsibility for any injury to people or property resulting from any ideas, methods, instructions or products referred to in the content.

