Article

Examination of the Structure and Definition of the Mechanism of Formation of Products by Pyrolysis of Tarim Crude Oil

College of Science, China University of Petroleum, Beijing 102249, China
*
Author to whom correspondence should be addressed.
Energies 2023, 16(4), 2073; https://doi.org/10.3390/en16042073
Submission received: 30 December 2022 / Revised: 3 February 2023 / Accepted: 11 February 2023 / Published: 20 February 2023

Abstract

:
Pyrolysis of crude oil is an important way to generate natural gas. However, the current analysis of pyrolysis gas carbon isotopes and the study of gas generation dynamics are not unified, and the genesis and accumulation of gas reservoirs are needed to conduct in-depth discussions. Therefore, Tarim crude oil samples in China were selected to perform thermal simulation experiments using an autoclave. The pyrolysis hydrocarbon production yield, carbon isotope characteristics and gas-generation process of crude oil samples in Tarim Basin were studied by GC-MS, FT-IR and carbon isotope analysis, respectively. The compositions of the Tarim Oilfield were determined, including the 83.69% content of hydrocarbons, the 14.08% content of aromatic compounds, and lower than 3% content of heteroatom compounds. The non-monotonic linear relationship of C2-5 isotopes may be due to the complexity of crude oil, and the formation of gaseous hydrocarbons can be divided into three stages. The results showed that the δ13C distribution range of C2-5 hydrocarbons was −40.5% to −10.5%, and the δ13C distribution of methane was −53.3% to −27.4%. The lowest δ13C value for methane occurs at 350 °C, and the corresponding carbon isotope value is −53.3%. When the pyrolysis temperature range is 250–300 °C, crude oil undergoes volatilization and preliminary pyrolysis, and the C4-5 output exceeds 95%. When the temperature rises to 300–500 °C, the aliphatic hydrocarbon chain in crude oil begins to crack, the side and branch chains of aromatic and heteroatomic compounds are broken, and C4-5 begins to crack to form C1-3. Finally, the temperature rises to 500–600 °C, and C3-5 begins to deeply crack into C1-2, and eventually all is converted to methane.

1. Introduction

Pyrolysis of crude oil is an important way to generate natural gas. It is the mainstay of large oil and gas reserves as an important material basis for the formation of late gas reservoirs [1,2]. Many scholars have specialized discussions on the process of crude oil pyrolysis to produce natural gas. The general trend of organic matter evolution is to evolve from large molecules with complex structures to small molecules with stable structures with the increase of temperature and pressure in the formation. The pyrolysis of crude oil under high temperature and high pressure is in line with the evolution trend of organic matter, which is a process of reducing free energy and contributes greatly to the formation of natural gas [3,4,5,6,7]. Natural gas is an important chemical raw material and fuel, which can be used for power generation, fuel, etc., and to produce propane and butane, important raw materials for modern industry.
Crude oil development technology at home and abroad has been very advanced. China has perfect self-injection and mechanical oil production technology [8,9]. Scientists from Iran, for example Fetisov V. G., proposed a vapor recovery device to improve the economic efficiency of hydrocarbons [10]. Ilyushin, Y.V. proposed the development of a Process Control System for the Production of High-Paraffin Oil [11].
Studying the formation of crude oil pyrolysis gas has great value and significance for the exploration and development of crude oil and natural gas and has become a key research object for scholars at home and abroad. In recent years, the research on pyrolysis kinetics and the analysis and evaluation of crude oil pyrolysis gas has made some progress. However, the current analysis of pyrolysis gas carbon isotopes and the study of the formation mechanism of gaseous hydrocarbons lack the unity of the two theories, and this makes it impossible to deeply explore the causes and development of gas reservoirs.

1.1. Pyrolysis Mechanism of Crude Oil

Crude oil pyrolysis is a dynamic process with multiple parallel reactions and complex reaction mechanisms [12,13,14,15]. It is based on the kerogen pyrolysis process with free radical reaction mechanisms, including an initiation of free radical excitation reactions, hydrogen transfer reactions between molecules and free radicals, fracture reactions between free radicals, free radical addition reactions, and termination reactions, etc. [16].
The crude oil pyrolysis process is as follows:
(1)
Depolymerization reaction: chain break in recombinant branches is the mainstay, mainly the break of C-O and C-S bonds, mainly generating soluble unsaturated organic matter;
(2)
C-C bond breaking reaction: C6+ saturated hydrocarbons crack to generate small-molecule saturated hydrocarbons and C14+ aromatic hydrocarbons;
(3)
Demethylation reaction: C14+ aromatic hydrocarbon demethylation to generate gaseous hydrocarbons and coke;
(4)
C-C bond breaking reaction: C-C bond breaking in C3-5 produces CH4 and C2.
Using C15+ pyrolysis as an example, the reaction process is as follows in Figure 1:
Uguna et al. [17] selected the n-hexadecane rich crude oil to conduct pyrolysis experiments at high temperatures and pressures. The experimental results showed that the free radical reaction mechanism could be used to predict the pyrolysis product composition of pure n-hexadecane. According to the kinetic theory of crude oil pyrolysis proposed by Behar et al. [18], the pyrolysis process of crude oil at high temperatures and pressure can be divided into the depolymerization reaction, C-C bond breaking, and the demethylation reaction. Hill et al. [19] proposed that the conservation of elements would affect the formation of products during pyrolysis, among which methane was the most stable form. The conservation of elements requires that the product should be produced in the direction of a higher hydrocarbon ratio or higher carbon content.

1.2. Crude Oil Analysis Technology

The relatively complex composition of crude oil contains abundant macromolecular fingerprint fossil information, which can be separated and characterized with the aid of GC-MS, NMR, FT-IR, etc. Riley et al. [20,21] used FT-IR to characterize the asphaltenes extracted from crude oil and to classify the oil samples through the ratios of the peak heights in two wavelengths to identify oil samples from different sources. Oudot et al. [22] used GC-MS to analyze biomarkers such as steranes, terpenes, and pinane in crude oil, and to study asphaltenes and biomarkers in the Amoco-Cardis spill. Wang et al. [23] used full two-dimensional gas chromatography time-of-flight mass spectrometry and standard samples to characterize 28 C9-C10 light hydrocarbon compounds in crude oil. Mair et al. [24] separated C2 alkyl-substituted naphthalenes, alkyl-substituted naphthalenes, biphenyls, methyldihydrofluorene and benzothiophene in crude oil. Qualitative analysis was performed with the aid of GC-MS, NMR, and FT-IR. Mühlen et al. [25] and Flego et al. [26] applied full two-dimensional gas chromatography time-of-flight mass spectrometry to separate and characterize nitrogen compounds such as indole, carbazole, quinoline, and iso-quinoline in crude oil. Li et al. [27] detected a variety of sulfur compounds including dibenzothiophene and its alkyl substituents in crude oil and performed qualitative and quantitative analysis. Ioppolo-Armanios et al. [28,29] used chromatography and chromatography-mass spectrometry to identify and quantify phenol, alkylphenol compounds, and isopropyl methylphenol compounds in Australian crude oil samples. Wang Qing et al. [30] found through FT-IR that the main volatiles in the pyrolysis process are C2+ aliphatic hydrocarbons, CO2, CO, CH4, C2H4, and C-O and C=O. Iskenderova et al. [31] and Kaanagbara et al. [32] applied spectroscopic techniques to discover that the gaseous volatiles produced by the pyrolysis of transformer oil are methane (CH4), ethane (C2H6) and small hydrocarbons.
Compared with crude oil, gaseous products of crude oil pyrolysis with relatively single components and structures do not contain a macromolecular organic structure. The carbon isotope characteristic information of gas components from crude oil pyrolysis can be used to analyze rich fingerprint information such as the evolution and migration of crude oil source rocks and a geological accumulation environment [33], which is of great significance to the exploration and development of large oil and gas fields. Carbon isotope fractionation was accompanied during the evolution of primitive organic matter into oil and gas resources in the complex geological environment in the Middle Ages [34,35]. Therefore, the difference in bond energy between 12C-12C and 12C-13C leads to fractionation of carbon isotopes of methane containing homologous matter generated by organic matter during the maturation process of geological migration [36], and the δ13C value of organic matter also increases with the maturity of organic parent material. The maturity of organic matter varies regularly from the biochemical stage to the oil generation stage to the maturity stage, and the composition of pyrolysis gas also varies regularly from dry gas to wet gas to dry gas. According to the exploration data and carbon isotope fractionation research, the δ13C value of methane, including homologues in coal type gas and oil type gas, will increase as the organic matter maturity increases, which means that the methane of pyrolysis gas evolves towards the δ13C isotope enrichment [37]. This isotope characteristic theory can be used to infer the origin of pyrolysis gas and the maturity of organic source rock [38,39,40].
In this manuscript, the crude oil sample from the Tarim region in China was selected, and pyrolysis experiments on the formation of gaseous hydrocarbons were conducted using an autoclave at different temperatures. The Tarim crude oil sample was characterized with the aid of GC-MS and FT-IR. Gas composition and δ13C distribution of gaseous products (C1-5 hydrocarbons) of crude oil pyrolysis at different temperatures were determined by using GC and carbon isotope analysis. Based on the experimental results, the formation mechanism of gaseous hydrocarbons during Tarim crude oil pyrolysis was discussed.

2. Experimental

2.1. Material

The crude oil used in the experiment were collected from the Zhonggu No. 101 well area in the Tarim area 1 of the Xinjiang Oilfield, and the basic properties of crude oil used are shown in Table 1.

2.2. Pyrolysis Experimental Apparatus and Steps

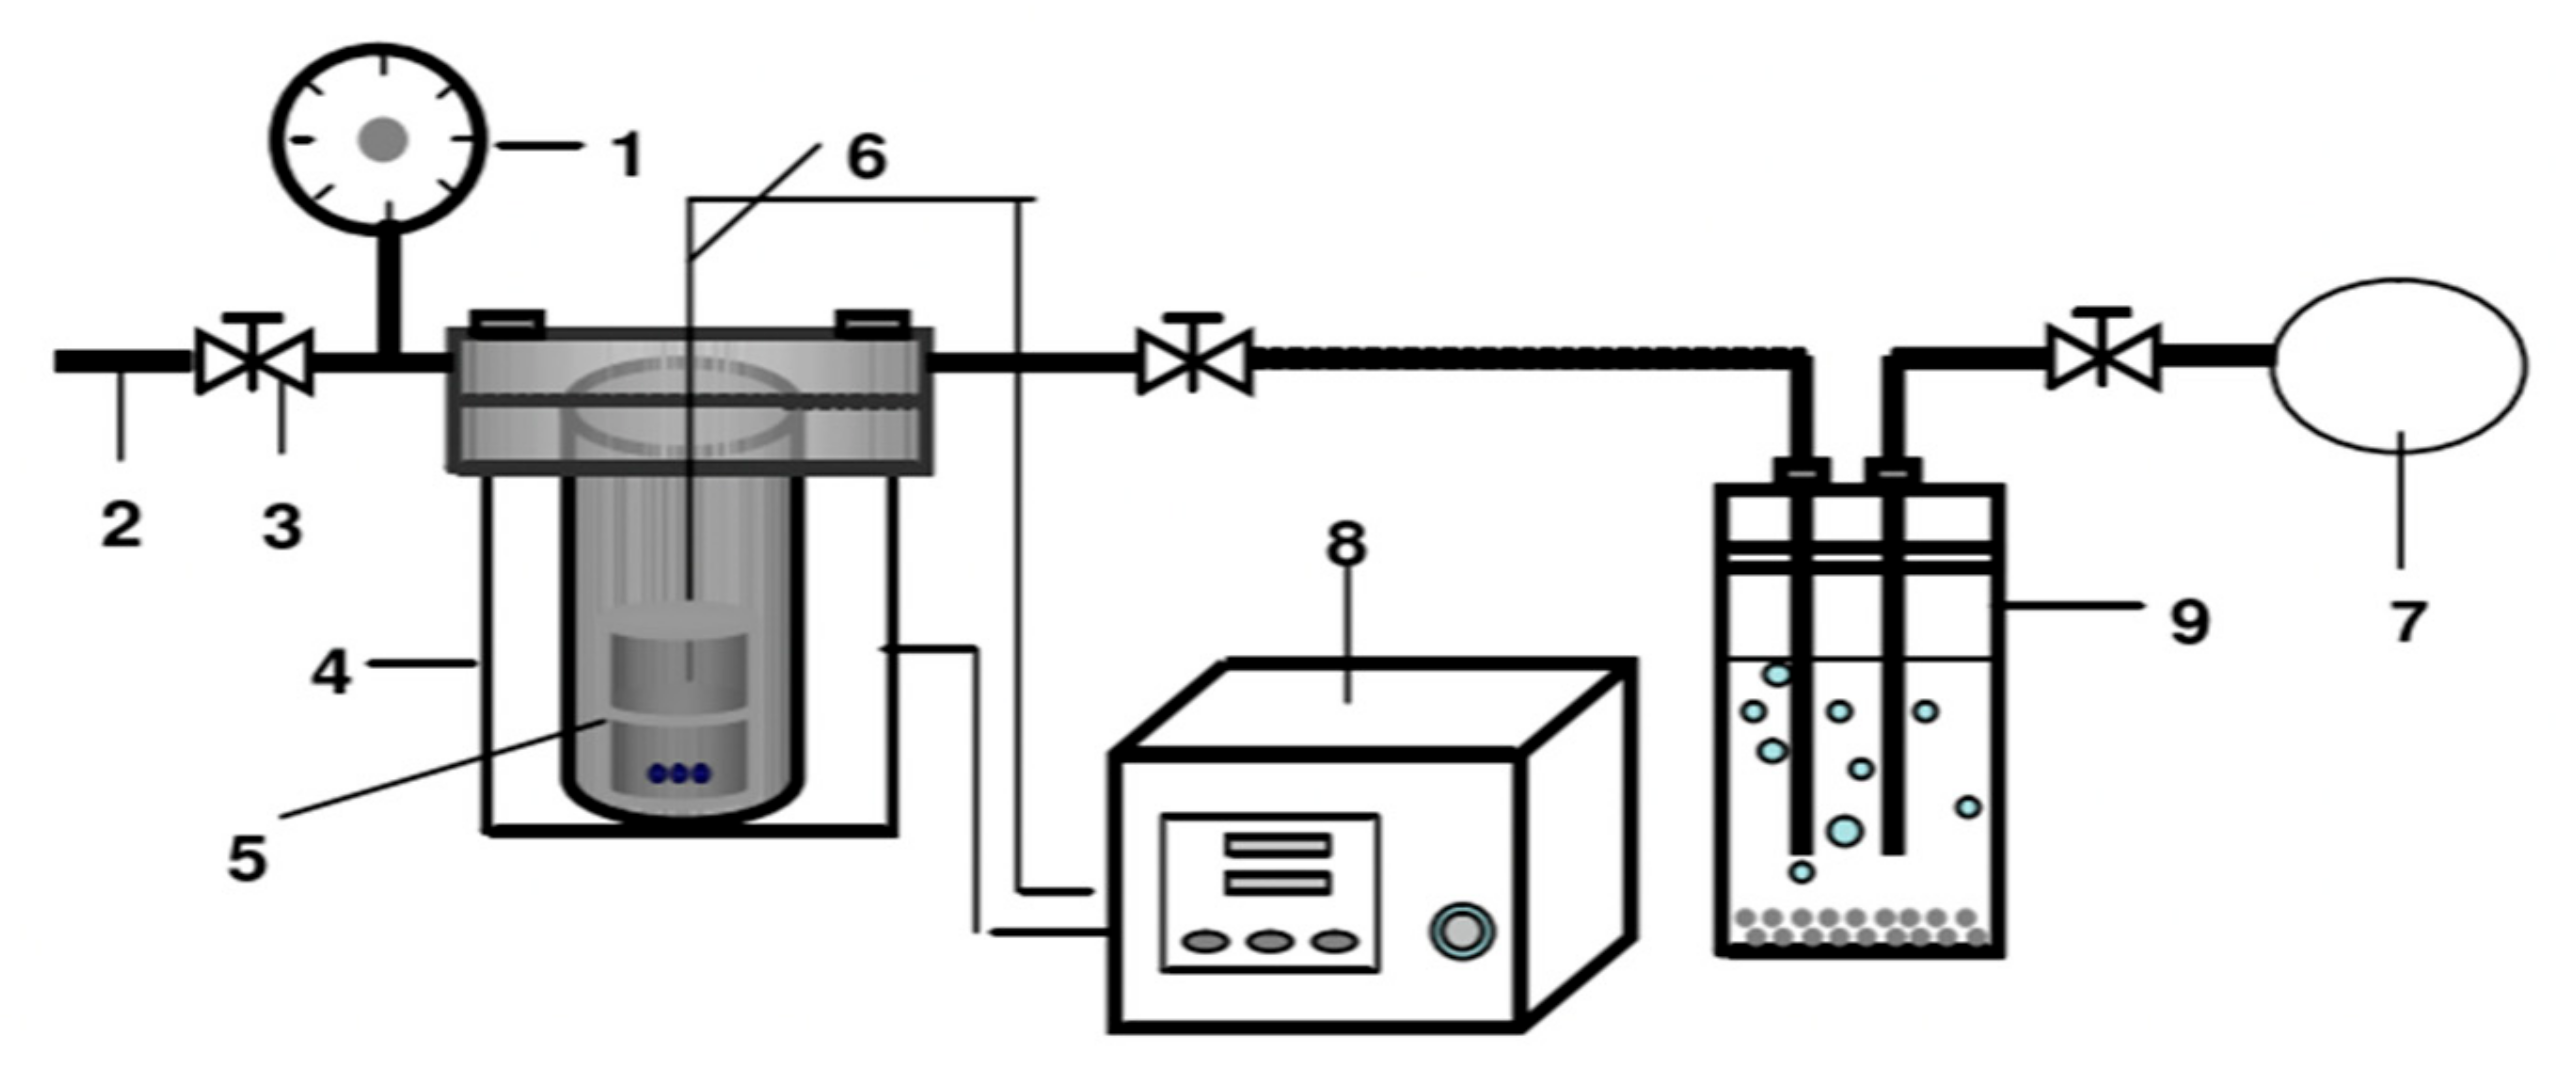
All experiments in Tarim crude oil pyrolysis illustrated in Figure 2 were carried out at high temperatures and pressures in an autoclave. The experimental device consists of an autoclave with a height of 100 mm and a diameter of 50 mm, gas circuit and sampling system. The autoclave is a vertical reactor made of a stainless-steel tube with a volume of 200 mL. The sample basket is a quartz cylinder with a height of 80 mm and a diameter of 10 mm. The quartz cylinder has a bottom to hold Tarim crude oil and its other side is left open, and it is placed on the bottom of the autoclave.
In each run, the quartz cylinder with 50 mL of Tarim crude oil was put into the autoclave, and then the autoclave was vacuumed through an outlet point. The autoclave was filled with high-purity argon to increase the pressure to 3 MPa. By using the full-load heating method, the feedstock was heated to the designed reaction temperature, and then the temperature was kept constant for a certain period of time. The reaction temperatures were 250 °C, 300 °C, 350 °C, 400 °C, 450 °C, 500 °C, 550 °C, and 600 °C, respectively. Correspondingly, constant times were 120 h, 96 h, 72 h, 60 h, 48 h, 36 h, 24 h and 12 h, respectively. At the end of the reaction, the autoclave was cooled to the room temperature in the air, and the gaseous product was collected using the drainage method.

2.3. Characterization of Feedstock and Gaseous Products

FT-IR analysis: 1 mg Tarim crude oil was evenly applied on a KBr tablet and dried by an infrared lamp. Then it was placed in a Bruker 80 v vacuum Fourier infrared spectrometer for measurement. All spectral peaks were recorded from 4000 cm−1 to 400 cm−1 using the Nicolet FT-IR spectrometer. The average number of scans per spectrum was 32 and the resolution was 4 cm−1.
GC-MS analysis: The composition and content of organic matter in Tarim crude oil were analyzed by Trace DSQ chromatography mass spectrometer. The carrier gas was helium, the column model was HP-FFAP, the vaporization temperature was 250 °C, the bombardment voltage was 50 eV, and the scanning range was 20–300 D. The temperature was kept constant for 3 min at an initial temperature of 25 °C, then increased to 250 °C at the rate of 10 °C/min, and kept constant for 10 min.
GC analysis: Agilent 6890 GC equipped with a thermal conductivity detector, a flame ionization detecto, and five mixed columns (capillary columns and packed columns) was used to analyze the gaseous products. The temperature of the detector was 250 °C. The temperature of the oven was heated to 100 °C at a heating rate of 5 °C/min after at 50 °C for 3 min, and then to 180 °C at a heating rate of 10 °C/min, and the residence time was 3 min.
Carbon isotope analysis: Carbon isotope analysis of gaseous products was conducted on a Thermo Scientific MAT-253 isotope mass spectrometer equipped with a Trace GC chromatograph. Gas components were separated on the gas chromatograph in a stream of helium, converted to CO2 in a combustion reactor at 941 °C and then introduced into the mass spectrometer. Individual hydrocarbon components (C1-C5) were initially separated using a fused silica capillary column. The GC oven temperature was kept constant for 5 min at an initial temperature of 50 °C, and increased to 150 °C at the rate of 5 °C/min.

3. Results and Discussion

3.1. FT-IR Analysis of Tarim Crude Oil

Figure 3 shows the infrared spectra of Tarim crude oil, and Table 2 lists the analysis results of the main vibration peaks. Strong absorption peaks are observed at 2930–2850 cm−1 and 1460–1370 cm−1, and they are determined as methyl and methylene absorption peaks according to the characteristics of the peaks, including the variable-angle vibration peaks of alkane -CH2 and the asymmetric variable-angle vibration peaks of -CH3. There is an obvious strong peak at 1462.73 cm−1, indicating that there are more -CH2, which might be long-chain hydrocarbon and aliphatic compounds. The peak at 1604–1706 cm−1 indicates the stretching vibration of the C-O double bond and the C-C double bond. The peak at 868 cm−1 represents the characteristic absorption peak of bending vibration outside the C-H surface of a benzene ring, which may contain a benzene ring or benzene derivatives. The peak at 746 cm−1 is the characteristic peak of an amino group. The peaks at 871–863 cm−1 are characteristic peaks of the S-C-S stretching vibrations, suggesting that they may also contain sulfides. This is consistent with the study of Tarim heavy oil by Ping Wen et al. [41].
Aliphatic carbon absorption peaks of Tarim crude oil are obvious, indicating that Tarim crude oil is mainly composed of long-chain aliphatic hydrocarbons. Single-bond stretching vibration absorption peaks are stronger than double-bond stretching vibration peaks, indicating that aliphatic hydrocarbons have more saturated hydrocarbons than unsaturated ones. The C-O double bond stretching vibration peak is relatively obvious, which means that the content of oxygenated compounds in heteroatom compounds is relatively high. FT-IR characterization can only provide functional group information for structural analysis of organic compounds; other characterization methods such as GC-MS need to be combined.

3.2. GC-MS Analysis of Oil Fraction of Tarim Crude

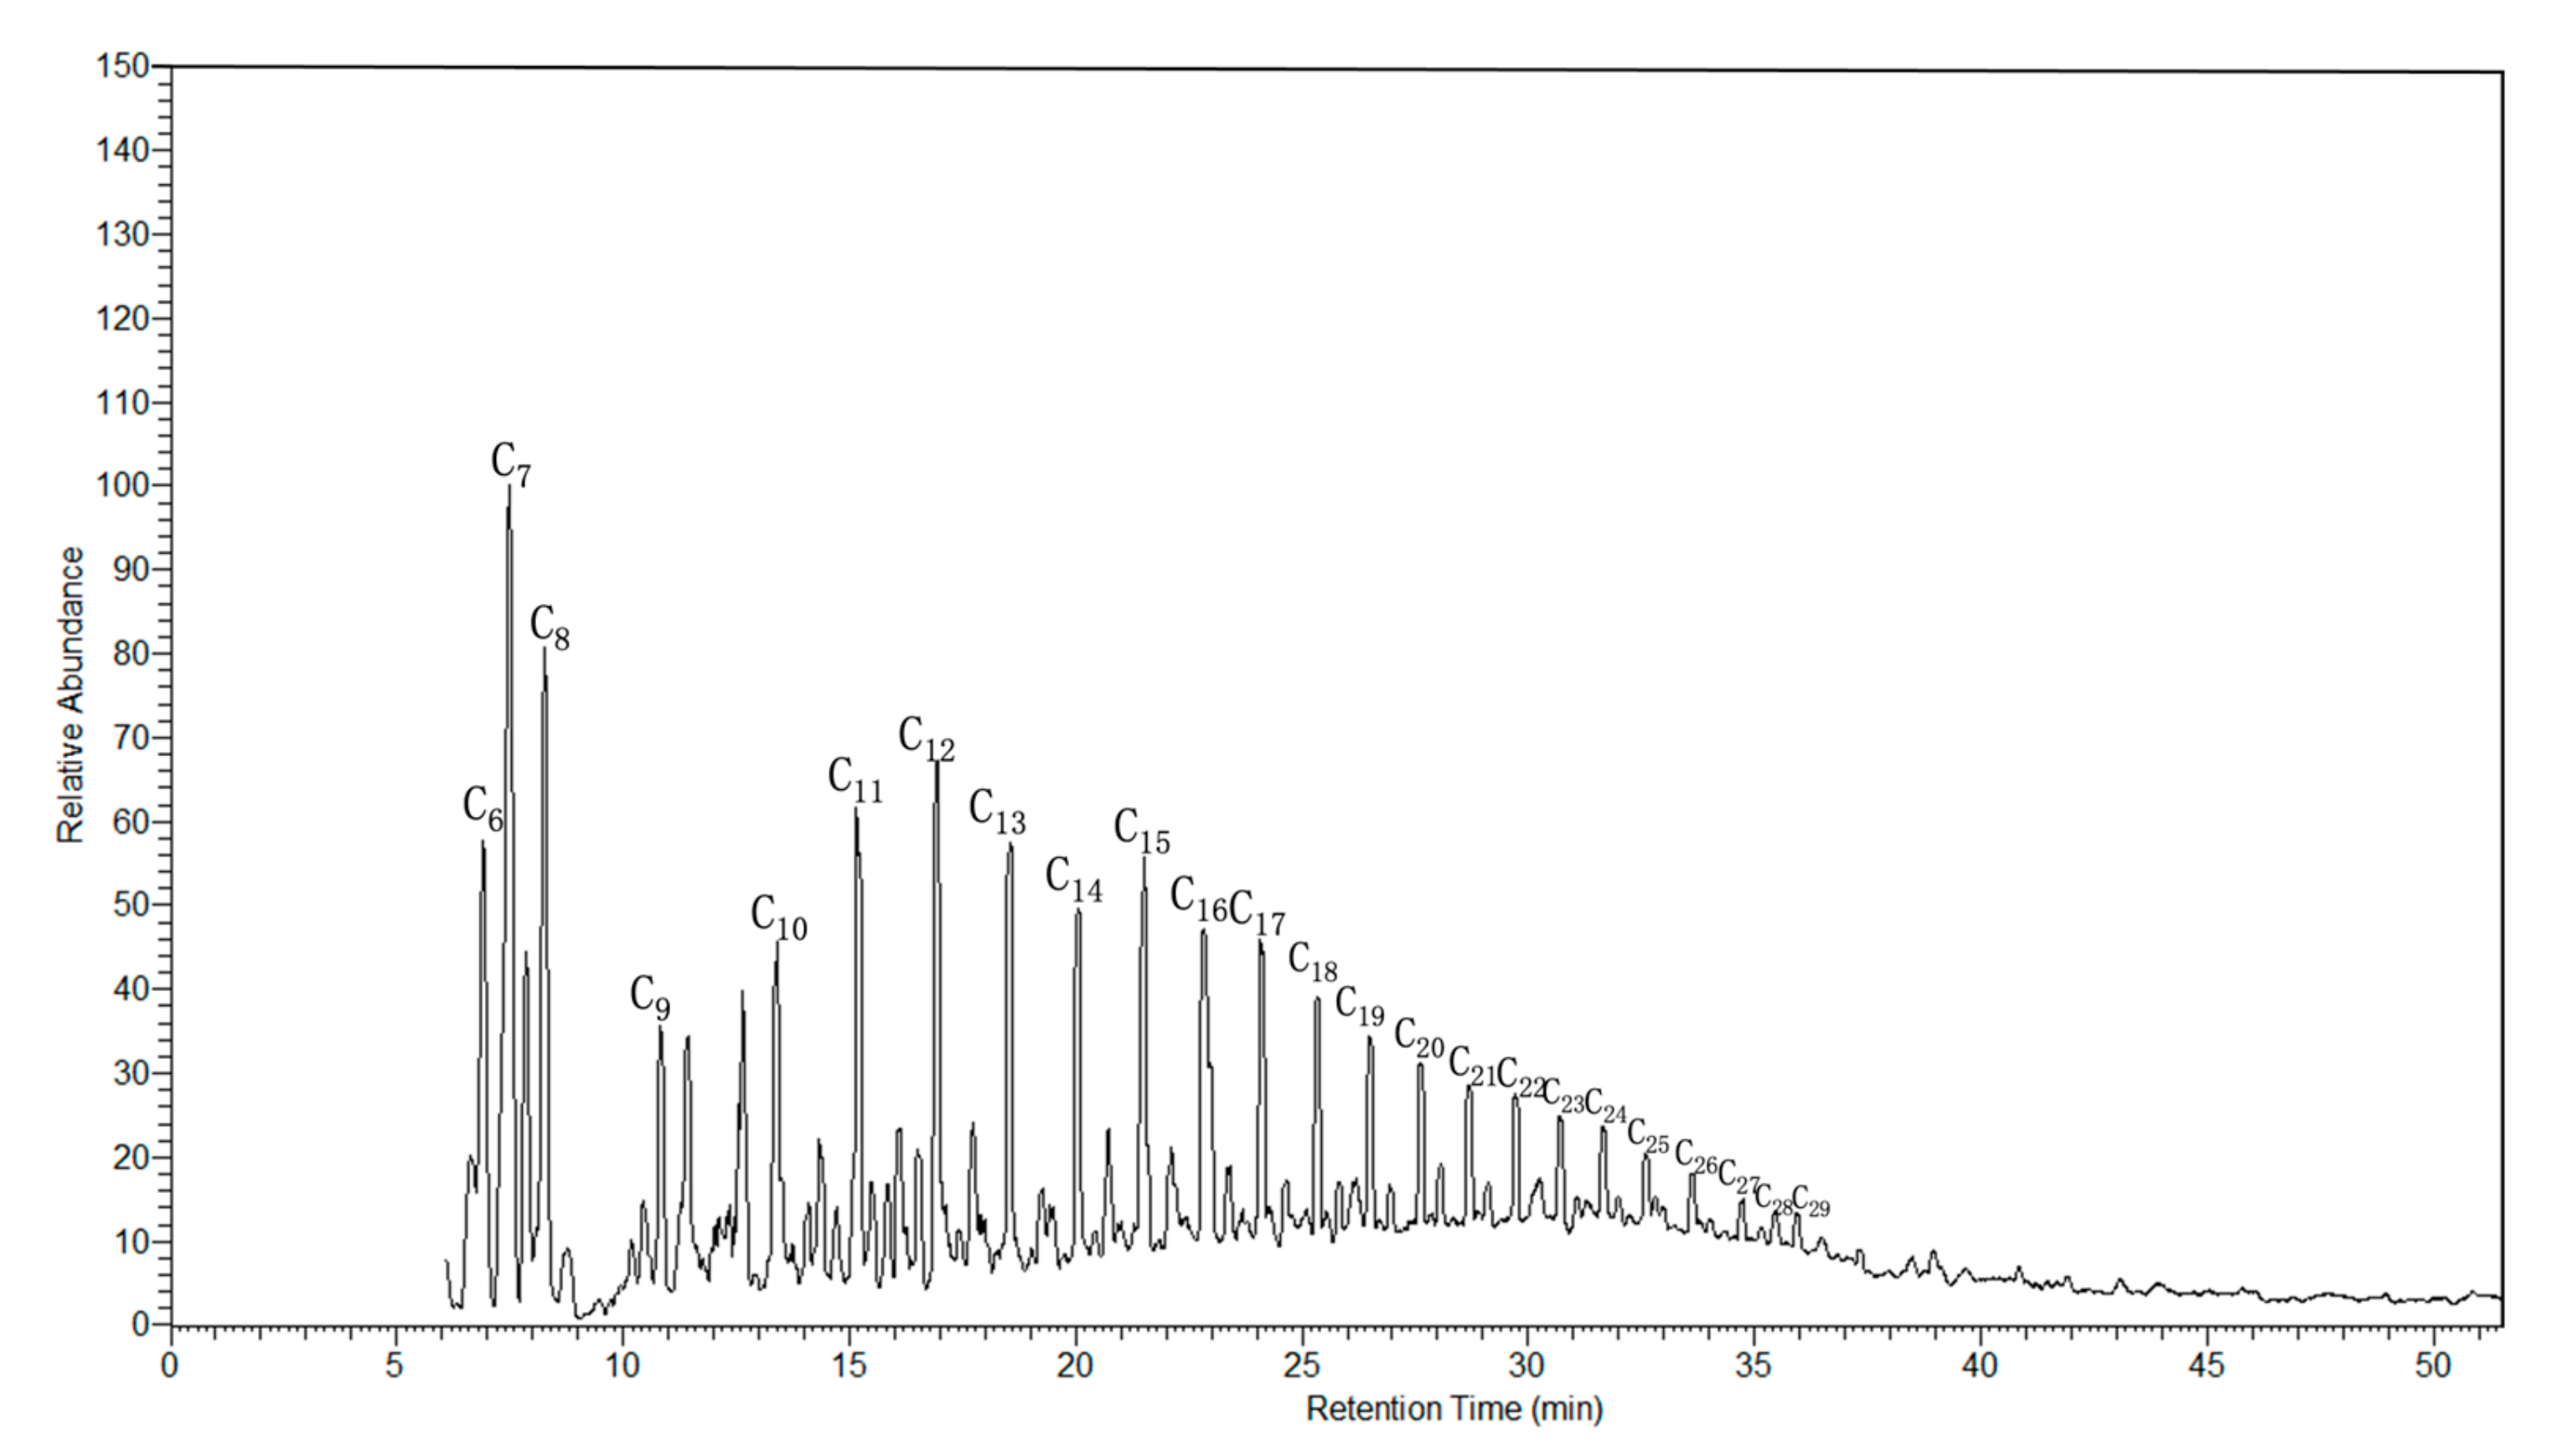
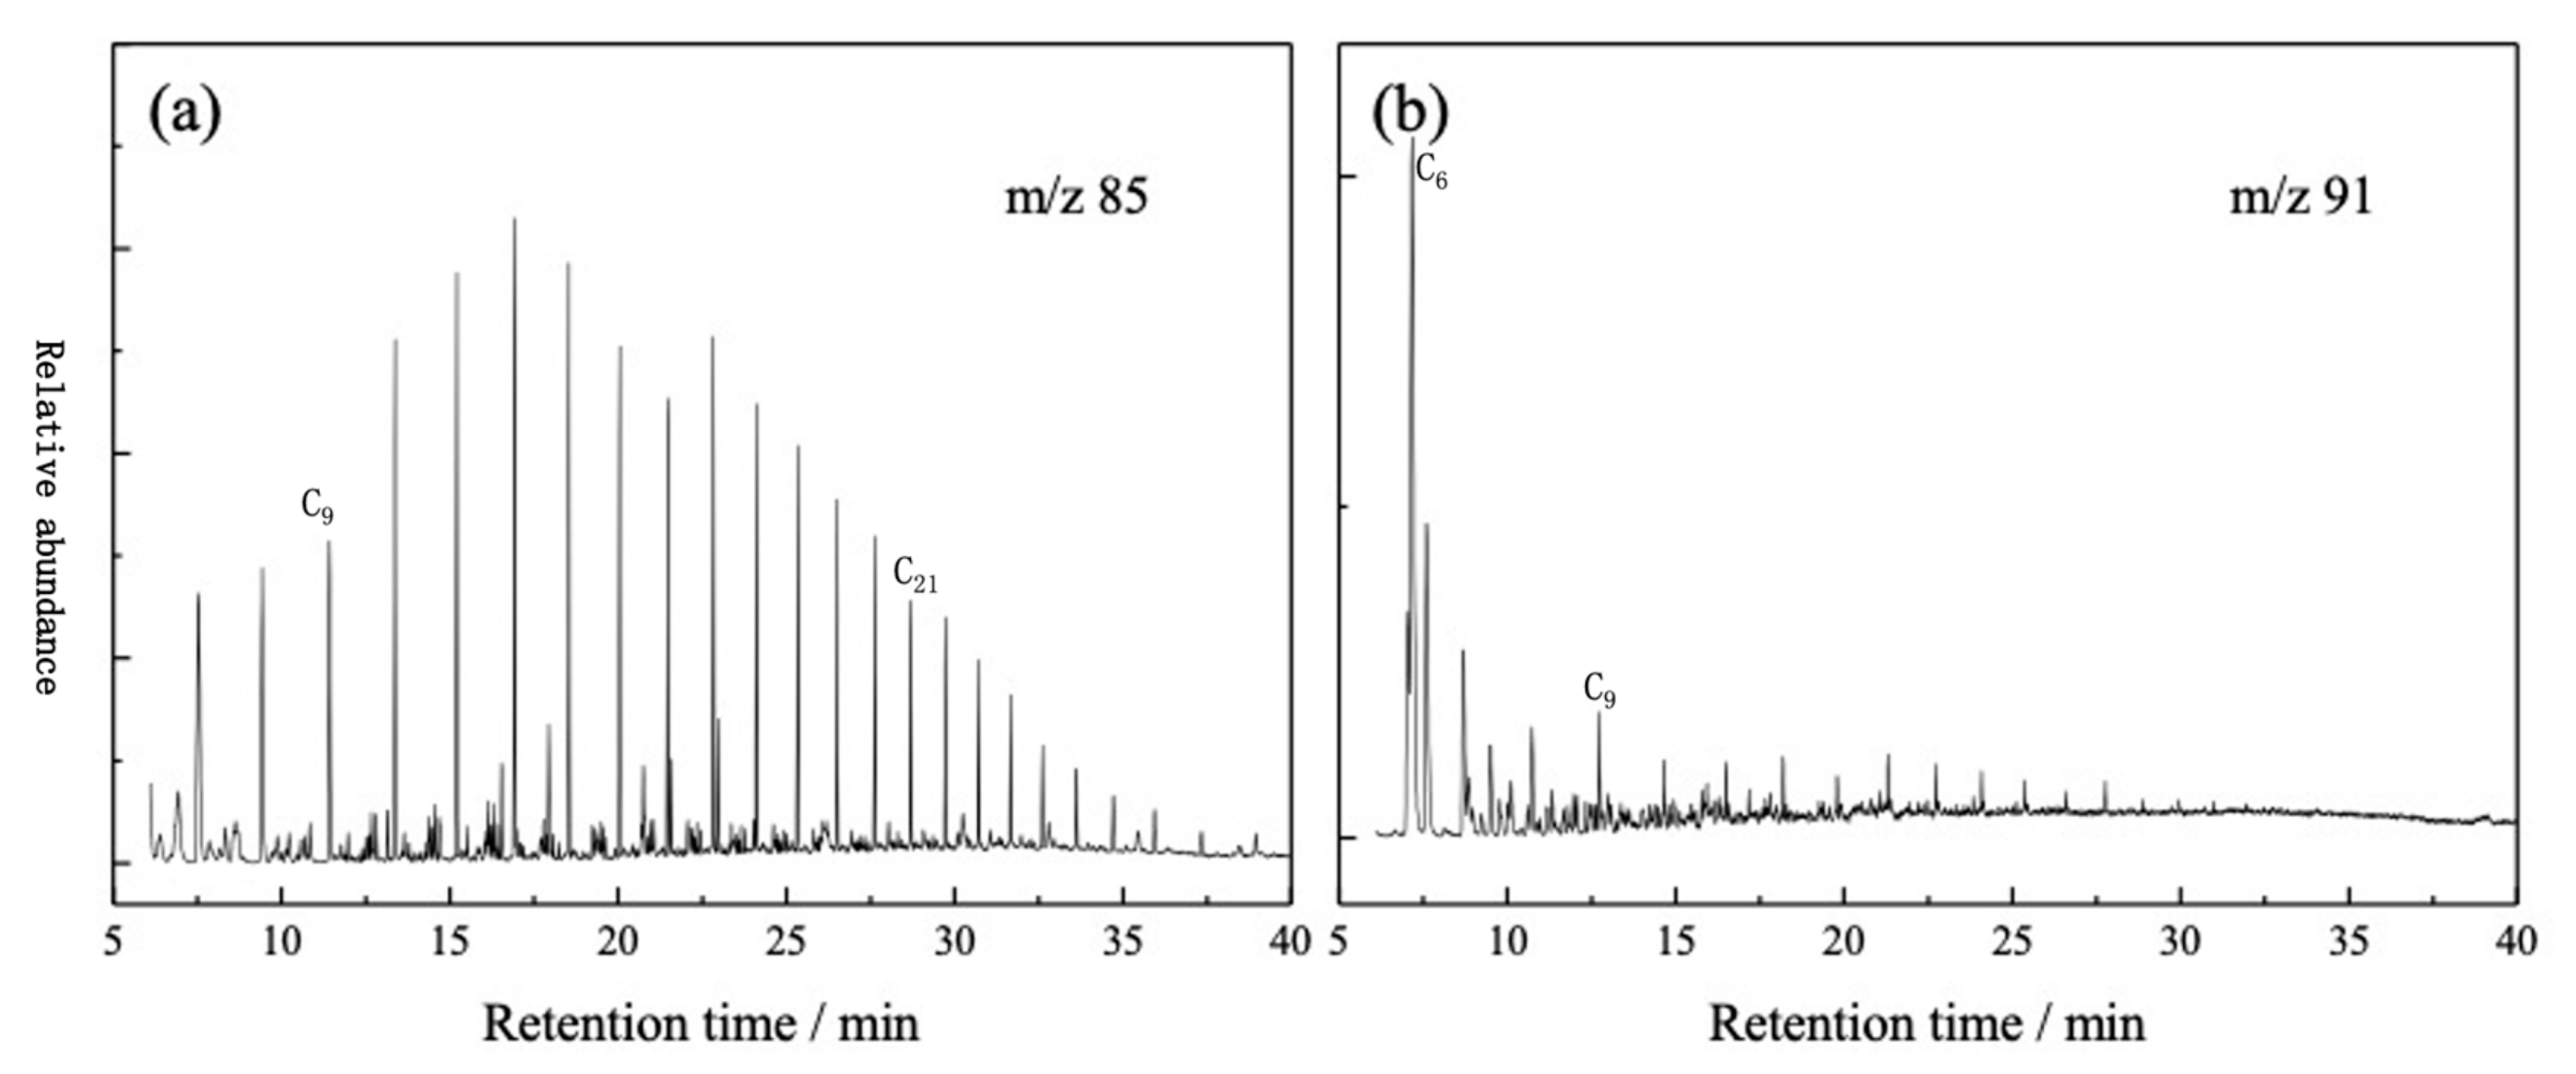
The total ion chromatogram of an oil fraction of Tarim crude was demonstrated in Figure 4. The carbon chain length of organics is about C6-C29, and most of the organics are distributed between C7-C22. According to the differences of mass-to-charge ratios, a detailed analysis can be conducted on the organic compounds and quantitative composition of the oil fraction of Tarim crude. Taking a m/z of 85 and 91, the ion current spectra of normal paraffins and aromatic hydrocarbons were separated, as shown in Figure 5. Obviously, it can be seen that n-alkanes are mainly distributed in the range of C9-C21, and the content of the remaining carbon chain length is less. Aromatic hydrocarbons mainly have peaks between C6-C9, and they are mainly phenols, ketones, aldehydes and their derivatives, while fused ring aromatic hydrocarbons such as naphthalene, anthracene and their derivatives have no obvious characteristic peaks.
If the mass-to-charge ratios are 79, 93 and 129, the ion current spectra of nitrogen compounds of pyridine, aniline, indole, and quinoline derivatives were separated, as shown in Figure 6. The pyridine spectrum mainly has a slight peak between C6-C9, and the aniline spectrum has no obvious characteristic peaks. The quinoline spectrum has slight characteristic peaks between C7-C13.
Taking a m/z of 47 and 83, ion chromatograms of sulfur compounds such as thiols and thiophene compounds were separated, and the results are demonstrated in Figure 7. It is difficult to observe the characteristic peaks of thiols and thioethers, indicating that the content of non-thiophene heteroatom sulfides is low. The thiophene compounds are mainly widely distributed between C6-C26.
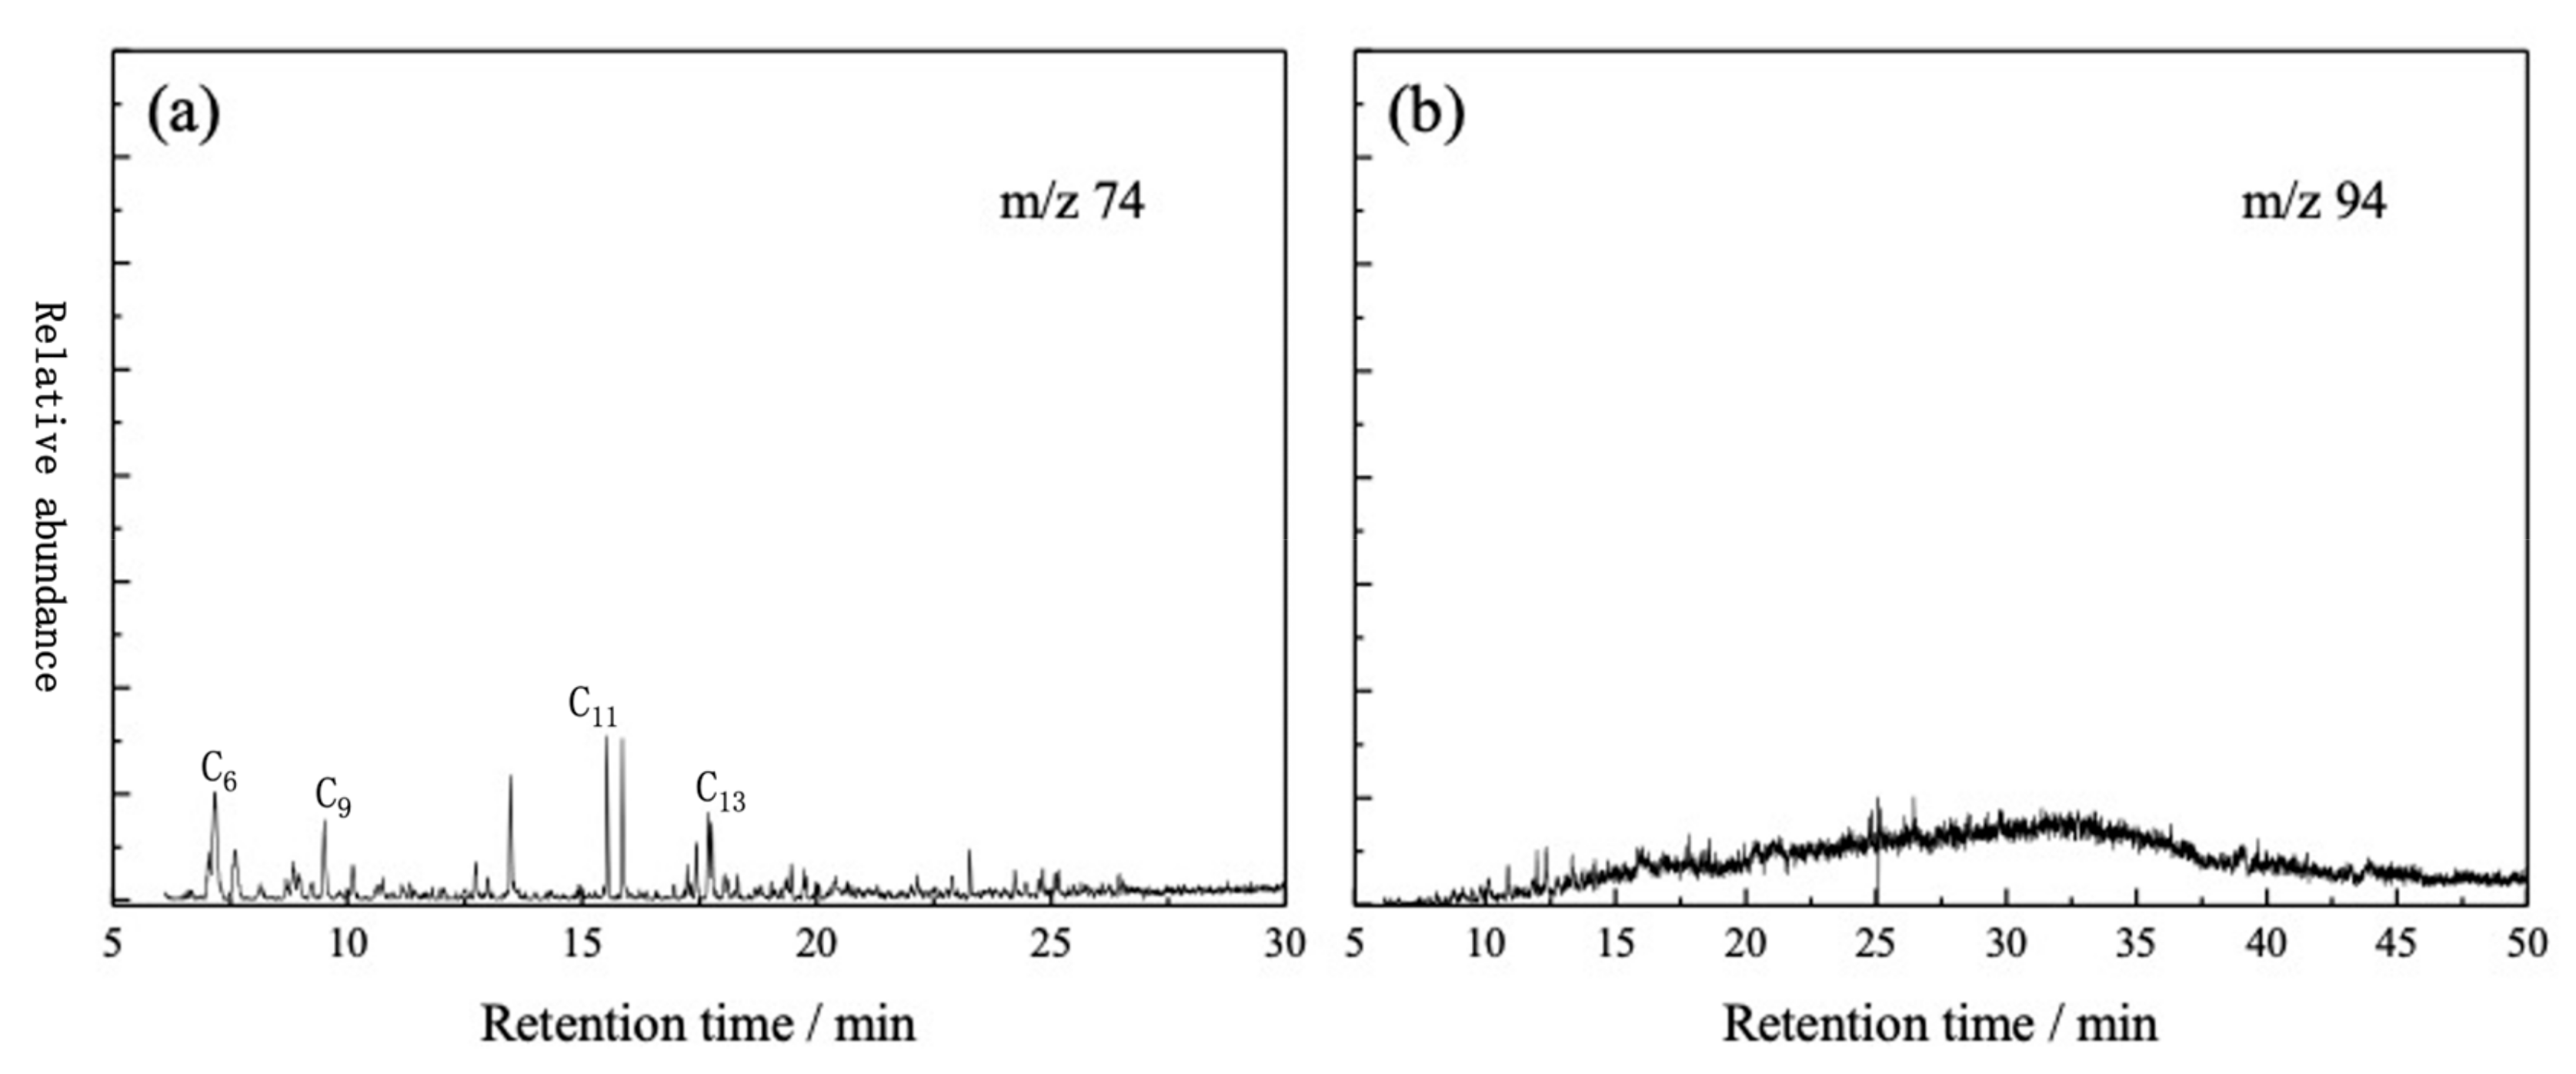
Taking a m/z of 74 and 94, the ion current spectra of oxygen compounds and their derivatives, including carboxylic acids, esters, and phenol, were isolated. The results are illustrated in Figure 8. The carboxylic acid and ester compounds have two distinct characteristic peaks, which are mainly distributed between C6-C9 and C11-C13. At the same time, it is difficult to observe obvious characteristic peaks of phenol and its derivatives.
Relative contents of each component of Tarim crude oil are summarized in Table 3. Tarim crude oil is mainly composed of hydrocarbon compounds, accounting for 83.69%. Moreover, the alkane content is 74.06% and the olefin content is 9.63%. The content of aromatic compound is 14.08%, and the content of heteroatom compounds is not exceeding 3%.

3.3. Composition Analysis of Gaseous Products

Figure 9 shows the C1-5 composition of gaseous products at different temperatures. It can be concluded that C1-5 is formed during the entire pyrolysis process of Tarim crude oil. At a temperature of 300 °C, the total content of C4-5 heavy hydrocarbons in the gas component exceeds 95%, and there are very few C1-3 light hydrocarbons. When the temperature is 400 °C, the content of C4-5 heavy hydrocarbons decreases, while the content of C1-3 light hydrocarbons increases, and the content of methane is higher than that of C2-3 hydrocarbons. At the temperature of 550 °C, the heavy hydrocarbons of C3-5 are significantly reduced, and the content does not exceed 4%, while the light hydrocarbons of C1-2 exceed 95%. When the temperature is 600 °C, all C3-5 will be converted into C2 and methane. The content of C3-5 is less than 1%, and the content of methane is higher than 93%.

3.4. Carbon Isotope Composition of Gaseous Products

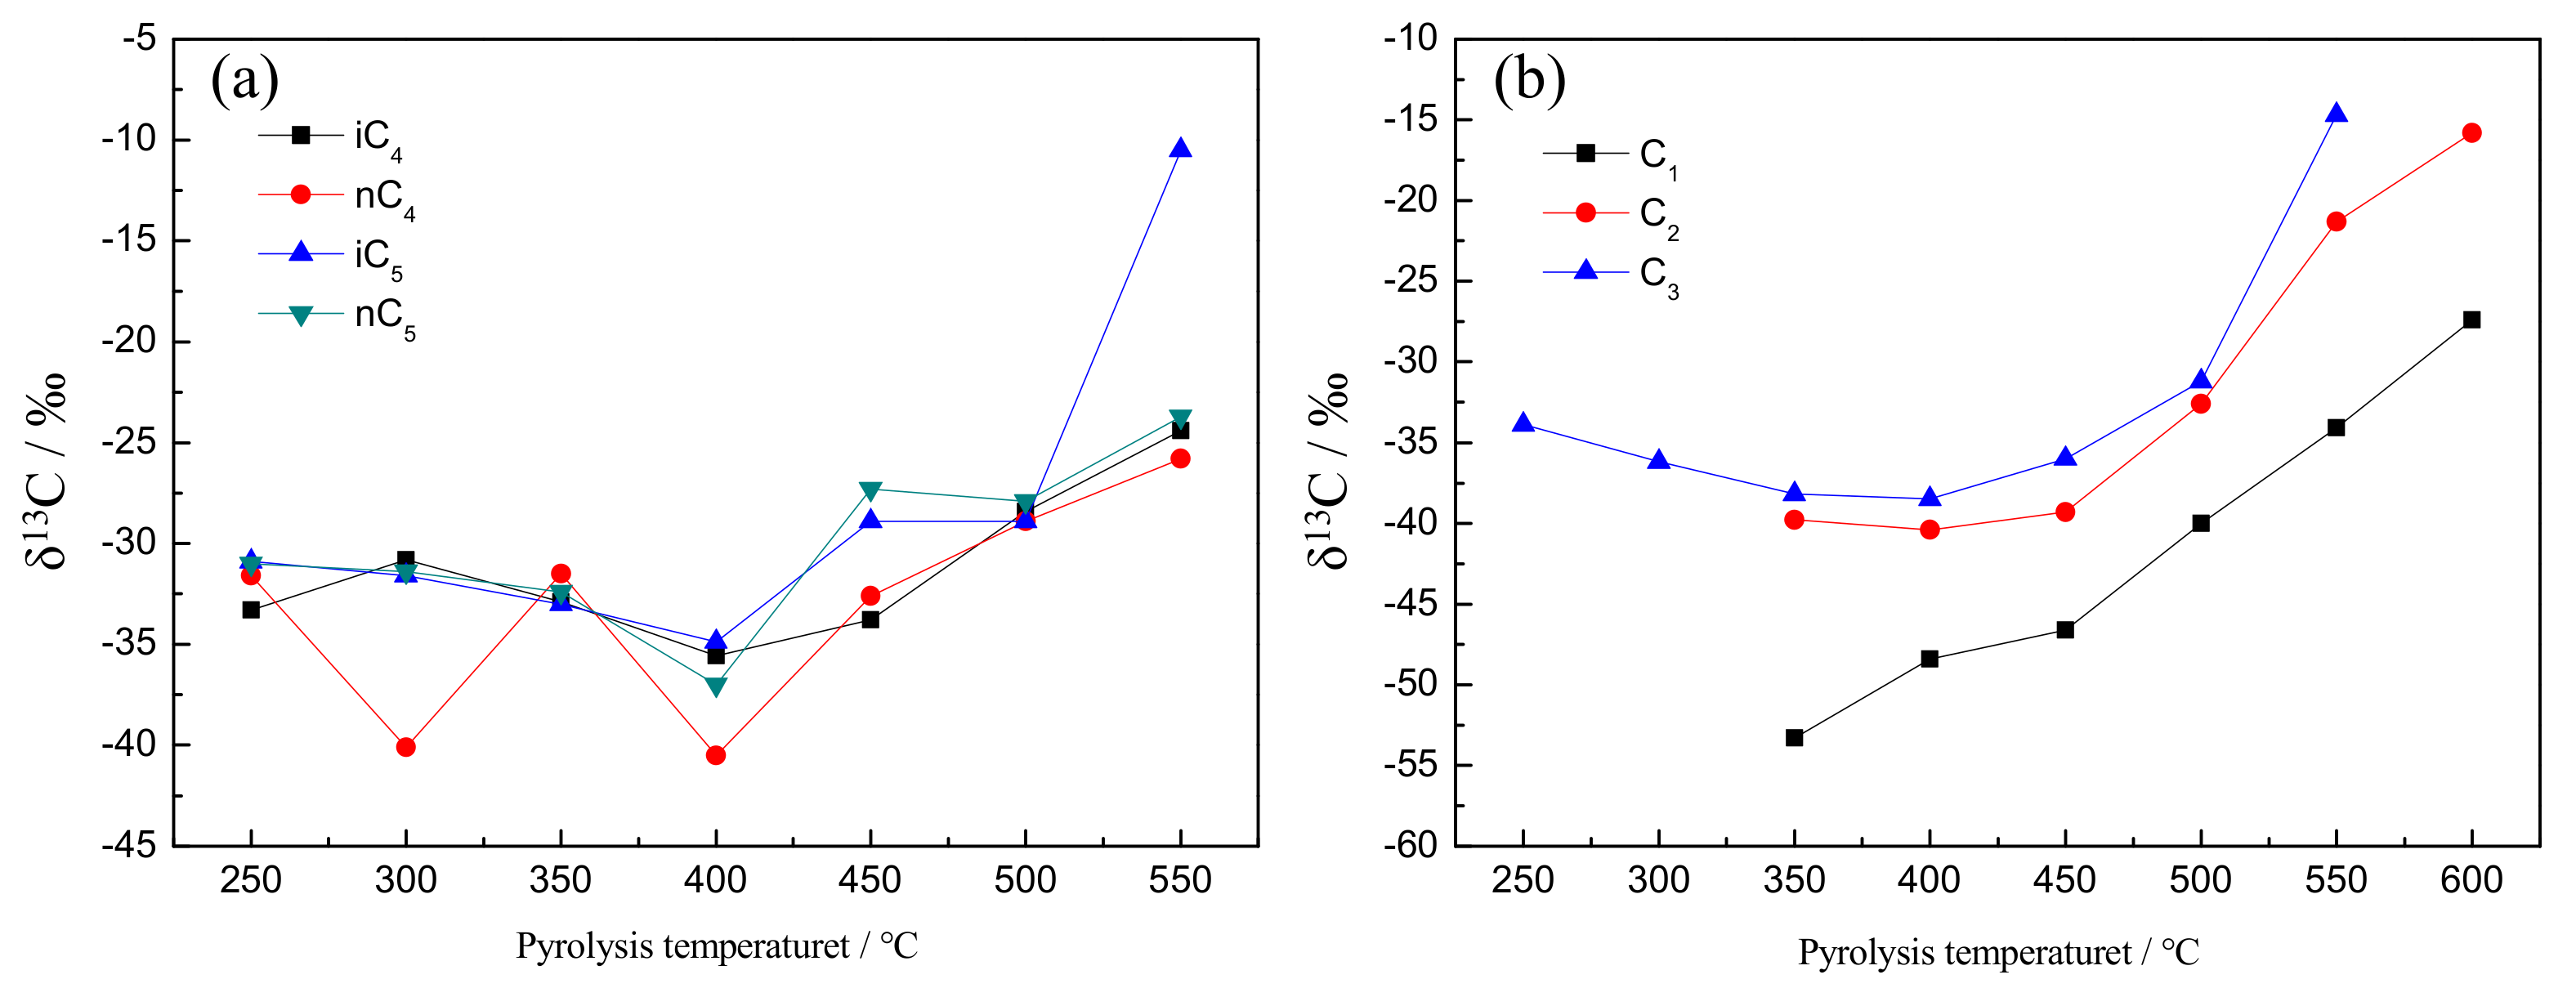
Figure 10 indicates the carbon isotope composition of gaseous products at different temperatures. The δ13C distribution range of C2-5 hydrocarbon is from −40.5‰ to −10.5‰, and that of methane is between −53.3‰ and −27.4‰. With the increase of pyrolysis temperature, the δ13C of C2-5 hydrocarbons decreases first and then increases. The inflection temperature of C2-5 hydrocarbons is 400 °C regardless of whether this concerns a normal isotope or an isomer. Moreover, the lowest δ13C value of methane appears at 350 °C, and the corresponding carbon isotope value is −53.3‰. The non-monotonic linear relationship of C2-5 isotopes may be due to the complexity of crude oil, leading to complicated products in the process of hydrocarbon pyrolysis.
The δ13C values of heavy hydrocarbons of C4-5 are relatively close to each other at the same temperature, and there is no obvious change. However, the δ13C value suddenly becomes heavier after 400 °C. Meanwhile, the larger the molecular of C1-3 hydrocarbon, the heavier δ13C, namely δ13C3 > δ13C2 > δ13C1. The δ13C value of methane is much lighter than those of C2-5 hydrocarbons. The C1-3 hydrocarbons do not only come from the cracking of C4-5 hydrocarbon, but also from the C-C bond rupture of C2-3, which leads to δ13C1 and δ13C2 are lighter than δ13C3.
The non-monotonic linear relationship of C2-5 isotopes may be due to the occurrence of disproportionation during the pyrolysis process, such as the break of the aliphatic carbon chain, side chain and branch chain of aromatic and heteroatomic compounds. Some intermediate products with lighter isotopic compositions can be formed. These intermediate products further decompose to C4-5 heavy gaseous hydrocarbons, and then break to C1-3 light gaseous hydrocarbons. The emergence of these intermediate products makes heavy carbon and light carbon different in the reactions that generate gaseous hydrocarbons. The difference in activation energy is different, which in turn causes the non-monotonic linear relationship of C2-5 isotopes.

3.5. Formation Mechanism of Gaseous Hydrocarbons

Combining FT-IR analysis, GC-MS analysis, and carbon isotope fractionation characteristics, the formation mechanism of gaseous hydrocarbons during pyrolysis of Tarim crude oil was discussed. The formation of gaseous hydrocarbons can be divided into three stages.
The pyrolysis process at 250–300 °C is the first stage, at which the crude oil undergoes volatilization and preliminary cracking. A small amount of crude oil is cracked to generate C4-5 heavy gaseous hydrocarbons. At the same time, some low-carbon hydrocarbons contained in crude oils will also be volatile. More than 95% of the gas composition is C4-5 heavy hydrocarbons, and very few are C1-3 light hydrocarbons.
The second stage is at 300–500 °C, and crude oil accelerates to crack at this stage. The aliphatic hydrocarbon carbon chain in crude oil is gradually cracked, and aromatic and heteroatom compounds also undergo the breakage of side chains and branch chains. The C4-5 heavy gaseous hydrocarbons generated will be further cracked into C1-3 light gaseous hydrocarbons. C2-3 gaseous hydrocarbons have an inflection point at 450 °C. The cracking occurs rapidly, and the cracking rate slows down slightly afterwards. It is indicated that, at this stage, C2-3 may not only originate from direct cracking of crude oil but also from the breakage of C4-5 heavy gaseous hydrocarbons. The pyrolysis characteristics of methane gas are slightly different from those of C2-3 gaseous hydrocarbons, and the content is significantly increased before 400 °C. At the peak temperature of 400 °C, the content reaches approximately 35%, and then the content decreases by about 5%. It is possible that the yield of C2-3 is higher than that of methane during the cracking process at 400–500 °C.
The pyrolysis process at 500–600 °C is the third stage; solid products are generated, and heavy gaseous hydrocarbons are deeply cracked. After 500 °C, the degree of cracking of crude oil gradually reached the highest level, and the heavy gaseous hydrocarbons of C3-5 were gradually and deeply cracked into light gaseous hydrocarbons of C1-2, until almost all of them were cracked, and the content was significantly reduced. At the last stage of the pyrolysis process at 550–600 °C, C2 is gradually converted to methane.

4. Conclusions

In this manuscript, the Tarim crude oil was characterized using GC-MS and FT-IR. The pyrolysis experiments on formation of gaseous hydrocarbons were conducted. The composition and δ13C distribution of C1-5 gaseous were determined using GC and carbon isotope analysis.
Tarim crude oil is mainly composed of hydrocarbon compounds, accounting for 83.69%. Moreover, the alkane content is 74.06% and the olefin content is 9.63%. The aromatic compound content is 14.08%, and the heteroatom compound content is not exceeding 3%.
C1-5 was generated during the whole pyrolysis process of Tarim crude oil, indicating that different amounts of C1-3 light hydrocarbons and C4-5 heavy hydrocarbons are produced during the whole pyrolysis process. With the increase of pyrolysis temperature, the δ13C of C2-5 hydrocarbons decreases first and then increases. The lowest δ13C value of methane appears at 350 °C, and the corresponding carbon isotope value is −53.3‰.
Based on the experimental results, the formation of gaseous hydrocarbons can be divided into three stages. The pyrolysis process at 250–300 °C is the first stage, and the crude oil undergoes volatilization and preliminary cracking. More than 95% of the gas composition is C4-5 and very few are C1-3. The second stage is at 300–500 °C. The carbon chain of aliphatic hydrocarbons in crude oil is gradually cracked, and aromatic and heteroatom compounds also undergo the breakage of side chains and branch chains. The C4-5 generated will be further cracked into C1-3. The pyrolysis process at 500–600 °C is the third stage, in which C3-5 are gradually and deeply cracked into light C1-2.

Author Contributions

Y.M.: Writing—Original Draft, Conceptualization, Investigation, Formal analysis, Visualization, Data Curation; F.S.: Writing—Investigation, Formal analysis, Visualization, Data Curation; J.W.: Investigation, Visualization Data Curation; H.Y.: Investigation, Visualization; C.Y.: Writing—Review & Editing, Project administration. All authors have read and agreed to the published version of the manuscript.

Funding

This research was funded by the Basic Research center for Energy Interdisciplinary, College of Science, China University of Petroleum, Beijing, 102249, China and the Science Foundation of China University of Petroleum, Beijing (Grant number 2462022YXZZ001).

Data Availability Statement

No new data were created or analyzed in this study. Data sharing is not applicable to this article.

Conflicts of Interest

The funders had no role in the design of the study; in the collection, analyses, or interpretation of data; in the writing of the manuscript; or in the decision to publish the results.

References

  1. Huang, Y.; Hu, W.; Sun, Y.; Li, Z.; Zeng, F. Characteristics of gas generation from the pyrolysis of crude oil under the different geological conditions. Pet. Sci. Technol. 2018, 36, 2064–2069. [Google Scholar] [CrossRef]
  2. Liu, Q.; Jin, Z.; Meng, Q. Genetic types of natural gas and filling patterns in Daniudi gas field, Ordos Basin, China. J. Asian Earth Sci. 2015, 107, 1–11. [Google Scholar] [CrossRef]
  3. Li, J.; Hou, D.J.; Li, J.H. Characteristics and genetic types of natural gas in the eastern sag of the Liaohe Depression. Nat. Gas Ind. 2011, 31, 43–47. [Google Scholar]
  4. Liu, Q.; Wu, X.; Wang, X. Carbon and hydrogen isotopes of methane, ethane, and propane: A review of genetic identification of natural gas. Earth Sci. Rev. 2019, 190, 247–272. [Google Scholar] [CrossRef]
  5. Horsfield, B.; Schenk, H.; Mills, N.; Welte, D. An investigation of the in-reservoir conversion of oil to gas: Compositional and kinetic findings from closed-system programmed-temperature pyrolysis. Org. Geochem. 1992, 19, 191–204. [Google Scholar] [CrossRef]
  6. Zhao, M.J.; Lu, S.F. Natural gas from secondary cracking of crude oil—An important pattern of gas generation. Geol. Rev. 2000, 46, 645–650. [Google Scholar]
  7. Zhao, W.; Wang, Z.; Zhang, S.; Wang, H.; Wang, Y. Oil cracking: An important way for highly efficient generation of gas from marine source rock kitchen. Chin. Sci. Bull. 2005, 50, 2628–2635. [Google Scholar] [CrossRef]
  8. Zhu, D. Application and innovation analysis of oil exploration technology. Chem. Ind. Manag. 2017, 8, 238. [Google Scholar]
  9. Li, M.; Zhang, M. Development status and progress of crude oil exploitation technology and equipment. China Pet. Chem. Stand. Qual. 2021, 17, 106–110. [Google Scholar]
  10. Fetisov, V.; Mohammadi, A.H.; Pshenin, V.; Kupavykh, K.; Artyukh, D. Improving the economic efficiency of vapor recovery units at hydrocarbon loading terminals. Oil Gas Sci. Technol. Rev. D’ifp. Energ. Nouv. 2021, 76, 38. [Google Scholar] [CrossRef]
  11. Ilyushin, Y.V. Development of a Process Control System for the Production of High-Paraffin Oil. Energies 2022, 15, 6462. [Google Scholar] [CrossRef]
  12. Mahlstedt, N.; Horsfield, B.; Dieckmann, V. Second order reactions as a prelude to gas generation at high maturity. Org. Geochem. 2008, 39, 1125–1129. [Google Scholar] [CrossRef]
  13. Jackśon, K.J.; Burnham, A.K.; Braun, R.L.; Knauss, K.G. Temperature and pressure dependence of n-hexadecane cracking. Org. Geochem. 1995, 23, 941–953. [Google Scholar] [CrossRef]
  14. Burnham, A.K.; Gregg, H.R.; Ward, R.L.; Knauss, K.G.; Copenhaver, S.A.; Reynolds, J.G.; Sanborn, R. Decomposition kinetics and mechanism of n-hexadecane-1, 2-13C2 and dodece-1-ene-1, 2-13C2 doped in petroleum and n-hexadecane. Geochim. Et Cosmochem. Acta 1997, 61, 3725–3737. [Google Scholar] [CrossRef]
  15. Domine, A.F.; Dessort, D.; Brevart, O. Towards a new method of geochemical kinetic modeling: Implications for the stability of crude oil. Org. Geochem. 1998, 28, 597–612. [Google Scholar] [CrossRef]
  16. Liao, Y.; Zheng, Y.; Pan, Y.; Sun, Y.; Geng, A. A method to quantify C1–C5 hydrocarbon gases by kerogen primary cracking using pyrolysis gas chromatography. Org. Geochem. 2015, 79, 49–55. [Google Scholar] [CrossRef]
  17. Uguna, C.N.; Carr, A.D.; Snape, C.E.; Meredith, W. Retardation of oil cracking to gas and pressure induced combination reactions to account for viscous oil in deep petroleum basins: Evidence from oil and n-hexadecane pyrolysis at water pressures up to 900 bar. Org. Geochem. 2016, 97, 61–73. [Google Scholar] [CrossRef] [Green Version]
  18. Behar, F.S.; Kressmann, S.; Rudkiewicz, J.L.; Vandenbroucke, M. Experimental simulation in a confined system and kinetic modeling of kerogen and oil cracked. Org. Geochem. 1992, 19, 173–189. [Google Scholar] [CrossRef]
  19. Hill, R.J.; Tang, Y.; Kaplan, I.R. Insights into oil cracking based on laboratory experiments. Org. Geochem. 2003, 34, 1651–1672. [Google Scholar] [CrossRef]
  20. Brenden, J.; Riley, C.L.; Stephen, F.; Val, S. Pyrolysis-GC-MS analysis of crude and heavy fuel oil asphaltenes for application in oil fingerprinting. Environ. Forensics 2018, 19, 14–26. [Google Scholar]
  21. Riley, B.J.; Lennard, C.; Fuller, S.; Spikmans, V. An FTIR method for the analysis of crude and heavy fuel oil asphaltenes to assist in oil fingerprinting. Forensic Sci. Int. 2016, 266, 555–564. [Google Scholar] [CrossRef] [PubMed]
  22. Oudot, J.; Chaillan, F. Pyrolysis of asphaltenes and biomarkers for the fingerprinting of the Amoco-Cadizoil spill after 23 years. Comptes Rendus Chim. 2010, 13, 548–552. [Google Scholar] [CrossRef]
  23. Wang, G.; Cheng, B.; Wang, T.-G.; Simoneit, B.R.; Shi, S.; Wang, P. Monoterpanes as molecular indicators to diagnose depositional environments for source rocks of crude oils and condensates. Org. Geochem. 2014, 72, 59–68. [Google Scholar] [CrossRef]
  24. Mair, J.B.; Jack, M.T. Composition of the dinuclear aromatics, C12 to C14, in the light gas oil fraction of petroleum. Anal. Chem. 1964, 36, 351–362. [Google Scholar] [CrossRef]
  25. Von Mühlen, C.; de Oliveira, E.C.; Zini, C.A.; Caramão, E.B.; Marriott, P.J. Characterization of nitrogen-containing compounds in heavy gas oil petroleum fractions using comprehensive two-dimensional gaschromatography coupled to time-of-flight mass spectrometry. Energy Fuels 2010, 24, 3572–3580. [Google Scholar] [CrossRef]
  26. Flego, C.; Zannoni, C. N-containing species in crude oil fractions: An identification and quantification method by comprehensive two-dimensional gas chromatography coupled with quadrupole mass spectrometry. Fuel 2011, 90, 2863–2869. [Google Scholar] [CrossRef]
  27. Li, M.; Wang, T.-G.; Simoneit, B.R.; Shi, S.; Zhang, L.; Yang, F. Qualitative and quantitative analysis of dibenzothiophene, its methylated homologues, and benzonaphthothiophenes in crude oils, coal, and sediment extracts. J. Chromatogr. A 2012, 1233, 126–136. [Google Scholar] [CrossRef]
  28. Ioppolo-Armanios, M.; Alexander, R.; Kagi, R.I. Identification and analysis of C0–C3 phenols in some Australian crude oils. Org. Geichem. 1992, 18, 603–609. [Google Scholar] [CrossRef]
  29. Ioppolo-Armanios, M.; Alexander, R.; Kagi, R.I. Identification and origins of isopropylmethylphenols in crude oils. Org. Geochem. 1994, 22, 815–823. [Google Scholar] [CrossRef]
  30. Wang, Q.; Wang, X.; Pan, S. Study on the structure, pyrolysis kinetics, gas release, reaction mechanism, and pathways of Fushun oil shale and kerogen in China. Fuel Process. Technol. 2022, 225, 107058. [Google Scholar]
  31. Iskenderova, Z.I.; Kurbanov, M.A. Changes in performance characteristics of transformer oil by the action of ionizing radiation. High Energy Chem. 2019, 53, 454–458. [Google Scholar] [CrossRef]
  32. Kaanagbara, L.; Inyang, H.I.; Wu, J. Aromatic and aliphatic hydrocarbon balance in electric transformer oils. Fuel 2010, 89, 3114–3118. [Google Scholar] [CrossRef]
  33. Wang, T.; Geng, A.; Li, X. Pyrolysis of one crude oil and its asphaltenes: Evolution of gaseous hydrocarbons and carbon isotope. J. Pet. Sci. Eng. 2010, 71, 8–12. [Google Scholar] [CrossRef]
  34. Zhang, Z.; Zhang, Y.; Zhu, G.; Chi, L.; Han, J. Impacts of Thermochemical Sulfate Reduction, Oil Cracking, and Gas Mixing on the Petroleum Fluid Phase in the Tazhong Area, Tarim Basin, China. Energy Fuels 2019, 33, 968–978. [Google Scholar] [CrossRef]
  35. Tian, H.; Xiao, X.; Yang, L.G.; Xiao, Z.Y.; Guo, L.G.; Shen, J.G.; Lu, Y.H. Pyrolysis of oil at high temperatures: Gas potentials, chemical and carbon isotopic signatures. Chin. Sci. Bull. 2009, 54, 1217–1224. [Google Scholar] [CrossRef] [Green Version]
  36. Gilbert, A.; Yamada, K.; Suda, K.; Ueno, Y.; Yoshida, N. Measurement of position-specific 13C isotopic composition of propane at the nanomole level. Geochim. Cosmochim. Acta 2016, 177, 205–216. [Google Scholar] [CrossRef]
  37. Li, W.; Zhu, Y.-M.; Liu, Y. Gas evolution and isotopic fractionations during pyrolysis on coals of different ranks. Int. J. Coal Geol. 2018, 188, 136–144. [Google Scholar] [CrossRef]
  38. Berner, U.; Faber, E.; Stahl, W. Mathematical simulation of the carbon isotopic fractionation between huminitic coals and related methane. Chem. Geol. Isot. Geosci. 1992, 94, 315–319. [Google Scholar] [CrossRef]
  39. Lorant, F.; Prinzhofer, A.; Behar, F.; Huc, A.-Y. Carbon isotopic and molecular constraints on the formation and the expulsion of thermogenic hydrocarbon gases. Chem. Geol. 1998, 147, 249–264. [Google Scholar] [CrossRef]
  40. Berner, U.; Faber, E. Empirical carbon isotope/maturity relationships for gases from algal kerogens and terrigenous organic matter based on dry open-system pyrolysis. Org. Geochem. 1996, 24, 947–955. [Google Scholar] [CrossRef]
  41. Wen, P.; Cui, M.; Li, C.; Hao, H.; Deng, W. Element Distribution and Infrared Spectrum Analysis in Tarim Heavy Oils and Their Sub-Fractions. J. Petrochem. Univ. 2013, 26, 16–21. [Google Scholar]
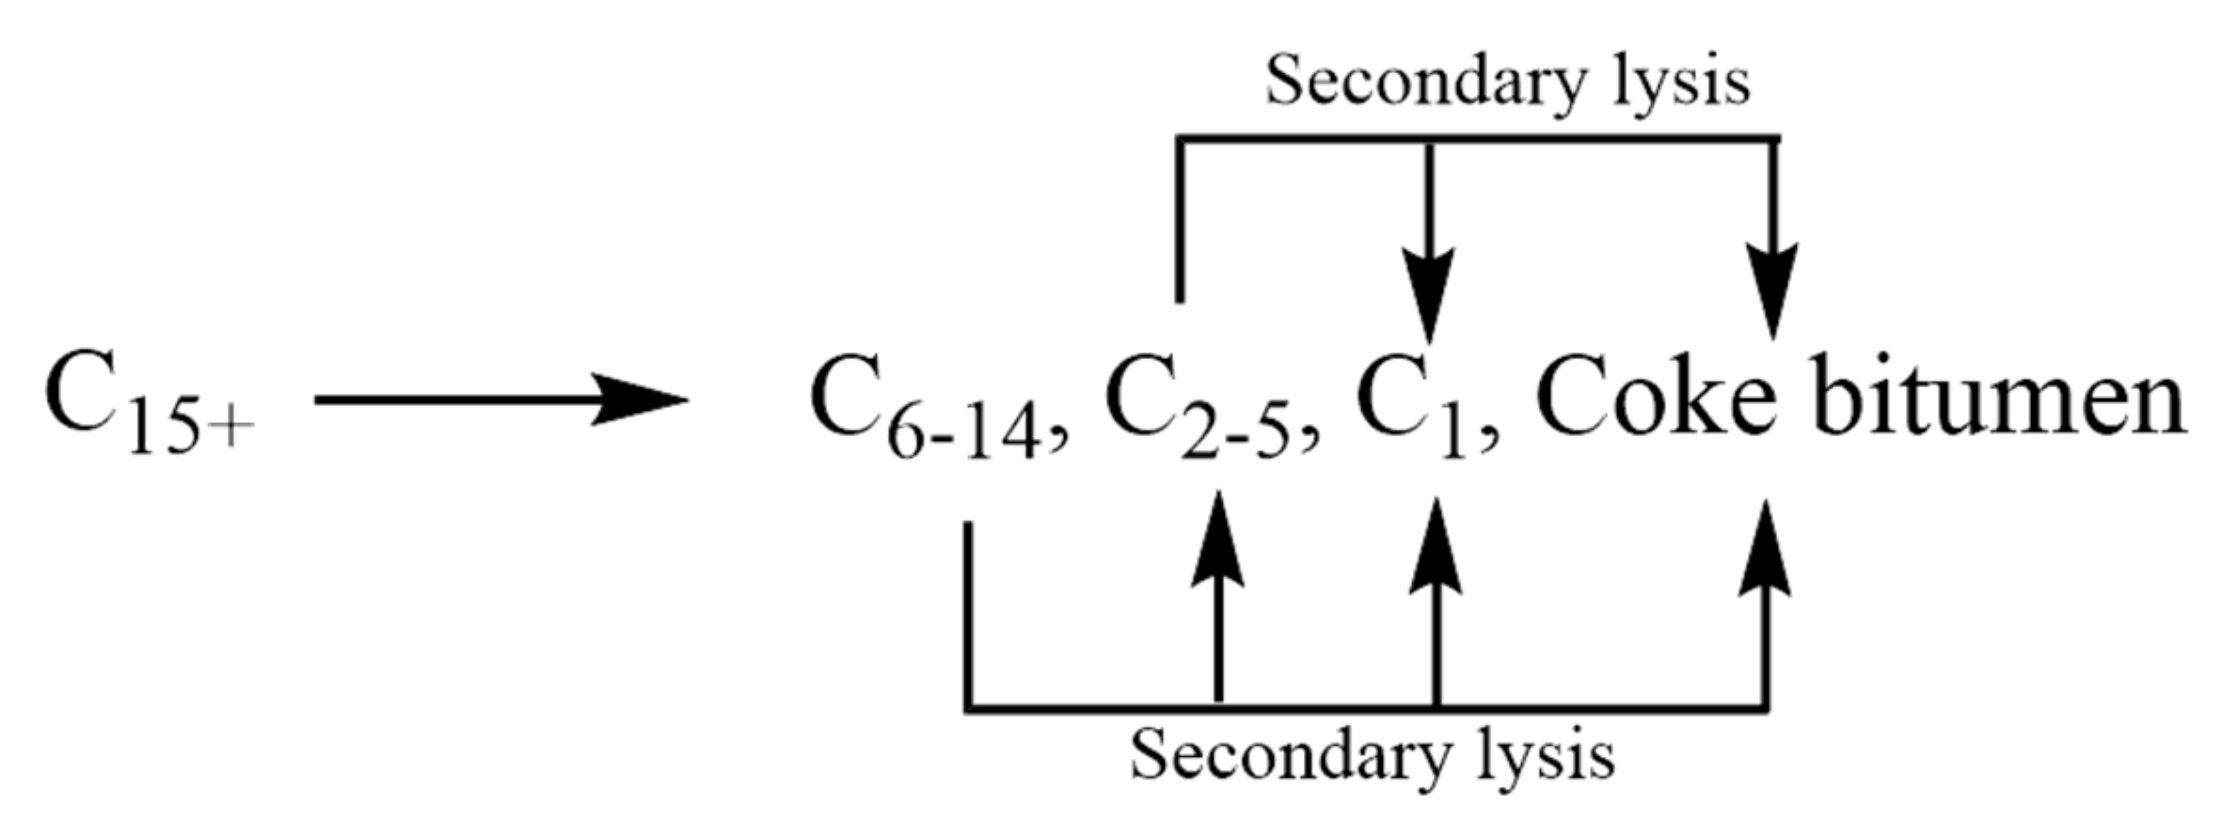
Figure 1. C15+ pyrolysis reaction process [16].
Energies 16 02073 g001
Figure 2. Pyrolysis experimental apparatus [40]. 1—pressure gauge; 2—air intakes; 3—intake valve; 4—reactor; 5—quartz tube; 6—thermocouple; 7—gas collection bags; 8—temperature controller; 9—jar.
Energies 16 02073 g002
Figure 3. FT-IR spectrogram of Tarim crude oil.
Energies 16 02073 g003
Figure 4. GC-MS curves of oil fraction of Tarim crude.
Energies 16 02073 g004
Figure 5. Spectrum of n-alkanes and aromatic hydrocarbons. (a) The ion current spectra with m/z of 85; (b) The ion current spectra with m/z of 91.
Energies 16 02073 g005
Figure 6. Spectra of nitrogen compounds. (a) The ion current spectra with m/z of 79; (b) The ion current spectra with m/z of 93; (c) The ion current spectra with m/z of 129.
Energies 16 02073 g006
Figure 7. Spectrum of sulfur compounds. (a) The ion current spectra with m/z of 47;(b) The ion current spectra with m/z of 83.
Energies 16 02073 g007
Figure 8. Spectrum of oxygen compounds. (a) The ion current spectra with m/z of 74; (b) The ion current spectra with m/z of 94.
Energies 16 02073 g008
Figure 9. C1-5 composition of gaseous products at different temperatures.
Energies 16 02073 g009
Figure 10. The carbon isotope composition of pyrolysis gas at different temperatures. (a) The carbon isotope composition of C4-5 at different temperatures. (b) The carbon isotope composition of C1-3 at different temperatures.
Energies 16 02073 g010
Table 1. Basic properties of crude oil.
Basic Properties of Crude OilCrude Oil in Tarim, Xinjiang
Saturate, %65.54
Aromatics, %18.31
Resin, %11.33
Asphaltene, %4.82
Density (25 °C), g/cm30.8821
Wax, %11.29
Viscosity (25 °C), g/cm374.40
δ13C, %−33.00
Table 2. Main vibrational peaks in infrared spectra.
Wave Number/cm−1Absorption Peak AttributionFunctional Groups
2975–2800Absorption peak of -CH3Aliphatic and side chain
1706–1604Double bond telescopic vibration peak of C=O and C=CUnsaturated hydrocarbon
1460–1370Methylene variable angle vibration
Methyl asymmetric variable angle
Aliphatic compound structure
868Benzene toroidal flexural vibrationMonocyclic benzene
783–746Amino characteristic peakAmidogen
Table 3. Relative contents of each compound of Tarim crude oil.
Material CompositionContent/%
Aliphatic compoundN-alkane68.02
Branched alkanes3.17
Alpha olefin8.32
Non-alpha olefins1.31
Naphthenic2.87
Aromatic compoundMononuclear aromatics, PAHs14.08
Heteroatom compoundsOxy-compound1.31
Sulfur compounds0.64
Nitrogen compounds0.28
Disclaimer/Publisher’s Note: The statements, opinions and data contained in all publications are solely those of the individual author(s) and contributor(s) and not of MDPI and/or the editor(s). MDPI and/or the editor(s) disclaim responsibility for any injury to people or property resulting from any ideas, methods, instructions or products referred to in the content.