Review

Application of Biogas and Biomethane as Maritime Fuels: A Review of Research, Technology Development, Innovation Proposals, and Market Potentials

by
George Mallouppas
1,*,
Elias Ar. Yfantis
1,2,
Constantina Ioannou
1,
Andreas Paradeisiotis
1 and
Angelos Ktoris
1
1
Marine and Offshore Science, Technology and Engineering Centre, Cyprus Marine and Maritime Institute, Larnaca 6023, Cyprus
2
Department of Engineering, University of Nicosia, Nicosia 2417, Cyprus
*
Author to whom correspondence should be addressed.
Energies 2023, 16(4), 2066; https://doi.org/10.3390/en16042066
Submission received: 18 January 2023 / Revised: 7 February 2023 / Accepted: 18 February 2023 / Published: 20 February 2023

Abstract

:
This review paper examines the applicability of biogas and biomethane as potential maritime fuels and examines issues of these fuels from a supply chain perspective (from production to end use). The objectives are to identify: (1) the latest research, development, and innovation activities; (2) issues and key barriers related to the technology readiness to bring biogas/biomethane to market; and (3) commercialisation issues, including cost parity with natural gas (the main competitor). A survey of the literature was carried out based on research articles and grey literature. The PESTEL and SWOT analyses identified opportunities for these fuels due to the relevant regulations (e.g., Fit for 55; the recent inclusion of the Mediterranean Sea as a SECA and PM control area; MPEC 79), market-based measures, and environmental, social, and governance strategies. The potential of biomass feedstock is estimated to have a substantial value that can satisfy the energy needs of the maritime industry. However, production costs of biomethane are high; estimated to be 2–4 times higher compared to natural gas. The market is moving in the direction of alternative drop-in fuels, including liquefied and compressed biomethane (LBM and CBM) and biogas. In terms of potential market penetration, LBM can be used as a marine drop-in fuel for the existing fleet that already combust LNG and LPG due to similar handling. Currently, these vessels are LNG and LPG tankers. However, in newly built vessels, LBM can be also supplied to container ships, vehicle carriers, and bulk carriers (about 20% of newly built vessels). Provided that compressed natural gas infrastructure exists, CBM can be exploited in vessels with low energy needs and low space requirements and shore-side electrification, because investments in retrofits are lower compared to constructing new infrastructure.

1. Introduction

Decarbonisation of the maritime industry is a complex problem and the solutions will require interdisciplinary collaboration between various fields combined with innovation, the engagement of stakeholders, and regulatory, legislative, and even financial incentives [1,2]. Biofuels are considered to be the most promising option for lowering CO2 emissions in the transportation sector, irrespective of the fact that their share in the total transportation fuel consumption is very low [3]. Oh et al. [3] list the major reasons as: (i) unavailability of raw materials; (ii) low CO2 mitigation effect; (iii) blending, and thus mixing with conventional fuels due to their different fuel properties (also known as blending wall); and (iv) high cost, and hence low competitiveness. Oh et al. [3], in their review, argue that advanced biofuels are a promising solution. However, in their survey, the application of biofuels in the maritime industry is not further examined. Biofuels are considered important due to their relative feedstock abundance in many regions, easy combustion in internal combustion engines, compatibility with existing infrastructure, and finally, they can “revitalise rural areas” by providing “new end markets for agricultural commodities” [4].
The European Biofuels Technology Platform, based on carbon as a source, defines 1st, 2nd, 3rd, and 4th generation biofuels as follows [5]:
  • “1st Generation: The source of carbon for the biofuel is sugar, lipid or starch directly extracted from a plant. The crop is actually or potentially considered to be in competition with food.”
  • “2nd Generation: The biofuel carbon is derived from cellulose, hemicellulose, lignin or pectin. For example, this may include agricultural, forestry wastes or residues, or purpose-grown non-food feedstocks (e.g., Short Rotation Coppice, Energy Grasses).”
  • “3rd Generation: The biofuel carbon is derived from aquatic autotrophic organisms (e.g., algae). Light, carbon dioxide and nutrients are used to produce the feedstock “extending” the carbon resource available for biofuel production.”
  • “4th Generation: This type of biofuel is a combination of genetically engineered feedstock and genomically prepared organisms, usually algae, for increased yield of production [6,7]. Non-biological feedstocks are also considered to be 4th generation biofuels” [8].
Note that advanced biofuels are second generation and above [5].
Based on the above definitions, biogas and biomethane are considered advanced biofuels if their source is obtained from the organic portion of municipal solid waste, agricultural wastes, forestry wastes, and aquatic autotrophic organisms that are not in direct or indirect competition with food crops [9,10]. Therefore, the production and utilisation of advanced biomethane is sustainable (in terms of ethics and the environment) compared to first generation biomethane [11]. Advanced biofuels are attractive candidates for the maritime industry due to their almost net zero carbon potential [5]. In fact, DNV in its 2022 updated report “Maritime Forecast 2050” mentions that “bio-LNG, bio-MGO and bio-methanol” are the preferred fuels for the maritime sector because of their high energy density and “availability of sustainable biomass” [12]. However, their high production cost compared to their fossil counterparts is the main key barrier [12]. Gaseous biofuels, on the other hand, have issues with storage and transportation, and therefore their liquid biofuel counterparts have a considerable advantage (for example, there is no need to compress or liquefy, as done for compressed/liquefied natural gas in order to store and transport them). This is a key challenge of gaseous biofuels for their eventual uptake in the shipping industry.
Advanced biofuels “have very low sulphur levels and low CO2 emissions, as such they are a technically viable solution to low-sulphur fuels meeting either the VLSFO or ULSFO requirements” [13]. In the case of biomethane, after upgrading from biogas, the sulphur levels are virtually negligible. In the transportation sector, biofuels are, at the moment, the most suitable option for replacement or used as a drop-in with gasoline (blended with bioethanol) or diesel (blended with biodiesel) [5]. The exact drop-in percentage depends on the miscibility, mode of operation (compression- versus spark-ignition), and tolerance of the internal combustion engine. However, in shipping industry experience, handling, including safety and long-term storage of gaseous and liquid biofuels, is limited [5]. An additional key barrier to the commercialisation of advanced biofuels is the “poor fuel economy” [3], which yet needs to be proven by resolving issues in availability and the supply chain, taking also into consideration that physical and chemical properties of the proposed biofuels are similar to the properties of conventional fossil fuels.
Note there are two conversion routes to obtain biomethane from biomass feedstocks. Either via anaerobic digestion, which would also require upgrading, or gasification, as depicted in Figure 1.
Anaerobic digestion is the breakdown of biomass by microorganisms in the absence of air/oxygen to produce biogas [14]. Gasification is the process by which biomass is broken down via the use of high temperatures with a certain quantity of oxygen and steam to produce syngas [14]. CE Delft [14], pp. 19–20, compares the conversion routes, anaerobic digestion, and gasification, with the available technologies, the type of feedstock, and most importantly, their technological readiness level (TRL). However, note that most anaerobic digestion technologies are market ready and available, but gasification technologies are still at lower TRL levels. Further examination should also take into consideration the energy required for both processes to be completed. Therefore, for the remaining discussion in this review paper, the anaerobic digestion conversion route is only considered.
The energy mix could include the use of compressed and/or liquefied biomethane for cold-ironing (or shore-side electricity) and bunkering applications. The potential of biogas to aid in the decarbonisation of the maritime sector is clear, as it is proven from lifecycle and environmental considerations that biomethane (either in liquefied or in compressed state) can reduce the shipping’s impact on climate change [15]. Brynolf et al. [15], however, clearly mention the need to address methane slipping, due to methane’s high global warming potential.
The scope of this review paper is to survey the literature related to the use of biogas and biomethane by the shipping industry, based on research articles and grey literature. The scope aims to tackle the limited number of research papers on biomethane and biogas applications, and thus aims to fill in the research gap by surveying the available literature on the relevant topics as defined in the next sections. Section 2 focuses on the recent regulatory and legislative framework and its impact on market-based measures. Section 3 focuses on a political, economic, social, technological, environmental, and legal (PESTEL) and strengths, weaknesses, opportunities, and threats (SWOT) analyses of biogas and biomethane, which will aid in the identification of threats and opportunities. Section 4 discusses the availability, supply chain, and cost breakdown issues of these fuels. Section 5 compares the applicability of compressed and liquefied fuels, with LNG and CNG as the benchmark. Section 6 presents the emission characteristics when biomethane is used as a drop-in fuel in marine internal combustion engines (ICEs). Section 7 focuses on the need and available technologies for upgrading biogas to biomethane. Finally, Section 8 summarises the key findings of this review paper.

2. Regulations, Legislation, and Their Link to Market-Based Measures and ESG

In terms of legislation, the recent “Fit for 55” legislation package has important effects on the shipping industry to limit the CO2 emissions with important repercussions on the European economies. The key directives/regulations/policies that impact shipping on the European level are:
  • Revised EU ETS (aims to involve shipping in EU carbon trading);
  • FuelEU Maritime (a new regulation about sustainable maritime fuels to help the transition to low carbon maritime fuels, such as biogas as it is a renewable energy source (RES));
  • The revised Energy Taxation Directive (to end tax exemptions for conventional marine fuels and incentivise the uptake of alternatives. For example, bunker fuels sold in the EU for intra-EU voyage are no longer tax exempt);
  • The revised Renewable Energy Directive (RED II) (introduces a target of at least 40% share of renewable energy and a GHG intensity reduction target of at least 13% by 2030 in the transport sector. It maintains the multiplier for renewable energy used by ships);
  • EU Maritime MRV Regulation (requires the inclusion a lifecycle analysis methodology for fuels and common principles for fuel monitoring, verification, and accreditation. The existing EU MRV system will build upon the new EU THETIS reporting database);
  • Alternative Fuel Infrastructure Directive (AFID) (seeks to raise the availability of LNG by 2025 and shore-side electricity supply in main EU ports (determined by number of calls per year) by 2030);
  • Carbon Border Adjustment Mechanism (CBAM) (seeks to avoid “carbon leakage”, which either occurs “when industries transfer polluting production to other countries with less stringent climate policies, or when EU products are replaced by more carbon-intensive imports”. Carbon leakage can, therefore, undermine the EU’s climate change efforts).
Note that the shipping industry is regulated by the International Maritime Organization (IMO). Therefore, the IMO, under the International Convention for the Prevention of Pollution from Ships (MARPOL), in particular MARPOL Annex VI under Regulation 18.3.2, MPEC.1/Circ.795/Rev.6 (related to the application and interpretations of Regulation 18.3 for biofuels) and MPEC.1/Circ.878 (related to the 0.5% sulphur limit), has set standards for using biofuels by fuel oil quality regulations [16,17,18]. However, these regulations refer to liquid fuels, the relevant regulations for gaseous biofuels (such as biogas and biomethane) are yet to be developed. In our view, any regulations applicable to compressed natural gas (CNG) and/or liquefied natural gas (LNG) will form the framework for future regulations related to biogas and biomethane in terms of use, operation, and safety.
It should be highlighted that, as with all policies related to the options relevant to decarbonisation, “biogas policies may be effective in one country would not necessarily lead to the same outcome in another country”, because these are highly depended on the overall national policy and economic strategy a country may choose to follow [19]. However, targeted policies may stimulate the development and scale-up of biogas in its overall value chain, which, namely, are: (1) production; (2) distribution; (3) use; and (4) biofertilisers [19].

2.1. Market-Based Measures of Gaseous Biofuels

Market-Based Measures (MBMs) are “technical and operational measures” of vessels to reduce fuel consumption, and hence, CO2 emissions [1,20,21]. MBMs include the Emissions Trading Schemes (ETS) and International Funds based on contributions of fuel, offsetting in other sectors with increasing emissions, and economic incentives to invest in new technologies, and/or the operation of vessels [1,22]. As already alluded to, some MBMs include reductions of the Energy Efficiency Design Index (EEDI) [22], Energy Efficiency Existing Ship Index (EEXI), Ship Energy Efficiency Management Plan (SEEMP), and Carbon Intensity Index (CII) [23]. For a comprehensive review of MBMs, the reader is referred to Lagouvardou et al. [21].
In terms of alternative green fuels (including biofuels) and bridging fuels (such as LNG), MBMs will create opportunities for these type of fuels in an effort for the shipping industry to decarbonise, reduce the potential carbon penalties, and address challenges related to environmental, social, and governance strategies and competitiveness (see Section 3 on PESTEL and SWOT analysis).

2.2. Environmental, Social, and Governance Strategies of Gaseous Biofuels

Environmental, social, and governance (ESG) is a set of standards and criteria set by organisations to show that their activities are environmentally and socially responsible and sustainable. Note that ESG is part of the overall corporate social responsibility (CSR) that organisations need to show “for sustainability and ecological behaviours in connection of corporate with values, etiquettes and investment decisions” [24], pp. 117–118. In other words, ESG introduces the concept of “holistic sustainability”, i.e., sustainability that considers the environment, society, and governance (and the interactions between the three criteria). At the same time, organisations manage risks and opportunities with set ESG criteria. These opportunities are associated with processes and decisions related to the financing (investments and borrowing) of an organisation. ESG, therefore, operates as a set of “non-economic” criteria and conditions, or, more precisely, as a set of indirect economic criteria and conditions. In other words, from a market perspective and business strategy, a poor ESG rating would imply a high-risk investment and, conversely, a good ESG rating would imply a safer investment.
Currently, ESG reporting is voluntary, but it is envisioned that in the future, at least for the shipping industry, it will become a key, compulsory reporting parameter for businesses. In fact, the adoption of ESG criteria is evolving as “an emerging global trend in the evaluation of shipping companies” [25]. Reporting includes topics such as recycling, GHG emissions, other harmful pollutants, ecological impacts, business ethics, employee health and safety, and accident and safety management [26]. In addition, ESG applies to all aspects and sectors of shipping, including shipyards, ports, ship owners, ship managers, regional support activities and services, logistics chain and intermodal transportation, and suppliers. In terms of GHG emissions, ESG will act as an additional driver for the shipping industry to decarbonise by implementing appropriate technical and operational measures. This will undoubtedly create opportunities for biofuels in an effort for the shipping industry to demonstrate, via its environmental, social, and governance criteria, that it is investing in and acting upon the low carbon transition (green transition).

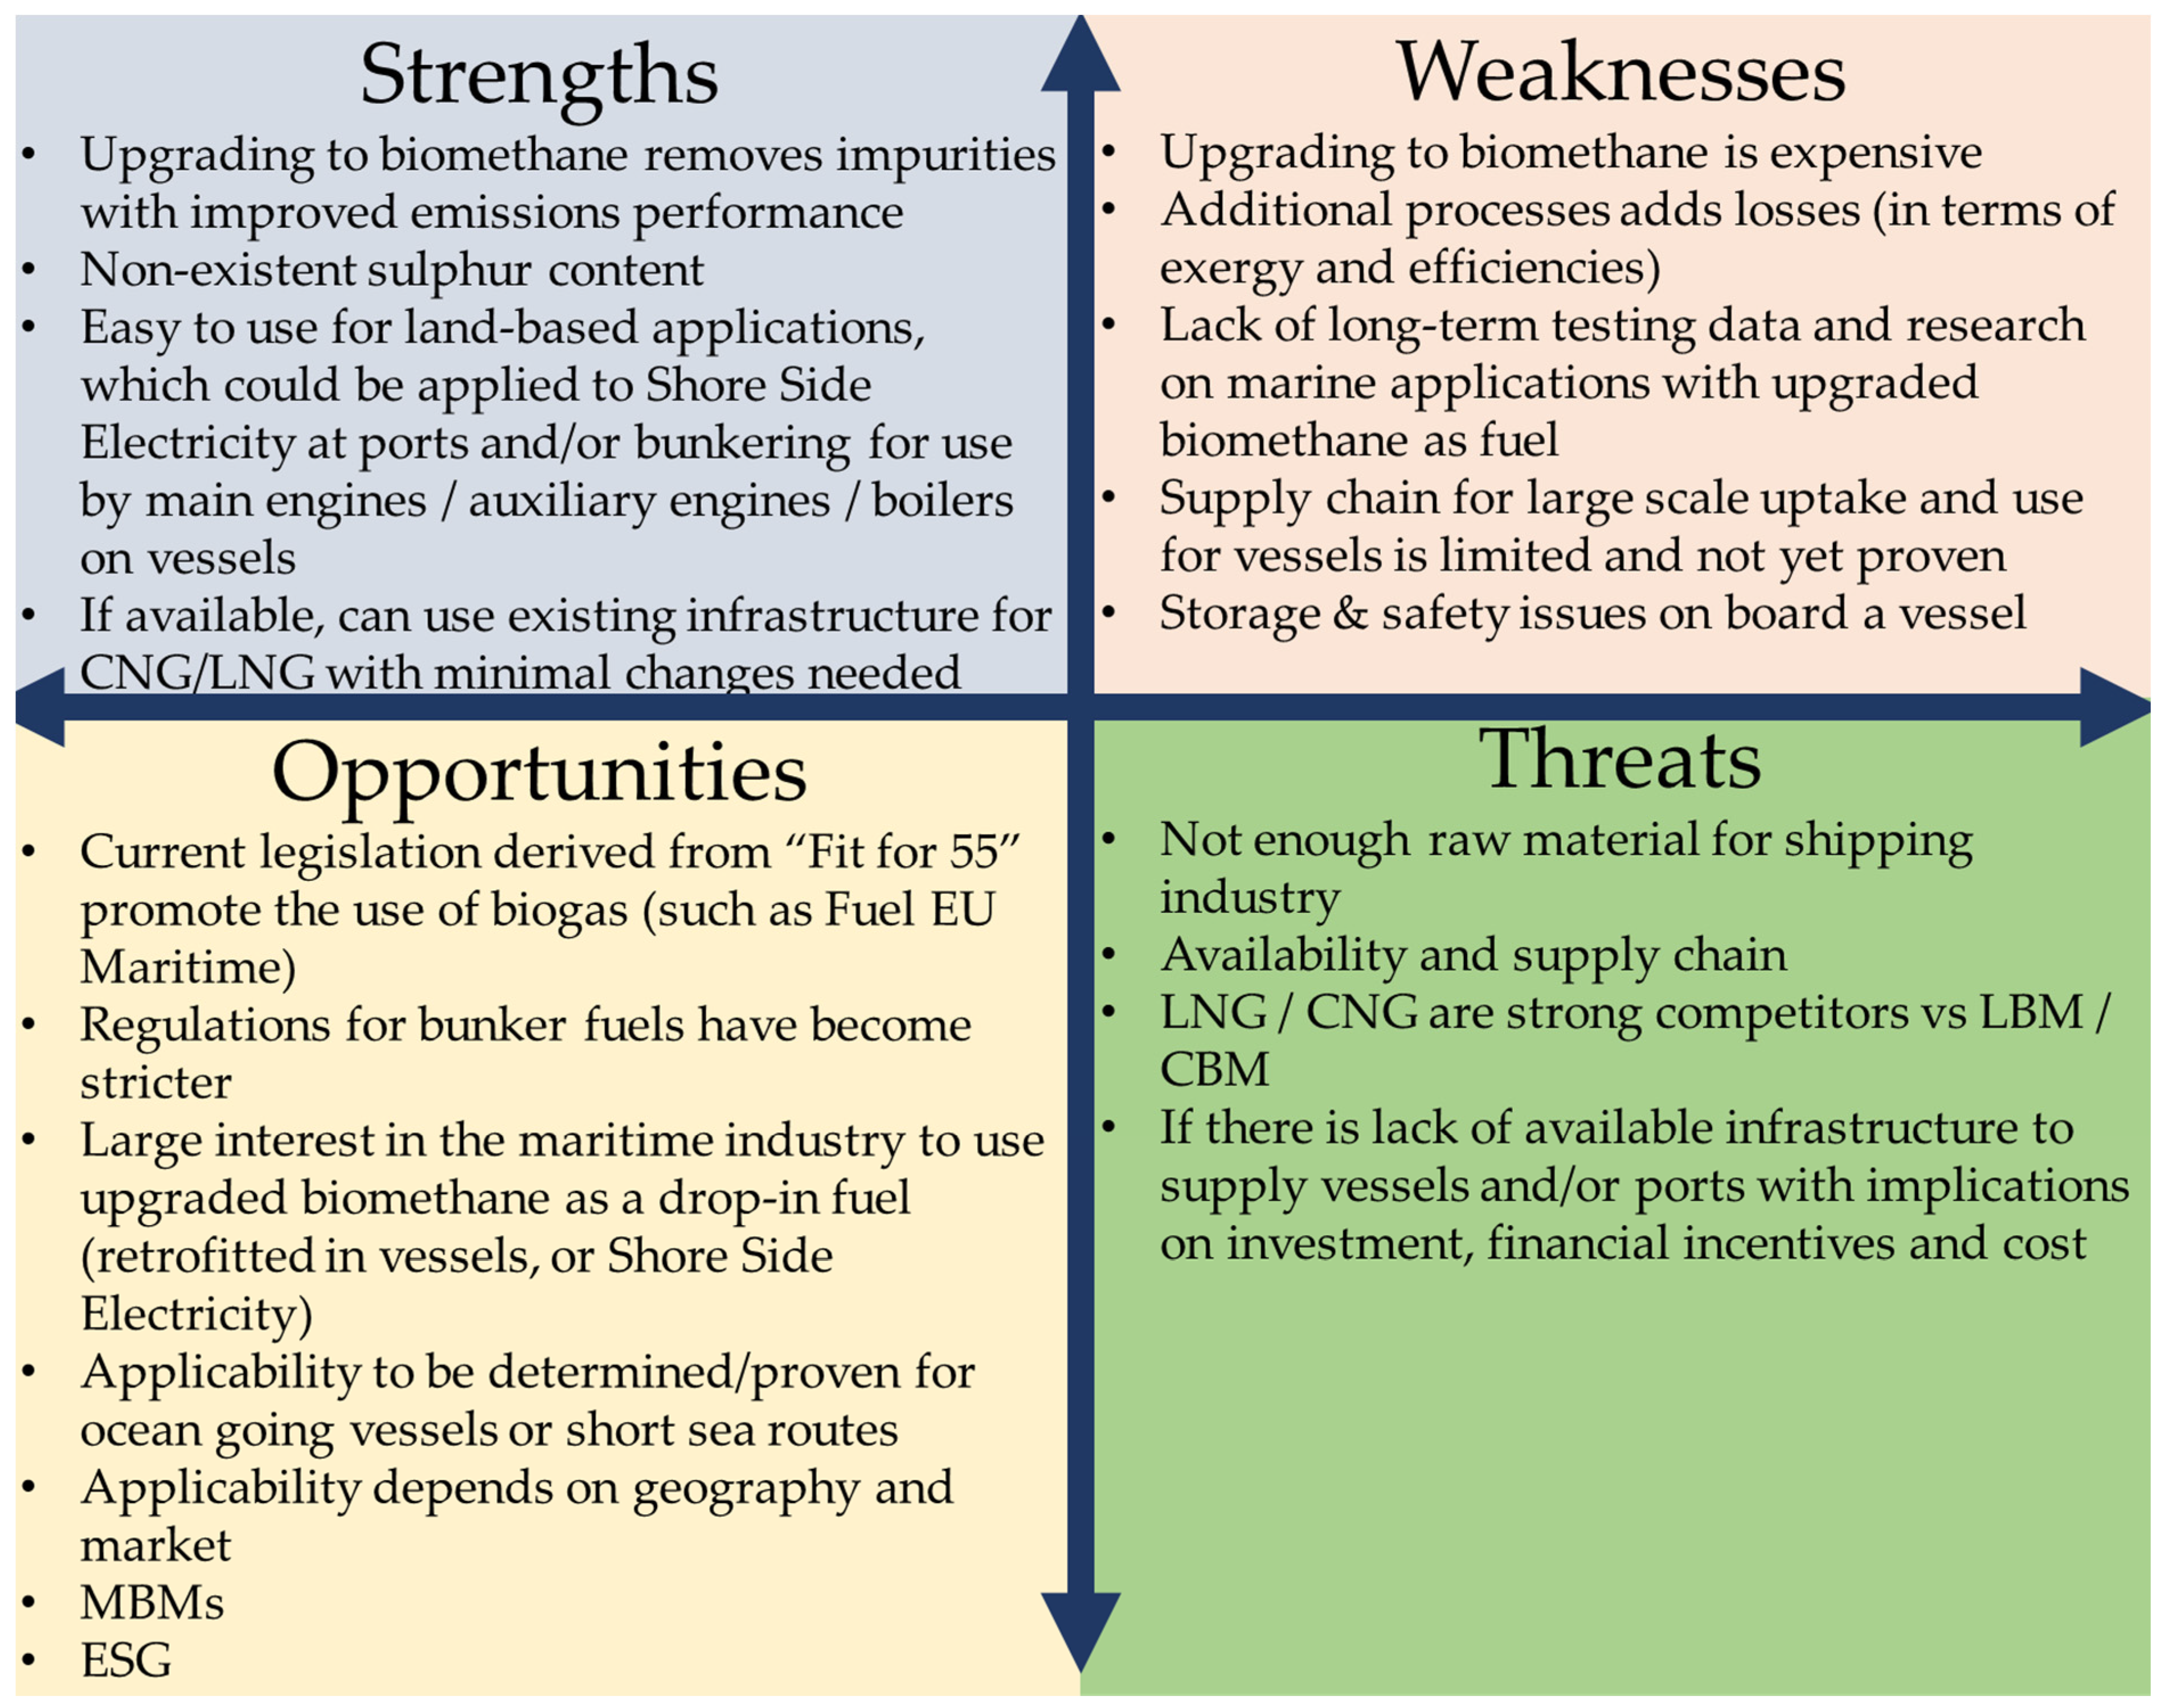
3. PESTEL and SWOT Analysis of Biogas and Biomethane

In order for biogas and biomethane to be considered as viable fuels, their key barriers must be overcome. A PESTEL analysis is used to identify the main potential threats and opportunities for gaseous biofuels in the maritime industry by considering the macro-environmental factors (e.g., markets, regulations, political impacts) [24], p. 5. A SWOT analysis is also evaluated for a complete “assessment of the environment” [24], p. 5, of both fuels. This is to identify their “internal” strengths, weaknesses, opportunities, and threats. Therefore, the PESTEL and SWOT analyses can steer the discussion on what is needed in terms of RTDI activities, legislation, regulations, and financial incentives.
The PESTEL analysis (see Table 1) reveals that several opportunities exist for gaseous biofuels in all main factors. The general preliminary PESTEL analysis will depend on MBMs and their current assumptions, for example, the Fit for 55 policies, for which some directives are still under debate. Note, however, that the assumptions and discussion of the PESTEL factors strongly depend on a per-region and a per-market basis.
The SWOT analyses of Figure 2 and Figure 3 reveal that, compared to fossil fuels, biogas and biomethane have a greater cost, which is not expected to change, at least for the short- and medium-term. However, a combination of policies, regulations (reduced sulphur levels in marine fuels and reduction of GHG emissions), incentives, and technology and infrastructure improvements/enhancements may help to create a viable market and opportunities for biogas and biomethane in the shipping industry [13].

4. Availability, Supply Chain, and Cost Breakdown

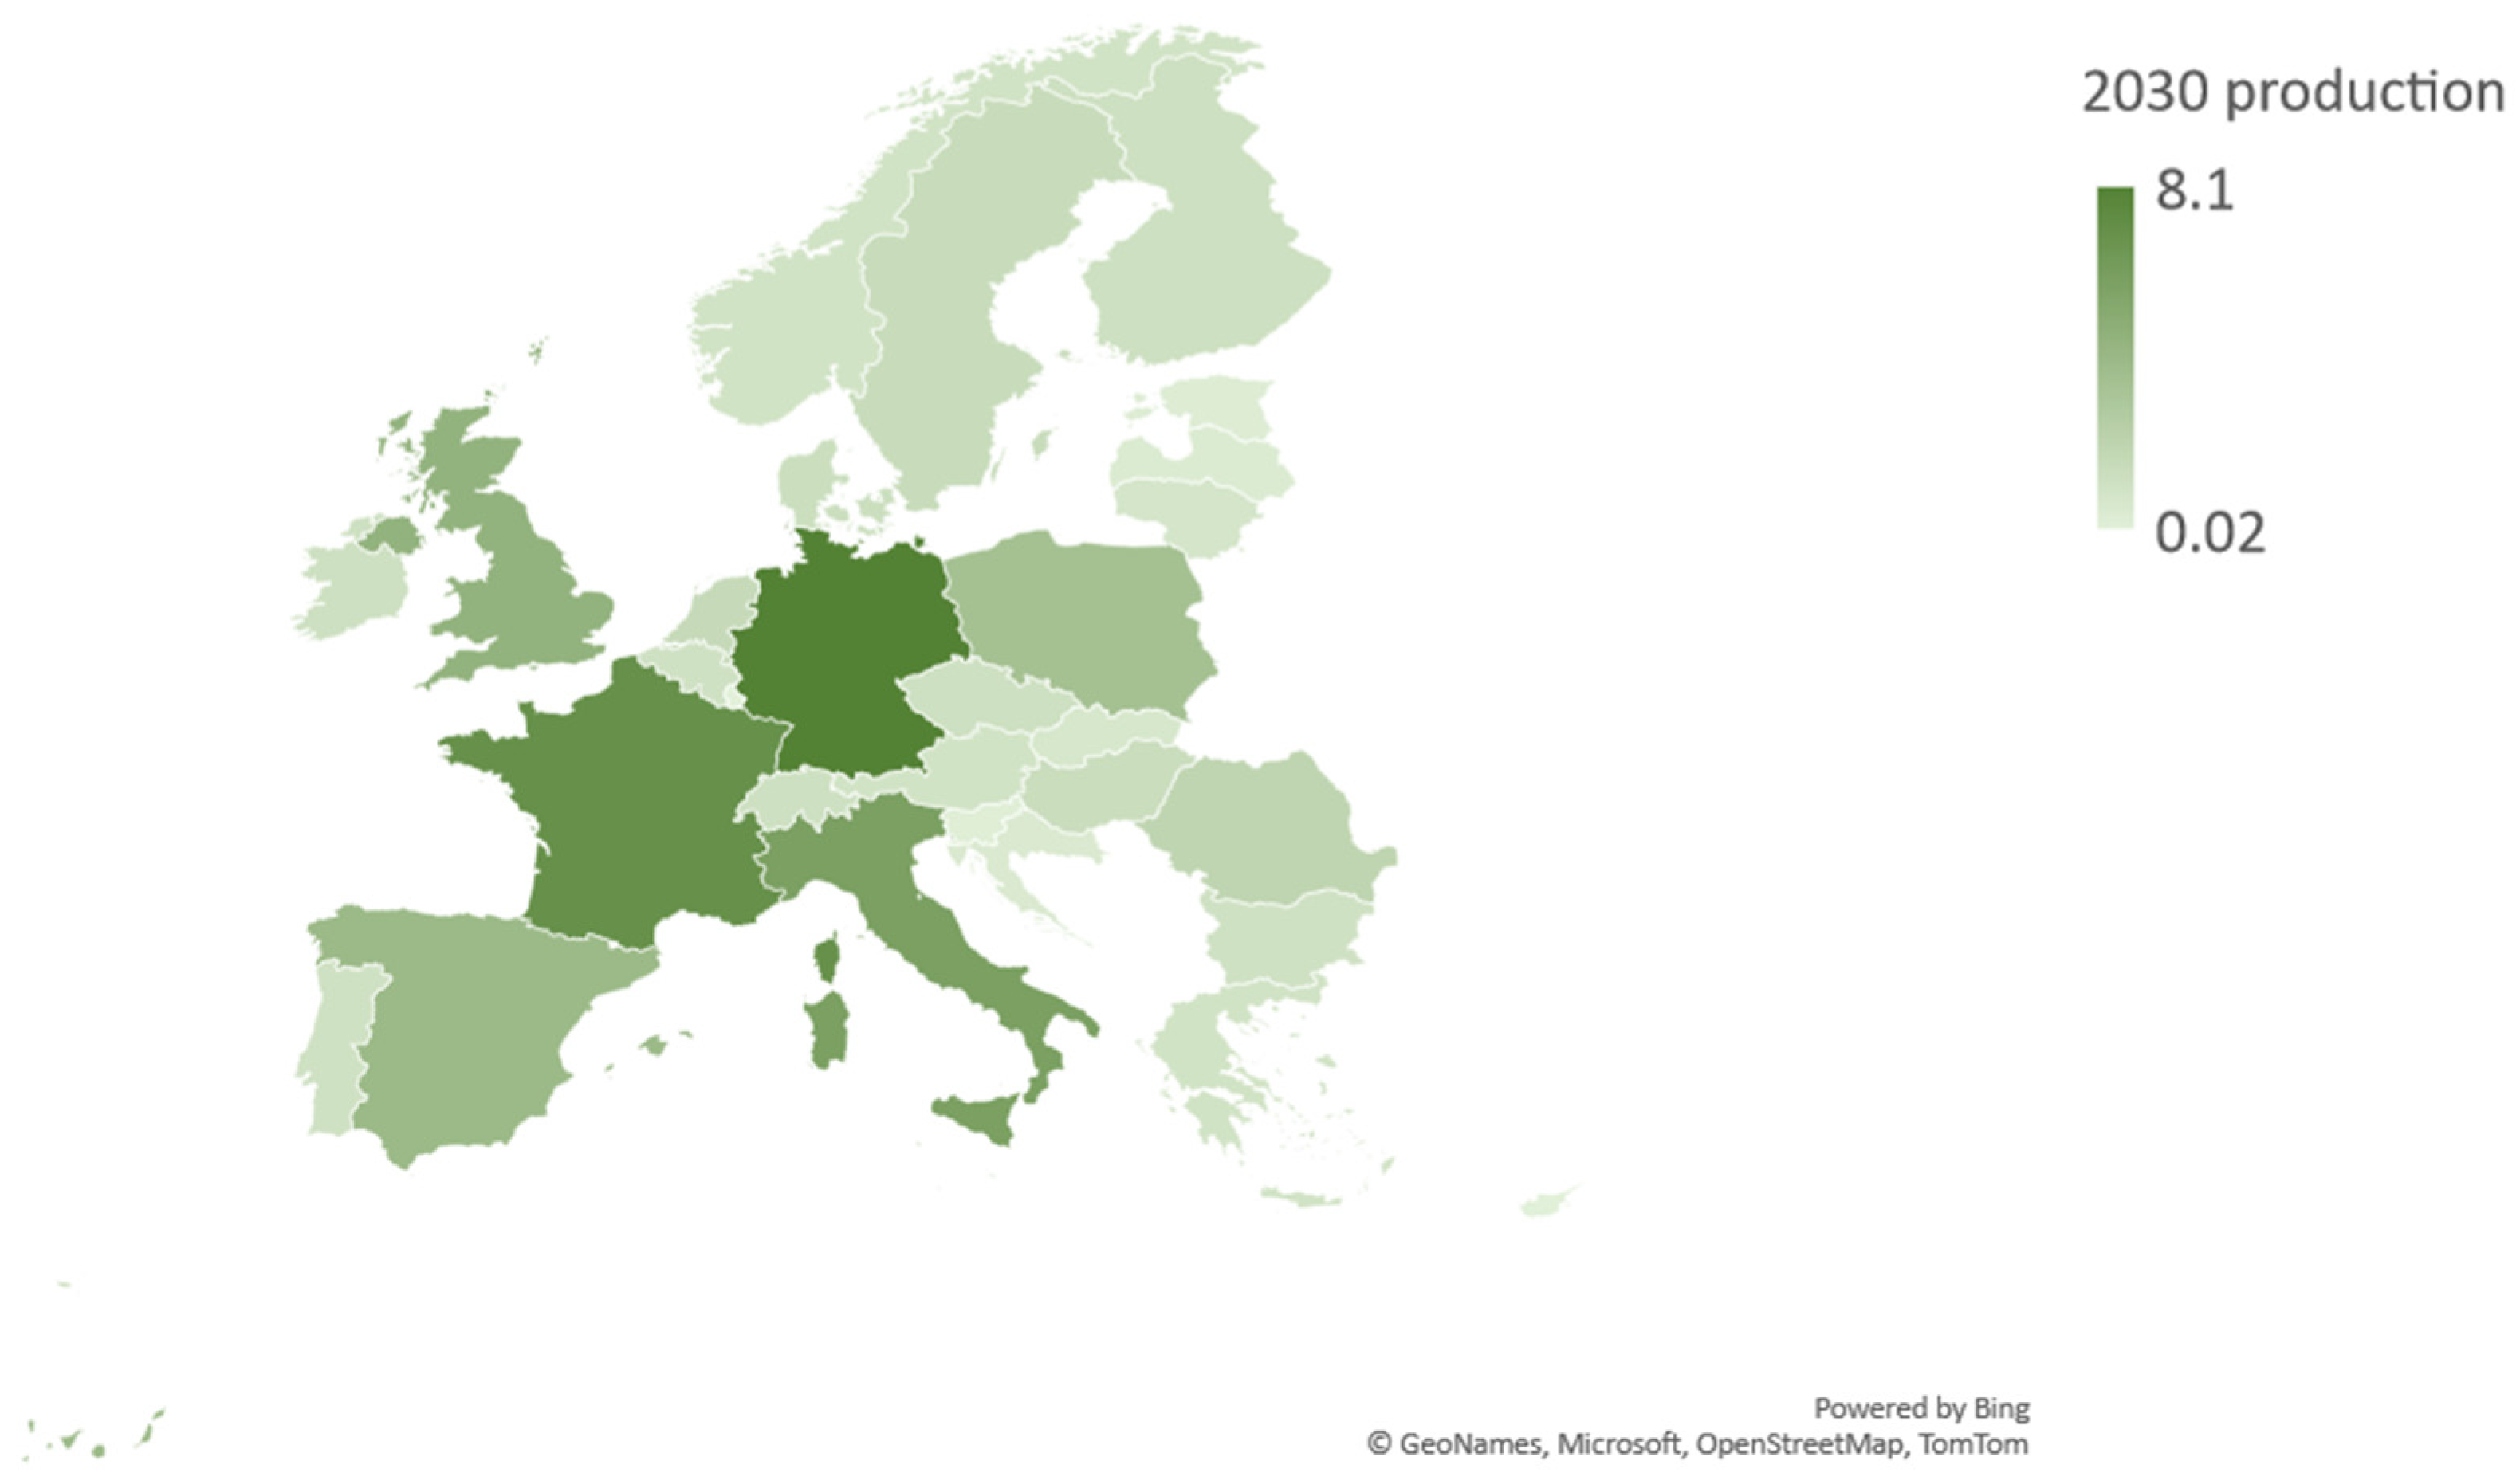
4.1. Regional Availability

One vital criterion for a biofuel to be sustainable is to have a positive net energy balance (NEB) [33,34]. Thus, the availability of potential biofuels will also depend on the energy requirements of the feedstock that will be determined by a NEB analysis. As already mentioned, the availability of biogas varies on a per-region basis as it depends on the available amount of biomass feedstock. The availability of biomethane will also depend on the availability of upgrading facilities or the ability of biomethane transportation, given that the gasification route is at a currently low TRL level.
A study by CE Delft [14] estimated the maximum “conceivable” sustainable biomethane potential by 2030 to be between 40-120EJ and 40-180EJ by 2050, assuming that all available sustainable biomass is converted to biomethane. Note that in the same study “the projected energy demand from shipping of 12–14 EJ in 2030 and 10–23 EJ in 2050”. Thus, these estimations constitute an impressive potential regarding biomethane. These estimates are forecasted to increase provided that aquatic biomass is also included. However, there are a limited number of studies that investigate the sustainability, and hence availability, of aquatic biomass [14]. Note that aquatic biomass has a very large theoretical production potential, due to a large availability of growth in oceans and low interference with “agricultural land”, but the current technology readiness level is very low [14]. Note that macroalgae are suitable feedstock candidates for biomethane production, as they contain low levels of lignin [14,35]. However, a large percentage of microalgal biodiesel reported a low energy return on investment (ERO1 < 1), mostly due to the low technological maturity and “lack of understanding” of many issues [36,37]. Gegg and Wells [37] performed a PESTEL analysis for the UK and mentioned that “very little is known about the potential economic, social, environmental and political/legal issues”.
Regional availability of biomass (feedstock availability) is one critical factor that will determine the availability of biogas and biomethane. It is very difficult to estimate the global distribution of feedstock as different studies use different boundaries and assumptions [14]. Most biomass feedstock potential is widely distributed across the globe, with a significant amount produced in Asia Pacific, North, Central, and South America, and Europe [14,38]. Other reports, with different assumptions and approximations, report sustainable biomass potential from 22 to 33% in Asia, 14 to 21% in Latin America, 8 to 16% in Africa, and 19 to 25% in Europe and North America [14,39,40]. However, the current (2018) largest biomethane production originates from Europe [38]. Note that the European Commission via the REPowerEU plan aims to ramp up biomethane production, with an aim of 35 billion cubic meters (bcm) annual biomethane production by 2030 [41,42]. Current EU biogas and biomethane production is estimated at 15 bcm and 3 bcm, respectively [41]. As a comparison, the 2020 total proved natural gas reserves for Europe is 3200 bcm and natural gas production is 218.6 bcm [43]. Gas for Climate [41] estimates biomethane production potential to be 41 bcm, overcoming the REPowerEU plan target, and 151 bcm by 2030 and 2050, respectively, with most production in Germany, France, Italy, Spain, and Poland (with approximately over 60% of total production; note, however, an increasing contribution from the rest of the EU27 block is predicted; refer to Figure 4 and Figure 5).
A second critical factor for biomethane availability is the available infrastructure and know-how on upgrading biogas to biomethane. Note that about 90% of current biomethane production originates from biogas upgrading [38]. The current percentage of biogas upgraded to biomethane varies from region to region and is listed in Table 2. Note that even though currently Europe has the highest production of biogas and biomethane, only a small fraction of biogas is upgraded, which may be due to the relatively higher cost of upgrading biomethane [38], pp. 21, 38. Table 2 also compares the relative cost of upgrading biomethane with the cost of natural gas production. Biomethane production is almost 2–4 times the cost of producing natural gas across the globe.

4.2. The Biomethane WtW Supply Chain

The current trend of the industry and the IMO is to perform a well-to-wake analysis, as per Figure 6, describing the overall supply chain. The generic well-to-wake (WtW) supply chain of the base document (ISWG-GHG 11/2/3 paragraph 3.5 [44]) is illustrated with the addition of the term eoccs, which describes possible carbon capture and storage, implying even negative GHG emissions (although yet to be proven).
The well-to-tank (WtT) (processing and refining) includes the biogas upgrade to biomethane. Transport and distribution depend on whether biomethane and/or biogas is compressed or liquefied. This distinction depends on the application, such as ocean-going vessels versus short-sea shipping, storage issues, and available infrastructure (as discussed in Section 5). These also depend on the geographical location.

4.3. Cost Breakdown for Biomethane to Vessel and/or to Port

The cost constituents, from source to vessel and/or to port, for biomethane are illustrated in Figure 7. The flowchart breaks down the cost into the biomass feedstock cost, its transportation for processing, the cost of production of biomethane (including pre-treatment and upgrading, etc.), its storage either in liquefied or compressed state, its eventual transportation (either gaseous or liquefied state), and the eventual bunkering to a vessel. Note that the flowchart presents all possible pathways in the cost breakdown; however, it does not include regional cost variations.

5. Applicability for the Maritime Industry

Biogas and biomethane have similar chemical and physical properties to natural gas, with the main difference being the CH4 content [45,46]. Therefore, the direct use of biogas and biomethane in existing engines and/or infrastructure (including storage and transportation) is the most competitive fact, with the only exception being extra post- and pre-treatment of biogas due to the additional impurities, as discussed in Section 7. Liquification of biomethane (LBM) demands extensive and a prior set infrastructure as well as enormous quantities of sustainable feedstocks delivered systematically into a centralised biomethane production and liquification facility, thus producing the required biofuel in a cost competitive manner. Such dedicated infrastructure and related value chain does not currently exist in most of the EU member states, and especially in developing and emerging countries around the globe.
On the other hand, compressed biomethane (CBM) requires cylinders to be stored in cascade, which requires more space with an increased mass as compared to liquefied biomethane. However, in countries with no available or limited infrastructure to transport liquefied natural gas, decentralised distribution of CBM is potentially an opportunity. In addition, transportation in pipelines occurs in the compressed gaseous state (CNG); thus, CBM could utilise the existing infrastructure for its eventual transportation.
In our view, liquid biofuels are a better alternative for vessels that have high energy demands (either due to large distances travelled, high speed, or due to vessels’ energy needs). Liquid biofuels can be blended with conventional fuels, and hence there is no need for cryogenic storage, de-liquefaction, etc. However, no options should be excluded, including gaseous biofuels, as there is no “silver bullet” in the decarbonisation of the shipping industry.

5.1. Shore-Side Electricity

Shore-side electricity (SSE), or also known as onshore power supply or cold ironing, can offer significant CO2 reductions from fossil-powered auxiliary engines of ships at berth [47,48]. Williamsson et al. [49] discuss in their extended survey the key barriers and drivers for SSE. In their review, they identify a key barrier as “limited access to power and especially renewable power” due to poor access. However, they identify, due to this “shortage of power”, cogeneration plants using biogas as a possible area to mitigate issues with a shortage of power. In their survey, they have also identified natural gas and LNG as possible solutions; however, in the long run, these are not considered as decarbonisation solutions, but, in the short run, these fuels are considered as bridging fuels and can be considered as a solution for the decarbonisation of the shipping industry.
Williamsson et al. [49] also correctly mention that supplying SSE with solar and wind sources is particularly challenging, mostly because of the intermittent nature of these sources and the need to establish storage solutions, such as batteries. In some countries, where electricity demand is not matched with electricity production, curtailment is also necessary due to the inability of energy RES storage (either in batteries [50] or energy carriers, such as hydrogen [51] or ammonia [52]). Chakraborty et al. [50], pp. 4–5, review additional energy storage systems in relation to deregulated markets. In view of the above limitations, biogas and biomethane are seen as a very promising solution for green SSE.
Biomethane is equally applicable for SSE applications and possibly preferable due to less requirements in after-treatment. As will be discussed in Section 7, combusting biogas is tricky due to the different impurities it contains (and varying composition per batch). A port authority will also need to choose between compressed and liquefied state. Depending on the region, and due to the unavailability of infrastructure, (cryogenic facilities, transportation, etc.), low space, and low investment, the compressed state may be a preferable option compared to its liquefied state. It is worthwhile mentioning that RES sources from wind and solar are difficult to manage in terms of SSE. This is because of the possibility of immediate power needed when multiple vessels arrive at a port, considering the intermittency issues of wind and solar. This is a widely experienced difficulty that electric power suppliers have when supplying green electricity in a short period of time [53] and avoiding curtailment of electricity when there is a surplus of RES. However, a diesel engine/gas turbine-driven generator burning biomethane/biogas near a port location can provide solutions due to high power density characteristics, fast start-up times, and quick access (ports will have already existing infrastructure in place to cover needs).

5.2. World Fleet and Projections

For operational profiles that need large energy requirements (defined by their range and/or cruising speed), the liquefied state of biomethane is the preferred option due to its higher energy density compared to its gaseous state. In terms of storage, liquefied methane requires cryogenic conditions, and thus needs special care in transportation and storage [1], but compared to its gaseous state needs “600 times less storage” [54]. Storage will be an important factor considering the predictions of biomethane production and availability by 2030 and 2050. Currently, LBM is only used as a drop-in fuel. Therefore, liquified blends of biomethane and fossil natural gas can only be utilised in dedicated vessels with cryogenic fuel storage onboard. This also implies an energy penalty for cryogenic storage and an on-board available space penalty, where the latter translates to less profit for a vessel operator/manager/owner.
In 2020, the CMA CGM’s Jacques Saadé, a large ocean-going containership (23,000 TEU), completed the first LNG bunkering with Total’s LNG bunker vessel at the Port of Rotterdam [55]. It is noteworthy that LBM was also introduced in the fuel bunkering mixture (~13%). The mixture was certified through a Guarantee of Origin certificate mechanism [55]. In the case of CMA CGM’s Jacques Saadé, it is evident that the use of LBM (and its eventual bunkering) was possible by taking advantage of the existing available LNG bunkering infrastructure at the Port of Rotterdam. Table 3 classifies all vessels more than 500 DWT, with respect to vessels in-service and newbuildings of the total fleet, and compares them to the corresponding vessels that use LNG and LPG as fuel. Currently, only 1.14% and 0.075% of the total world fleet in operation use LNG and LPG, respectively. These factors seemingly limit the current global market access potential of biomethane as a marine biofuel. However, looking at the number of newbuilds (including vessels on order up to 2027), these percentages dramatically increase to 18.50% and 2.16% for LNG and LPG, respectively, illustrating the great potential of biomethane uptake in the next decade. Note that the percentages remain almost unchanged for vessels above 5000 DWT (the minimum DWT that are covered by the IMO and Fit for 55 regulations).
Figure 8 shows the breakdown of LNG- and LPG-fuelled vessels per vessel type. The majority of LNG-fuelled vessels currently in-service are LNG tankers (41.42%) and LPG tankers (7.22%), with a combined percentage of 48.64%. However, newbuildings expected to be in-service are LNG tankers (29.77%), container ships (21.85%), and LPG tankers (10.80%). Currently, a potential market for LBM could be LNG and LPG tankers; however, LBM could be expected to penetrate the container ship market and vehicles carriers (8.76%) and bulk carriers (5.04%) to a lower extent.
Figure 9 compares the newbuildings as IHS Markit. In the figure, it is notable that planned vessels that will use alternative fuels are hydrogen, ethane, methanol, and liquefied biogas. In fact, one vessel using liquefied biogas is planned to be launched in 2023 [56]. Note that there is no distinct reference for the origin of hydrogen, ethane, and methanol (i.e., green, blue, etc.).
For operational profiles that have low energy requirements, batteries are a potential solution. Note that batteries have the following limitations: (1) heavy; (2) low energy density; and (3) high derating due to their charging cycles. This implies a limited operational range. It should be highlighted that the potential GHG emissions benefits of batteries on a WtW life cycle assessment basis are yet to be proven. On the other hand, CBM can be a solution for the decarbonisation of vessels with a low energy operational profile, such as small coastal vessels.

6. Biogas and Biomethane Pollutant Emissions Performance in Dual-Fuel Compression-Ignition Marine Engines

Marine ICEs have an almost 98% market penetration in the global fleet because of their high maturity, reliability, and efficiencies [1,57,58,59,60]. Compared to spark-ignition engines, compression-ignition engines have higher thermal efficiencies, but with comparatively higher NOx and soot emissions [61,62,63]. Compression-ignition engines need a pilot injection of conventional fossil fuels for the combustion process to start. On the other hand, spark-ignition engines can burn biogas/biomethane the way they burn LNG or LPG [64,65]. Note the main disadvantage of biogas in spark-ignition engines is the low performance due to the high proportions of inert gases (CO2 and N2) [66]. In fact, Crooke [66] addressed this issue by raising the compression ratio (i.e., taking advantage of the compression-ignition engine philosophy), but with a degradation in NOx emissions. Hence, biogas in compression-ignition engines will improve emissions, except NOx emissions, while, at the same time, maintaining high thermal efficiencies [67]. The successful combustion of biogas in compression ignition can be achieved in dual fuel model, where biogas is port injected and diesel is directly injected into the engine [67]. Historically, the application and research of biogas in compression-ignition engines began in the early 1980s owing to high thermal efficiencies. Notable examples are the works of Mathur et al. [68,69,70], who tested biogas in compression-ignition engines, and Mustafi et al. [71], who investigated various CH4/CO2 ratios to simulate the effect of biogas with different compositions. In fact, Mustafi et al. [71] reported significant PM emissions reductions (up to 70%).
In fact, in some applications, hydrogen is added to improve the combustion properties of biogas [72]. The use of biogas as a dual fuel is in compression-ignition engines burning diesel. This is because dual fuel mode has the capacity to “inhibit” harmful emissions and, at the same time, improve combustion efficiency [73]. Lounici et al. [74] examined the performance and exhaust emission of biogas–diesel dual fuel in a compression-ignition engine and determined that at high loads PM emissions are significantly reduced. Barik et al. [75] examined various substitution ratios in a dual-fuel engine and found that the BSFC decreased by about 30% due to the reduced heat release rate, which was delayed by the dual-fuel mixture. Note that biogas (without biomethane upgrading) is used in stationary ICE applications [76], i.e., in the production of heat and electricity in cogeneration systems [77,78,79]. In addition, the application of biogas in compression-ignition engines that occurs in dual-fuel mode is an attractive and optimal way to use it [72,80].
There have been advances in retrofitting ICEs (either for propulsion or auxiliary power production—marine gensets) with alternative fuels (such as hydrogen, ammonia, and methanol). Currently, the market is responding to these with notable examples; however, further research is required of hydrogen [58,60], ammonia [52,81,82,83,84,85], and methanol [85,86,87,88,89] (also see Figure 9).
Some key performance indicators for the successful use of methane, and, in this case, biomethane, in internal combustion engines can be summarised as [90]: (1) chemical composition (methane concentration, pollutant content, etc.); (2) resistance to knock; (3) ignition and self-ignition temperatures; (4) fuel stoichiometric constant; (5) combustion rate of fuel–air mix; and (6) energy value (measured via calorific value of Wobbe index).
Exhaust gas recirculation (EGR) can also improve and optimise the combustion performance of an engine [67,91]. In fact, cooled EGR can have several advantages, such as it: (1) prolongs the ignition delay; (2) lowers the combustion rate; and (3) suppresses the pressure and temperature rise rate [92,93]. It is noteworthy that Abdelaal et al. [94] examined the effects of EGR with natural gas/diesel in dual-fuel mode in a single DI engine and found that EGR improves the performance at part loads and emissions in dual-fuel mode. At the same time, lower NOx and smoke levels were achieved. At high loads they found that the oxygen concentration was reduced to the stoichiometric level due to EGR.

7. The Benefits of Biogas Upgrade to Biomethane

As alluded to in Section 6, there are notable issues of using biogas in internal combustion engines (ICEs) [95,96,97], which can be listed as:
  • High CO2 content that limits power output;
  • H2S is acidic, which can damage the engine in a very short period;
  • High residual moisture, which can impact ignition (during ICE start-up);
  • Gas composition variation in quality and pressure;
  • Damage of engine parts due to the combustion of siloxanes.
The presence of siloxanes originates from landfills and anaerobic digestion, and its chemical formula contains silicon-based impurities [98]. The combustion of siloxanes produces white deposits (either in a crystal or amorphous state) on several engine components and other units (valves, engine heads, boiler tubes, intercooler radiator) depending on the temperature, which may impact the performance or lead to eventual failure [99,100,101].
Therefore, the upgrading of biogas to biomethane is important as it eliminates harmful pollutants (tabulated in Table 4). However, and as discussed by Biernat et al. [90], research papers on biomethane applied to ICEs are scarce due to the lack of available infrastructure for upgrading biogas to biomethane. Namely, the main components are methane (CH4) and carbon dioxide (CO2), while minor constituents may be water vapor (H2O), hydrogen sulfide (H2S), nitrogen (N2), hydrogen (H2), oxygen (O2), carbon monoxide (CO), siloxanes, and ammonia (NH3) [102,103,104]. Note that upgrading improves the heating value of biogas, due to the removal of CO2 [59,105].
Biernat et al. [90] reported that the retrofit of a Cummins motor from diesel fuel to methane led to the following key results: (1) a reduction of specific brake emissions of carbon monoxide (26–34%); (2) a reduction of hydrocarbons (60–75%); (3) a reduction of specific brake emissions of nitrogen oxides (approximately 50%); and (4) the complete elimination of particulate matter irrespective of test. Rimkus et al. [109] simulated biomethane as 60 vol.% of methane and 40 vol.% of CO2 and found that the BTE declined by 11.9–16.5%; however, the use of biomethane increased the CO2 volumetric fraction in the exhaust gases by 10–14% due to the presence of CO2 before combustion.

Biogas to Biomethane Upgrading Pathways

There are several techniques and methodologies available in the market for upgrading biogas to biomethane, namely: (1) membrane separation (see Figure 10); (2) water scrubbing (see Figure 11); (3) chemical absorption (also known as amine scrubbing; see Figure 12); and (4) pressure swing adsorption (see Figure 13) [9,110]. There are other technologies that are less common or still in the research and development stage, namely: (1) organic physical scrubbing; (2) temperature swing adsorption; (3) cryogenic separation technologies; (4) hot potassium carbonate; (5) membrane permeation; (6) hydrate separation; and (7) biological methods [9,11,110,111,112]. Table 5 describes the main biogas-to-biomethane upgrading technologies, their issues, and their relative technological maturity.
The following figures (Figure 10, Figure 11, Figure 12 and Figure 13) are flowcharts that describe the biogas-to-biomethane upgrading pathways. The open literature has an abundance of information regarding these technologies and techniques; we merely present the basic features of the main technologies. The interested reader is redirected to the references listed in Table 5 for additional information and descriptions.
Ardolino et al. [9] performed a series of life cycle assessments and complementary environmental life cycle costing based on base, worst, and best scenarios, and concluded that the MS technology provides the best performance. However, they rightfully mention that the best and most suitable upgrading technique depends on site-specific conditions, market trends, and commercial strategies that are unique per geographical location. Similar LCA and LCC assessments are needed for upcoming technologies, such as: (1) cryogenic separation technologies; (2) hot potassium carbonate; and (3) biological methods. However, the appropriate selection of these upgrading methods depends on: (1) the appropriate purification efficiency; (2) the operational conditions; and (3) the maintenance costs [45,113].

8. Conclusions

Gaseous biofuels can play an important role in the decarbonisation of the shipping industry. The relevant IMO regulations and the recent Fit for 55 legislation package have been identified, and how these impact the market-based measures (MBMs) and, in the future, the environmental, social and governance (ESG) criteria has been evaluated. The PESTEL and SWOT analyses identified mainly opportunities for the biogas and biomethane, mostly due to the impact of the relevant regulations, MBMs and ESG. In addition, technological maturity, especially in biomethane upgrading, will create additional market opportunities for biomethane.
This review paper examined several parameters, including their key barriers and opportunities that need to be either addressed and/or taken into consideration before biomethane’s wider use in the shipping industry. These conditions are:
  • Sustainability and availability in relation to the complete supply chain;
  • High production costs compared to their fossil counterparts;
  • Applicability of biomethane and biogas in the maritime industry.
The potential of biomass feedstock is projected to have an impressive impact. It is estimated that the potential sustainable amount may satisfy the energy needs of the maritime industry; although, this needs to be proven with case studies backed by legislation and other financial incentives. Currently, Europe is the leader in producing biogas, but only a small fraction of it is upgraded to biomethane, possibly due to the high production costs. In addition, compared to the production costs of natural gas, biomethane production costs are about 2–4 times higher across the globe.
The benefits and needs of biogas to biomethane upgrading technologies and their potential use in marine internal combustion engines have been identified. Note that biogas, due its varying composition, of which some components are toxic, is only applicable for land-based applications. However, biomethane is a suitable candidate on vessels. Note that the market seems to be moving in the direction of bridging fuels, such as LNG and LPG, and alternative fuels, such as hydrogen, ammonia, methanol, and even liquefied biomethane. The potential and use of LBM as a marine fuel has been identified with potential current end-users LNG and LPG tankers. However, looking at newbuilds from the IHS Markit, LBM could also be utilised in other segments, such as container ships, vehicle carriers, and bulk carriers (in fact, almost 20% of newbuild orders will use LNG/LPG as marine fuel). In fact, a vessel operating on liquefied biogas is planned to be launched in 2023. On the other hand, CBM can be exploited in vessels with low energy needs, low space requirements, and low investment, as well as shore-side electricity, provided that the relevant infrastructure exists, otherwise the cost to construct new infrastructure may be prohibitive.
The fundamental and promising technologies that can aid biomethane’s uptake by the shipping industry have been identified in relation to technology maturity. In terms of the technology readiness level, the membrane separation pathway seems to be the most suitable in terms of LCC and LCA. However, if challenges for the upcoming biogas to biomethane upgrading technologies are addressed, it will undoubtedly aid biomethane in becoming a competitive green fuel.
Future RTDI activities can include further investigation and suitability of supply chain issues related to biomethane. The supply chain issues include the upgrading of biogas related to geographical location and to missing infrastructure for compressed natural gas (funded projects are BioCH4-to-Market [27] and BioCNG-to-Cold Ironing [28]). Further research is needed for the inclusion of carbon capture and storage in the supply chain of biomethane, which includes on-board vessels (an example is Green Marine [126]) and shore-side electricity applications. Finally, RTDI activities should be directed to the promising low TRL level biogas upgrading technologies, namely: organic physical scrubbing; temperature swing adsorption; cryogenic separation technologies; hot potassium carbonate; membrane permeation; hydrate separation; and biological methods. The objectives should be focused on technoeconomic criteria that will achieve cost parity and their potential commercialisation.

Author Contributions

Conceptualisation, G.M.; methodology, G.M. and E.A.Y.; formal analysis, all authors; investigation, G.M., C.I., A.P. and A.K.; resources, G.M.; data curation, G.M.; writing—original draft preparation, G.M.; writing—review and editing, all authors; visualisation, G.M., C.I. and A.P.; supervision, E.A.Y.; project administration, G.M.; funding acquisition, G.M. and E.A.Y. All authors have read and agreed to the published version of the manuscript.

Funding

The research is part of the BioCH4-to-Market project, which was funded by the Research and Innovation Foundation (RIF) as part of the ‘RESEARCH IN ENTERPRISES’ programme, under grant agreement number ENTERPRISES/0521/0162.

Data Availability Statement

Not applicable.

Acknowledgments

The Cyprus Marine and Maritime Institute (CMMI) has been established as an EU Centre of Excellence in Marine and Maritime Research and Innovation and has received funding from the European Union’s Horizon 2020 research and innovation program within the framework of the CMMI/MaRITeC-X project under grant agreement No. 857586. The authors would also like to thank IHS Markit for providing raw access data of vessel characteristics.

Conflicts of Interest

The authors declare no conflict of interest. The funders had no role in the design of the study; in the collection, analyses, or interpretation of data; in the writing of the manuscript; or in the decision to publish the results.

Abbreviations

CAChemical absorption
CBMCompressed biomethane
CNGCompressed natural gas
CIICarbon Intensity Index
CSRCorporate social responsibility
DNVDet Norske Veritas
DWTDeadweight tonnage
ECAEmission control area
EEDIEnergy Efficiency Design Index
EEXIEnergy Efficiency Existing Ship Index
EGRExhaust gas recirculation
ESGEnvironmental, social, and governance
ETSEmissions Trading Schemes
GHGGreenhouse gases
HFOHeavy fuel oil
ICEInternal combustion engine
IMOInternational Maritime Organization
LBMLiquefied biomethane
LCALife cycle assessment
LCCLife cycle costing
LNGLiquefied natural gas
LPGLiquefied propane gas
MARPOLInternational Convention for the Prevention of Pollution from Ships
MBMsMarket-based measures
MEPCMarine Environment Protection Committee
MGOMarine gas oil
MSMembrane separation
NEBNet energy balance
NECANitrogen emission control area
OPEXOperational expenditure
PESTELPolitical, economic, social, technological, environmental, and legal factors
PSAPressure swing adsorption
REDRevised Renewable Energy Directive
RESRenewable energy source
RTDIResearch, technology, development, and innovation
SECASulphur emission control areas
SEEMPShip energy efficiency management plan
SECASulphur emission control area
SSEShore-side electricity
SWOTStrengths, weaknesses, opportunities, and threats
TRLTechnological readiness level
ULSFOUltra-low sulphur fuel oil
VLSFO Very low sulphur fuel oil
WSWater scrubbing
WtTWell-to-tank
WtWWell-to-take

References

  1. Mallouppas, G.; Yfantis, E. Decarbonization in Shipping Industry: A Review of Research, Technology Development, and Innovation Proposals. J. Mar. Sci. Eng. 2021, 9, 415. [Google Scholar] [CrossRef]
  2. Nisiforou, O.; Shakou, L.; Margou, A.; Charalambides, A. A Roadmap towards the Decarbonization of Shipping: A Participatory Approach in Cyprus. Sustainability 2022, 14, 2185. [Google Scholar] [CrossRef]
  3. Oh, Y.-K.; Hwang, K.-R.; Kim, C.; Kim, J.R.; Lee, J.-S. Recent developments and key barriers to advanced biofuels: A short review. Bioresour. Technol. 2018, 257, 320–333. [Google Scholar] [CrossRef] [PubMed]
  4. UNCTAD. The Biofuels Market: Current Situation and Alternative Scenarios; United Nations Conference on Trade and Development, United Nations: Geneva, Switzerland; New York, NY, USA, 2009. [Google Scholar]
  5. Mofor, L.; Nuttall, P.; Newell, A. Renewable Energy Options for Shipping; Technology Brief; IRENA, Innovation and Technology Centre: Bonn, Germany, 2015. [Google Scholar]
  6. Kumar, R.; Dhurandhar, R.; Chakrabortty, S.; Ghosh, A.K. Downstream process: Toward cost/energy effectiveness. In Handbook of Biofuels; Academic Press: Bhopal, India, 2021; pp. 249–260. [Google Scholar]
  7. Abdullah, B.; Muhammad, S.A.F.; Shokravi, Z.; Ismail, S.; Kassim, K.A.; Mahmood, A.N.; Aziz, M.M.A. Fourth generation biofuel: A review on risks and mitigation strategies. Renew. Sustain. Energy Rev. 2019, 107, 37–50. [Google Scholar] [CrossRef]
  8. Doliente, S.S.; Narayan, A.; Tapia, J.F.D.; Samsatli, N.J.; Zhao, Y.; Samsatli, S. Bio-aviation Fuel: A Comprehensive Review and Analysis of the Supply Chain Components. Front. Energy Res. 2020, 8, 110. [Google Scholar] [CrossRef]
  9. Ardolino, F.; Cardamone, G.; Parrillo, F.; Arena, U. Biogas-to-biomethane upgrading: A comparative review and assessment in a life cycle perspective. Renew. Sustain. Energy Rev. 2021, 139, 110588. [Google Scholar] [CrossRef]
  10. European Commission. Directive (EU) 2015/1513 of the European Parliament and of the Council of 9 September 2015; European Commission: Brussels, Belgium, 2015. [Google Scholar]
  11. Patterson, T.; Esteves, S.; Dinsdale, R.; Guwy, A. An evaluation of the policy and techno-economic factors affecting the potential for biogas upgrading for transport fuel use in the UK. Energy Policy 2011, 39, 1806–1816. [Google Scholar] [CrossRef]
  12. DNV. Maritime Forecast to 2050. In Energy Transition Outlook 2022; DNV: Bærum, Norway, 2022. [Google Scholar]
  13. Hsieh, C.-w.C.; Felby, C. Biofuels for the Marine Shipping Sector. IEA Bioenergy. 2017. Available online: https://www.ieabioenergy.com/wp-content/uploads/2018/02/Marine-biofuel-report-final-Oct-2017.pdf (accessed on 10 December 2022).
  14. Nelissen, D.; Faber, J.; van der Veen, R.; van Grinsven, A.; Shanthi, H.; van den Toorn, E. Availability and costs of liquefied bio- and synthetic methane. In The Maritime Shipping Perspective; CE Delft: Delft, The Netherlands, 2020. [Google Scholar]
  15. Brynolf, S.; Fridell, E.; Andersson, K. Environmental assessment of marine fuels: Liquefied natural gas, liquefied biogas, methanol and bio-methanol. J. Clean. Prod. 2014, 74, 86–95. [Google Scholar] [CrossRef]
  16. ABS. ABS Regulatory News Marpol Annex VI—Biofuels as Marine Fuels; AMERICAN Bureau of Shipping: Houston, TX, USA, 2022. [Google Scholar]
  17. IMO. Unified Interpretations to Marpol Annex VI Mepc.1/Circ.795/Rev.6; International Maritime Organisation: London, UK, 2022. [Google Scholar]
  18. IMO. Guidance on the Development of a Ship Implementation Plan for the Consistent Implementation of the 0.50% Sulphur Limit under Marpol Annex VI Mepc.1/Circ.878; International Maritime Organisation: London, UK, 2018. [Google Scholar]
  19. Gustafsson, M.; Anderberg, S. Biogas policies and production development in Europe: A comparative analysis of eight countries. Biofuels 2022, 13, 931–944. [Google Scholar] [CrossRef]
  20. IMO. Market-Based Measures. 2019. Available online: https://www.imo.org/en/OurWork/Environment/Pages/Market-Based-Measures.aspx (accessed on 15 December 2022).
  21. Lagouvardou, S.; Psaraftis, H.N.; Zis, T. A literature survey on market-based measures for the decarbonisation of shipping. Sustainability 2020, 12, 3953. [Google Scholar] [CrossRef]
  22. Psaraftis, H.N. Market-based measures for greenhouse gas emissions from ships: A review. WMU J. Marit. Aff. 2012, 11, 211–232. [Google Scholar] [CrossRef] [Green Version]
  23. Psaraftis, H.N.; Zis, T.; Lagouvardou, S. A comparative evaluation of market based measures for shipping decarbonization. Marit. Transp. Res. 2021, 2, 100019. [Google Scholar] [CrossRef]
  24. Dathe, T.; Dathe, R.; Dathe, I.; Helmold, M. Corporate Social Responsibility (CSR), Sustainability and Environmental Social Governance (ESG); Approaches to Ethical Management; Springer: Cham, Switzerland, 2022. [Google Scholar]
  25. Deloitte. ESG in the Shipping Sector. The Role of ESG in the Evaluation of Shipping Companies. Deloitte. Available online: https://www2.deloitte.com/content/dam/Deloitte/gr/Documents/consumer-business/gr_esg_in_the_shipping_sector_noexp.pdf (accessed on 15 December 2022).
  26. DNV. ESG in Maritime-Acting Now for a Sustainable Future. DNV. 2022. Available online: https://www.dnv.com/services/esg-in-maritime-acting-now-for-a-sustainable-future-202006 (accessed on 16 December 2022).
  27. CMMI. BioCH4-to-Market. Cyprus Marine and Maritime Institute. 2022. Available online: https://www.cmmi.blue/bioch4-to-market/ (accessed on 16 December 2022).
  28. CMMI. bioCNG-to-Cold Ironing. Cyprus Marine and Maritime Institute. 2023. Available online: https://www.cmmi.blue/biocng-to-cold-ironing/ (accessed on 1 December 2022).
  29. Fonden Mærsk Mc-Kinney Møller Center. Accelerating Deployment of Low-LCI Biomethane in Shipping. Fonden Mærsk Mc-Kinney Møller Center. 2022. Available online: https://www.zerocarbonshipping.com/projects/accelerating-deployment-of-low-lci-biomethane-in-shipping/ (accessed on 20 December 2022).
  30. CMA; CGM; ENGIE. CMA CGM and ENGIE Set to co-Invest in the Salamander Project, to Produce Second-Generation Biomethane. CMA CGM. 2022. Available online: https://cmacgm-group.com/en/news-media/salamander-project-with-engie-to-produce-second-generation-biomethane (accessed on 1 December 2022).
  31. Attero. FirstBio2Shipping: First Bio-LNG Production Plant for Marine Shipping. Attero. 2021. Available online: https://climate.ec.europa.eu/system/files/2022-07/if_pf_2021_firstbior2ship_en.pdf (accessed on 15 December 2022).
  32. IMO. Marine Environment Protection Committee (MEPC)—79th session, 12–16 December 2022. International Maritime Organisation. 16 December 2022. Available online: https://www.imo.org/en/MediaCentre/MeetingSummaries/Pages/MEPC-79-Preview.aspx (accessed on 21 December 2022).
  33. Fore, S.R.; Porter, P.; Lazarus, W. Net energy balance of small-scale on-farm biodiesel production from canola and soybean. Biomass Bioenergy 2011, 35, 2234–2244. [Google Scholar] [CrossRef]
  34. Vanek, F.; Albright, L.; Angenent, L. Energy Systems Engineering: Evaluation and Implementation, 2nd ed.; Mc Graw Hill: New York, NY, USA, 2012. [Google Scholar]
  35. Ghadiryanfar, M.; Rosentrater, K.A.; Keyhani, A.; Omid, M. A review of macroalgae production, with potential applications in biofuels and bioenergy. Renew. Sustain. Energy Rev. 2016, 54, 473–481. [Google Scholar] [CrossRef]
  36. Milledge, J.J.; Heaven, S. Energy Balance of Biogas Production from Microalgae: Effect of Harvesting Method, Multiple Raceways, Scale of Plant and Combined Heat and Power Generation. J. Mar. Sci. Eng. 2017, 5, 9. [Google Scholar] [CrossRef] [Green Version]
  37. Gegg, P.; Wells, V. UK Macro-Algae Biofuels: A Strategic Management Review and Future Research Agenda. J. Mar. Sci. Eng. 2017, 5, 32. [Google Scholar] [CrossRef] [Green Version]
  38. IEA. Outlook for Biogas and Biomethane: Prospects for Organic Growth; IEA: Paris, France, 2020. [Google Scholar]
  39. Daioglou, V.; Doelmana, J.C.; Wicke, B.; Faaij, A.; van Vuurena, D.P. Integrated assessment of biomass supply and demand in climate change mitigation scenarios. Glob. Environ. Chang. 2019, 54, 88–101. [Google Scholar] [CrossRef] [Green Version]
  40. IRENA. Global Bioenergy Supply and Demand Projections: A Working Paper for REmap 2030; International Renewable Energy Agency (IRENA): Abu Dhabi, United Arab Emirates, 2014. [Google Scholar]
  41. Alberici, S.; Grimme, W.; Toop, G. Biomethane Production Potentials in the EU. Feasibility of REPowerEU 2030 Targets, Production Potentials in the Member States and Outlook to 2050; A Gas for Climate Report; Guidehouse Netherlands B.V. for Gas for Climate: Utrecht, The Netherlands, 2022. [Google Scholar]
  42. Commission, E. Communication from the Commission to the European Parliament, the European Council, the Council, the European Economic and Social Committee and the Committee of the Regions Repowereu Plan {SWD(2022) 230 Final}; European Commission: Brussels, Belgium, 2022. [Google Scholar]
  43. BP. Statistical Review of World Energy, 2021, 70th ed.; BP: London, UK, 2021. [Google Scholar]
  44. IMO. ISWG-GHG 11/2/3 Development of Draft Lifecycle GHG and Carbon Intensity Guidelines for Maritime Fuels (Draft LCA Guidelines); International Maritime Organisation: London, UK, 2022. [Google Scholar]
  45. Noorain, R.; Kindaichi, T.; Ozaki, N.; Aoi, Y.; Ohashi, A. Biogas purification performance of new water scrubber packed with sponge carriers. J. Clean. Prod. 2019, 214, 103–111. [Google Scholar] [CrossRef]
  46. Agarwal, A.K.; Pandey, A.; Gupta, A.K.; Aggarwal, S.K.; Kushari, A. Novel Combustion Concepts for Sustainable Energy Development; Springer: New Delhi, India, 2014. [Google Scholar]
  47. Martínez-Lopez, A.; Romero-Filgueira, A.; Chica, M. Specific environmental charges to boost Cold Ironing use in the European Short Sea Shipping. Transp. Res. Part D 2021, 94, 102775. [Google Scholar] [CrossRef]
  48. Stolz, B.; Held, M.; Georges, G.; Boulouchos, K. The CO2 reduction potential of shore-side electricity in Europe. Appl. Energy 2021, 285, 116425. [Google Scholar] [CrossRef]
  49. Barriers and Drivers to the Implementation of Onshore Power Supply—A Literature Review. Sustainability 2022, 14, 6072. [CrossRef]
  50. Chakraborty, M.R.; Dawn, S.; Saha, P.K.; Basu, J.B.; Ustun, T.S. A Comparative Review on Energy Storage Systems and Their Application in Deregulated Systems. Batteries 2022, 8, 124. [Google Scholar] [CrossRef]
  51. Mazloomi, K.; Gomes, C. Hydrogen as an energy carrier: Prospects and challenges. Renew. Sustain. Energy Rev. 2012, 16, 3024–3033. [Google Scholar] [CrossRef]
  52. Mallouppas, G.; Ioannou, C.; Yfantis, E.A. A Review of the Latest Trends in the Use of Green Ammonia as an Energy Carrier in Maritime Industry. Energies 2022, 15, 1453. [Google Scholar] [CrossRef]
  53. Yfantis, E.; Mallouppas, G.; Ktoris, A.; Ioannou, C. Fit for 55—Impact on Cypriot Shipping Industry. Preliminary Report—Assessment of the New Measures and Their Effect on the Shipping Industry and the Relevant Cyprus Economy Sectors; Submitted to the Ministry of Energy Commerce and Industry; CMMI: Larnaka, Cyprus, 2022. [Google Scholar]
  54. Bernatik, A.; Senovsky, P.; Pitt, M. LNG as a potential alternative fuel—Safety and security of storage facilities. J. Loss Prev. Process. Ind. 2011, 24, 19–24. [Google Scholar] [CrossRef] [Green Version]
  55. EBA. TOTAL and CMA CGM Complete World’s Largest Liquified Natural Gas Bunkering Operation at Port of Rotterdam. European Biogas Association. 16 November 2020. Available online: https://www.europeanbiogas.eu/total-and-cma-cgm-complete-worlds-largest-liquified-natural-gas-bunkering-operation-at-port-of-rotterdam/ (accessed on 16 December 2022).
  56. IHS Markit Global Sarl. SeaWeb; S&P Global Maritime & Trade. 2022. Available online: https://maritime.ihs.com/Account2/Index (accessed on 22 December 2022).
  57. Bilousov, I.; Bulgakov, M.; Savchuck, V. Modern Marine Internal Combustion Engines: A Technical and Historical Overview. In Series on Naval Architecture, Marine Engineering and Shipping; Springer: Cham, Switzerland, 2020. [Google Scholar]
  58. Mallouppas, G.; Yfantis, E.; Frantzis, C.; Zannis, T.; Savva, P. The Effect of Hydrogen Addition on the Pollutant Emissions of a Marine Internal Combustion Engine Genset. Energies 2022, 15, 7206. [Google Scholar] [CrossRef]
  59. Adnan, A.I.; Ong, M.Y.; Nomanbhay, S.; Chew, K.W.; Show, P.L. Technologies for Biogas Upgrading to Biomethane: A Review. Bioengineering 2019, 6, 92. [Google Scholar] [CrossRef] [Green Version]
  60. Frantzis, C.; Zannis, T.; Savva, P.G.; Yfantis, E.A. A Review on Experimental Studies Investigating the Effect of Hydrogen Supplementation in CI Diesel Engines—The Case of HYMAR. Energies 2022, 15, 5709. [Google Scholar] [CrossRef]
  61. Hashizume, T.; Miyamoto, T.; Akagawa, H.; Tsujimura, K. Emission characteristics of a MULDIC combustion diesel engine: Effects of EGR. JSAE Rev. 1999, 20, 428–430. [Google Scholar] [CrossRef]
  62. Hotta, Y.; Nakakita, K.; Inayoshi, M.; Ogawa, T.; Sato, T.; Yamada, M. Combustion improvement for reducing exhaust emissions in IDI diesel engine. JSAE Rev. 1997, 18, 19–31. [Google Scholar] [CrossRef]
  63. Bernhardt, W. Combustion technology for the improvement of engine efficiency and emission characteristics. Symp. (Int.) Combust. 1977, 16, 223–232. [Google Scholar] [CrossRef]
  64. Papagiannakis, R.G.; Zannis, T.C.; Kotsiopoulos, P.N.; Yfantis, E.A.; Hountalas, D.T.; Rakopoulos, C.D. Theoretical Study of the Effects of Engine Parameters on Performance and Emissions of a Pilot Ignited Natural Gas Diesel Engine. Energy 2010, 35, 1129–1138. [Google Scholar] [CrossRef]
  65. Zannis, T.C.; Yfantis, E.A.; Katsanis, J.S.; Pariotis, E.G.; Papagiannakis, R.G.; Mohr, H. Natural Gas Combustion in Marine Compression Ignition and Spark Ignition Engines: A Technological, Environmental and Economic Evaluation. In Proceedings of the 11th Annual Meeting on Marine Technology, Athens, Greece, 12–13 December 2017. [Google Scholar]
  66. Crookes, R. Comparative bio-fuel performance in internal combustion engines. Biomass Bioenergy 2006, 30, 461–468. [Google Scholar] [CrossRef]
  67. Shan, X.; Qian, Y.; Zhu, L.; Lu, X. Effects of EGR rate and hydrogen/carbon monoxide ratio on combustion and emission characteristics of biogas/diesel dual fuel combustion engine. Fuel 2016, 181, 1050–1057. [Google Scholar] [CrossRef]
  68. Mathur, H.; Babu, M.G.; Prasad, Y.; Singh, V. Performance and emission characteristics of a biogas operated compression ignition engine. In Proceedings of the National Conference on Fuels from Crops, Melbourne, Australia, 28–29 September 1981. [Google Scholar]
  69. Mathur, H.; Babu, M.G.; Prasad, Y.; Singh, V. Evaluation of the performance and emission characteristics of a biogas operated diesel engine. In Proceedings of the Seventh National Conference on I.C. Engines and Combustion, Surathkal, Karnataka, India; 1982. [Google Scholar]
  70. Mathur, H.; Babu, M.; Prasad, Y. A Thermodynamic Simulation Model for a Dual Fuel Open Combustion Chamber Compression Ignition Engine; SAE Technical Paper No. 861275; SAE: Warrendale, PA, USA, 1986. [Google Scholar]
  71. Mustafi, N.; Raine, R. A Study of the Emissions of a Dual Fuel Engine Operating with Alternative Gaseous Fuels; SAE Technical Paper No. 2008-01-1394; SAE: Warrendale, PA, USA, 2008. [Google Scholar]
  72. Qian, Y.; Sun, S.; Ju, D.; Shan, X.; Lu, X. Review of the state-of-the-art of biogas combustion mechanisms and applications in internal combustion engines. Renew. Sustain. Energy Rev. 2017, 69, 50–58. [Google Scholar] [CrossRef]
  73. Qian, Y.; Wang, X.; Zhu, L.; Lu, X. Experimental studies on combustion and emissions of RCCI (reactivity controlled compression ignition) with gasoline/n-heptane and ethanol/n-heptane as fuels. Energy 2015, 88, 584–594. [Google Scholar] [CrossRef]
  74. Lounici, M.; Loubar, K.; Tazerout, M.; Balistrou, M.; Tarabet, L. Experimental Investigation on the Performance and Exhaust Emission of Biogas–Diesel Dual-Fuel Combustion in a CI Engine; SAE Technical Paper No. 2014-01-2689; SAE: Warrendale, PA, USA, 2014. [Google Scholar]
  75. Barik, D.; Sivalingam, M. Performance and Emission Characteristics of a Biogas Fueled DI Diesel Engine; SAE Technical Paper No. 2013-01-2507; SAE: Warrendale, PA, USA, 2013. [Google Scholar]
  76. Owczuk, M.; Matuszewska, A.; Kruczynski, S.; Kamela, W. Evaluation of Using Biogas to Supply the Dual Fuel Diesel Engine of an Agricultural Tractor. Energies 2019, 12, 1071. [Google Scholar] [CrossRef] [Green Version]
  77. Shen, Y.; Linville, J.; Urgun-Demirtas, M.; Mintz, M.; Snyder, S. An overview of biogas production and utilization at full-scale wastewater treatment plants (WWTPs) in the United States: Challenges and opportunities towards energy-neutral WWTPs. Renew. Sustain. Energy Rev. 2015, 50, 346–362. [Google Scholar] [CrossRef] [Green Version]
  78. Gazda, W.; Stanek, W. Energy and environmental assessment of integrated biogas trigeneration and photovoltaic plant as more sustainable industrial system. Appl. Energy 2016, 169, 138–149. [Google Scholar] [CrossRef]
  79. Yağlı, H.; Koç, Y.; Köse, O.; Koç, A.; Yumrutaş, R. Optimisation of simple and regenerative organic Rankine cycles using jacket water of an internal combustion engine fuelled with biogas produced from agricultural waste. Process Saf. Environ. Prot. 2021, 155, 17–31. [Google Scholar] [CrossRef]
  80. Demonstration of Caterpillar C-10 Dual-Fuel Engines in MCI 102DL3 Commuter Buses. Golden, Colorado. UNT Digital Library. Available online: https://digital.library.unt.edu/ark:/67531/metadc703347/ (accessed on 18 December 2022).
  81. Wärtsilä. World’s First Full Scale Ammonia Engine Test—An Important Step Towards Carbon Free Shipping. Wärtsilä. 30 June 2020. Available online: https://www.wartsila.com/media/news/30-06-2020-world-s-first-full-scale-ammonia-engine-test---an-important-step-towards-carbon-free-shipping-2737809 (accessed on 20 December 2022).
  82. Wärtsilä. Wärtsilä Advances Future Fuel Capabilities with First Ammonia Tests. Wärtsilä. 25 March 2020. Available online: https://www.wartsila.com/media/news/25-03-2020-wartsila-advances-future-fuel-capabilities-with-first-ammonia-tests-2670619?utm_source=pres (accessed on 20 December 2022).
  83. Reiter, A.; Kong, S.-C. Demonstration of compression-ignition engine combustion using ammonia in reducing greenhouse gas emissions. Energy Fuels 2008, 22, 2963–2971. [Google Scholar] [CrossRef]
  84. Solutions, M.E. Engineering the Future Two-Stroke Green-Ammonia Engine; MAN Energy Solutions: Copenhagen, Denmark, 2019. [Google Scholar]
  85. Win, G.D. WinGD Sets Development Timeframe for Methanol and Ammonia Engines; Winterthur Gas & Diesel: Busan, Korea, 2021. [Google Scholar]
  86. McKinlay, C.; Turnock, S.; Hudson, D. Route to zero emission shipping: Hydrogen, ammonia or methanol? Int. J. Hydrogen Energy 2021, 46, 28282–28297. [Google Scholar] [CrossRef]
  87. DNV. Use of Methanol Fuel: Methanol as Marin Fuel: Environmental Benefits, Technology Readiness, and Economic Feasibility; DNV: Berum, Norway, 2016. [Google Scholar]
  88. Maersk Secures Green e-Methanol for World’s First Carbon Neutral Container Ship. Seatrade Maritime News. August 2021. Available online: https://www.seatrade-maritime.com/containers/maersk-secures-green-e-methanol-worlds-first-carbon-neutral-container-ship (accessed on 20 December 2022).
  89. Solutions, M.E.; World-First Order for Methanol Engine within Container Segment. MAN Energy Solutions. 27 July 2021. Available online: https://www.man-es.com/company/press-releases/press-details/2021/07/27/world-first-order-for-methanol-engine-within-container-segment (accessed on 20 December 2022).
  90. Biernat, K.; Samson-Brek, I.; Chlopek, Z.; Owczuk, M.; Matuszewska, A. Assessment of the Environmental Impact of Using Methane Fuels to Supply Internal Combustion Engines. Energies 2021, 14, 3356. [Google Scholar] [CrossRef]
  91. Zhao, H.; Peng, Z.; Ladommatos, N. Understanding of controlled auto-ignition combustion in a four-stroke gasoline engine. Proc. Inst. Mech. Eng. Part D J. Automob. Eng. 2001, 215, 1297–1310. [Google Scholar] [CrossRef]
  92. Kumar, B.R.; Saravanan, S. Effect of exhaust gas recirculation (EGR) on performance and emissions of a constant speed DI diesel engine fueled with pentanol/diesel blends. Fuel 2015, 160, 217–226. [Google Scholar] [CrossRef]
  93. Chen, Z.L.J.; Wu, Z.; Lee, C. Effects of port fuel injection (PFI) of n-butanol and EGR on combustion and emissions of a direct injection diesel engine. Energy Convers. Manag. 2013, 76, 725–731. [Google Scholar] [CrossRef]
  94. Abdelaal, M.; Hegab, A. Combustion and emission characteristics of a natural gas-fueled diesel engine with EGR. Energy Convers. Manag. 2012, 64, 310–312. [Google Scholar] [CrossRef]
  95. Ray, N.; Mohanty, M.; Mohanty, R. Biogas as Alternate Fuel in Diesel Engines: A Literature Review. IOSR J. Mech. Civ. Eng. (IOSR-JMCE) 2013, 9, 23–28. [Google Scholar] [CrossRef]
  96. Tansel, B.; Surita, S. Managing siloxanes in biogas-to-energy facilities: Economic comparison of pre- vs post-combustion practices. Waste Manag. 2019, 96, 121–127. [Google Scholar] [CrossRef]
  97. Khan, M.U.; Lee, J.T.E.; Bashir, M.A.; Dissanayake, P.D.; Ok, Y.S.; Tong, Y.W.; Shariati, M.A.; Wu, S.; Ahring, B.K. Current status of biogas upgrading for direct biomethane use: A review. Renew. Sustain. Energy Rev. 2021, 149, 111343. [Google Scholar] [CrossRef]
  98. Mendiara, T.; Cabello, A.; Izquierdo, M.; Abad, A.; Mattisson, T.; Adánez, J. Effect of the Presence of Siloxanes in Biogas Chemical Looping Combustion. Energy Fuels 2021, 35, 14984–14994. [Google Scholar] [CrossRef]
  99. Sevimoglu, O.; Tansel, B. Composition and source identification of deposits forming in landfill gas (LFG) engines and effect of activated carbon treatment on deposit composition. J. Environ. Manag. 2013, 128, 300–305. [Google Scholar] [CrossRef] [PubMed]
  100. Sevimoglu, O.; Tansel, B. Effect of persistent trace compounds in landfill gas on engine performance during energy recovery: A case study. Waste Manag. 2013, 33, 74–80. [Google Scholar] [CrossRef] [PubMed]
  101. Piechota, G.; Bartlomiej, I.; Buczkowski, R. Development of measurement techniques for determination main and hazardous components in biogas utilised for energy purposes. Energ. Convers. Manag. Technol. 2013, 68, 216–226. [Google Scholar] [CrossRef]
  102. Pizzuti, L.; Martins, C.; Lacava, P. Laminar burning velocity and flammability limits in biogas: A literature review. Renew. Sustain. Energy Rev. 2016, 62, 856–865. [Google Scholar] [CrossRef]
  103. Noyola, A.; Morgan-Sagastume, J.M.; López-Hernández, J.E. Treatment of Biogas Produced in Anaerobic Reactors for Domestic Wastewater: Odor Control and Energy/Resource Recovery. Rev. Environ. Sci. Bio/Technol. 2006, 5, 93–114. [Google Scholar] [CrossRef]
  104. Al Seadi, T.; Rutz, D.; Prassl, H.; Köttner, M.; Finsterwalder, T.; Volk, S.; Janssen, R. Biogas Handbook; BiG>East Project; University of Southern Denmark Esbjerg: Esbjerg, Denmark, 2008. [Google Scholar]
  105. Sun, Q.; Li, H.; Yan, J.; Liu, L.; Yu, Z.; Yu, X. Selection of appropriate biogas upgrading technology—A review of biogas cleaning, upgrading and utilisation. Renew. Sustain. Energy Rev. 2015, 51, 521–532. [Google Scholar] [CrossRef]
  106. Ahmad, N.; Mel, M.; Sinaga, N. Design of Liquefaction Process of Biogas using Aspen HYSYS Simulation. J. Adv. Res. Biofuel Bioenergy 2018, 2, 10–15. [Google Scholar]
  107. Joshua, O.; Ejura, G.; Bako, I.; Gbaja, I.; Yusuf, Y. Fundamental Principles of Biogas Product. Int. J. Sci. Eng. Res. 2014, 2, 47–50. [Google Scholar]
  108. Kriauciunas, D.; Pukalskas, S.; Rimkus, A.; Barta, D. Analysis of the Influence of CO2 Concentration on a Spark Ignition Engine Fueled with Biogas. Appl. Sci. 2021, 11, 6379. [Google Scholar] [CrossRef]
  109. Rimkus, A.; Stravinskas, S.; Matijošius, J. Comparative Study on the Energetic and Ecologic Parameters of Dual Fuels (Diesel–NG and HVO–Biogas) and Conventional Diesel Fuel in a CI Engine. Appl. Sci. 2020, 10, 359. [Google Scholar] [CrossRef] [Green Version]
  110. Leonzio, G. Upgrading of biogas to bio-methane with chemical absorption process: Simulation and environmental impact. J. Clean. Prod. 2016, 131, 364–375. [Google Scholar] [CrossRef]
  111. Angelidaki, I.; Treu, L.; Tsapekos, P.; Luo, G.; Campanaro, S.; Wenzel, H.; Kougias, P.G. Biogas upgrading and utilization: Current status and perspectives. Biotechnol. Adv. 2018, 36, 452–466. [Google Scholar] [CrossRef] [Green Version]
  112. Chen, X.Y.; Vinh-Thang, H.; Ramirez, A.A.; Rodrigue, D. Membrane gas separation technologies for biogas. RSC Adv. 2015, 5, 24399. [Google Scholar] [CrossRef]
  113. Olumide, W.; Yaqin, Z.; Ange, N.; Doan, P.; Nathalie, L. A Review of Biogas Utilisation, Purification and Upgrading Technologies. Waste Biomass Valo. 2017, 6, 267–283. [Google Scholar]
  114. Basu, S.; Khan, A.L.; Cano-Odena, A.; Liu, C.; Vankelecom, I.F.J. Membrane-based technologies for biogas separations. Chem. Soc. Rev. 2010, 39, 750–768. [Google Scholar] [CrossRef]
  115. Bauer, F.; Hulteberg, C.; Persson, T.; Tamm, D. Biogas Upgrading—Review of Commercial Technologies. SGC Rapport, Malmö. 2013. Available online: http://vav.griffel.net/filer/C_SGC2013-270.pdf (accessed on 21 December 2022).
  116. TUV—Vienna University of Technology. Biogas to Biomethane Technology Review. Promotion of Bio-Methane and Its Market Development through Local and Regional Partnerships a Project under the Intelligent Energy—Europe Programme. Contract Number: IEE/10/130, Deliverable Reference: Task 3.1.1. Vienna. 2012. Available online: https://www.membran.at/downloads/2012_BioRegions_BiogasUpgradingTechnologyReview_ENGLISH.pdf (accessed on 16 December 2022).
  117. Zito, P.F.; Brunetti, A.; Barbieri, G. Renewable biomethane production from biogas upgrading via membrane separation: Experimental analysis and multistep configuration design. Renew. Energy 2022, 200, 777–787. [Google Scholar] [CrossRef]
  118. Scholz, M.; Melin, T.; Wessling, M. Transforming biogas into biomethane using membrane technology. Renew. Sustain. Energy Rev. 2013, 17, 199–212. [Google Scholar] [CrossRef]
  119. Molino, A.; Migliori, M.; Ding, Y.; Bikson, B.; Giordano, G.; Braccio, G. Biogas upgrading via membrane process: Modelling of pilot plant scale and the end uses for the grid injection. Fuel 2013, 107, 585–592. [Google Scholar] [CrossRef]
  120. Ozturk, B.; Demirciyeva, F. Comparison of biogas upgrading performances of different mixed matrix membranes. Chem. Eng. J. 2013, 222, 209–217. [Google Scholar] [CrossRef]
  121. Bernardo, P.; Drioli, E.; Golemme, G. Membrane Gas Separation: A Review/State of the Art. Ind. Eng. Chem. Res. 2009, 48, 4638–4663. [Google Scholar] [CrossRef]
  122. Ghaiba, K.; Ben-Fares, F.-Z. Power-to-Methane: A state-of-the-art review. Renew. Sustain. Energy Rev. 2018, 81, 433–446. [Google Scholar] [CrossRef]
  123. Cozma, P.; Ghinea, C.; Mamaliga, I.; Wukovits, W.; Friedl, A.; Gavrilescu, M. Environmental Impact Assessment of High Pressure Water Scrubbing Biogas Upgrading Technology. Clean Soil Air Water 2013, 41, 917–927. [Google Scholar] [CrossRef]
  124. Budzianowski, W.M.; Wylock, C.E.; Marciniak, P.A. Power requirements of biogas upgrading by water scrubbing and biomethane compression: Comparative analysis of various plant configurations. Energy Convers. Manag. 2017, 141, 2–19. [Google Scholar] [CrossRef] [Green Version]
  125. Kohlheb, N.; Wluka, M.; Bezama, A.; Thrän, D.; Aurich, A.; Müller, R.A. Environmental-Economic Assessment of the Pressure Swing Adsorption Biogas Upgrading Technology. BioEnergy Res. 2020, 14, 901–909. [Google Scholar] [CrossRef]
  126. CMMI. Green Marine; CMMI: Larnaca, Cyprus, 2023; Available online: https://www.cmmi.blue/green-marine/ (accessed on 1 February 2023).
Figure 1. Conversion routes to produce liquefied/compressed biomethane.
Energies 16 02066 g001
Figure 2. SWOT analysis of biogas.
Energies 16 02066 g002
Figure 3. SWOT analysis of biomethane.
Energies 16 02066 g003
Figure 4. Estimated biomethane potential by 2030 per country in the EU27, the United Kingdom, Switzerland, and Norway. Data processed from [41].
Energies 16 02066 g004
Figure 5. Estimated biomethane potential by 2050 per country in the EU27, the United Kingdom, Switzerland, and Norway. Data processed from [41].
Energies 16 02066 g005
Figure 6. WtW supply chain, based on ISWG-GHG 11/2/3 paragraph 3.5 [44], but edited to include possible carbon capture and storage technologies.
Energies 16 02066 g006
Figure 7. Cost constituents of biomethane from source to vessel and port.
Energies 16 02066 g007
Figure 8. Vessel type for in-service and newbuildings fuelled by LNG and LPG with more than 500 DWT. Data processed from IHS Markit [56].
Energies 16 02066 g008
Figure 9. Classification of newbuildings * vessels (more than 500 DWT) per “Fuel Type 1” from IHS Markit. Data obtained from IHS Markit [56]. * Includes the following subcategories: Keel Laid, Launched, On Order/Not Commenced, Projected, and Under Construction. Note: under category Nuclear, the vessel type is submarine.
Energies 16 02066 g009
Figure 10. MS biogas-to-biomethane upgrading pathway. In addition to MS technology, a scrubber and a drier have been added to remove moisture and H2S. The activated carbon filter has also been added to remove traces of H2S and volatile organic compounds (VOCs). A compressor is preliminarily added for compressed biomethane.
Energies 16 02066 g010
Figure 11. WS biogas-to-biomethane upgrading pathway. In addition to WS technology, a scrubber and an activated carbon filter have been added to remove H2S and traces of volatile organic compounds (VOCs). The water is recycled for optimal and stable operation. A compressor is preliminarily added for compressed biomethane.
Energies 16 02066 g011
Figure 12. CA biogas-to-biomethane upgrading pathway. In addition to CA technology, a scrubber and an activated carbon filter have been added to remove H2S and traces of volatile organic compounds (VOCs). The amine solvent is recycled into the absorber as it: a. utilises the heat from the heat exchanger, and b. CO2 is removed by the stripper. A compressor is preliminarily added for compressed biomethane.
Energies 16 02066 g012
Figure 13. PSA biogas-to-biomethane upgrading pathway. In addition to PSA technology, a dryer, a scrubber, and an activated carbon filter have been added to remove moisture, H2S, and traces of volatile organic compounds (VOCs). The PSA columns are in connected in series and form the PSA unit.
Energies 16 02066 g013
Table 1. General preliminary PESTEL analysis, with main factors, main key drivers, and implications on gaseous biofuels.
FactorKey DriversImplications on Gaseous Biofuels
PoliticalGovernments adding political pressure and incentives for the promotion and use of biofuels by the shipping industryFormation of general policies (such as from the IMO or the European Commission) that may be beneficial in the scale-up and development of biogas in one country, but may not be as beneficial in another country.
EconomicInvestment of the shipping industry in the use of gaseous biofuelsAlso highlighted within the technological factor, the shipping industry is investing (and actively participating) in RTDI technologies.
MBMsEconomic incentives based on MBMs (such as the ETS, i.e., reduction of carbon penalties/tax) will help the uptake of gaseous biofuels by the shipping industry. These activities are also driven and related to the minimisation of EEDI, EEXI, and CII.
Socio-culturalESGGaseous biofuels will enable organisations to minimise their impact on climate change and global warming, and thus demand on gaseous biofuels will increase. Improve image of shipping industry in terms of social criteria to achieve sustainability.
TechnologicalBiogas combustionBiogas combustion can be used for land-based applications. Therefore, in terms of shipping, biogas could be used for shore-side electricity.
Upgrading of biogas to biomethaneUpgrading needed to remove impurities, which when combusted are toxic to the environment and human health, and also reduce the lifetime of components in an ICE engine (see Section 7).
Participation of stakeholders of the shipping industry in RTDI activitiesLarge activity in RTDI projects involving gaseous biofuels and their supply chain issues and upgrading of biogas to biomethane (such as BioCH4-to-Market [27], BioCNG-to-Cold Ironing [28], Accelerating deployment of low-LCI Biomethane in shipping [29], Salamander project [30], and FirstBio2Shipping [31]). The shipping industry also actively participates in these activities, for example, by providing critical access to infrastructure for testing, benchmarking, and validation.
EnvironmentalInclusion of additional areas under ECA/SECA/NECAStricter regulations on existing ECA/SECA/NECA areas, such as the Baltic Sea. For example, according to Marine Environment Protection Committee, MEPC 79, as of 2025 the Mediterranean Sea has now been included as a SECA and Particulate Matter control area [32]. In this respect, biomethane can contribute to the reduction of GHG and harmful pollutants (combusting biomethane has no SOx emissions and very low PM emissions). However, after-treatment in Nox emissions will be needed. In addition, further inclusion of additional areas will further expose the shipping industry to more stringent conditions.
ESGOrganisations will need to illustrate their environmental criteria, which creates opportunities for inclusion of biogas/biomethane into the net zero carbon transition plan.
LegalLack/incomplete missing framework from IMO regarding gaseous biofuelsUtilisation of existing LNG/CNG framework for biomethane.
At European level, the Green Deal and the recent Fit for 55 legislation packageThe directives listed in Section 1 will impose carbon penalties to the shipping industry. Utilisation of gaseous biofuels will minimise the impact.
Inclusion of additional areas under ECA/SECA/NECASee above discussion.
ESGAt the moment ESG reporting is voluntary, but in the near future they may become obligatory. Hence, organisations may be forced to use biogas/biomethane.
Table 2. Current regional variation of biogas upgrading to biomethane, including cost of production in 2018 prices, compared to the corresponding cost of natural gas. Data processed from [38], pp. 21, 38.
RegionPercentage Upgraded (%)~USD/MBtu (2018)
Biomethane
~USD/MBtu (2018)
Natural Gas
North America1514.54.0
South America3512.55.2
Europe1016.07.5
Asia217.510.0
Table 3. Classification of vessels more than 500 DWT and 5000 DWT. LNG and LPG categories classified under “Fuel Type 1” from IHS Markit database. Table illustrates potential market for LBM, assuming no changes needed in infrastructure. Data obtained from IHS Markit [56]. * Includes the following subcategories: Keel Laid, Launched, On Order/Not Commenced, Projected, and Under Construction.
StatusLNGPercentage LNG to World Fleet (%)LPGPercentage LPG to World Fleet (%)Total World Fleet
In-service (500 DWT)7911.14520.07569,130
In-service (5000 DWT)6560.95490.07069,130
Newbuildings * (500 DWT)74618.50872.164033
Newbuildings * (5000 DWT)69617.26872.164033
Table 4. Typical ranges and differences in the composition of raw biogas, biomethane, and natural gas as reference. Data processed from Refs. [90,106,107,108].
Gas ComponentRaw BiogasUpgraded BiomethaneNatural Gas
Methane, CH4 (%)45.0–70.094.0–99.993.0–98.0
Carbon Dioxide, CO2 (%)25.0–45.00.1–4.01.0
Nitrogen, N2 (%)<3.0<3.01.0
Oxygen, O2 (%)<2.0<1.0
Hydrogen, H2 (%)<1.0Traces
Hydrogen Sulfide, H2S (ppm)20.0–20,000.0<10.0
Ammonia, NH3 (%)TracesTraces
Ethane, C2H6 (%)<3.0
Propane, C3H8 (%)<2.0
Siloxanes (%)Traces
Water, H2O (%)2.0–7.0
Table 5. Biogas to biomethane upgrading technologies: 1. membrane separation (MS), 2. water scrubbing (WS) 3. chemical absorption (CA), and 4. pressure swing adsorption (PSA). Information processed from Refs. [9,11,45,59,97,110,111,112,114,115,116,117,118,119,120,121,122,123,124,125].
TechnologyProcessIssuesMaturity/Technological Benefits
1. Membrane separation (MS)Utilisation of membranes that have a strong selectivity in separation, i.e., permeable to CO2, H2O, and NH3 with less permeability to O2 and H2S (these are referred to as the “permeate” flow; pass through the micro-pores and are removed), and little permeability to CH4 and N2 (these are referred to as the “retantate” flow pass through the membrane without being removed). There are three main categories for membranes based on materials: 1. Polymeric, 2. inorganic, and 3. mixed matrix.Efficiency of membrane depends on moisture levels.Available to market. Ardolino et al. [9] mentioned that on a LCA and LCC, the MS method has the optimal performance compared to the other available methods. Characterised by energy efficiency, simple construction, and easy scale-up. Modular and versatile nature of membrane.
2. Water scrubbing (WS)Separation is based on the different solubility of CO2 and CH4 in water. Thus, WS is favoured at low temperatures and high pressures as CO2 dissolves faster into water in the adsorption column. Some CH4 may exist after the adsorption process, and so the mixture is sent to a flash column, where an appropriate pressure drop is applied to release the remaining CH4. The CO2 is then released in the desorption column. The water is then recycled for more stable operation and less operational problems.Methane slip of the order of 1–2%. Difficult to produce “highly purified gas” under standard conditions without the need of external pressure. When operating at low pressures (near atmospheric conditions), installations are limited to small sizes due to the large liquid-to-biogas flow ratios.Available to market due to simplicity and performance reliability, but with high electricity costs. Therefore, the process operates at “near atmospheric conditions” to reduce electricity demand.
3. Chemical absorption (CA)Similar operating principle to WS but CA uses organic amine solvents rather than water. Note that amine solvents, found in the absorber, are more selective in absorbing CO2 compared to water. The amine solvent is also recycled into the absorber as it: (i) utilises the heat from the heat exchanger as the absorber process requires thermal energy, and (ii) CO2 is removed by the stripper. Still developing to improve CO2 solubility.Available to market. Smaller units compared to WS as they can absorb more CO2 per unit volume. CA can operate at atmospheric pressure, and thus with less energy consumption. CO2 and H2S are removed simultaneously.
4. Pressure swing adsorption (PSA)The PSA method separates gases via their physical properties. The raw biogas is compressed at an elevated pressure and fed into the pressure swing adsorption column, which retains CO2, but not CH4. When CO2 is saturated, it is removed via desorption in the purge gas and removed as waste gas. The PSA unit is composed of PSA columns connected in series to ensure continuous operations.PSA technology has the lowest efficiency recovery. Methane slip varies from 1.8% to 2.0%. In addition, further gas treatment is needed to avoid the release of emissions to the environment. High energy cost; 77% of operational cost is spent on electricity.Available to market. Could be the technology of the future, but currently cost is prohibitive due to additional gas treatment and innovative use of materials and hybrid systems (such as Zeolite 5A to purify the gas at first stage).
Disclaimer/Publisher’s Note: The statements, opinions and data contained in all publications are solely those of the individual author(s) and contributor(s) and not of MDPI and/or the editor(s). MDPI and/or the editor(s) disclaim responsibility for any injury to people or property resulting from any ideas, methods, instructions or products referred to in the content.

