1. Introduction
Non-Technical Losses (NTL) can be defined as the energy consumption of clients that have not been billed by the energy company [
1]. At the grid level, NTL are responsible for overloading transformers, causing a voltage unbalance, and providing uncertainty regarding real consumption. Also, NTL can affect honest consumers, who suffer from high energy prices and poor energy quality. A rise in the NTL rate will increase energy prices and reduce system reliability.
Therefore, electric companies are increasingly investing to reduce NTL due to their impact, both technical and economical. The most common way to detect NTL is through on-field inspections, combined with analyzing customer consumption data [
1,
2]. The goal is to identify customers with anomalous consumption data, indicating theft or fraud in electricity meters. In the past, these inspections were defined by expert knowledge that would analyze consumption data history from consumers and point out which should be inspected.
With the development of smart meters and other smart grid technologies, energy companies now have a greater level of observability in their systems [
3]. This observability provides a more detailed understanding of customers’ energy consumption due to more data availability. With this, expert knowledge is not sufficient to analyze all data and ascertain a desirable level of NTL detection. Therefore, energy companies invest even more in a trending topic: artificial intelligence (AI). AI allows for analyzing consumer profiles, data, and irregular behavior. This makes it possible to direct inspections to consumers who demonstrate abnormal electricity consumption patterns.
NTL detection methods can be sorted into hardware-based approaches and non-hardware-based approaches. Hardware-based approaches require the installation of equipment or new infrastructure in order to be able to detect NTL. The proposed methods focus on the development of apparatus to identify energy theft and/or fraud [
1,
2]. There can be different types of energy fraud that can be detected by hardware-based NTL detection methods. Neutral and mainline bypass is one of these frauds that are tackled by authors [
4].
This paper presents a comprehensive review of non-hardware-based NTL detection methods. The aim is to develop a helpful document to fulfill needs that might arise when researching NTL detection methods and to guide students and researchers who are looking for a specific detection method. Several review papers address the issue of NTL detection methods, providing important insights. This paper deepens the analysis of one of the strategies, which does not need hardware and relies only on data.
This work is divided into seven sections: First,
Section 1 is the introduction.
Section 2 will explain how the research survey was conducted, the selection and exclusion criteria, and the number of research papers considered in this review.
Section 3 presents the analysis of non-hardware-based NTL detection methods, which is divided into data-oriented methods, network-oriented methods and hybrid methods. In
Section 4, the future trends for non-hardware-based NTL detection methods are surveyed, in order to point toward the direction in which further researchers can address their efforts.
Section 5 presents case studies with real applications of some methods, showing their effectiveness. In
Section 6, the discussion is presented, as well as some recommendations for future research. Finally,
Section 7 presents the conclusions of the review.
2. Review Strategy and Implementation
In this section, the adopted review strategy will be presented. The search and screening process will be detailed, as well as the criteria for including and excluding articles from the review.
2.1. Review Search Terms
The keywords used in the search for relevant papers were Non-Technical Losses detection methods, Non-Technical Losses, energy fraud, and electricity theft. Since “Non-Technical Losses detection methods” is a very specific set of keywords, it did not return any results. The other search terms returned a fair amount of research papers, which were organized and evaluated.
2.2. Inclusion Criteria
Several inclusion criteria were considered, but in order to narrow down and direct the review, the following inclusion criteria were applied:
The study must apply a non-hardware-based NTL detection method;
The research must include an overview of the main causes of NTL;
The research must present a detailed novel NTL detection method, without the need for modification of system infrastructure.
2.3. Exclusion Criteria
In order to filter and select suitable research papers for the review, these were the criteria considered in order to disregard the papers:
2.4. Prisma
The database was assembled searching in IEEEXplore, Science Direct, and Google Scholar. Afterwards, several duplicated results from different databases were identified, reducing the number of related research papers in the analysis. Initially, each database provided a total number of results, as shown in
Table 1.
Table 2 shows the selected papers according to the journals.
Table 3 is arranged according to the conferences where they were published.
After a careful screening process, 57 articles met the inclusion criteria and are evaluated in this paper. Note that non-hardware-based NTL detection methods are a restricted niche, where there are many possibilities to explore in this field.
3. Non-Hardware-Based Non-Technical Losses Detection Methods
The main goal of this review is to survey non-hardware-based NTL detection methods. Non-hardware-based NTL detection methods do not require the installation of new infrastructure, significantly reducing the need for investment from energy companies. Therefore, the literature on this topic is abundant, since non-hardware-based solutions are becoming more effective in detecting NTL, especially with the advance of ML methods.
Non-hardware-based NTL detection methods can be divided into data-oriented, network-oriented, or hybrid approaches. As seen in
Figure 1, data-oriented methods can be divided into supervised and unsupervised ML approaches. Network-oriented methods are separated into state estimation approaches, load flow approaches, and sensor network approaches. Hybrid approaches combine data-oriented and network-oriented methods, often providing better efficiency and assertiveness. The following subsections will explain each of these approaches in detail.
3.1. Data-Oriented Methods
Data-oriented methods in the literature can also be divided into expert systems and machine learning (ML) approaches. Expert systems are composed of handcrafted rules in the decision-making process. ML methods are able to learn from examples without explicit programming. ML has become the predominant direction in which data NTL detection methods are converging.
Data science can be used to analyze data, and ML models can be employed to identify NTL. Self-learning algorithms are commonly used as they are easy to tune and can be adapted to process different types of data. Unlike network-oriented methods, data-oriented methods do not use the topology of the grid to estimate NTL suspects. These approaches use supervised and unsupervised machine learning methods.
3.1.1. Supervised Machine Learning Methods
These methods combine data from both consumers’ profiles: honest and fraudster [
39]. This data is used to train classifiers [
5], and allowing the model able to learn different patterns of energy consumption in a given consumer database.
The supervised machine learning methods can be divided as shown in
Figure 2:
Support vector machine (SVM);
Artificial neural network (ANN);
Optimum path forest (OPF);
Decision tree;
Bayesian classifiers;
Rule induction methods;
Kth-nearest neighbor.
Support Vector Machines (SVM)
The SVM is an efficient machine learning method suitable for application in NTL detection due to its immunity to class imbalance. In [
39], the authors developed a SVM-based model to assist Tenaga Nasional Berhad (TNB), in Malaysia in reducing NTL due to electricity theft. This model preselects customers to be inspected based on abnormal consumption behavior. The authors use historical consumption data and customer load profile information to identify possible fraudsters. A hit rate of 50% was achieved. In further work [
5], the authors were able to tweak the SVM to achieve a hit rate of 60%. This level of assertiveness was achieved due to the theoretical model developed by the authors.
This SVM methodology is labeled One-Class SVM (OC-SVM), which is normally trained using data that belong to a single class. A different SVM approach is the Cost-Sensitive SVM (CS-SVM), which allows different weights to be assigned to different classes, improving the method’s performance.
Other classes of SVM include Linear Kernel SVM (LK-SVM) and Radial Basis Function (Gaussian, Laplace, ANOVA) Kernel SVM (RBFK-SVM). LK-SVM only needs the cost parameter to be tuned, while RBFK-SVM needs the cost and gamma parameters to be tuned.
To improve SVM effectiveness, it can be combined with other classifiers. One example is the application of a fuzzy inference system (FIS) to include human knowledge and expertise to the SVM [
5]. Another classifier that can be applied to improve SVM is the decision tree (DT), which allows the combination of categorical and non-categorical variables. In [
6], a combination of SVM and ANN is used, since ANN is an efficient tool for pattern classification. Methods that do not combine SVM with other classifiers are slow to process and have difficulty tuning parameters [
6].
In [
39], SVM training is performed to obtain a quadratic programming problem. The solution for this problem is global and unique. For empirical data
that are mapped by
into a feature space, the linear hyperplanes that divide them into two labeled classes is mathematically represented by:
In order to construct an optimal hyperplane with maximum margin and bounded error in the training data, the following quadratic problem needs to be solved:
The first term of Equation (2) makes the maximum margin of separation between classes, and the second term provides an upper boundary for the error in training data. The constant C allows a tradeoff between the number of misclassified samples in the training set and the separation of the remaining samples with the maximum margin. One way to solve Equation (2) is to use the Lagrange function.
Considering a kernel
, the Lagrange function of Equation (2) is simplified to:
According to Equation (1), it is possible that a hyperplane in the feature space can be written as the linear combination of training samples, with
. These are called
support vectors, and can build the decision function of the classifier based on the kernel function:
In SVM, kernel functions are selected based on the data structure and boundary type between classes.
This method was improved by the authors in [
5], where a fuzzy inference system was added to the SVM, aiming to include human expertise to the method.
Artificial Neural Networks (ANN)
ANN are a subset of ML, and they consist of three layers: input, hidden, and output, making them very useful for pattern classification. The most commonly used version of ANN is the multilayer perceptron, often with backpropagation in the training step [
2,
9,
24,
40,
41].
Neural networks can be used for forecasting [
9,
40] or binary classification [
24]. Commonly, the first can be used for energy consumption forecasting, while the latter is used to detect discrepancies between the measured energy consumption and the predicted consumption in order to detect NTL. A cross-validation process is used to ensure a good generalization of the ANN, resulting in good assertiveness [
40]. In [
40] the authors used SVM to test possible irregularities in energy consumption data. Furthermore, a backpropagation algorithm was used for training the required dataset, using the generalized delta rule, shown in Equation (6).
where
β is the momentum term,
is the weight correction in the
ith iteration, α is the learning rate parameter,
is the output of the
jth neuron, and
is the error gradient of the
kth neuron added.
In [
9] the authors combined two strategies to improve ANN performance. This work, uses long–short time memory (LSTM) allied with a multi-layer perceptron (MLP) network. The first analyzes the raw energy consumption history, the second integrates non-sequential data, such as contracted power or geographical information. Considering that the energy consumption is stored by the smart meters, and the stored period can be years, a simple neural network would be very hard to train due to the vanishing and exploding gradient problems. In this case, LSTM is applied. LSTM cell uses the sigmoid and hyperbolic tangent as non-linear activations, presenting the following mathematical formulation:
where
represent the activations of the input gate, forget gate, output gate, cell state, and hidden state at time step
t.
represent the weights of the input layer.
represent the recurrent weights of the LSTM
are the biases of the network, while
is the input feature vector at time step
t.
represents the hidden state activation at the previous time step.
The MLP module has
N hidden layers, where
N is chosen using the validation dataset. Each hidden layer goes through an affine transformation:
where
represents the weights of layer
n,
represents the hidden state of the previous layer, and
represent the bias of the
layer.
To evaluate the performance of the model, a logarithmic loss function is used, considering that it is a binary classification task:
where
M is the number of customer samples,
is the ground-truth label, and
is the probability of NTL computed by the hybrid neural network model for the customer sample
i.
An evolution can be seen in [
24], where a wide and deep convolutional neural network (CNN) is applied. This model consists of two components: The deep component, which can accurately identify the non-periodicity of electricity theft and the periodicity of normal electricity use based on two dimensional electricity consumption data. The wide component is able to capture the global features of one-dimensional consumption data. In this work, the authors use the interpolation method to recover missing values according to Equation (14).
where
is the value in energy consumption data over a period of time. If
is a null or non-numeric value, it is represented as
NaN (
NaN is a set).
After dealing with missing values and outliers, the energy consumption database is normalized because the neural network is sensitive to diverse data. The method chosen for this was the max-min scaling method.
where
min(x) is the minimum value in
x and
max(x) is the maximum value in
x.
Every neuron in the fully-connected layers calculates its own score using the one dimensional energy consumption data according to Equation (16).
where
is the output of the full-connected layer in the
j-th neuron,
n is the length of the one dimensional input data (
x),
is the neuron weight between
i-th input value and
j-th neuron, and
is the bias. After this calculation, it will send this value to the connected units in the higher layer through an activation function to determine how much it contributes to the next step prediction. The activation function is shown in Equation (17).
where
is the output after activation calculation.
After this, the Deep CNN is used to process the energy consumption data in a two dimensional manner. The authors transform the one-dimensional-energy consumption data into two-dimensional data according to weeks. Finally, the prediction model is able to improve traditional ANN performance.
Optimum Path Forest (OPF)
In order to address the challenges of using AI methods to detect NTL, which require a high level of computational effort during the training phase [
41], researchers have been exploring the use of Optimum Path Forest (OPF) pattern recognition technique [
10].
This classifier interprets the classification task as a combination of optimal path computations based on prototypes for the remaining nodes. Each prototype serves as the root for its optimum path tree, and each node is classified based on the strength of its connection to the prototype, resulting in a discrete optimal partition of the feature space. Considering that
are training, evaluation, and test sets, with
being samples of a dataset. The division of the dataset is necessary to validate the classifier and evaluate its learning capacity from the errors.
is used for classifier project.
is used to teach the classifier by randomly interchanging samples of
with misclassified samples of
.
is used to measure
accuracy. After learning, an improvement in the accuracy of
is expected. The OPF algorithm can be used with the smooth path–cost function which can group samples with similar properties. Since the authors in [
10] were interested in the region between classes, which are generally overlapped regions, the authors address the path–cost function of Equation (18).
where
computes the maximum distance between adjacent samples in π, when π is not a trivial path.
The OPF algorithm assigns one optimum path from S to every sample , forming an optimum path forest P which is a function with no cycles that assigns to each is predecessor P(s) in .
The classification is performed evaluating an optimal cost function:
OPF classifiers are parameter-free, do not assume any specific shape or separability of feature space, and are able to quickly execute the training phase. Given its faster performance, the OPF classifier is well-suited for online training and NTL detection [
7,
10,
17,
22,
25].
Decision Trees
The DT algorithm uses a flowchart model to assemble a set of rules to aid in the classification of new samples. The DT handles non-linearity better than linear models, being used to perform classification and regression problems. They are generated by algorithms that split a dataset into several branches based on decision rules. These rules are determined by identifying the relationship between input and output attributes.
M5P DT algorithm was used in [
42], which is a reconstruction from the M5 algorithm from [
43]. This M5P algorithm combines DT and linear regression at the leaves, so the regression algorithm is employed to predict future values based on previously learned data. This algorithm is applied to learn individual behavior per consumer to create an energy consumption, then this learned consumption shape is used to predict future measurements.
Tree-based models are constructed by the divide-and-conquer method [
26]. Considering a collection of training cases,
T, this set is either associated with a leaf, or some test is chosen that splits
T into subsets corresponding to the test outcomes, and the same process is applied to the subsets. This division often produces overly elaborate structures that must be pruned back, by replacing a subtree with a leaf, for example [
34].
The first step to build a model tree is to compute the standard deviation of the target values of cases in set T. Unless T contains very few cases or their values vary only slightly, T is split on the outcomes of a test. Every potential test is evaluated by determining the subset of cases associated with each outcome.
Let
denote the subset of cases that have the
ith outcome of the potential test. If the standard deviation
of the target values of cases in
as a measure of error, the expected reduction in error as a result of this test is:
After examining all possible tests, M5 chose one that maximizes this expected error reduction.
Two other DT algorithms commonly used are ID3 and C4.5 [
27]. These two algorithms employ a variety of pruning techniques and information gain as heuristics. The original ID3 algorithm uses a criteria called gain or attribute selection to select the attribute to be tested. This procedure is based on the information theory concept of entropy. Consider
S to be a set consisting of
s data samples. Suppose the class label attribute has
m distinct values defining
m distinct classes
, for
. The expected information needed to classify a particular sample is given by:
In Equation (21), is the probability that an arbitrary sample belongs to class and is estimated by . The log function is used since the information is encoded in bits.
Considering attribute
A can be used to partition
S into
v subsets, where
contains those samples within
S that have a value of
The entropy, or expected information based on the partitioning into subsets by
A, is given by Equation (22).
The encoding information that would be gained by branching on
A is:
These analyses have been shown to result in high levels of accuracy and efficiency in many real-world problem situations and serve as a standard for evaluating the performance of new algorithms.
Different DT algorithms have been used, such as CART, C5.0, EBT, QUEST [
26,
34], among others, which present an easy interpretation, making operatives’ work easier.
Bayesian Classifiers
These classifiers require previous information of NTL probability that can be obtained from the general statistics. These classifiers consider that, if the class of the sample is known, it can be used to estimate the values of different features. This is done using the non-intrusive load monitoring (NILM) procedure [
27,
28] to learn the pattern of every device being used by the consumer. There methods need a huge amount of previous information, which can affect the classifier’s output.
Bayesian networks in Bayesian classifiers use a set of variables that graphically shows the class probability [
44]. The main advantage of Bayesian networks is that they can be easily understood by humans, providing a user-friendly interface. Given a labeled database and the Bayesian network, the objective is to learn the conditional probabilities. The class of a new sample can be inferred along with the probability of the sample belonging to the predicted class. This allows for setting the number of meters to be inspected, as the probability threshold can be set according to the detection system. These classifiers were successfully applied in [
13], where metrics such as loss factor and error term were introduced to estimate NTL and register measurement noises, that can be applied also on outlier detection.
In [
54], the authors propose a Bayesian risk framework aiming to detect NTL to maximize the effective economic return. In order to maximize the economic return, let
m denote the number of inspections to be performed and
an arbitrary subset of
m samples of
X.
is the probability that a given sample
is committing fraud,
represents the amount of money the
ith customer could potentially be stealing, and
the cost of inspecting the
ith customer. Given the previous definitions, the approach consists in obtaining the optimal subset
, such that:
A cost sensitive classification loss can be expressed as:
where
represents the cost associated to predict as
q a member of the class
k.
3.1.2. Unsupervised Machine Learning Methods
Unsupervised NTL detection methods do not require labeled data in order to train the classifiers [
13]. These methods can operate without supervision and have the ability to uncover hidden information from a given dataset. The most advanced unsupervised ML methods are depicted in
Figure 3, and are discussed in the following sections. The methods surveyed are:
Outlier Detection Methods
Outlier detection methods involve the analysis of inconsistent and unusual values in a database that typically follows a behavioral pattern.
In [
13], the authors employed linear programming in an anomaly detection framework to detect NTL, which has the capability to identify fraud and locate meter defects. It filters areas with high probability of theft based on discrepancies between meter readings at the distribution transformer and estimates stolen energy at a smart meter as an anomaly coefficient.
Authors in [
20] addressed the issues of lack of context and time awareness, as well as the false positive rate that is affected by the change in consumer habits. They developed an outlier detection method that can handle concept drift, such as changes in family structure, or a house becoming second residence. To achieve this, they used a long short time memory (LSTM) network to profile and predict consumer behavior based on their recent past consumption. This method was able to detect outliers almost in real time.
Other authors [
8] develop frameworks that monitor energy consumption data, rate of chance of the energy consumption data, its date stamp, and time signatures. The framework is based on universal anomaly detection (UAD) and uses the Lempel-Ziv universal compression algorithm to achieve real time detection.
Expert Systems
Expert systems utilize professional expertise to detect NTL in distribution systems. These expert systems can also be used in supervised ML methods, as professional experience can be applied to various methods. One method [
6] combined a fuzzy expert system for post-processing the output of a SVM and achieved a hit rate of 72%. Another method [
8] analyzed the energy consumption of the past six months, along with maximum consumption, average consumption, standard deviation, and number of inspections. These values were used on a fuzzy c-means clustering algorithm to group customers into classes. Then, customers were classified as fraudsters or not fraudsters using the Euclidean distance measure, resulting in a hit rate of 74.5%. This method’s classifier is evaluated by both assertiveness and sensitivity in Equations (26) and (27).
where
TP are true positives,
FP are false positives, and
P are the existing positives on the database.
C-means is a popular algorithm for clustering data, where a record in any data base belongs to only one cluster. A record belongs to more than one cluster with a certain degree (membership degree) in the fuzzy C-means. Considering three matrices
which are the data matrix, center matrix, and fuzzy membership degree matrix, respectively. The fuzzy C-means tries to minimize:
where
n is the number of elements,
f is the number of attributes for each element,
c is the number of clusters,
m is the fuzzification factor,
is the membership degree of the
ith element into de
j cluster, and
is the distance between the
ith element and the center of the
j cluster. The minimization is performed in a two-step process. First, the center of clusters is constant, and the algorithm tries to find the optimal value of the membership degrees. Afterwards, the center of the cluster is minimized, keeping the membership degree constant. The optimal values are calculated using the following differential equations:
Regression Models
Regression models are used to estimate time series models. When trained with energy consumption data, regression model methods rely on the difference between the expected and calculated energy consumption. If this difference is high, it is considered an indicator of potential fraud. Authors in [
14] and [
45] proposed two linear regression-based algorithms to detect dishonest customers and locate defective equipment. The first algorithm exhibited some instability, which was resolved by incorporating categorical variables into the linear regression. Methods such as auto-regressive moving average (ARMA) [
45] and auto-regressive integrated moving average (ARIMA) [
14] were used to forecast NTL. These methods compare measured and estimated values, with the forecasting model trained with honest energy consumers. The larger the difference between the measured and forecasted values, the higher the probability of electricity theft. In [
30], the authors used a previously designed scheme entitled Linear Regression-Based Scheme for Detection of Energy Theft and Defective Smart Meters (LR-ETDM). Considering a service area that consists in
N consumers. Smart meters’ readings are recorded at time stamp
. The parameters in the proposed model are:
is the near real-time energy consumption recorded by consumer
n at time interval
;
the anomaly coefficient for each consumer
n;
is the discrepancy in meter reading at time interval
.
The sum of energy consumption reported by all consumers must agree with the total load consumption measure by the collector at time interval
. If there is any under/over reporting by smart meters, Equation (31) can be formulated as follows:
The objective is to find all from Equation (31) to evaluate the reliability of smart meter endowed in each household or abnormal behavior of each consumer.
LR-ETDM may not detect all fraudsters when consumers only steal energy during a particular period in a day. So, the authors proposed the Categorical Variable-Enhanced Linear-Regression-Based Scheme for Detection of Energy Theft and Defective Smart Meters (CVLR-ETDM). This algorithm introduces categorical variables in linear regression using dummy coding to resolve the varying energy stealing problem. Considering a service area consisting of
N consumers and each of them commits energy theft independently. The parameters are defined as:
: Detection coefficient of consumer
n during on-peak hours;
: categorical variable of consumer
n, where:
The period of energy theft or metering defect can be identified solving Equation (33) for
and
.
In Equation (33), represents the anomaly coefficient of consumer n during off-peak period, whereas denotes the anomaly coefficient of consumer during on-peak hours. Investigating the estimated and , it is possible to notice whether abnormal behavior occurs only during a particular period in a day or it is constant.
Statistical Methods
Control charts are utilized for time-series data, monitoring individual consumption and identifying regions where the time-series may be considered anomalous.
A moving range control chart detects variations in a time-series that may be caused by electricity theft by defining control limits [
30]. This control chart monitors actual consumption and the moving range. Then, rules are established to indicate which violations are frauds and need inspection.
In [
30], Bollinger Bands are proposed. It is a statistical data analysis tool, commonly used in stock market analysis. In this tool, the upper and lower bands are calculated based on the N-period standard deviation, and an N-period moving average of the time series is monitored. If energy consumption at a specific time exceeds the limit for that time slot, it is suspected as a fraud. However, since their main goal is to detect change, if a fraud is happening before the monitoring period, it is possible that a fraudster receives a false negative status for NTL.
Another approach can be analyzed in [
55], as the authors use Markov Chains to estimate the subareas vulnerable to NTL in the future. The outputs are the probabilities of occurrence of each one of the discrete states as discrete-time functions. It is an empirical method that focuses on the relationship between its variables, assuming the relationships of the past will remain in the near future, as in Equation (34).
where
is the system state at time
t,
is the system state after interval (
t+1), and
P is the transition matrix between states. The transition matrix represents the probability of a state
i to remain the same or change to a state
j during the time interval
t. The conditional probabilities
, termed transition probabilities, represent the state probability
to be
at time
if the state
is
at time
. The transition probabilities are obtained from samples at a time interval.
The probability is usually defined as Equation (35). The probability
of an event
E is the relative frequency at which this event occurs in a series of attempts under constant conditions.
where
is the number of times that event
E occurs in
n trials. The occurrence of an event
E in a particular observation is entirely uncertain. However, the relative frequency with which it occurs in repeated observations has stable properties.
represents the number of consumer units (CU) with NTLs found in a total of
n CUs inspected by teams in a city subarea. For a fixed time interval, the loss probability is obtained from Equation (36) after adjusting Equation (35). Given that
is the annual estimated loss probability related to the subarea
A in the year
y.
Having determined the current loss state of each city subarea, the transition matrices are used to estimate the future loss state.
3.2. Network-Oriented Methods
Network-oriented methods operate with data from distribution system sensors, which are located on transformers and smart meters. These methods utilize the grid’s topology, transformer loading, voltage profiles, current flow, and other information. The load flow approach is widely used by researchers to identify NTL by monitoring the energy balance with an observer meter. Additionally, the state estimation approach has proven to be more accurate, but it may not always be applicable. Lastly, the sensor approach employs dedicated sensors and examines the use and optimal placement of sensors to ensure NTL detection.
3.2.1. Load Flow Approach
The load flow method for detecting NTL in electric power systems uses the energy balance of the electric grid. It involves installing a meter to monitor the low voltage side of the transformer meter and using an ecosystem of smart meters to compare their sum with the transformer meter. The difference between the sum of smart meters’ readings and the transformer meter, plus a percentage of technical losses, is calculated. The larger this difference, the higher the probability of NTL [
28,
37]. For cases where technical losses or grid topology are unknown, [
27,
38] propose a method to identify the grid parameters and then calculate technical losses, which leads to better assertiveness detecting NTL.
Another approach is the probabilistic power flow method [
38], which uses one or more observer meters to detect NTL in specific meters. The energy balance is used in a probabilistic approach and the probability distributions for total and technical losses are calculated, and then subtracted by convolution to provide the probability of NTL in a specific grid.
Another approach proposed by authors in [
6] is a smart substation method, which checks the energy balance between smart meters and observer meters, and if a significant difference is detected, the NTL detection method tries to locate the fraud at consumer level. The NTL detection method uses the measured currents from smart meters to calculate voltages that are comparable to measured voltages.
The method proposed in [
55] models loads as QV buses, where reactive power and voltage magnitude values are specified. The buses with a difference between the measured and calculated active powers indicates possible NTL locations. The basic idea is to solve a load flow problem by modeling the load buses as QV buses. The application of the load flow method results in calculated values of active power (
) for each QV bus. Then,
values are compared with the respective active power measurement (
) obtained from smart meters. The customers with active power deviations higher than threshold values are identified as NTL candidates. So, the minimum detectable power (MDP) is calculated using the submatrices from the Jacobian matrix:
The deviation in the active power caused by the maximum voltage measurement errors
, which corresponds to the MDP index, can be estimated from applying Kron reduction:
Equation (38) estimates the impact of voltage measurement errors in the calculated active power.
The Energy deviation index can be obtained by:
where
is the difference between calculated and measured active power at bus
I for a time interval
j,
. λ is the period over which the measurement set is available. This index is important for the identification of NTL caused by illegal loads that are not permanently connected to the system.
3.2.2. State Estimation Approach
These approaches use smart meters to observe the grid. Usually applied in medium voltage (MV), state estimation has been shown to be effective in detecting NTL. One method, proposed by [
32], uses the Kalman filter state estimator to calculate line currents and biases, and consumers with biases greater than a threshold are assumed to be committing fraud. This method guarantees privacy as operators do not need to access power and voltage measurements of consumers. However, it is limited in its application to microgrids with small feeder lengths.
Another method, proposed in [
46,
47], uses a weighted-least square (WLS) state estimator. These estimators work with transformer loadings from three-phase voltages, current, active, and reactive power measurements. If the difference between measured and estimated values is significant, NTL can be assumed. In [
47], for a specific period of time, it is possible to affirm that the energy registered by the central observer meter and the energy registered by each of the
N meters along the feeder should satisfy Equation (40).
where
is the energy registered by the central observer meter;
is a constant relative to the accuracy class of the meter of the
ith consumer, and
is the energy registered by the meter of the
ith consumer.
Since Equation (40) is valid for any period of time, if consider
N values of energy, from each of the
N meters, during
N periods of time, the following equations must be satisfied:
So, admitting that the constants are unknown quantities, it is necessary a set of N equations with N unknown quantities. If the N equations are linearly independent, a unique solution will be found for each constant . The value calculated for each indicates whether the corresponding meter is inside or outside its accuracy class m, that is, should belong to the range , otherwise either the meter is tampered or there is a malfunction.
For solving a system of
N equations from Equations (41)–(43), several methods are in order, such as matrix inversion, least squares (recursive statistical methods), among others. Authors in [
47] have proven that for this particular problem, least squares is more efficient.
3.2.3. Sensor Network Approach
The installation of dedicated sensors throughout the grid is considered in some research. This optimization problem involves determining the optimal number and placement of sensors to increase the probability of detecting NTL and to minimize cost. The sensor network approach is closely linked with state estimation, as the sensors themselves cannot determine if NTL has been detected. Reference [
48] surveys the placement of redundant smart meters, which includes an inspector meter installed before consumer smart meters. The inspector meter exchanges data with consumer meters, compares energy consumption measurements, and any difference between these two measurements is configured as NTL. Authors in [
55] presented the use of a non-intrusive load monitor (NILM) using sensors. The NILM uses a database of appliances signatures to identify appliance usage in the home over time. The power consumption time series is analyzed, and the edges corresponding to on/off events are identified and recorded. Each edge magnitude represents one or more appliance events. The NILM works by solving the binary integer programming problem to determine which devices contributes to a given edge:
where
;
, in which
is an |A|-dimensional vector of power appliance consumption profiles.
3.3. Hybrid Methods
Hybrid methods combine both data-oriented and network-oriented methods in order to increase the accuracy of NTL detection methods [
11,
18,
23]. There have been several strategies for combining data and network methods, such as [
11], which uses remote technical units (RTU) to identify sections presenting NTL using the measurement data from smart meters and RTU. If the difference between RTU and smart meters’ measurements exceeds a threshold, NTL is assumed. To identify fraudsters, SVM and fuzzy c-means are applied for decision making purposes.
In [
18], the authors use SVMs with the aid of central observer meters and consider network active power measurements. SVM calculates the difference between the active power measurements and technical losses, classifying the consumer as honest or fraudulent. The authors formulated the revenue of a distribution utility as:
where
is the total consumption of user
i,
is the unbilled part of the usage,
T is the price of electricity,
is the probability of detecting an electricity theft,
e is the effort invested in anti-fraud technologies,
D is the anomaly detection test, and
F represents the recovered fines from detected theft.
In [
23], the authors approach similarly, but instead they use a combination of DT and SVMs.
In [
15], control charts with asymmetric limit-based controls are used to identify regions with NTL. The authors use upper and lower limits to improve the balance between total energy consumption, total measured energy, and total losses. Considering the registered energy of the
kth suspicious consumer in the year of losses observation, at the end of the observed series, is denoted as
. The sum of registered energy belonging to all customers who are suspected in the given region, at the year of losses observation, during the time series period given by:
Considering the energy of the
rth customer who is not suspicious in the year of losses observation, at the last year of observed series, is denoted by
. The sum of registered energy belonging to all customers who are not suspected in the given region, at the year of losses observation, during the time series period is given by:
In [
12], the authors use data from several sources (RTU, smart meters, network parameters) applied on a combination of state estimation and ANOVA. They use smart meters’ consumption data on a distribution state computation to detect the exact location of NTL on the low voltage side of transformer. ANOVA is then used to compare the output with previous verified measurements. The ANOVA output is then fed back to the state estimator for improved estimates. In this paper, the distribution state estimation is formulated by:
where
is the variance for the
ith measurement. This problem is solved by the authors by applying the gradient method and solving Equation (48) iteratively.
3.4. Comparing Non-Hardware-Based NTL Detection Methods
After carefully surveying the literature, it is clear that NTL detection methods have advanced significantly. Data science is a powerful tool for researchers, providing efficient strategies for filtering, processing, and fine-tuning non-hardware-based NTL detection methods. The three different classes (data-oriented, network-oriented, and hybrid) make use of different sources of data, and authors apply several methods to identify NTL in each database. Since distribution systems databases contain a significant amount of data, pre-processing this data improves the method’s performance, making it possible to effectively use a wide range of data.
Table 4 shows a comparison between the different non-hardware-based NTL detection methods.
3.5. Features of Non-Hardware-Based NTL Detection Methods
Following the
Table 5, the most common feature for non-hardware-based NTL detection methods is consumption, for data oriented methods consumption is employed for supervised or unsupervised approaches. With consumptions patterns the methods are able to identify NTL units, especially using previous fraudsters patterns. For network-oriented methods, consumption is also the most used feature; essentially, it is possible to identify fraudster by the difference between smart meters and distribution system sensors, also adequate methods of simulation are applied.
One tendency for NTL detection is the employment of Big Data, and not only data from inside (endogenous) of energy companies, for more accurate detection. Detection fraud and theft are common in other fields like credit card fraud detection and commercial fields. Then, data that is not common in energy companies (exogenous data) can be especially used to enrichment the database and efficiency increase in NTL identification [
56].
More features can be employed in several NTL detection systems, like weather inputs, socioeconomic, web scraping, and social network [
57]. Evidently the consumption data is the main feature, although other inputs can bring extensive information and improve the capacity of the NTL identification system to generate more accurate targets and reduce the NTL indices of electricity companies.
4. Future Trends on Non-Technical Losses Detection Methods
Normally, outliers in consumer energy consumption presented in a given database need to be filtered. To accomplish this, large discrepancies must be present, given the non-regularity of consumer energy consumption. These discrepancies may cause anomalies if the data analysis models trained with this database without the removal of such discrepancies. The biggest difficulty on training a manipulated database is to identify an outlier with NTL, and not a random change in consumption pattern from the consumer. That can be cause for a large number of reasons, like travels, uninhabited property, or the season. In the literature, the main techniques for outlier detecting are the standard deviation method [
21,
36], interquartile range (IQR) [
16,
19,
21,
36,
49,
50], Grubbs test [
33,
49], and generalized extreme studentized deviate (GESD) [
50,
52].
4.1. Standard Deviation Method
Standard deviation is used as a method to measure dataset dispersion. When the standard deviation is low, that means the data considered is homogeneous. In case the standard deviation is high, the data on a set are sparse [
21,
53]. Also, according to the probability theorem, the larger the sample, the closer to the sampling distribution of its mean is to a normal distribution.
4.2. Interquartile Range
The IQR can be used as a measure of how spread out the values are. Statistics assume that the values are clustered around a central value. The IQR informs how spread out the values are in relation to the center values. It can also be used to signal when other values are far from central values, these far values are then called outliers. The approaches for detecting outliers using IQR is the most commonly used method, and it has been shown to be reliable. Its calculation is simple, which allows the pre-treatment of large volumes of data with low computational cost [
16]. IQR methods do not have filter calibration, which means they are statistical methods with a static behavior [
19].
4.3. Grubbs Test
Grubbs test is used to detect a single outlier on a univariate dataset. The dataset follows an approximately normal distribution, and the Grubbs test is defined as one hypothesis. The Grubbs test detects one outlier at a time. This outlier is removed from a dataset, and the test is iterated until there are no outliers detected. Multiple iterations change the probabilities of detection, and the test should not be used for small sample sizes, since it frequently tags most points as outliers. The test always checks the value which shows the largest absolute deviation from the mean. If the outlier has been identified and removed, the test must not be repeated without adapting the critical value [
33].
4.4. Generalized Extreme Studentized Deviate
The GESD is a statistical approach used to detect one or more outliers in a univariate dataset that follows a distribution approximately normal. The statistical approaches assume that regular data follow a statistical model, and the data that do not the model are discrepant. GESD overcomes the primary limitation of the Grubbs test and the Tietjen-Moore test [
21] where the suspected number of outliers (k) must be exactly specified. If k is not correctly specified, it can compromise the test’s conclusions. GESD requires only that an upper limit for the suspect number of discrepant values be specified. Given this upper limit (r), GESD test execute r separate tests: one test for the atypical value, another test for two atypical values, and so forth until r atypical values.
In addition to these methods, the authors are beginning to invest on the combination of ML methods. In [
58], the authors use a Ridge classifier aiming to reduce models’ overfitting. Another trend is the improvement of neural networks used to classify fraudsters [
59]. In [
60] the authors advance on this subject, presenting new artificial neural network architectures to improve NTL detection. Advancing on neural networks trends, the work in [
61] combines multi-layer perceptron and gated recurrent unit, combined with the SMOTE methods for balancing data.
5. Case Studies
In [
62], authors applied their methodology to the main electric company of Spain, ENDESA. Their method is focused on null consumption consumers, and their framework was able to increase NTL detection from 5% to 14.75%. This means that null consumption not always means NTL, and additional data mining techniques and data science are needed to improve NTL detection assertiveness.
The focus in [
63] was ENDESA industrial and commercial consumers. The model was trained with 57,000 inspection results. The extreme gradient-boosted trees presented an accuracy of 21% for new inspections generated by the classification list of probable fraudsters. An improvement was achieved by the authors in [
9] where a 47% hit rate was achieved using smart meters and a database where 80% was for training the neural network, 10% for validation, and 10% for testing.
The theoretical precision of the model proposed in [
64] achieved an accuracy of 70%. However, previous experiences indicate that this theoretical effectiveness index is not verified in real inspections. Commonly, the real accuracy rate is substantially lower than the theoretical. This paper evidences the 0.8 threshold and the 50% balance between normal and irregular for the training stage.
The work in [
54] is focused on the financial return. The work involves a reduced list of inspections and simulations, focusing on recall and precision, using 70% of the database for training and 30% for testing. Although the method shows improvement when using ML techniques, it was not applied on real inspections.
The complete solution proposed in [
65] shows the importance of exogenous variables associated to endogenous data. Field inspections show an accuracy of 30%, surpassing several applied methods.
Another theoretical study case was presented in [
54]. In this work, authors applied different strategies to detect anomalies, being able to achieve 64.54% hit rate when using their optimum-path forest design. However, this level of accuracy was not validated by field inspections.
6. Discussion
Between all screened non-hardware-based NTL detection methods, the importance of data quality was evident. Data oriented, network oriented, and hybrid approaches show that the size of the dataset considered in the method impacts on their efficiency, that shows the importance of pre-processing the data without losing data quality.
Most of the surveyed data-oriented NTL detection methods use supervised learning. These methods require labeled data from both honest consumers and fraudsters. When these labeled data exist, it is probable that the method will face class imbalance problems. In fact, since the grid has more regular consumers than irregulars, the class imbalance can lead models into miss-classification. Unsupervised methods do not require labels. These methods are used in case a large number of honest samples are available, whereas fraudster samples are few or non-existing. Another advantage of unsupervised methods is their adaptability to zero-day attacks, which are becoming common when using smart meters.
In essence, supervised methods are trained to detect specific types of NTL. If a new energy consumption behavior happens, supervised methods are more likely to fail their detection, since this behavior is not present on the training set. For this problem, it is more admissible use unsupervised methods that are independent from the positive class labeling.
Network-based NTL detection methods use measurements of smart meters allied with the parameters’ estimation of electrical systems in order to detect NTL. They can be divided into load flow approaches, state estimation, and sensor networks. Although most network-based NTL detection methods require specific infrastructure to be applied, such as smart meters, observer meters, and specific sensors, they can be considered non-hardware-based, since the methods manipulate the data measured by these devices. These methods are deeply dependent on reliability of smart meters and observer meters. They rely mainly on the comparison of measurements from the meters. Load flow and energy balance are the most common strategies to detect NTL due to the simplicity and ease of implementation. State estimation methods are more complex. They require a large level of observability in the grid, as well as detailed grid topology.
Lastly, hybrid methods have been developed in most of the recent researches. These methods combine data-oriented and network-based NTL detection methods, using consumer and network data to improve the method’s assertiveness. By inserting energy balance to data-based methods, the performance is dramatically enhanced, which shows that hybrid methods represent an interesting path to follow regarding NTL detection.
Table 6 shows the summary of the pros and cons of each approach.
Recommendations
According to the extensive review, a clear direction towards hybrid methods is observed. Data-based methods require large datasets, which are not always available. Network-based methods require high quality data, meaning that these methods need high quality equipment to gather this data.
Hybrid methods combine the pros from both data-based and network-based methods. Reviewed hybrid methods showed that they are not restricted by the dimension of consumer’s energy consumption data [
13], proving the flexibility of such methods. Moreover, hybrid methods are capable of identifying fraudsters as well as detecting faulty equipment [
14], drastically improving NTL detection. Another example of the hybrid methods’ superiority is the improvement of a data-based method’s performance by adding energy balance data provided by network meters [
18].
The development of metrics and graphical analysis is very important. Since the data of fraudsters and regular consumers is unbalanced, mostly composed of regular consumers, assertiveness alone is not enough to determine the occurrence of NTL. In [
66], it is possible to notice that, if the goal of energy companies is the return of investment, metrics such as precision, recall, accuracy, and F1-score are no longer the most suitable.
Moreover, the problem of data imbalance is of most concern for NTL detection methods. Researchers have been investigating this matter, and they notice an improvement when using deep learning algorithms to work with unbalanced databases [
67]. The importance of this approach is clear in [
68], where the authors take advantage of the advanced metering infrastructure (AMI) to acquire data, using clustering algorithms to produce an anomaly score to discriminate fraudsters and normal users.
Also, NTL detection methods must be able to determine when the fraud starts and when the fraud ends. The authors in [
9] already use a temporal approach, where they are able to create consumers’ samples using results of previous field inspections.
Another emerging concept is the use of exogenous data, which is information external to the environment under analysis. These exogenous data combined with endogenous data from energy companies are responsible to improve the performance of NTL detection methods. Authors in [
65] used exogenous data for a complete NTL identification, where supervised learning and hyperparameters optimization was applied. In this work, several metrics were used, proving the importance of considering the correct metrics for each situation.
7. Conclusions
This article presents a thorough review regarding non-hardware-based Non-Technical Losses detection methods. This paper aims to provide a view on these methods, in order to help researchers to direct their efforts to promising methods. The research examined the following databases: IEEE Explore, ScienceDirect, and Google Scholar, and the research only considered papers published before 2005. A total of 1523 papers were included on the first part of the review. Applying the considered inclusion criteria, this number was reduced to 57 research papers. The review showed a clear trend, of which hybrid methods provide the best results. It was also possible to notice author’s struggling with class imbalance on data-based methods. Network-based NTL detection methods are very dependent on the meter infrastructure, since most surveyed methods use energy balance approaches in order to detect NTL. When allying data-oriented and network-oriented methods, a clear improvement on NTL detection assertiveness is observable. Since the amount of data available grows with the development of new measurement strategies, a future research trend is revealed. The filtration of outliers in consumer energy consumption avoids anomalies when a model is trained with a database where discrepancies are detected. The main difficulty is to efficiently discriminate an outlier with NTL from a consumption pattern change from the consumer.
Moreover, data imbalance presents a challenge for NTL detection methods, and the authors have been investing in methods to mitigate this problem. With a balanced dataset, the use of exogenous data on the NTL detection methods is improving the assertiveness of several methods, resulting in a promising path for future research.
Author Contributions
Conceptualization, F.G.K.G., N.K.N., B.K.H. and M.B.C.; methodology, F.G.K.G.; software, B.K.H., M.B.C. and L.R.P.; validation, F.G.K.G., N.K.N. and M.B.C.; formal analysis, M.B.C.; investigation, F.G.K.G.; resources, A.A.; data curation, F.G.K.G. and M.B.C.; writing—original draft preparation, F.G.K.G.; writing—review and editing, B.K.H. and M.B.C.; visualization, L.L.C.d.S.; supervision, N.K.N. and A.A.; project administration, N.K.N.; funding acquisition, A.A. All authors have read and agreed to the published version of the manuscript.
Funding
This research was funded by the State Electric Energy Company and the Equatorial Energia Group (ANEEL R&D Program through the CEEE/EQUATORIAL/UFSM project no. 5000003849), National Institute of Science and Technology in Distributed Generation Systems (INCTGD), National Council for Scientific and Technological Development (CNPq—no. 465640/2014-1), Coordination for the Improvement of Higher Education Personnel (CAPES—no. 23038.000776/2017-54), Research Support Foundation of the State of Rio Grande do South (FAPERGS—no. 17/2551-0000517-1) and Federal University of Santa Maria (UFSM), Brazilian Institutions. The APC was funded by State Electric Energy Company and the Equatorial Energia Group (ANEEL R&D Program through the CEEE/EQUATORIAL/UFSM project no. 5000003849).
Data Availability Statement
The data presented in this study might be available on request from the corresponding author.
Acknowledgments
The authors are grateful for the technical and financial support the State Electric Energy Company and the Equatorial Energia Group (ANEEL R&D Program through the CEEE/EQUATORIAL/UFSM project no. 5000003849), National Institute of Science and Technology in Distributed Generation Systems (INCTGD), National Council for Scientific and Technological Development (CNPq—no. 465640/2014-1), Coordination for the Improvement of Higher Education Personnel (CAPES—no. 23038.000776/2017-54), Research Support Foundation of the State of Rio Grande do South (FAPERGS—no. 17/2551-0000517-1) and Federal University of Santa Maria (UFSM), Brazilian Institutions.
Conflicts of Interest
The authors declare no conflict of interest.
References
- Carr, D.; Thomson, M. Non-Technical Electricity Losses. Energies 2022, 15, 2218. [Google Scholar] [CrossRef]
- Costa, B.C.; Alberto, B.L.A.; Portela, A.M.; Maduro, W.; Eler, E.O. Fraud Detection in Electric Power Distribution Networks using an Ann-Based Knowledge-Discovery Process. Int. J. Artif. Intell. Appl. 2013, 4, 17–23. [Google Scholar] [CrossRef]
- Bretas, A.; Bretas, N.; London, J.B., Jr.; Carvalho, B. Cyber-Physical Power Systems State Estimation; Elsevier: Amsterdam, The Netherlands, 2021; pp. 259–277. ISBN 9780323900331. [Google Scholar] [CrossRef]
- Lydia, M.; Kumar, G.E.P.; Levron, Y. Detection of Electricity Theft based on Compressed Sensing. In Proceedings of the 5th International Conference on Advanced Computing & Communication Systems (ICACCS 2019), Coimbatore, India, 15–16 March 2019; pp. 995–1000. [Google Scholar]
- Nagi, J.; Yap, K.S.; Tiong, S.K.; Ahmed, S.K.; Nagi, F. Improving SVM-Based Nontechnical Loss Detection in Power Utility Using the Fuzzy Inference System. IEEE Trans. Power Deliv. 2011, 26, 1284–1285. [Google Scholar] [CrossRef]
- Nagi, J.; Yap, K.S.; Tiong, S.K.; Ahmed, S.K.; Mohamad, M. Nontechnical Loss Detection for Metered Customers in Power Utility Using Support Vector Machines. IEEE Trans. Power Deliv. 2010, 25, 1162–1171. [Google Scholar] [CrossRef]
- Ramos, C.C.O.; De Souza, A.N.; Falcão, A.X.; Papa, J.P. New insights on nontechnical losses characterization through evolutionary-based feature selection. IEEE Trans. Power Deliv. 2012, 27, 140–146. [Google Scholar] [CrossRef]
- Angelos, E.W.S.; Saavedra, O.R.; Cortés, O.A.C.; De Souza, A.N. Detection and identification of abnormalities in customer consumptions in power distribution systems. IEEE Trans. Power Deliv. 2011, 26, 2436–2442. [Google Scholar] [CrossRef]
- Buzau, M.-M.; Tejedor-Aguilera, J.; Cruz-Romero, P.; Gomez-Exposito, A. Hybrid Deep Neural Networks for Detection of Non-Technical Losses in Electricity Smart Meters. IEEE Trans. Power Syst. 2019, 35, 1254–1263. [Google Scholar] [CrossRef]
- Ramos, C.C.O.; De Sousa, A.N.; Papa, J.P.; Falcão, A.X. A new approach for nontechnical losses detection based on optimum-path forest. IEEE Trans. Power Syst. 2011, 26, 181–189. [Google Scholar] [CrossRef]
- Guo, Y.; Ten, C.W.; Jirutitijaroen, P. Online data validation for distribution operations against cybertampering. IEEE Trans. Power Syst. 2014, 29, 550–560. [Google Scholar] [CrossRef]
- Huang, S.C.; Lo, Y.L.; Lu, C.N. Non-technical loss detection using state estimation and analysis of variance. IEEE Trans. Power Syst. 2013, 28, 2959–2966. [Google Scholar] [CrossRef]
- Yip, S.C.; Tan, W.N.; Tan, C.K.; Gan, M.T.; Wong, K.S. An anomaly detection framework for identifying energy theft and defective meters in smart grids. Int. J. Electr. Power Energy Syst. 2018, 101, 189–203. [Google Scholar] [CrossRef]
- Yip, S.C.; Wong, K.S.; Hew, W.P.; Gan, M.T.; Phan, R.C.W.; Tan, S.W. Detection of energy theft and defective smart meters in smart grids using linear regression. Int. J. Electr. Power Energy Syst. 2017, 91, 230–240. [Google Scholar] [CrossRef]
- Spirić, J.V.; Stanković, S.S.; Dočić, M.B. Determining a set of suspicious electricity customers using statistical ACL Tukey’s control charts method. Int. J. Electr. Power Energy Syst. 2016, 83, 402–410. [Google Scholar] [CrossRef]
- Monedero, I.; Biscarri, F.; León, C.; Guerrero, J.I.; Biscarri, J.; Millán, R. Detection of frauds and other non-technical losses in a power utility using Pearson coefficient, Bayesian networks and decision trees. Int. J. Electr. Power Energy Syst. 2012, 34, 90–98. [Google Scholar] [CrossRef]
- Ramos, C.C.O.O.; Rodrigues, D.; De Souza, A.N.A.N.; Papa, J.P.J.P. On the study of commercial losses in Brazil: A binary black hole algorithm for theft characterization. IEEE Trans. Smart Grid 2018, 9, 676–683. [Google Scholar] [CrossRef]
- Jokar, P.; Arianpoo, N.; Leung, V.C.M. Electricity theft detection in AMI using customers’ consumption patterns. IEEE Trans. Smart Grid 2016, 7, 216–226. [Google Scholar] [CrossRef]
- Iglesias, F.; Kastner, W. Analysis of Similarity Measures in Times Series Clustering for the Discovery of Building Energy Patterns. Energies 2013, 6, 579–597. [Google Scholar] [CrossRef]
- Fenza, G.; Gallo, M.; Loia, V. Drift-aware methodology for anomaly detection in smart grid. IEEE Access 2019, 7, 9645–9657. [Google Scholar] [CrossRef]
- Ghori, K.M.; Awais, M.; Khattak, A.S.; Imran, M.; Szathmary, L. Treating Class Imbalance in Non-Technical Loss Detection: An Exploratory Analysis of a Real Dataset. IEEE Access 2021, 9, 98928–98938. [Google Scholar] [CrossRef]
- Júnior, L.A.P.; Ramos, C.C.O.; Rodrigues, D.; Pereira, D.R.; de Souza, A.N.; da Costa, K.A.P.; Papa, J.P. Unsupervised non-technical losses identification through optimum-path forest. Electr. Power Syst. Res. 2016, 140, 413–423. [Google Scholar] [CrossRef]
- Jindal, A.; Dua, A.; Kaur, K.; Singh, M.; Kumar, N.; Mishra, S. Decision Tree and SVM-Based Data Analytics for Theft Detection in Smart Grid. IEEE Trans. Ind. Inform. 2016, 12, 1005–1016. [Google Scholar] [CrossRef]
- Zheng, Z.; Yang, Y.; Niu, X.; Dai, H.N.; Zhou, Y. Wide and Deep Convolutional Neural Networks for Electricity-Theft Detection to Secure Smart Grids. IEEE Trans. Ind. Inform. 2018, 14, 1606–1615. [Google Scholar] [CrossRef]
- Ramos, C.C.O.; Souza, A.N.; Chiachia, G.; Falcão, A.X.; Papa, J.P. A novel algorithm for feature selection using Harmony Search and its application for non-technical losses detection. Comput. Electr. Eng. 2011, 37, 886–894. [Google Scholar] [CrossRef]
- Elsayad, A.; Elsalamony, H. Diagnosis of Breast Cancer using Decision Tree Models and SVM. Int. J. Comput. Appl. 2013, 83, 19–29. [Google Scholar] [CrossRef]
- Chebrolu, S.; Abraham, A.; Thomas, J.P. Feature deduction and ensemble design of intrusion detection systems. Comput. Secur. 2005, 24, 295–307. [Google Scholar] [CrossRef]
- Axelsson, S. The Base-Rate Fallacy and the Difficulty of Intrusion Detection. ACM Trans. Inf. Syst. Secur. 2000, 3, 186–205. [Google Scholar] [CrossRef]
- Otuoze, A.O.; Mustafa, M.W.; Sofimieari, I.E.; Dobi, A.M.; Sule, A.H.; Abioye, A.E.; Saeed, M.S. Electricity theft detection framework based on universal prediction algorithm. Indones. J. Electr. Eng. Comput. Sci. 2019, 15, 758–768. [Google Scholar]
- No, J.G.; Han, S.Y.; Joo, Y.J.; Shin, J.-H.H.; No, J.G.; Shin, J.-H.H.; Joo, Y.J. Conditional abnormality detection based on AMI data mining. IET Gener. Transm. Distrib. 2016, 10, 3010–3016. [Google Scholar]
- Henriques, H.O.; Barbero, A.P.L.; Ribeiro, R.M.; Fortes, M.Z.; Zanco, W.; Xavier, O.S.; Amorim, R.M. Development of adapted ammeter for fraud detection in low-voltage installations. Meas. J. Int. Meas. Confed. 2014, 56, 1–7. [Google Scholar] [CrossRef]
- León, C.; Biscarri, F.; Monedero, I.; Guerrero, J.I.; Biscarri, J.; Millán, R. Integrated expert system applied to the analysis of non-technical losses in power utilities. Expert Syst. Appl. 2011, 38, 10274–10285. [Google Scholar] [CrossRef]
- Aslam, M. Introducing Grubbs’s test for detecting outliers under neutrosophic statistics—An application to medical data. J. King Saud Univ.—Sci. 2020, 32, 2696–2700. [Google Scholar] [CrossRef]
- Lin, C.-L.; Fan, C.L. Evaluation of CART, CHAID, and QUEST algorithms: A case study of construction defects in Taiwan. J. Asian Arch. Build. Eng. 2019, 18, 539–553. [Google Scholar] [CrossRef]
- Salinas, S.; Li, M.; Li, P. Privacy-preserving energy theft detection in smart grids: A P2P computing approach. IEEE J. Sel. Areas Commun. 2013, 31, 257–267. [Google Scholar] [CrossRef]
- Huang, J.; Ling, C.X. Using AUC and accuracy in evaluating learning algorithms. IEEE Trans. Knowl. Data Eng. 2005, 17, 299–310. [Google Scholar] [CrossRef]
- Yurtseven, Ç. The causes of electricity theft: An econometric analysis of the case of Turkey. Util. Policy 2015, 37, 70–78. [Google Scholar] [CrossRef]
- Saeed, M.S.; Mustafa, M.W.; Sheikh, U.U.; Jumani, T.A.; Mirjat, N.H. Ensemble bagged tree based classification for reducing non-technical losses in multan electric power company of Pakistan. Electronics 2019, 8, 860. [Google Scholar] [CrossRef]
- Nagi, J.; Mohammad, A.M.; Yap, K.S.; Tiong, S.K.; Ahmed, S.K. Non-Technical Loss analysis for detection of electricity theft using support vector machines. In Proceedings of the 2008 IEEE 2nd International Power and Energy Conference, Johor Bahru, Malaysia, 1–3 December 2008; pp. 907–912. [Google Scholar] [CrossRef]
- Depuru, S.S.S.R.; Wang, L.; Devabhaktuni, V.; Nelapati, P. A hybrid neural network model and encoding technique for enhanced classification of energy consumption data. In Proceedings of the 2011 IEEE Power and Energy Society General Meeting, Detroit, MI, USA, 24–28 July 2011; pp. 1–8. [Google Scholar] [CrossRef]
- Anas, M.; Javaid, N.; Mahmood, A.; Raza, S.M.; Qasim, U.; Khan, Z.A. Minimizing electricity theft using smart meters in AMI. In Proceedings of the 7th International Conference on P2P, Parallel, Grid, Cloud and Internet Computing (3PGCIC 2012), Victoria, BC, Canada, 12–14 November 2012; pp. 176–182. [Google Scholar]
- Cody, C.; Ford, V.; Siraj, A. Decision tree learning for fraud detection in consumer energy consumption. In Proceedings of the 14th IEEE International Conference on Machine Learning and Applications (ICMLA 2015), Miami, FL, USA, 9–11 December 2015; pp. 1175–1179. [Google Scholar]
- Quinlan, J.R. Learning with continuous classes. In Proceedings of the 5th Australian Joint Conference on Artificial Intelligence, Hobart, Tasmania, Australia, 16–18 November 1992; Volume 92. [Google Scholar]
- Nizar, A.H.; Dong, Z.Y.; Zhao, J.H.; Zhang, P. A Data Mining Based NTL Analysis Method. In Proceedings of the IEEE Power Engineering Society General Meeting, Tampa, FL, USA, 24–28 June 2007; pp. 1–8. [Google Scholar]
- Yip, S.C.; Tan, C.K.; Tan, W.N.; Gan, M.T.; Bakar, A.H.A. Energy theft and defective meters detection in AMI using linear regression. In Proceedings of the 2017 IEEE International Conference on Environment and Electrical Engineering and 2017 IEEE Industrial and Commercial Power Systems Europe (EEEIC/I&CPS Europe), Milan, Italy, 6–9 June 2017; pp. 1–6. [Google Scholar]
- Nikovski, D.N.; Wang, Z.; Esenther, A.; Sun, H.; Sugiura, K.; Muso, T.; Tsuru, K. Smart Meter Data Analysis for Power Theft Detection. In Proceedings of the 14th International Conference of Machine Learning and Data Mining in Pattern Recognition, New York, NY, USA, 19–25 July 2013; pp. 379–389. [Google Scholar]
- Bandim, C.J.; Alves, J.E.R.; Pinto, A.V.; Souza, F.C.; Loureiro, M.R.B.; Magalhaes, C.A.; Galvez-Durand, F. Identification of energy theft and tampered meters using a central observer meter: A mathematical approach. In Proceedings of the 2003 IEEE PES Transmission and Distribution Conference & Exposition, Dallas, TX, USA, 7–12 September 2003; pp. 163–168. [Google Scholar]
- Trevizan, R.D.; Bretas, A.S.; Rossoni, A. Nontechnical Losses detection: A Discrete Cosine Transform and Optimum-Path Forest based approach. In Proceedings of the North American Power Symposium (NAPS 2015), Charlotte, NC, USA, 4–6 October 2015; pp. 1–6. [Google Scholar]
- Hancock, J.; Khoshgoftaar, T.M. Impact of Hyperparameter Tuning in Classifying Highly Imbalanced Big Data. In Proceedings of the 2021 IEEE 22nd International Conference on Information Reuse and Integration for Data Science (IRI), Las Vegas, NV, USA, 10–12 August 2021; Available online: https://ieeexplore.ieee.org/document/9599143/ (accessed on 12 October 2022).
- Wang, D.-G.; Chen, D.J.; Huang, L.; Gong, Y. Anomaly Behavior Detection Based on Ensemble Decision Tree in Power Distribution Network. In Proceedings of the 2018 4th Annual International Conference on Network and Information Systems for Computers (ICNISC), Wuhan, China, 19–21 April 2018; Available online: https://ieeexplore.ieee.org/document/8842990/ (accessed on 20 August 2022).
- Nguyen, V. Bayesian Optimization for Accelerating Hyper-Parameter Tuning. In Proceedings of the 2019 IEEE Second International Conference on Artificial Intelligence and Knowledge Engineering (AIKE), Sardinia, Italy, 3–5 June 2019. [Google Scholar]
- Oo, M.C.M.; Thein, T. Hyperparameters optimization in scalable random forest for big data analytics. In Proceedings of the 2019 IEEE 4th International Conference on Computer and Communication Systems, ICCCS 2019, Singapore, 23–25 February 2019; pp. 125–129. [Google Scholar] [CrossRef]
- Pereira, J.; Saraiva, F. A Comparative Analysis of Unbalanced Data Handling Techniques for Machine Learning Algorithms to Electricity Theft Detection. In Proceedings of the 2020 IEEE Congress on Evolutionary Computation (CEC), Glasgow, UK, 19–24 July 2020. [Google Scholar]
- Massafero, P.; Di Martino, J.M.; Fernández, A. Fraud detection in electric power distribution: Na approach that maximizes the economic return. IEEE Trans. Power Syst. 2020, 35, 703–710. [Google Scholar] [CrossRef]
- Ferreira, T.S.D.; Trindade, F.C.L.; Vieira, J.C.M. Load flow-based method for nontechnical loss detection and location in distribution systems using smart meters. IEEE Trans. Power Syst. 2020, 35, 3671–3681. [Google Scholar] [CrossRef]
- Javaid, N.; Akbar, M.; Aldegheishem, A.; Alrajeh, N.; Mohammed, E.A. Employing a machine learning boosting classifiers based stacking ensemble model for detecting non technical losses in smart grids. IEEE Access 2022, 10, 121886–121899. [Google Scholar]
- Karimi Zandian, Z.; Keyvanpour, M.R. MEFUASN: A Helpful Method to Extract Features Using Analyzing Social Network for Fraud Detection. J. AI Data Min. 2019, 7, 213–224. [Google Scholar] [CrossRef]
- Ullah, A.; Javaid, N.; Javed, M.U.; Pamir; Kim, B.-S.; Bahaj, S.A. Adaptive Data Balancing Method Using Stacking Ensemble Model and Its Application to Non-Technical Loss Detection in Smart Grids. IEEE Access 2022, 10, 133244–133255. [Google Scholar] [CrossRef]
- Duarte Soares, L.; de Souza Queiroz, A.; López, G.P.; Carreño-Franco, E.M.; López-Lezama, J.M.; Muñoz-Galeano, N. BiGRU-CNN Neural Network Applied to Electric Energy Theft Detection. Electronics 2022, 11, 693. [Google Scholar] [CrossRef]
- Asif, M.; Nazeer, O.; Javaid, N.; Alkhammash, E.H.; Hadjouni, M. Data Augmentation Using BiWGAN, Feature Extraction and Classification by Hybrid 2DCNN and BiLSTM to Detect Non-Technical Losses in Smart Grids. IEEE Access 2022, 10, 27467–27483. [Google Scholar] [CrossRef]
- Kabir, B.; Qasim, U.; Javaid, N.; Aldegheishem, A.; Alrajeh, N.; Mohammed, E.A. Detecting Nontechnical Losses in Smart Meters Using a MLP-GRU Deep Model and Augmenting Data via Theft Attacks. Sustainability 2022, 14, 15001. [Google Scholar] [CrossRef]
- Guerreiro, J.; Monedero, I.; Biscarri, J.; Biscarri, F.; Millán, R.; Léon, C. Non-Technical Losses Reduction by Improving the Inspections Accuracu in a Power Utility. IEEE Trans. Power Syst. 2016, 32, 1209–1218. [Google Scholar]
- Buzar, M.; Tejedor-Aguilera, J.; Cruz-Romero, P.; Gómez-Expósito, A. Detection of Non-Technical Losses Using Smart Meter Data and Supervised Learning. IEEE Trans. Smart Grids 2019, 10, 2661–2670. [Google Scholar]
- Pulz, J.; Muller, R.B.; Romero, F.; Meffe, A.; Garcez Neto, A.; Jesus, A.S. Fraud detection in low-voltage electricity caonsumers using socio-economic indicators and billing profile in smart grids. In Proceedings of the 24th International Conference & Exhibition on Electricity Distribution (CIRED), Glasgow, UK, 12–15 June 2017. [Google Scholar]
- Capeletti, M.B.; Hammerschmitt, B.K.; Negri, R.G.; Guarda, F.G.K.; Prade, L.R.; Knak Neto, N.; Abaide, A.R. Identification of nontechnical losses in distribution systems adding exogenous data and artificial intelligence. Energies 2022, 15, 8794. [Google Scholar] [CrossRef]
- Barros, R.M.R.; da Costa, E.G.; Araujo, J.F. Maximizing the financial return of non-technical loss management in power distribution systems. IEEE Trans. Power Syst. 2021, 37, 1634–1641. [Google Scholar] [CrossRef]
- Lee, J.; Sun, Y.G.; Sim, I.; Kim, S.H.; Kim, D.I.; Kim, J.Y. Non-Technical loss detection using deep reinforcement learning for feature cost efficiency and imbalanced dataset. IEEE Access 2022, 10, 27084–27095. [Google Scholar] [CrossRef]
- Qi, R.; Zheng, J.; Luo, Z.; Li, Q. A Novel Unsupervised Data-Driven Method for Electricity Theft Detection in AMI Using Observer Meters. IEEE Trans. Instrum. Meas. 2022, 71, 1–10. [Google Scholar] [CrossRef]
| Disclaimer/Publisher’s Note: The statements, opinions and data contained in all publications are solely those of the individual author(s) and contributor(s) and not of MDPI and/or the editor(s). MDPI and/or the editor(s) disclaim responsibility for any injury to people or property resulting from any ideas, methods, instructions or products referred to in the content. |
© 2023 by the authors. Licensee MDPI, Basel, Switzerland. This article is an open access article distributed under the terms and conditions of the Creative Commons Attribution (CC BY) license (https://creativecommons.org/licenses/by/4.0/).


 ,
, 


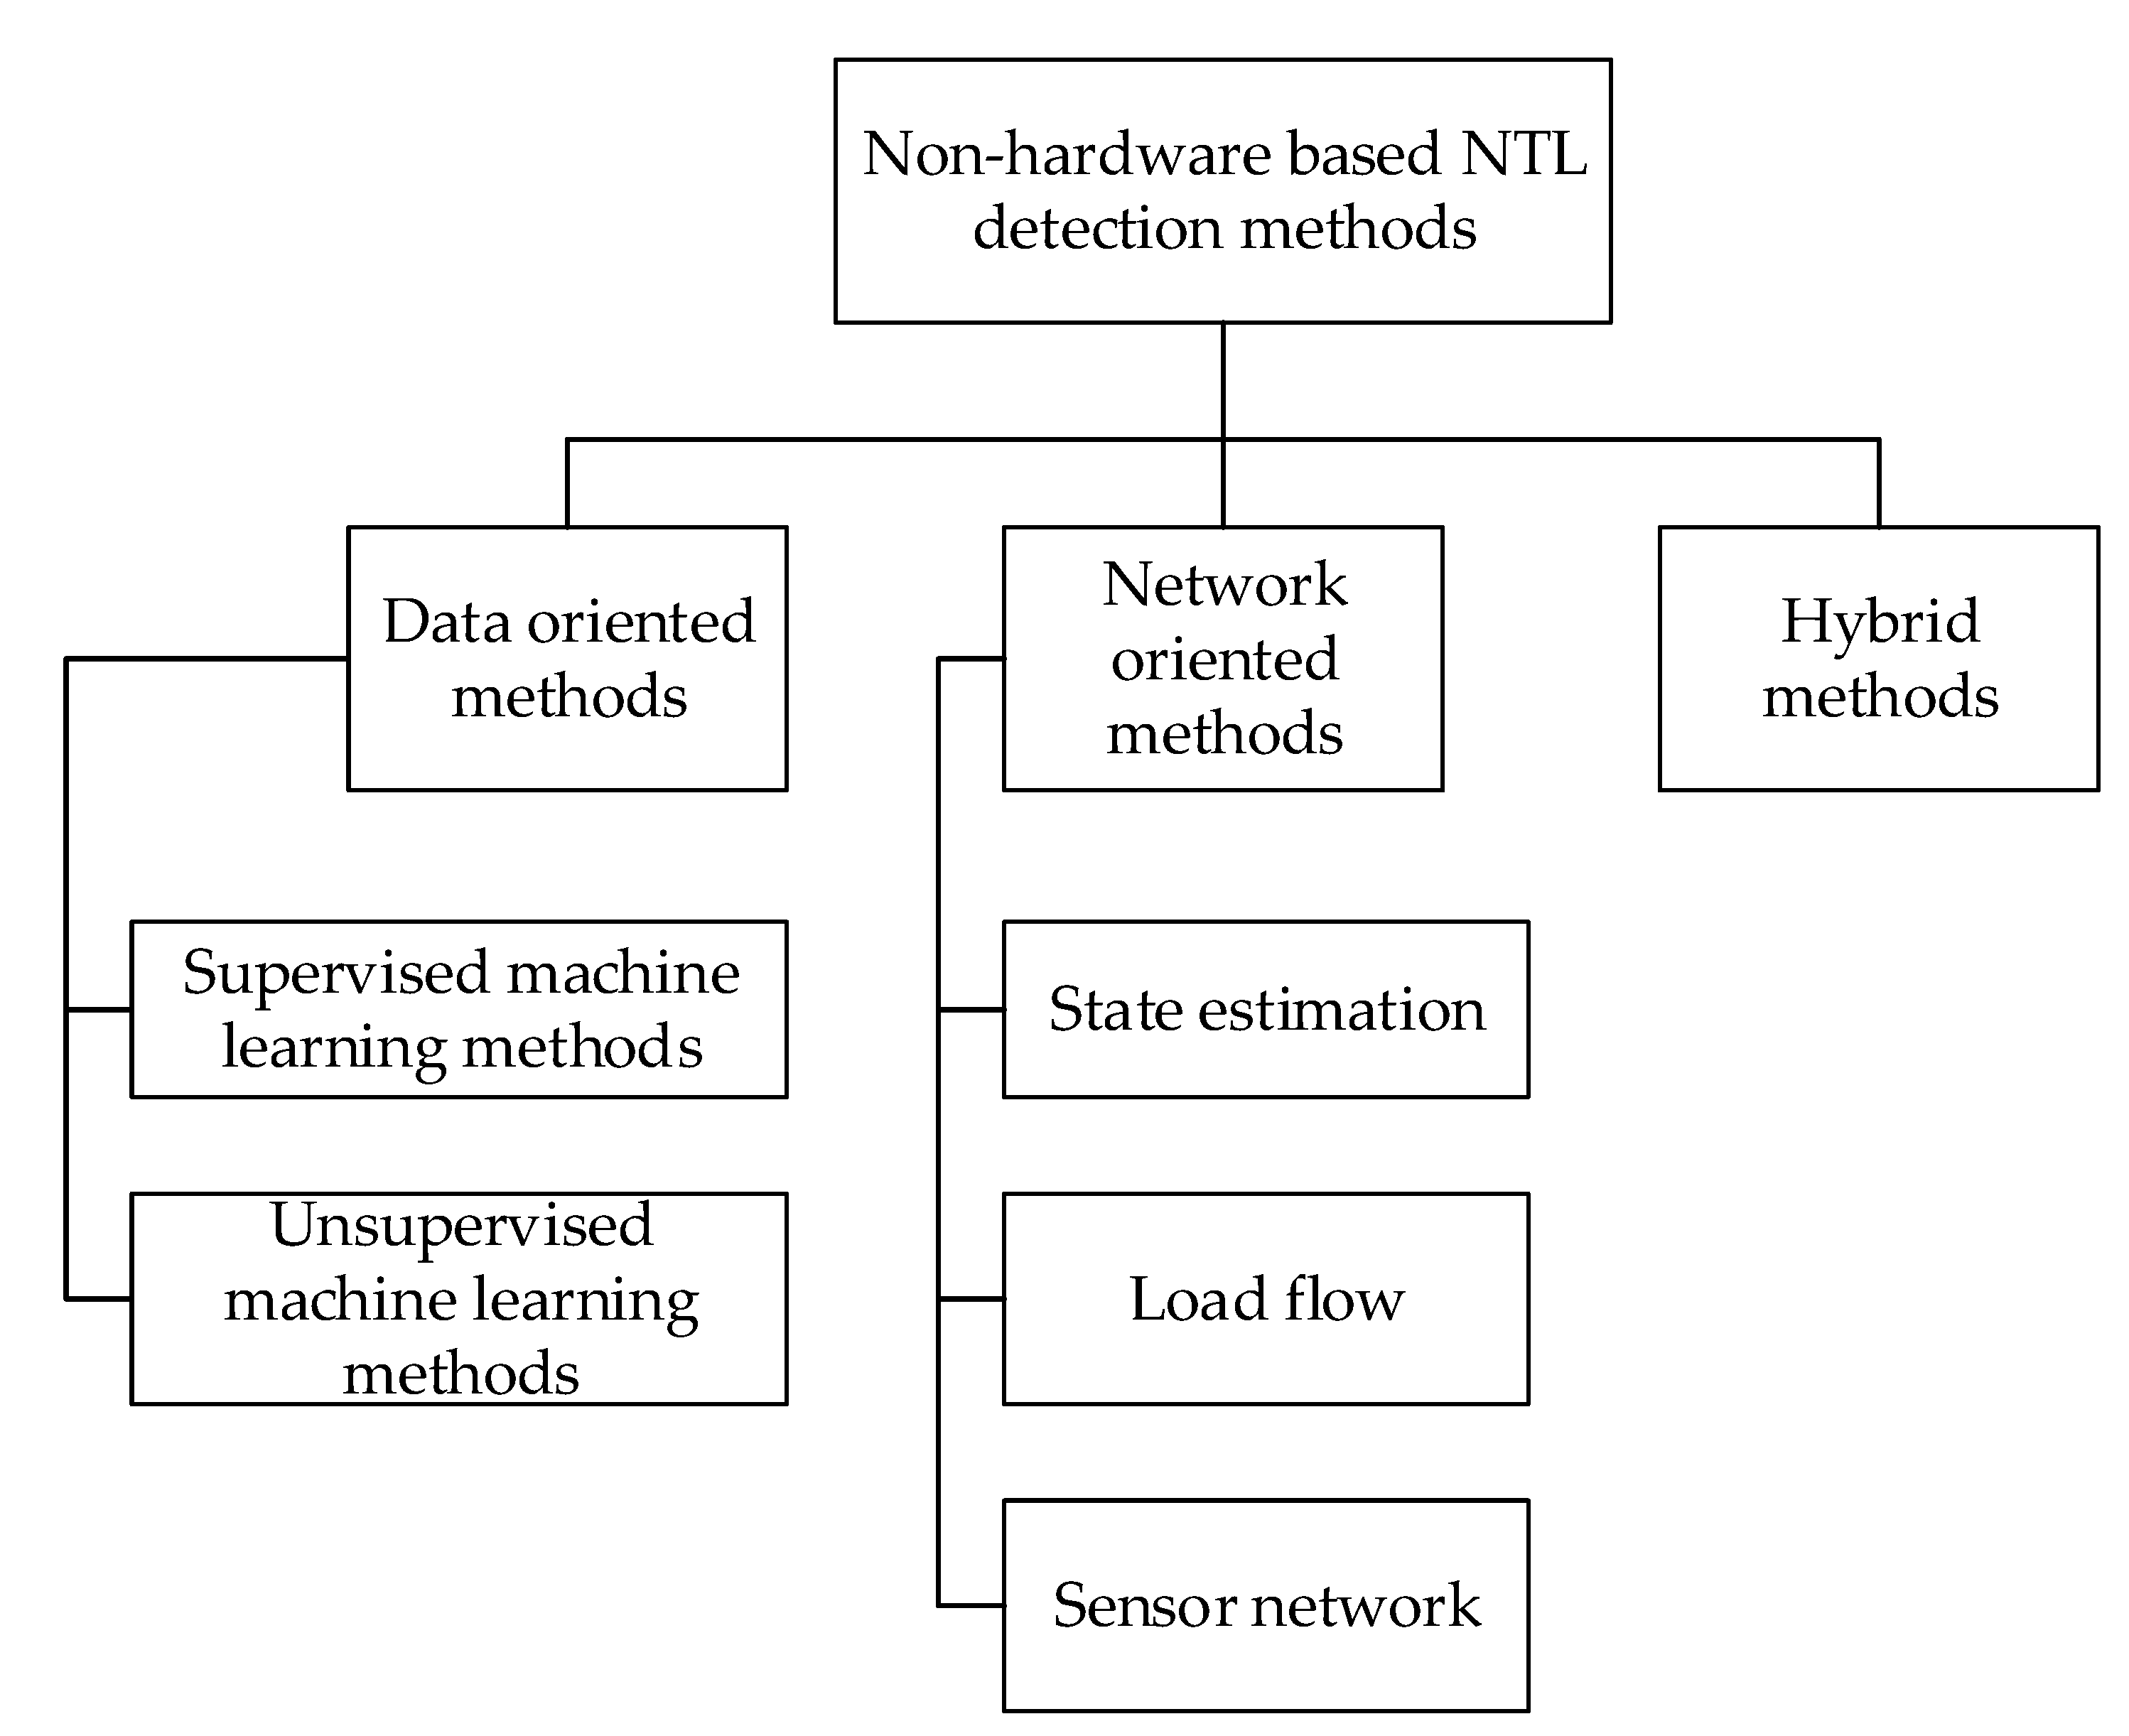
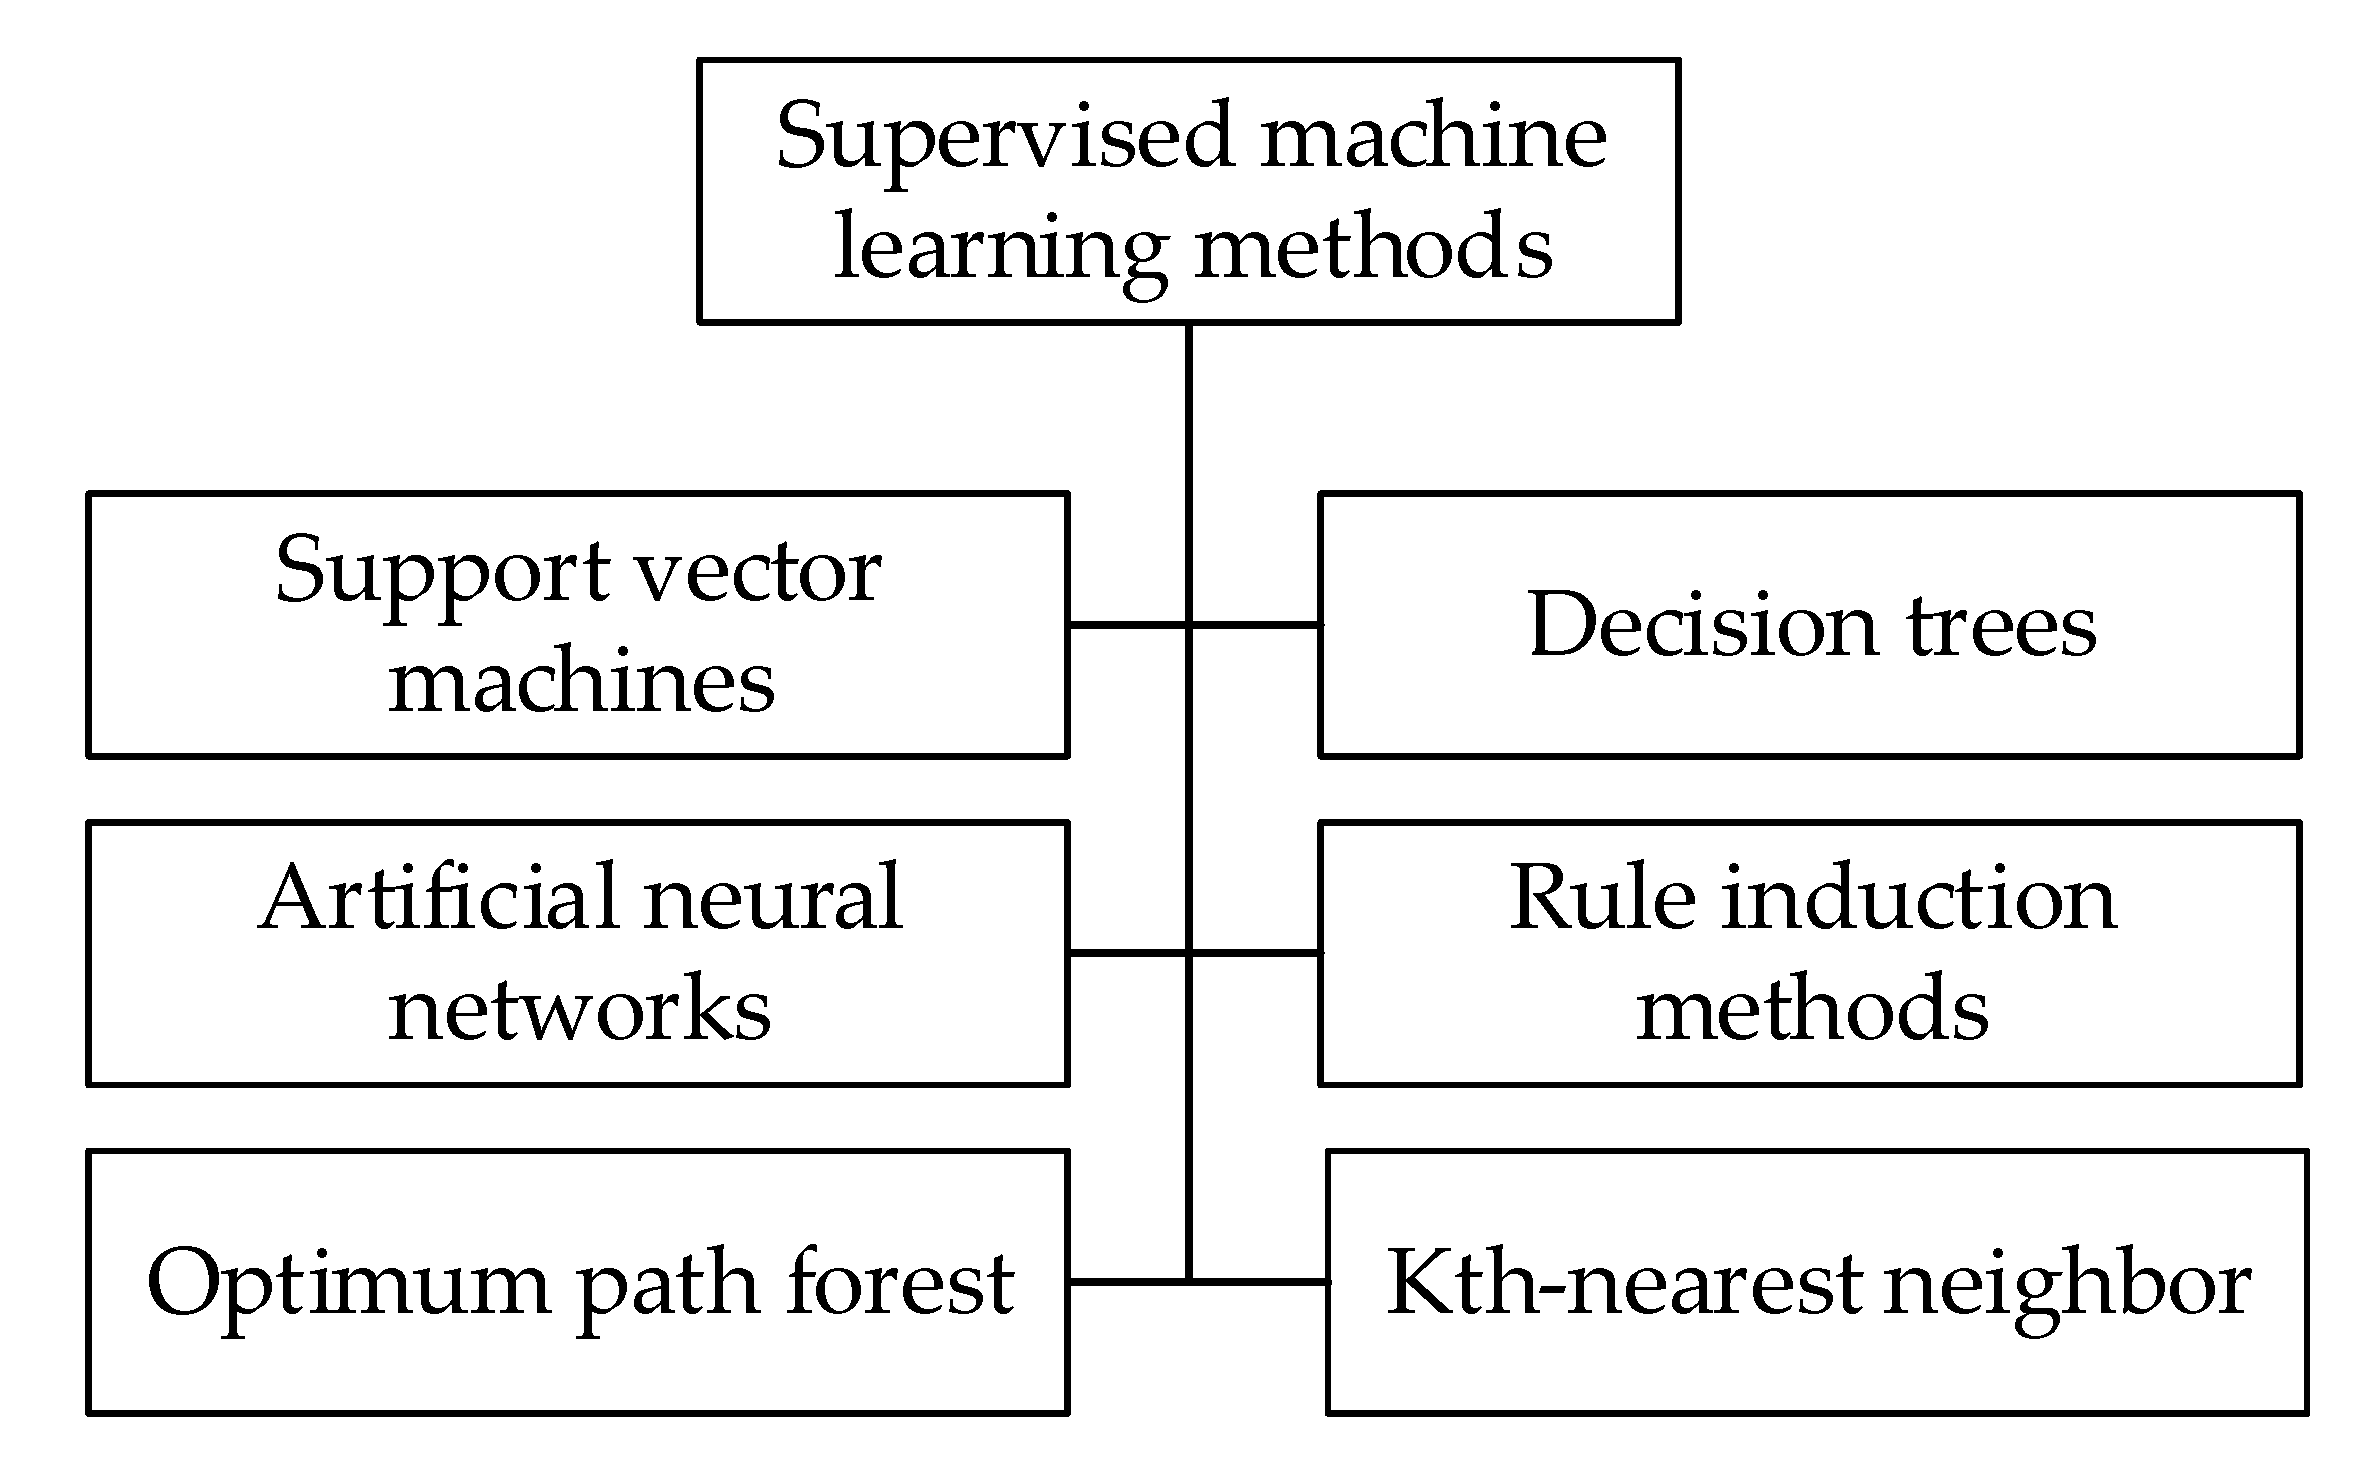
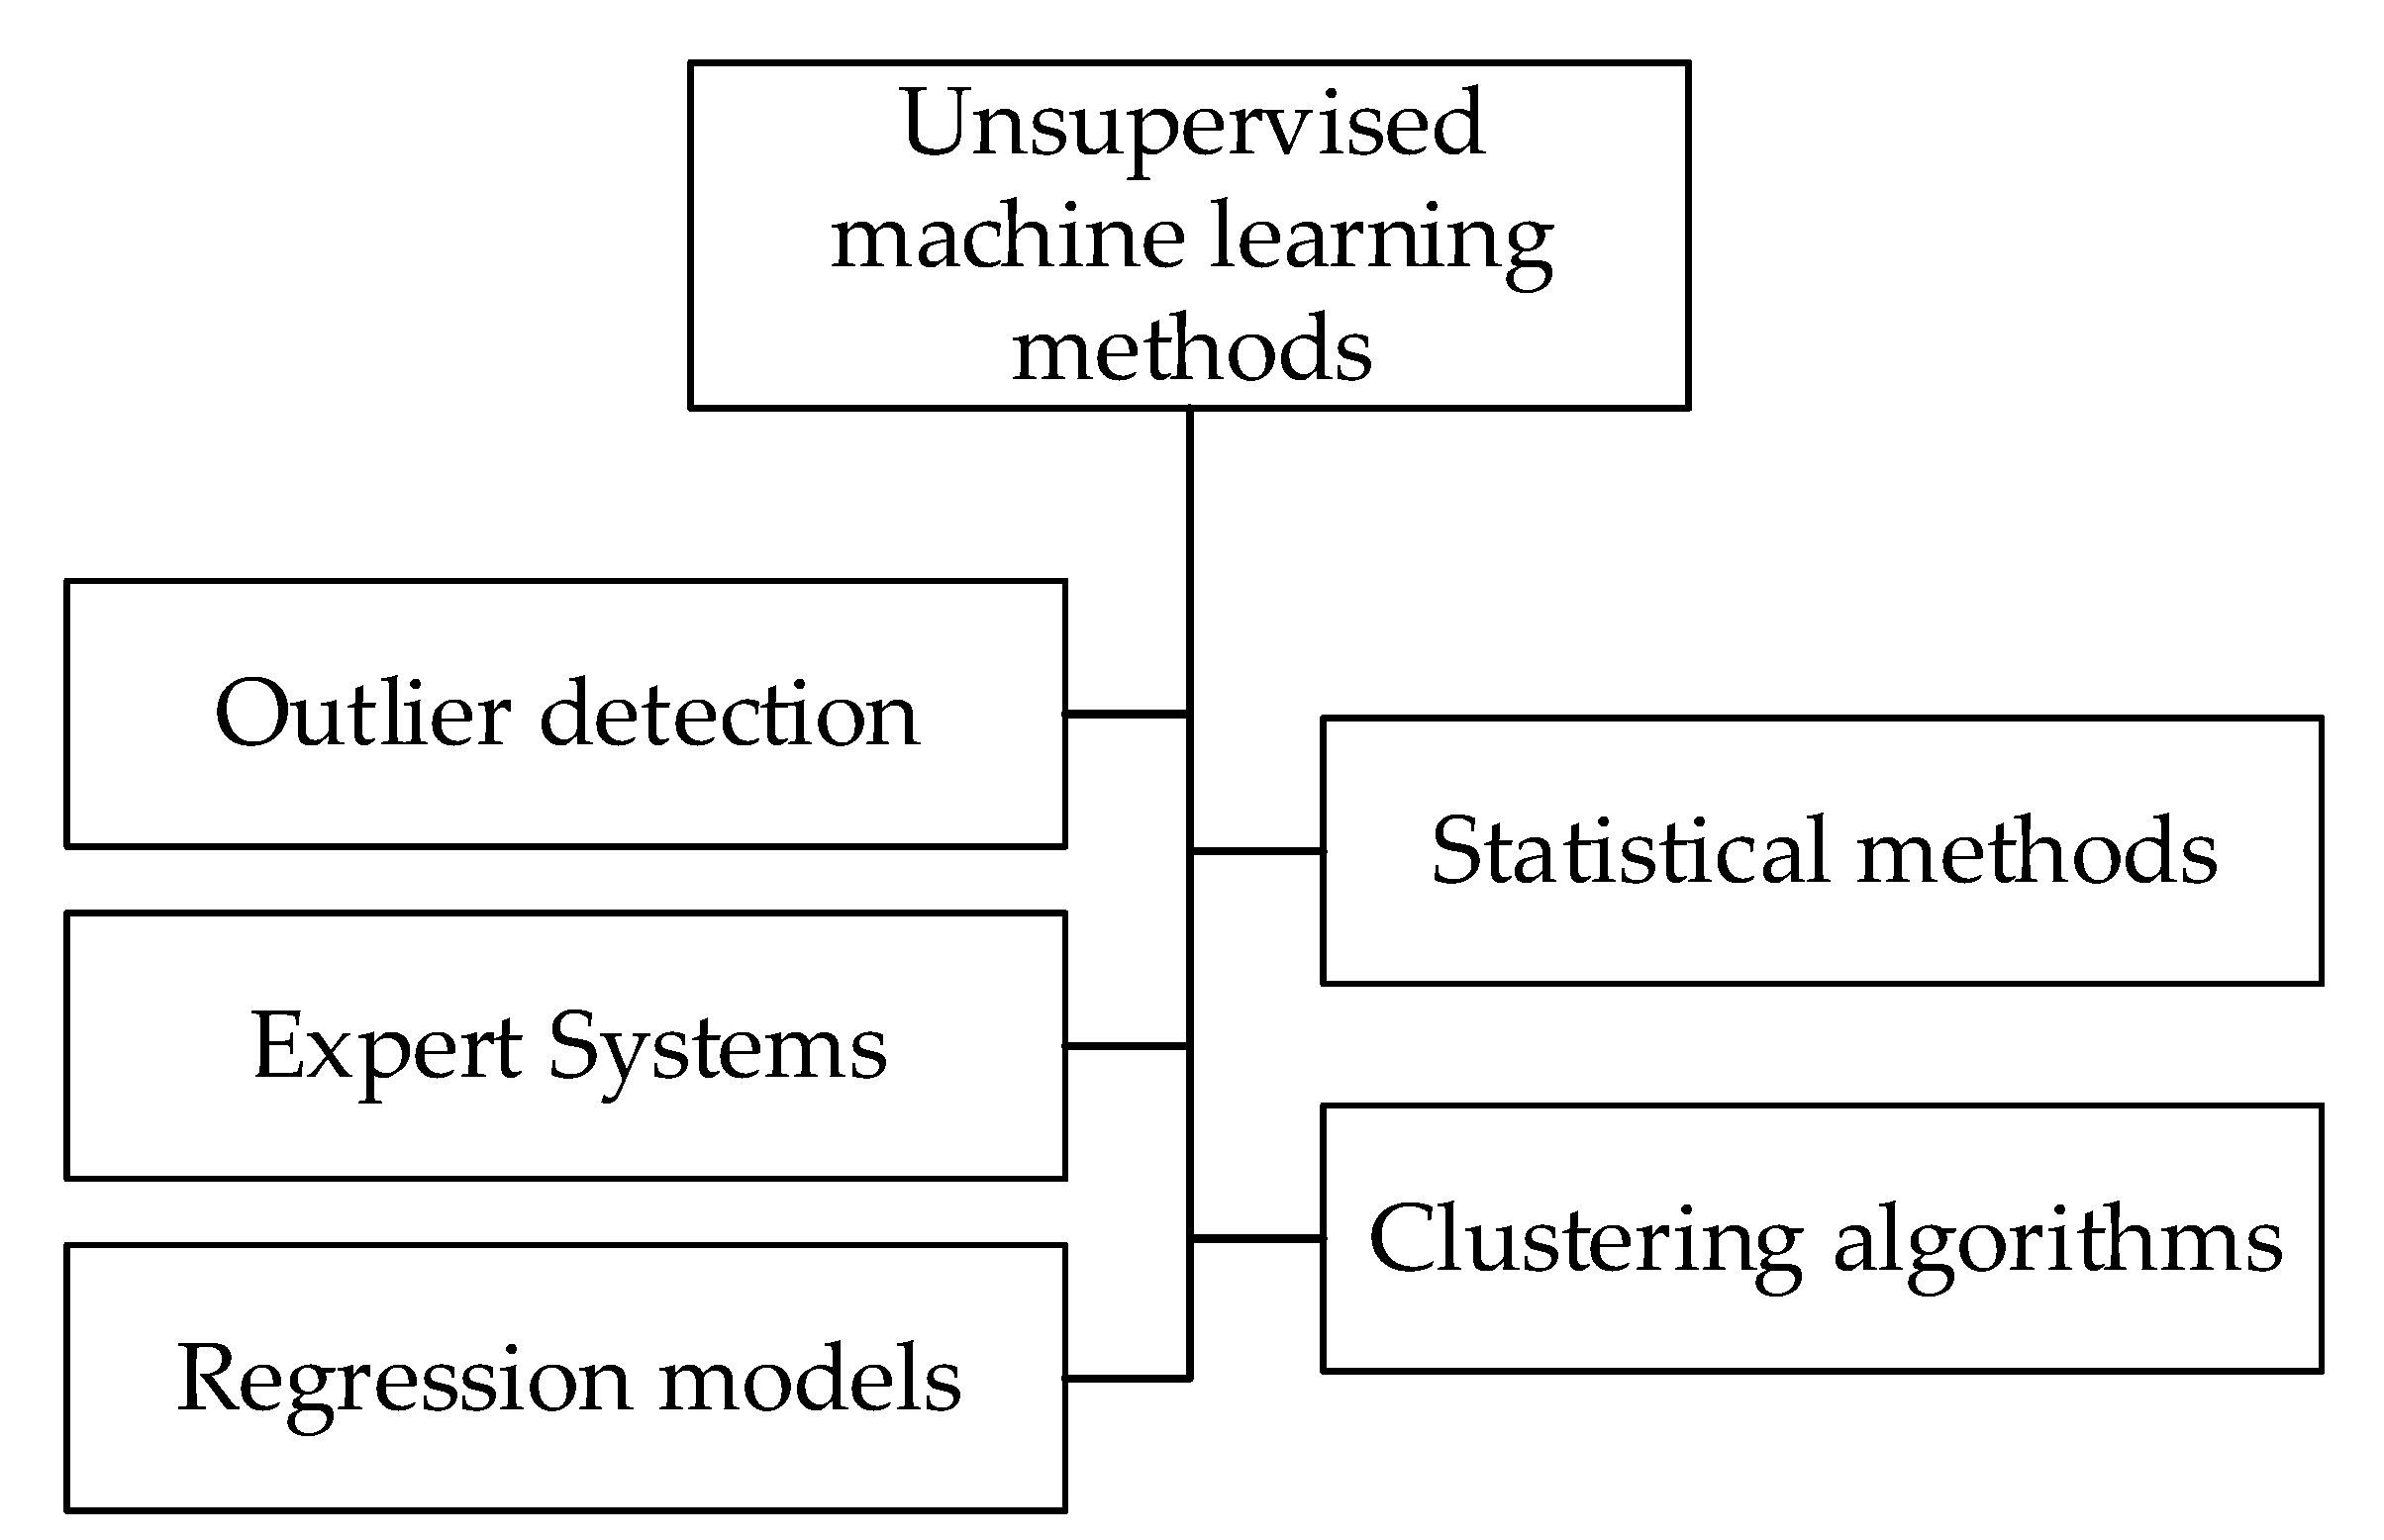