
Determination of Weights for the Integrated Energy System Assessment Index with Electrical Energy Substitution in the Dual Carbon Context


Abstract
:1. Introduction
- (1)
- Electrical energy substitution is introduced to the industrial-park-integrated energy system and a correlated indicators model for electrical energy substitution is established.
- (2)
- A target-criteria-indicator tri-level index system is established taking the five influential factors of economy, energy consumption, society, reliability and environmental protection into account comprehensively.
- (3)
- The G1 method of constructing a consistency matrix is used to calculate the weights of the established index systems. Case studies indicates that compared with the G1 method, the weight acquired via the proposed method is more genuine.
2. Integrated Energy System Evaluation Index
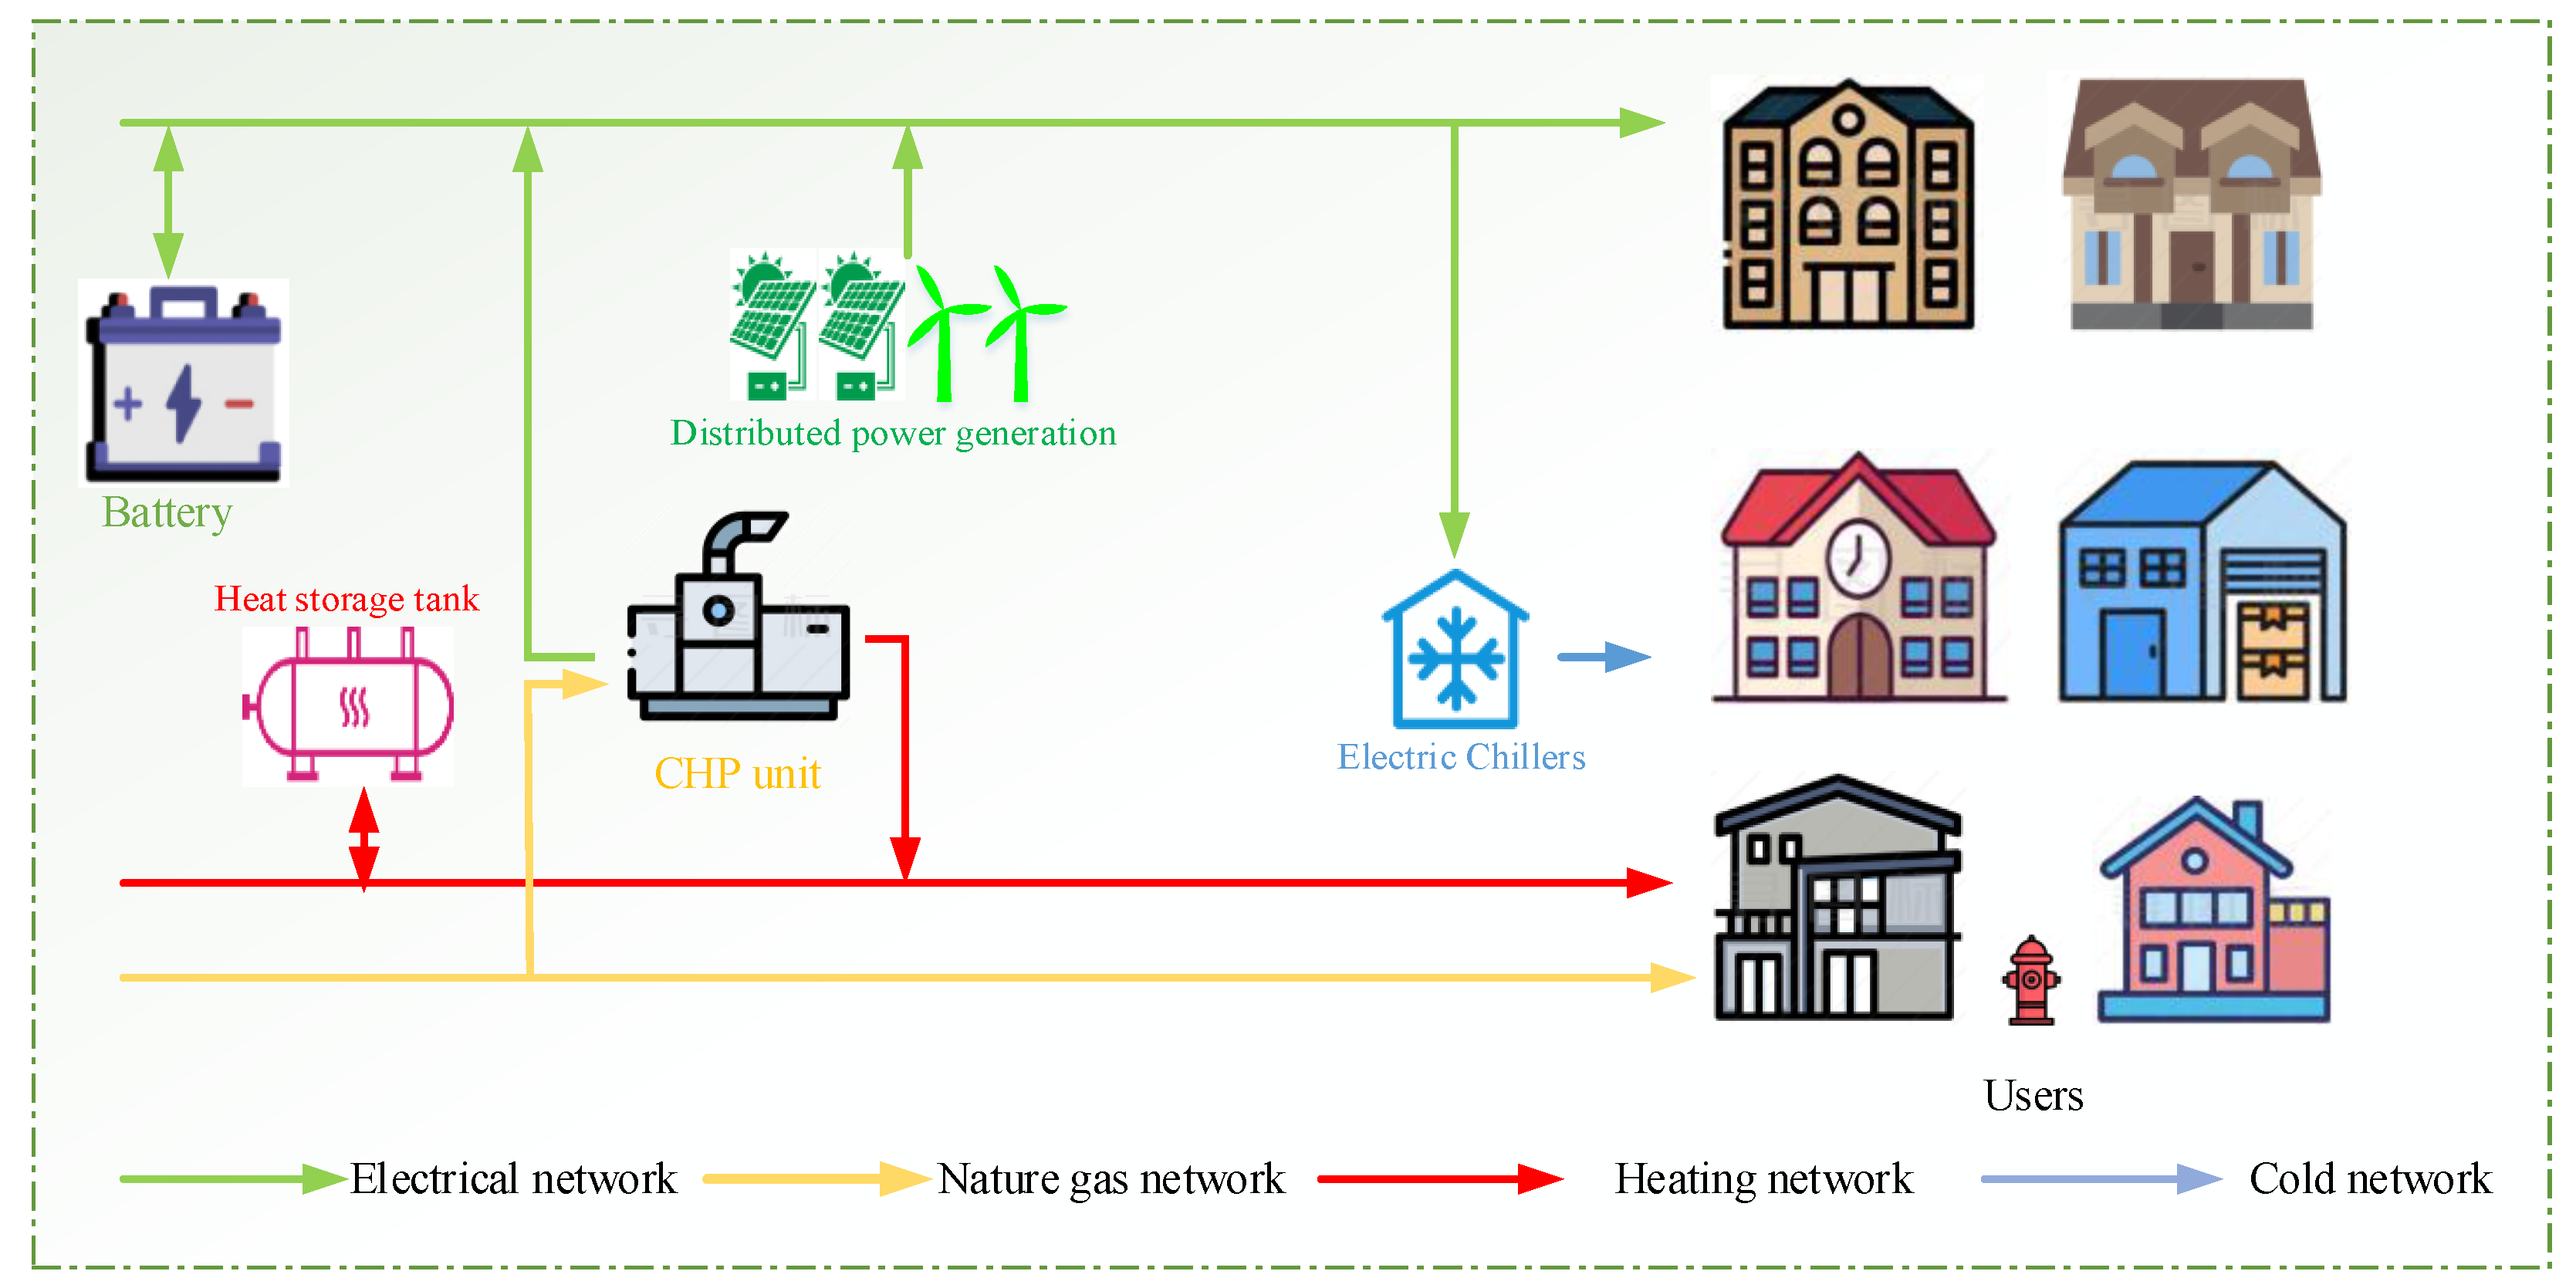
2.1. Integrated Energy System Structure
2.2. Quantitative Model of Evaluation Indicators
2.2.1. Electrical Energy Substitution Indicators
- (1)
- Comprehensive energy utilization rate [28]: the ratio of the total energy used by the system to the total energy supplied.where is the total system load, which is also the total energy used. is the sum of the energy input to the integrated energy system. is the electricity purchased from the grid. is the amount of natural gas consumed by natural gas equipment J. is the number of gas-fired equipment. is the conversion factor for natural gas. is the network loss rate of the main network. , , and are the electrical, natural gas, cold and thermal loads of the system, respectively. , and are the conversion factors of natural gas, cold and heat energy, respectively.
- (2)
- The proportion of clean energy supply [29]: this reflects the system’s ability to consume new energy generation. Increasing the proportion of clean energy supply has an important impact on reducing energy costs, alleviating the problem of wind power and photovoltaic power curtailment, and reducing environmental pollution.
- (3)
- The terminal electrical energy ratio [29]: there are various types of loads in the integrated energy system of the industrial park. As the application of electrical energy substitution equipment can be re-flected in the index of terminal energy proportion, the larger the index value, the higher the electrification level of the industrial park.where is the total system load, which is also the total energy used. , , and are the electrical, natural gas, cold and thermal loads of the system, respectively. , and are the conversion factors of natural gas, cold and heat energy, respectively.
- (4)
- Effective replacement power [29]: this is a visual reflection of the improvement of power consumption and optimization of the energy structure of the integrated energy system.where is the electricity replaced by the electrical energy substitution equipment in m. is the percentage of clean energy generation; M is the total number of electrical energy substitution equipment pieces.
2.2.2. Low-Carbon Indicators
- (1)
- Energy consumption per unit of GDP : this is the main indicator reflecting the level of energy consumption and the status of energy saving and consumption reduction.where is the consumption per unit of GDP, is the total primary energy consumption. Emissions of carbon dioxide will decrease as a result of lower primary energy consumption and lower energy consumption per unit of GDP.
- (2)
- Carbon dioxide emissions [23]: this is obtained by summing the estimated amount of CO2 emissions due to various energy consumptions.where is the molecular weight ratio of carbon dioxide to C. is the actual consumption of different energy sources after the conversion of the standard coal factor. is the carbon content per unit calorific value of different energy sources. is the heat content per unit of the corresponding energy source. is the carbon content share of different energy sources.
- (3)
- CCUS technology A: carbon dioxide emissions reduction per unit of power generation after adopting CCUS technology in the power system.where and are the carbon capture rate and utilization rate of CCUS technology, respectively, is the installed capacity of the generator set before replacement.
2.2.3. Technical Indicators
- (1)
- Relative energy saving rate [30]: this can reflect the energy consumption saved by the integrated energy system after the introduction of electrical energy substitution technology; the higher the relative energy saving rate, the better the result.where is the total energy consumption of the conventional integrated energy system. is the total energy consumption of the integrated energy system after the electrical energy substitution.
- (2)
- Energy storage allocation rate ε [30]: the total ratio of energy storage capacity connected to the grid to the total installed capacity of new energy.where is the energy storage capacity of the energy source in a; is the total installed capacity of photovoltaic power 26708.6.
- (3)
- Load point failure rate [31] is represented as follows:where is the number of outages caused by faults in the system at load point z per year, in units of times/year, is the time that load point z is under continuous operation, is the total number of outages at load point z.
- (4)
- Average annual power outage time [31] is represented as follows:where denotes the sum of the time in hours/year that load point z is out of service due to a failure of the original system, denotes the time that load point z is in a continuous state of outage.
- (5)
- Average power supply availability [31] is described as follows:where ASAI represents the ratio of the number of hours in the system in which the customer excludes outages per unit of time to the number of hours the customer needs to supply energy.
- (6)
- Expected value of system power shortage [31] is described by the following equation:where EENS is the amount of power supply per unit time in the system that the load does not receive after a customer outage due to a fault, the unit is kWh/year, represents the average load value of load point z.
2.2.4. Economic Indicators
- (1)
- Initial investment construction cost [29]: the initial investment refers to the initial construction equipment investment of the park:where is the number of energy conversion equipment units i. is the unit capacity investment cost of energy conversion equipment. is the number of energy storage equipment units. is the unit capacity investment cost of energy storage equipment j. is the configuration capacity of energy conversion equipment i. is the configuration capacity of energy storage equipment j.
- (2)
- Operation and maintenance cost [29]: the operation and maintenance cost include the energy consumption cost and equipment maintenance cost during the operation of the equipment.where is the operating cost of the system. is the maintenance cost of the system. is the annual duration of the equipment operation days. and are the unit prices of electricity and natural gas at time t, respectively. , and are the unit maintenance costs of electric, thermal and cold energy storage equipment, respectively. , and are the operating powers of electric, thermal and cold energy storage equipment, respectively. and are the unit maintenance cost and operating power of energy conversion device m, respectively.
- (3)
- Income index of unit energy supply [32]: the revenue per unit of energy supply is the ratio of the system revenue from the sale of electricity, heat and cooling to the system’s supply of electricity, heat and cooling energy to customers.where is the revenue from electricity sales. is the revenue from heat sales. is the revenue from cooling sales.
- (4)
- Investment payback period [30]: the payback period is the time required to make the accumulated economic benefits equal to the initial investment cost. The payback period is the number of years to recover the investment through the return flow of funds. In general, the shorter the payback period time, the more profitable the project will be.where m is the year when the cumulative net cash flow is zero or positive for the first time, F is cumulative net cash flow of last year and is net cash flow of the year. In practice, the construction time of electrical energy substitution projects is shorter and the use time is longer; currently, China’s electrical energy substitution projects are still in the development stage, and the benchmark payback period in the electric power industry is generally set to 10 years. If the payback period of a certain electrical energy substitution project is less than 10 years, the profit of the project is still good.
3. Indicator Weight Calculation Method
3.1. G1 Method
- (1)
- Determine the order relationship of indicators.
- (2)
- The importance of adjacent indicators is assigned.
- (3)
- Calculate the weights of the indicator set.
3.2. G1 Method for Constructing the Consistency Matrix
4. Main Results: Case Study
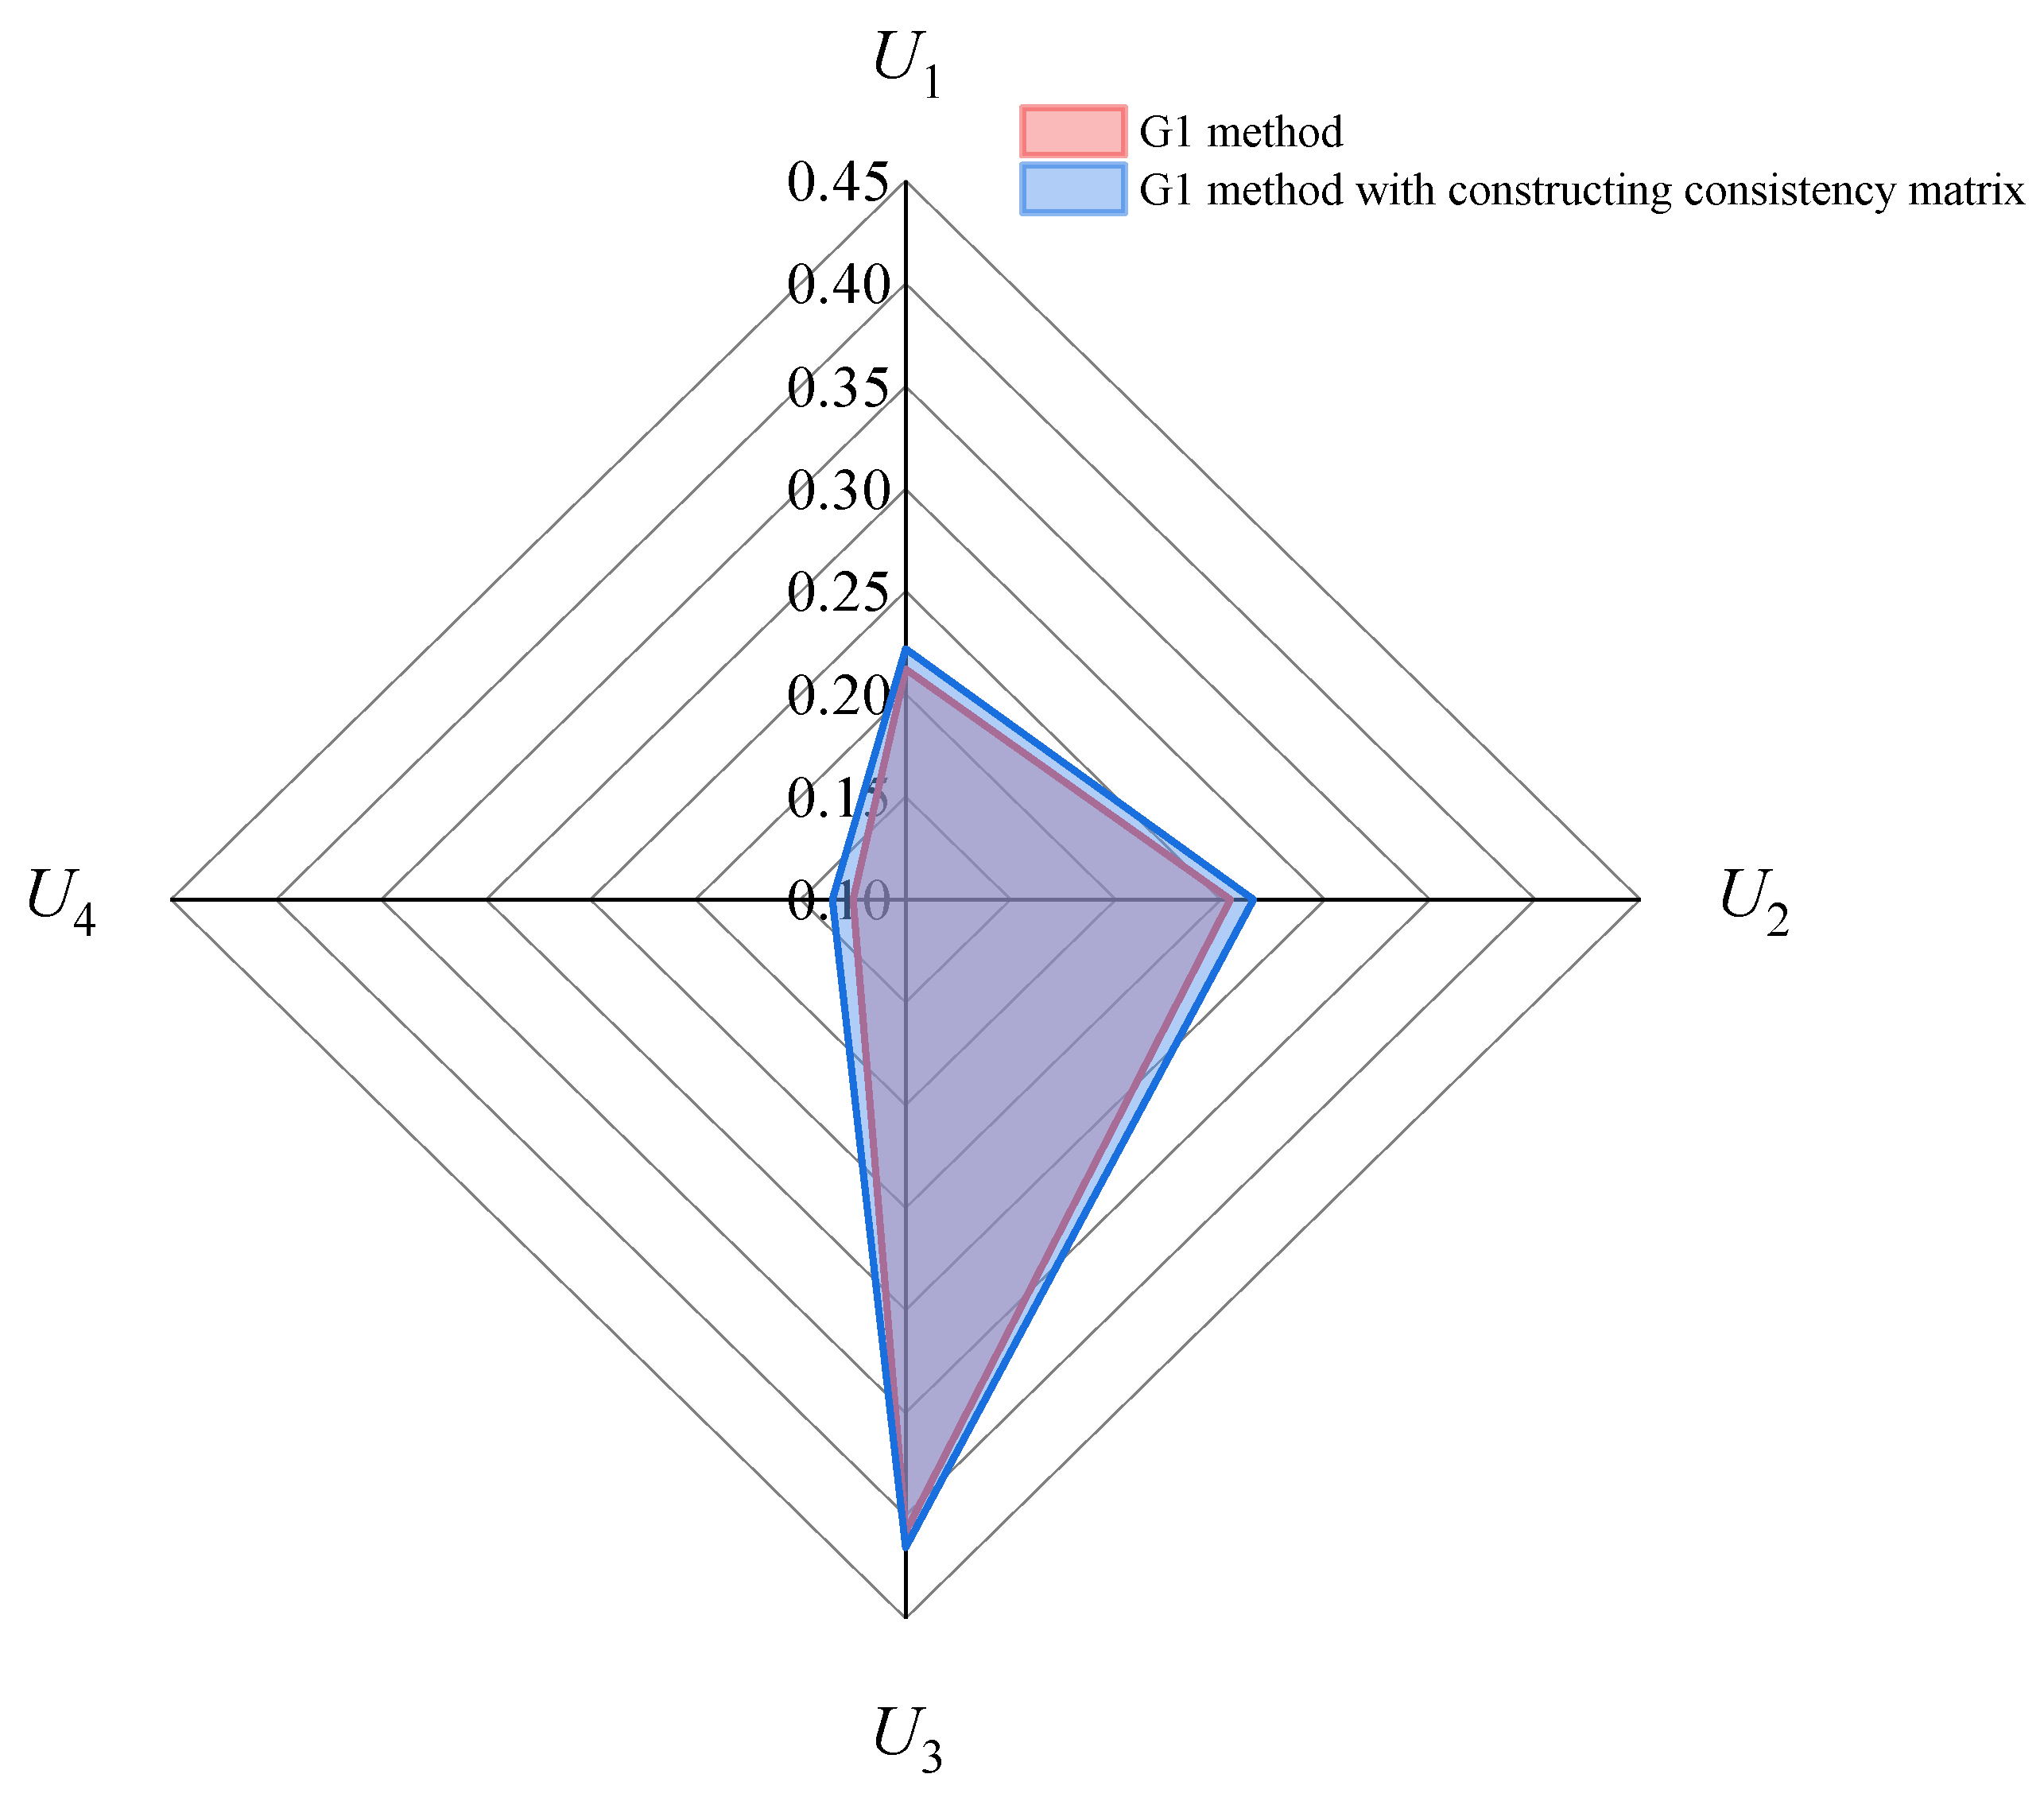
4.1. Index Weights Determined by the G1 Method for Constructing a Consistency Matrix
- (1)
- Secondary indicator
- (2)
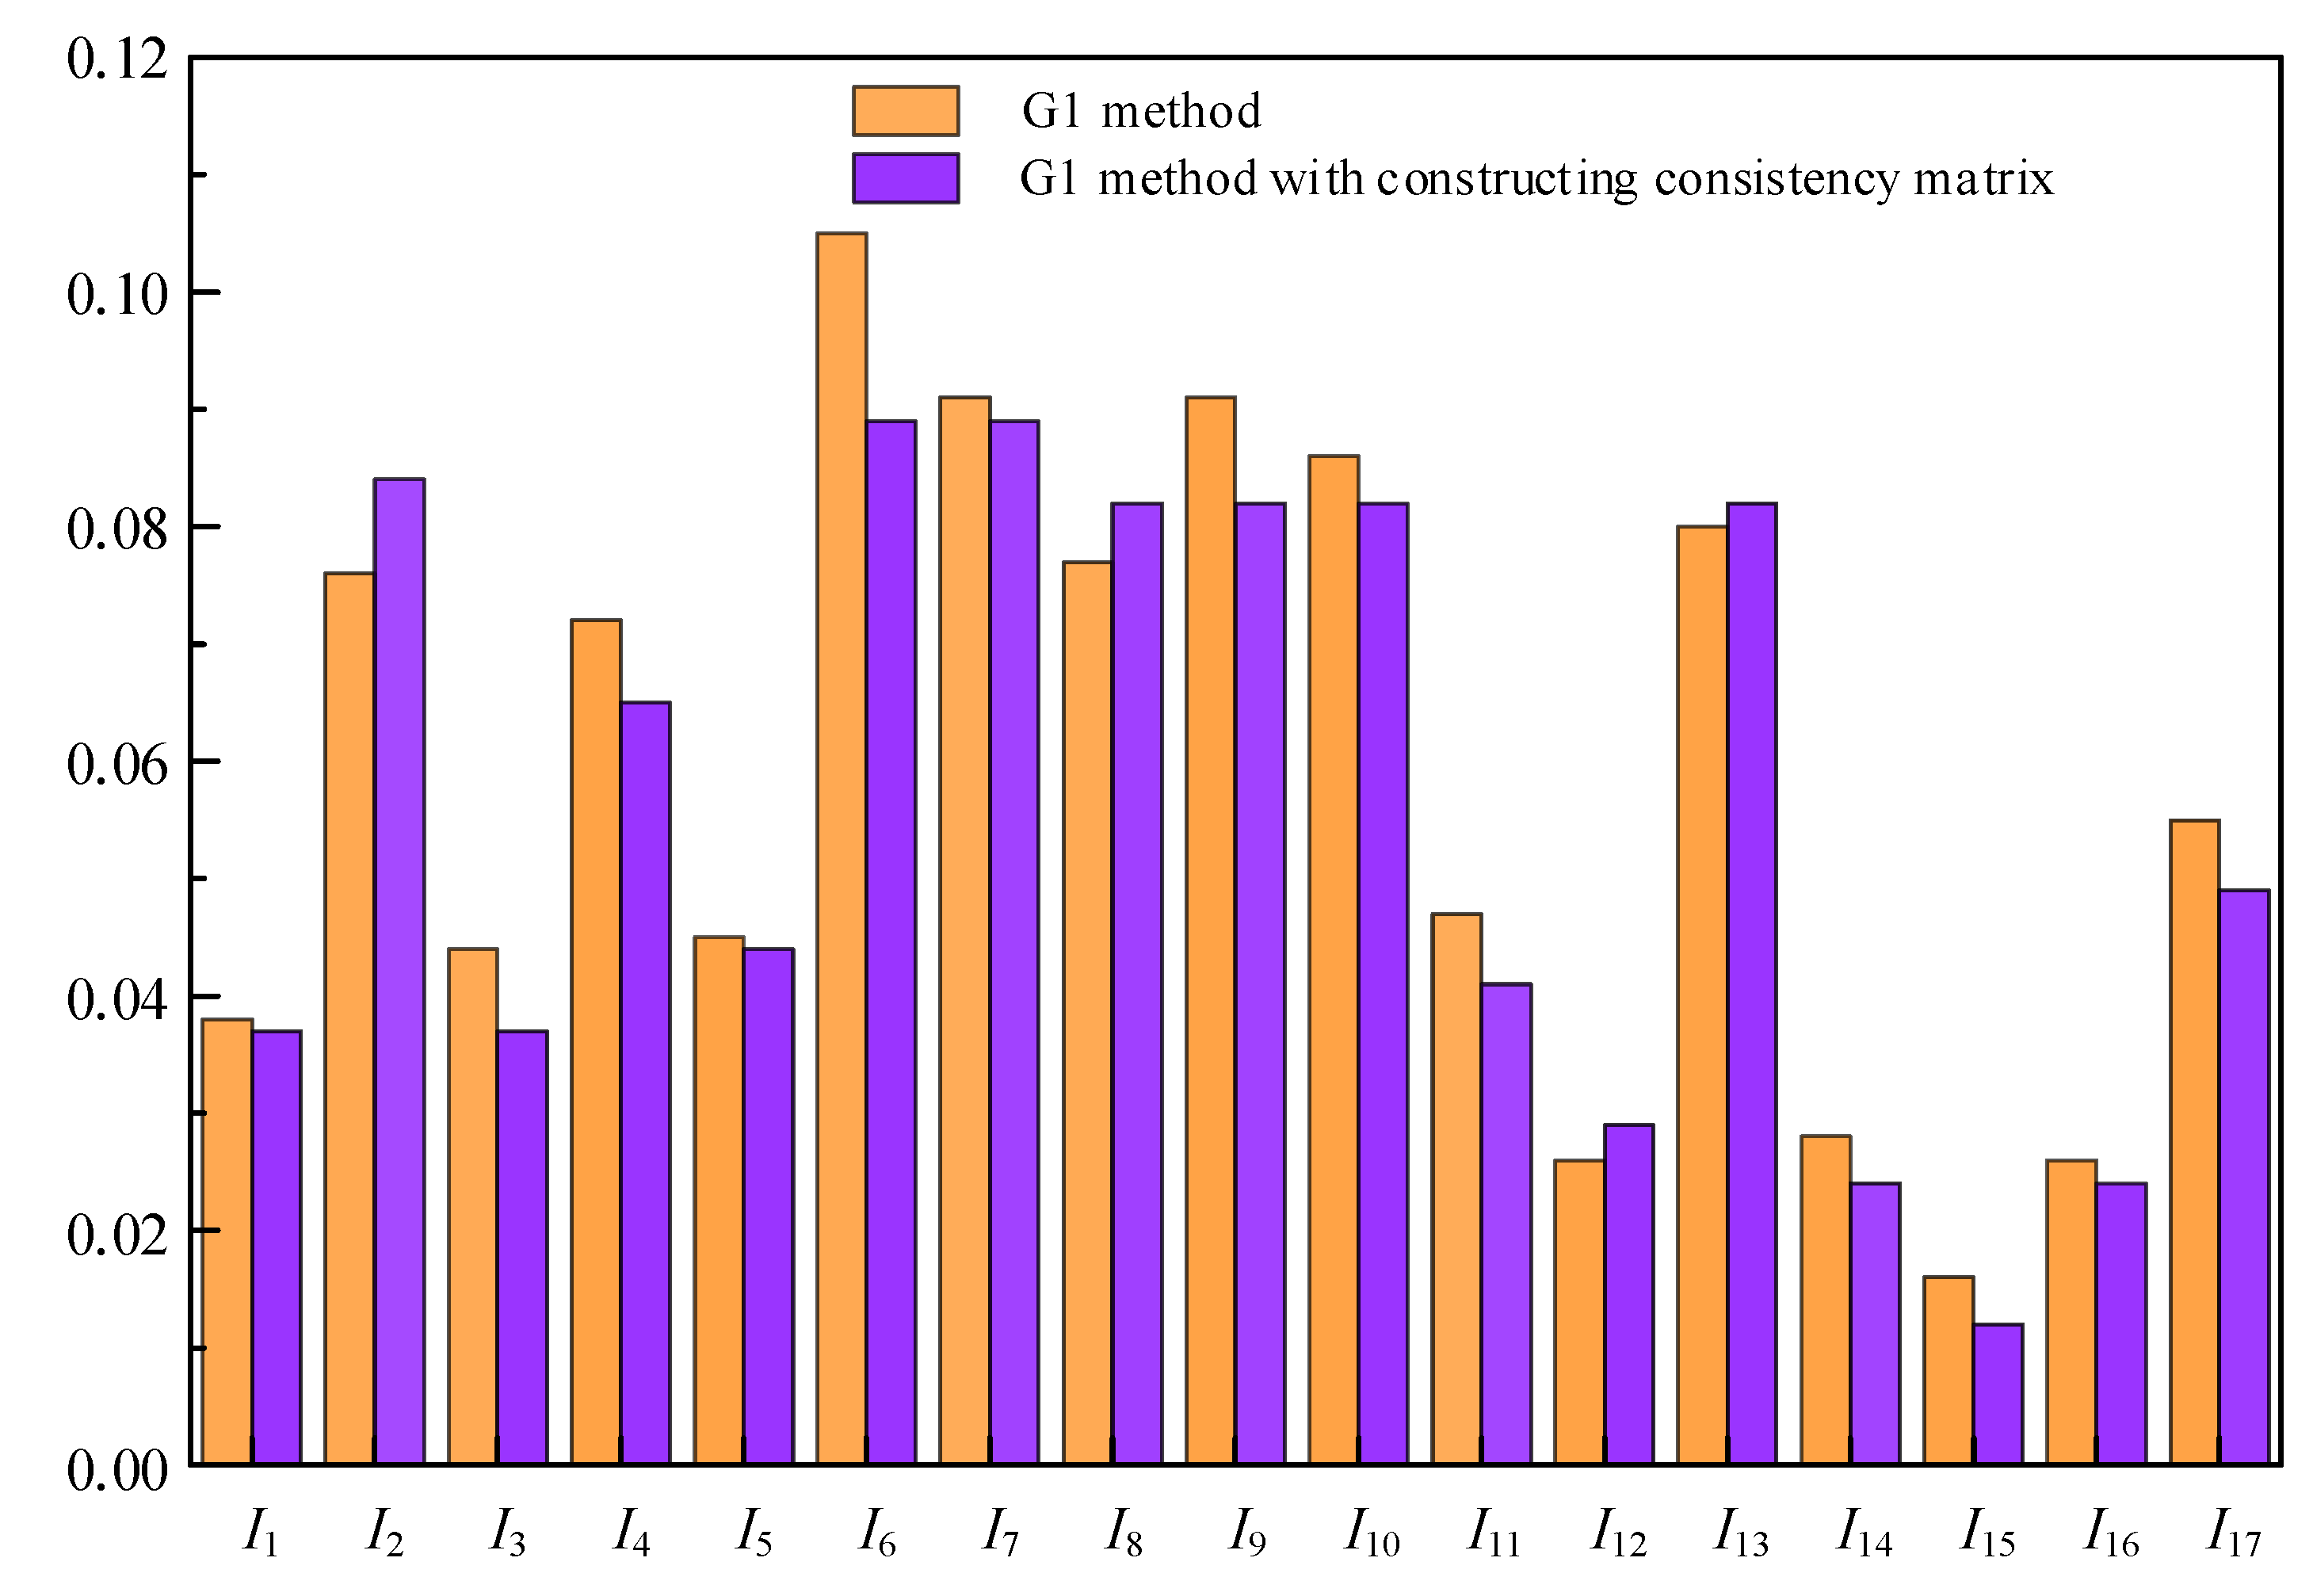
- Three-level indicator
4.2. Comparison of Calculation Results for Both Methods
5. Conclusions
- (1)
- Compared with the G1 method, the weight of each index in the proposed index system determined by the G1 method and a constructed consistency matrix is more reasonable and more consistent with reality. Moreover, the proposed method is convenient and fast to determine the weight coefficients of indexes.
- (2)
- On the basis of ensuring reliability, IESs should build a green consumption model with clean energy on the source side and electrical energy on the user side, promote the implementation of an electrical energy substitution strategy and CCUS technology to reduce carbon dioxide emissions, and realize the configuration and optimization of different types of energy through technical performance to improve energy utilization.
Author Contributions
Funding
Data Availability Statement
Conflicts of Interest
References
- Niu, D.X.; Song, Z.Y.; Xiao, X.L. Electric power substitution for coal in China: Status quo and SWOT analysis. Renew. Sustain. Energy Rev. 2017, 70, 610–622. [Google Scholar] [CrossRef]
- Pan, L.Y.; Zhou, K.; Li, W.Q.; Yang, F.Y.; Li, Z. Subsidy policy discussion on the hydroelectric power substitution for scattered coal consumption: A case study of Sichuan Province. Renew. Sustain. Energy Rev. 2019, 108, 539–549. [Google Scholar]
- Liu, K.; Wang, Q.; Luo, Z.; Zhao, X.; Su, S.; Zhang, X. Planning Mechanism Design and Benefit Analysis of Electrical energy Substitution: A Case Study of Tobacco Industry in Yunnan Province, China. IEEE Access 2020, 8, 12883. [Google Scholar]
- Kachirayil, F.; Weinand, J.M.; Scheller, F.; McKenna, R. Reviewing local and integrated energy system models: Insights into flexibility and robustness challenges. Appl. Energy 2022, 324, 119666. [Google Scholar] [CrossRef]
- Li, P.; Wang, Z.; Liu, H.; Wang, J.; Guo, T.; Yin, Y. Bi-level optimal configuration strategy of community integrated energy system with coordinated planning and operation. Energy 2021, 236, 121539. [Google Scholar] [CrossRef]
- Xu, Y.; Song, Y.; Deng, Y.; Liu, Z.; Guo, X.; Zhao, D. Low-carbon economic dispatch of integrated energy system considering the uncertainty of energy efficiency. Energy Rep. 2023, 9, 1003–1010. [Google Scholar] [CrossRef]
- Yu, C.; Lai, X.; Chen, F.; Jiang, C.; Sun, Y.; Zhang, L.; Wen, F.; Qi, D. Multi-Time Period Optimal Dispatch Strategy for Integrated Energy System Considering Renewable Energy Generation Accommodation. Energies 2022, 15, 4329. [Google Scholar] [CrossRef]
- Mancarella, P. MES (multi-energy systems): An overview of concepts and evaluation models. Energy 2014, 65, 1–17. [Google Scholar] [CrossRef]
- Berjawi, A.; Walker, S.; Patsios, C.; Hosseini, S. An evaluation framework for future integrated energy systems: A whole energy systems approach. Renew. Sustain. Energy Rev. 2021, 145, 111163. [Google Scholar] [CrossRef]
- Ren, H.; Gao, W.; Zhou, W.; Nakagami, K.I. Multi-criteria evaluation for the optimal adoption of distributed residential energy systems in Japan. Energy Policy 2009, 37, 5484–5493. [Google Scholar] [CrossRef]
- Gu, Q.; Ren, H.; Gao, W.; Ren, J. Integrated assessment of combined cooling heating and power systems under different design and management options for residential buildings in shanghai. Energy Build. 2012, 51, 143–152. [Google Scholar] [CrossRef]
- Zhang, T.; Zhu, T.; Gao, N.; Wu, Z. Optimization Design and Multi-criteria Comprehensive Evaluation Method of Combined Cooling Heating and Power System. Proc. Chin. Soc. Electr. Eng. 2015, 35, 3706–3713. [Google Scholar]
- Lin, D.; Liang, S.; Houhe, C. Multi-index evaluation of integrated energy system with P2G planning. Electr. Power Autom. Equip. 2017, 37, 110–116. [Google Scholar]
- Yang, K.; Ding, Y.; Zhu, N.; Yang, F.; Wang, Q. Multi-criteria integrated evaluation of distributed energy system for community energy planning based on improved grey incidence approach: A case study in Tianjin. Appl. Energy 2018, 229, 352–363. [Google Scholar] [CrossRef]
- Yubin, H.; Yining, Z.; Guang, M. Multiindex evaluation for integrated energy system operation connecting transmission and distribution levels. Electr. Power Autom. Equip. 2019, 39, 120–127. [Google Scholar]
- Guo, Z.; Zhang, R.; Wang, L.; Zeng, S.; Li, Y. Optimal operation of regional integrated energy system considering demand response. Appl. Therm. Eng. 2021, 191, 116860. [Google Scholar] [CrossRef]
- Ke, Y.; Liu, J.; Meng, J.; Fang, S.; Zhuang, S. Comprehensive evaluation for plan selection of urban integrated energy systems: A novel multi-criteria decision-making framework. Sustain. Cities Soc. 2022, 81, 103837. [Google Scholar] [CrossRef]
- Cao, J.; He, B.; Qu, N.; Zhang, J.; Liu, C.; Liu, Y.; Chen, C.-L. Benefits Evaluation Method of an Integrated Energy System Based on a Fuzzy Comprehensive Evaluation Method. Symmetry 2023, 15, 84. [Google Scholar] [CrossRef]
- Zhao, L.; Sun, D.; Liu, D.; Shi, B.; Feng, L.; Liu, R. Evaluation index system and evaluation method for multi-energy systems. In Energy Revolution and Chemical Research; CRC Press: Boca Raton, FL, USA, 2023. [Google Scholar]
- Liu, T.; Jiao, W.; Ren, L.; Tian, X. Research on Evaluation Index System of District Energy Systems. In Proceedings of the 11th International Symposium on Heating, Ventilation and Air Conditioning (ISHVAC 2019) Volume III: Buildings and Energy 11, 2020; Springer: Berlin/Heidelberg, Germany, 2020; pp. 1533–1542. [Google Scholar]
- Yuan, J.; Li, Y.; Luo, X.; Zhang, Z.; Ruan, Y.; Zhou, Q. A new hybrid multi-criteria decision-making approach for developing integrated energy systems in industrial parks. J. Clean. Prod. 2020, 270, 122119. [Google Scholar] [CrossRef]
- Li, Y.; Zeng, C. Evaluation Index System and Evaluation Method of China's Regional Potential for Electrical Energy Substitution. Math. Probl. Eng. 2018, 2018 Pt 8, 3834921.1–3834921.16. [Google Scholar] [CrossRef]
- Bai, M.; Ye, X.; Kang, T. Evaluation Index System and Evaluation Method of Integrated Energy System on User Side. In 2021 IEEE International Conference on Power, Intelligent Computing and Systems (ICPICS), 2021; IEEE: Piscataway, NJ, USA, 2021; pp. 360–364. [Google Scholar]
- Sheng, S.; Zhang, J.; Xiang, T. Comprehensive Evaluation Index System and Improvement Method for Integrated Energy System. In 2021 IEEE 5th Conference on Energy Internet and Energy System Integration (EI2), 2021; IEEE: Piscataway, NJ, USA, 2021; pp. 214–219. [Google Scholar]
- Jun, L.I.; Ji-guang, L.I.; Jian-gang, Y.A.O.; Tang-bing, L.I. Application of Attribute Recognition and Gl-Entropy Method in Evaluation of Power Quality. Power Syst. Technol. 2009, 33, 56–61. [Google Scholar]
- Wang, J.; Pang, W.; Wang, L.; Pang, X.; Yokoyama, R. Synthetic Evaluation of Steady-state Power Quality Based on Combination Weighting and Principal Component Projection Method. CSEE J. Power Energy Syst. 2017, 3, 160–166. [Google Scholar] [CrossRef]
- Zhu, J.; Dong, H.; Zheng, W.; Li, S.; Huang, Y.; Xi, L. Review and prospect of data-driven techniques for load forecasting in integrated energy systems. Appl. Energy 2022, 321, 119269. [Google Scholar] [CrossRef]
- Muke, B.; Wei, T.; Bangxu, W. Evaluation indexes of user side integrated energy system and its application. Distrib. Energy Resour. 2018, 3, 41–46. [Google Scholar]
- Liu, J.; Yuan, K.; Xu, Y.; Song, Y.; Sun, C.; Jin, X.; Hu, D. Research on comprehensive assessment system of park integrated energy system. In 2019 IEEE Innovative Smart Grid Technologies-Asia (ISGT Asia), 2019; IEEE: Piscataway, NJ, USA, 2019; pp. 1503–1508. [Google Scholar]
- Wang, J.Y.; Cheng, X. Construction of power grid evaluation and diagnosis index system under the goal of “double carbon”. China Electr. Power Enterp. Manag. J. 2021, 33, 78–79. [Google Scholar]
- Zhou, Y.; He, C. A Review on Reliability of Integrated Electricity-Natural gas System. Energies 2022, 15, 6815. [Google Scholar] [CrossRef]
- Available online: https://oversea.cnki.net/KCMS/detail/detail.aspx?dbcode=CJFD&dbname=CJFDLAST2021&filename=XXJK202112042&uniplatform=OVERSEA&v=mkzn4G1DToE3NxgqUMOC7cOAdt1TEmqtsAujLWnR-KkH0l-eUZNmek051Gn1xbB1 (accessed on 3 August 2022).


| Ref. | Year | Evaluation Index | Weight Calculation Method | Method Strength |
|---|---|---|---|---|
| [10] | 2009 | economic, energetic, environmental | AHP and PROMETHEE | different evaluation methods may give different results |
| [11] | 2012 | energy, economic, environmental and integrated | - | a wise practice |
| [12] | 2015 | economic, energy consumption, environment | information entropy and expert assessment | objective and practical |
| [13] | 2017 | reliable energy supply, natural gas accommodation, peak-cutting and valley-filling, renewable overcapacity | - | - |
| [14] | 2018 | technology, economy, environment, society | rank correlation analysis and entropy information | simple and practical |
| [15] | 2019 | economic, reliability, renewable accommodation, environmental | Mixed Scatter-Monte Carlo sampling | high evaluation efficiency and effectively identify weaknesses in IES |
| [16] | 2021 | economic, load peak valley ratio, carbon emission | AHP and PROMETHEE | - |
| [17] | 2022 | economy, environmental protection, energy efficiency, reliability, technology | integrated the Best–worst Method and the CRITIC | excellent robustness and effective |
| [18] | 2023 | technology, economy, environment, society | TFN and AHP | intuitive and consistent with reality, and high data information utilization rate |
| Explanation | |
|---|---|
| 1.0 | Indicator has the same importance as indicator |
| 1.1 | Indicator and are between equally important and marginally important |
| 1.2 | Indicator is slightly more important than indicator |
| 1.3 | Indicator and are between slightly important and relatively important |
| 1.4 | Indicator is very important compared to indicator |
| 1.5 | Indicator and are between relatively important and very important |
| 1.6 | Indicator is more important than indicator |
| 1.7 | Indicator is extremely important compared to indicator |
| 1.8 | Indicator and are between more important and extremely important |
| Indicator | Nomenclature | |
|---|---|---|
| Secondary indicator | Electricity substitution indicators | |
| Low-Carbon Indicators | ||
| Technical Indicators | ||
| Economic Indicators | ||
| Three-level indicator | Comprehensive energy utilization rate | |
| The proportion of clean energy supply | ||
| The terminal electrical energy ratio | ||
| Effective replacement power | ||
| Energy consumption per unit of GDP | ||
| Carbon dioxide emissions | ||
| CCUS technology | ||
| Relative energy saving rate | ||
| Energy storage allocation rate | ||
| Load point failure rate | ||
| Average annual power outage time | ||
| Average power supply availability | ||
| Expected value of system power shortage | ||
| Initial investment construction cost | ||
| Operation and maintenance cost | ||
| Income index of unit energy supply | ||
| Investment payback period | ||
Disclaimer/Publisher’s Note: The statements, opinions and data contained in all publications are solely those of the individual author(s) and contributor(s) and not of MDPI and/or the editor(s). MDPI and/or the editor(s) disclaim responsibility for any injury to people or property resulting from any ideas, methods, instructions or products referred to in the content. |
© 2023 by the authors. Licensee MDPI, Basel, Switzerland. This article is an open access article distributed under the terms and conditions of the Creative Commons Attribution (CC BY) license (https://creativecommons.org/licenses/by/4.0/).
Share and Cite
Zhao, Y.; Lv, X.; Shen, X.; Wang, G.; Li, Z.; Yu, P.; Luo, Z. Determination of Weights for the Integrated Energy System Assessment Index with Electrical Energy Substitution in the Dual Carbon Context. Energies 2023, 16, 2039. https://doi.org/10.3390/en16042039
Zhao Y, Lv X, Shen X, Wang G, Li Z, Yu P, Luo Z. Determination of Weights for the Integrated Energy System Assessment Index with Electrical Energy Substitution in the Dual Carbon Context. Energies. 2023; 16(4):2039. https://doi.org/10.3390/en16042039
Chicago/Turabian StyleZhao, Yitao, Xin Lv, Xin Shen, Gang Wang, Zhao Li, Pinqin Yu, and Zhao Luo. 2023. "Determination of Weights for the Integrated Energy System Assessment Index with Electrical Energy Substitution in the Dual Carbon Context" Energies 16, no. 4: 2039. https://doi.org/10.3390/en16042039
APA StyleZhao, Y., Lv, X., Shen, X., Wang, G., Li, Z., Yu, P., & Luo, Z. (2023). Determination of Weights for the Integrated Energy System Assessment Index with Electrical Energy Substitution in the Dual Carbon Context. Energies, 16(4), 2039. https://doi.org/10.3390/en16042039