Article

The Mechanical Characteristics of the Neck Zone for a PEMFC Stack

1
School of Automotive Engineering, Wuhan University of Technology, Wuhan 430070, China
2
State Key Laboratory of Advanced Technology for Materials Synthesis and Processing, Wuhan University of Technology, Wuhan 430070, China
*
Authors to whom correspondence should be addressed.
Energies 2023, 16(4), 2038; https://doi.org/10.3390/en16042038
Submission received: 16 December 2022 / Revised: 24 January 2023 / Accepted: 14 February 2023 / Published: 18 February 2023
(This article belongs to the Special Issue Energy Storage and Fuel Cell Systems Research and Development)

Abstract

:
Generally, the unit cell in a proton exchange membrane fuel cell (PEMFC) stack is divided into different zones according to the characteristics of the bipolar plate. There is a zone that has been neglected, which we define as the “neck zone” for the first time in this work. Uneven stress and deformation are prone to appearing in the neck zone due to its unique structure. A three-dimensional finite element model was applied to study the influence of the membrane electrode assembly (MEA) frame materials on the mechanical characteristics of the neck zone. In addition, the sealing and the water–gas transport performances of the neck zone were evaluated via the stress fluctuation and deformation. It was found that even with the commercial polyethylene naphthalate (PEN) frame, a leak point would be generated at the region with the lowest stress, reducing the performance and even causing safety hazards. The invasion rate was proposed to assess the water–gas transport ability. When an inappropriate frame material was adopted, the invasion rate went up to 32.4%, severely hindering the water and the air transport. It was concluded that MEA frames with a higher elastic modulus and thickness are preferred for the neck zone to obtain a high property of sealing and water–gas transport.

1. Introduction

A fuel cell is a popular energy conversion device as it is environmentally friendly and highly efficient [1]. At present, the development of fuel cells still faces many technical problems restricting their commercialization, including life, cost, and performance issues [2]. The unit cell of a proton exchange membrane fuel cell (PEMFC) stack is mainly composed of the membrane electrode assembly (MEA) and the bipolar plate. Both the bipolar plate and the MEA are key components that can improve the performance and life of the stack [3]. According to the structural characteristics of the bipolar plate, a unit cell is generally divided into inlet and outlet zones, distribution zones, and reaction zones, as shown in Figure 1 [4]. However, there is a special zone that has always been neglected. It connects the inlet or the outlet zone with the distribution zone. The uniqueness of this zone lies in the structural characteristics of the bridge pier supporting the bridge deck (Figure 1b), which easily exhibits uneven stress and deformation, resulting in sealing and water–gas transport problems. In this paper, we define the unique area as the “neck zone” for the first time (Figure 1). The local enlarged detail of the neck zone and its cross-section along the A-A direction are shown in Figure 1b. It is composed of the gasket, the MEA frame, and the bipolar plate. The MEA frame is located between the bipolar plate and the gasket, which is the core component of the neck zone. The back part of the bipolar plate acts as the bridge pier to support the MEA frame (bridge deck). The flow channel transports the gas and the water (coolant). On the one hand, the structural characteristics of the bridge pier supporting the bridge deck in the neck zone might cause deformation of the frame and uneven force on the sealing structure, along with a significant change in the contact pressure. Low contact pressure would cause seal failure, such as gas leakage or the fusion of fuel and oxidant, reducing cell performance and even causing safety hazards. High contact pressure could damage the gasket or other components [5], producing the same risk as the former situation. On the other hand, the frame deformation of the neck zone appears to invade the flow channel, leading to a decrease in the flow area and higher transport resistance [4]. Therefore, it is of great significance to study the mechanical characteristics of the bipolar plate neck zone of a PEMFC stack.
A large number of studies have been conducted on mechanical problems in PEMFC stacks, including on gaskets [6,7,8,9], MEA frames [9,10], active regions of the bipolar plate [11,12,13,14], and other components [15]. Lee et al. [16] established a 3D linear elastic mechanical model. The finite element analysis results showed that the contact pressure on the gas flow channel in the reaction zone varied greatly between 0.6 and 8.7 MPa under different clamping force values. In order to verify the analysis results, the stress distribution between the bipolar plate and the MEA was obtained by using the pressure film, which was almost consistent with the calculation results from the finite element model. A simplified two-dimensional fuel cell model was established and applied to numerically simulate the related stress and strain distribution during the processes of assembly, operation, and air intake. It was found that severe stress concentration and bending deformation occurred in the junction site between the MEA frame and GDL, which led to a rapid increase in the in-plane stress and plastic deformation when the gas pressure difference exceeded 10 kPa [13]. The finite element model was also applied by Ye et al. [10] to study the stress distribution of the MEA frame under uniform load, and the influence of different frame materials and structures on the mechanical stress in the assembly process was analyzed. The study aimed to reveal and solve the assembly problem, especially the stress concentration problem at the frame edge. Their results showed that the stress concentration on the membrane is smaller when the MEA frame material properties are similar to those of a proton exchange membrane (PEM). Liang et al. [9] conducted a finite element simulation on the assembly process and start-up process of a PEMFC. The transparent single cell was clamped with an MTS machine with special compression displacement. The finite element model was experimentally verified by observation and measurement of the gasket sliding with a high-definition camera. It was concluded that the material properties and geometrical parameters of the sealing elements have a great influence on the sealing structure’s failure. Accordingly, the slip angle and distance of the rigid gasket increased. The thicker the MEA frame and the greater the elastic modulus, the easier it is to prevent seal failure. However, when studying the mechanical properties of each component, researchers have simplified the structure of the bipolar plate. The mechanical properties of the composite structure composed of a gasket, MEA frame, and bipolar plate in the neck zone have not attracted enough attention.
According to the patents and the PEMFC products published by Toyota, General Motors, and other fuel cell companies, such as the second-generation fuel cell vehicle Mirai, there is also a neck zone [17,18,19]. Based on the different intake structures, the neck zone is divided into different types, as shown in Figure 2: the direct intake type (Figure 2a) [18], the flip intake type (Figure 2b) [19], and the integrated frame intake type (Figure 2c) [20]. The above three intake structures are in the form of bridges, and the bridge deck is supported by the structure of the bridge pier. The structure of the flip intake type is too complex (Figure 2b) to result in gas turnover during the actual intake gas process, and the water–gas transport resistance is greater than that of the other two structures. The neck zone of the second-generation Mirai adopts the integrated frame intake type (Figure 2c), in which the MEA frame acts as a “bridge pier”. In the actual assembly process, high accuracy of assembly conditions is required to avoid the collapse of the bipolar plate into the flow channel and the water–gas blocking and sealing problem. The direct intake type is the most common structure of these kinds of neck zones but with more complex mechanical characteristics. Therefore, the direct air intake type is chosen as the object of study in this work.
In this paper, we first define the concept of the neck zone in the bipolar plate. Combined with the actual working condition and structural parameters of a PEMFC, the finite element model of the neck zone for a PEMFC is established. The influence of the MEA frame material and thickness on the mechanical characteristics of the neck zone is studied with a three-dimensional finite element model. According to the stress distribution and deformation, the sealing performance and the water–gas transport performance of the neck zone are analyzed, which guides the design and optimization of the bipolar plate neck zone.

2. Mathematical Model

2.1. Mechanical Control Equation

For a three-dimensional solid element in equilibrium, the stress component at any point on the element satisfies the equilibrium equation of elastic mechanics:
σ x x + τ y x y + τ z x z + p x = 0
τ x y x + σ y y + τ z x z + p y = 0
τ x z x + τ y x y + σ z z + p z = 0
where σ x , σ y , and σ z are the normal stress components of the solid element in the x, y, and z directions, respectively. τ x y , τ y x , τ x z , τ z x , τ y z , τ z y are the shear stress components of the solid element. P x , P y , P z are the external forces acting on the solid element. Equations (1)–(3) reveal the equilibrium relationship between the stress component in the solid element and the external force acting on the solid element [12].

2.2. Sealing Fundamental Principle

The sealing model of a PEMFC stack consists of the MEA, the bipolar plate, and the gasket, which form the gas sealing cavity. Two contact surfaces are formed between the gasket, MEA frame, and bipolar plate, as displayed in Figure 2a. Under the action of the working pressure P of the reaction gas (mainly hydrogen and air), the gasket tends to move to the outside of the stack [9]. The movement of the gasket is prevented by the friction force on the contact surface. Under the action of the integrated packaging force of the stack, the gasket suffers from compression deformation, resulting in a sealing force against gas leakage on the contact surface. The current sealing criteria based on the contact pressure on the sealing surface are summarized as follows:
σ S e a l a n t m i n < P S e a l a n t < σ S e a l a n t y i e l d n
P S e a l a n t = P g a s t s e a l a n t μ b s e a l a n t
where σ S e a l a n t m i n represents the minimum contact pressure on the seal surface, which is determined by the height t s e a l a n t , width b s e a l a n t , and pressure P g a s of the gas inside the stack and the friction coefficient μ of the seal. The specific formula is shown in Equation (5) [21].

2.3. Invasion Rate

Due to the characteristics of the bridge pier supporting the bridge deck in the neck zone, the stress distribution on the MEA frame will not be uniform. Therefore, when the extreme stress value is excessively high, the deformed frame partially invades the flow channel. Here, the concept of the invasion rate is introduced to replace the degree of frame deformation. The calculation formula for the invasion rate is as follows:
I = V f r a m e V b p p
where I is the invasion rate. V f r a m e is the volume invaded into the channel after the MEA frame deformation. V b p p is the volume of the channel corresponding to the bipolar plate.

3. Calculation Model

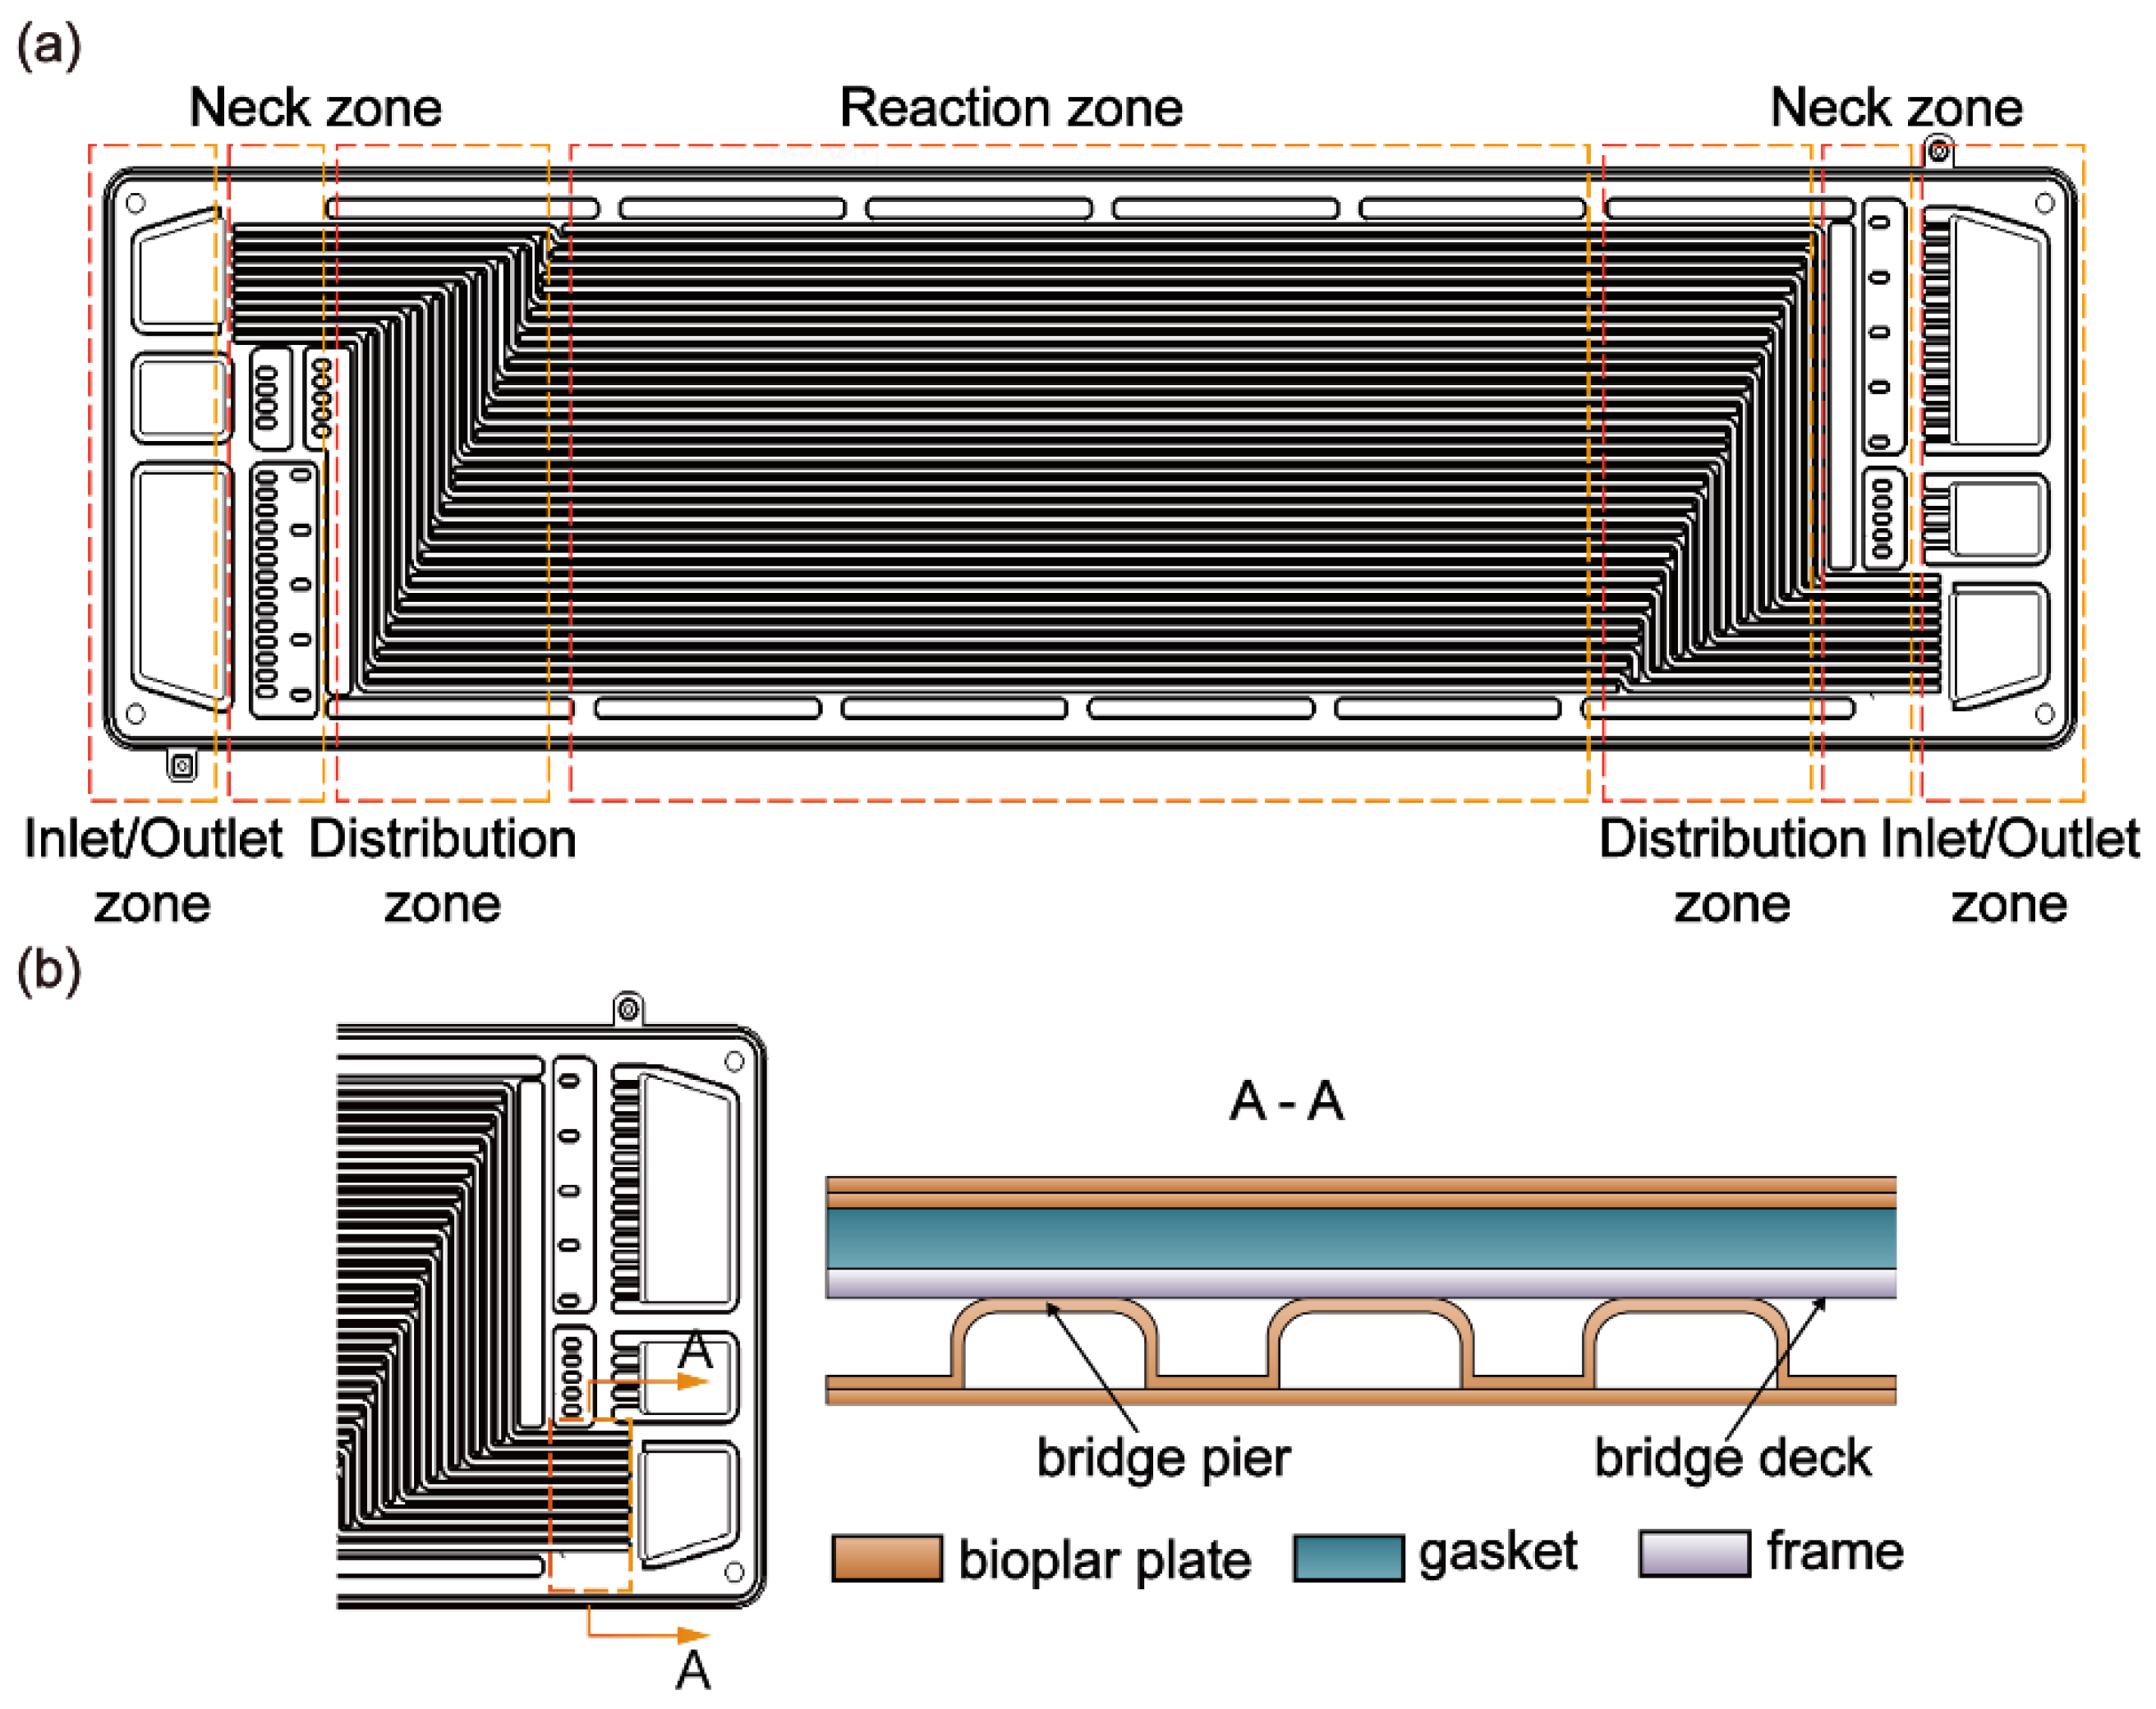
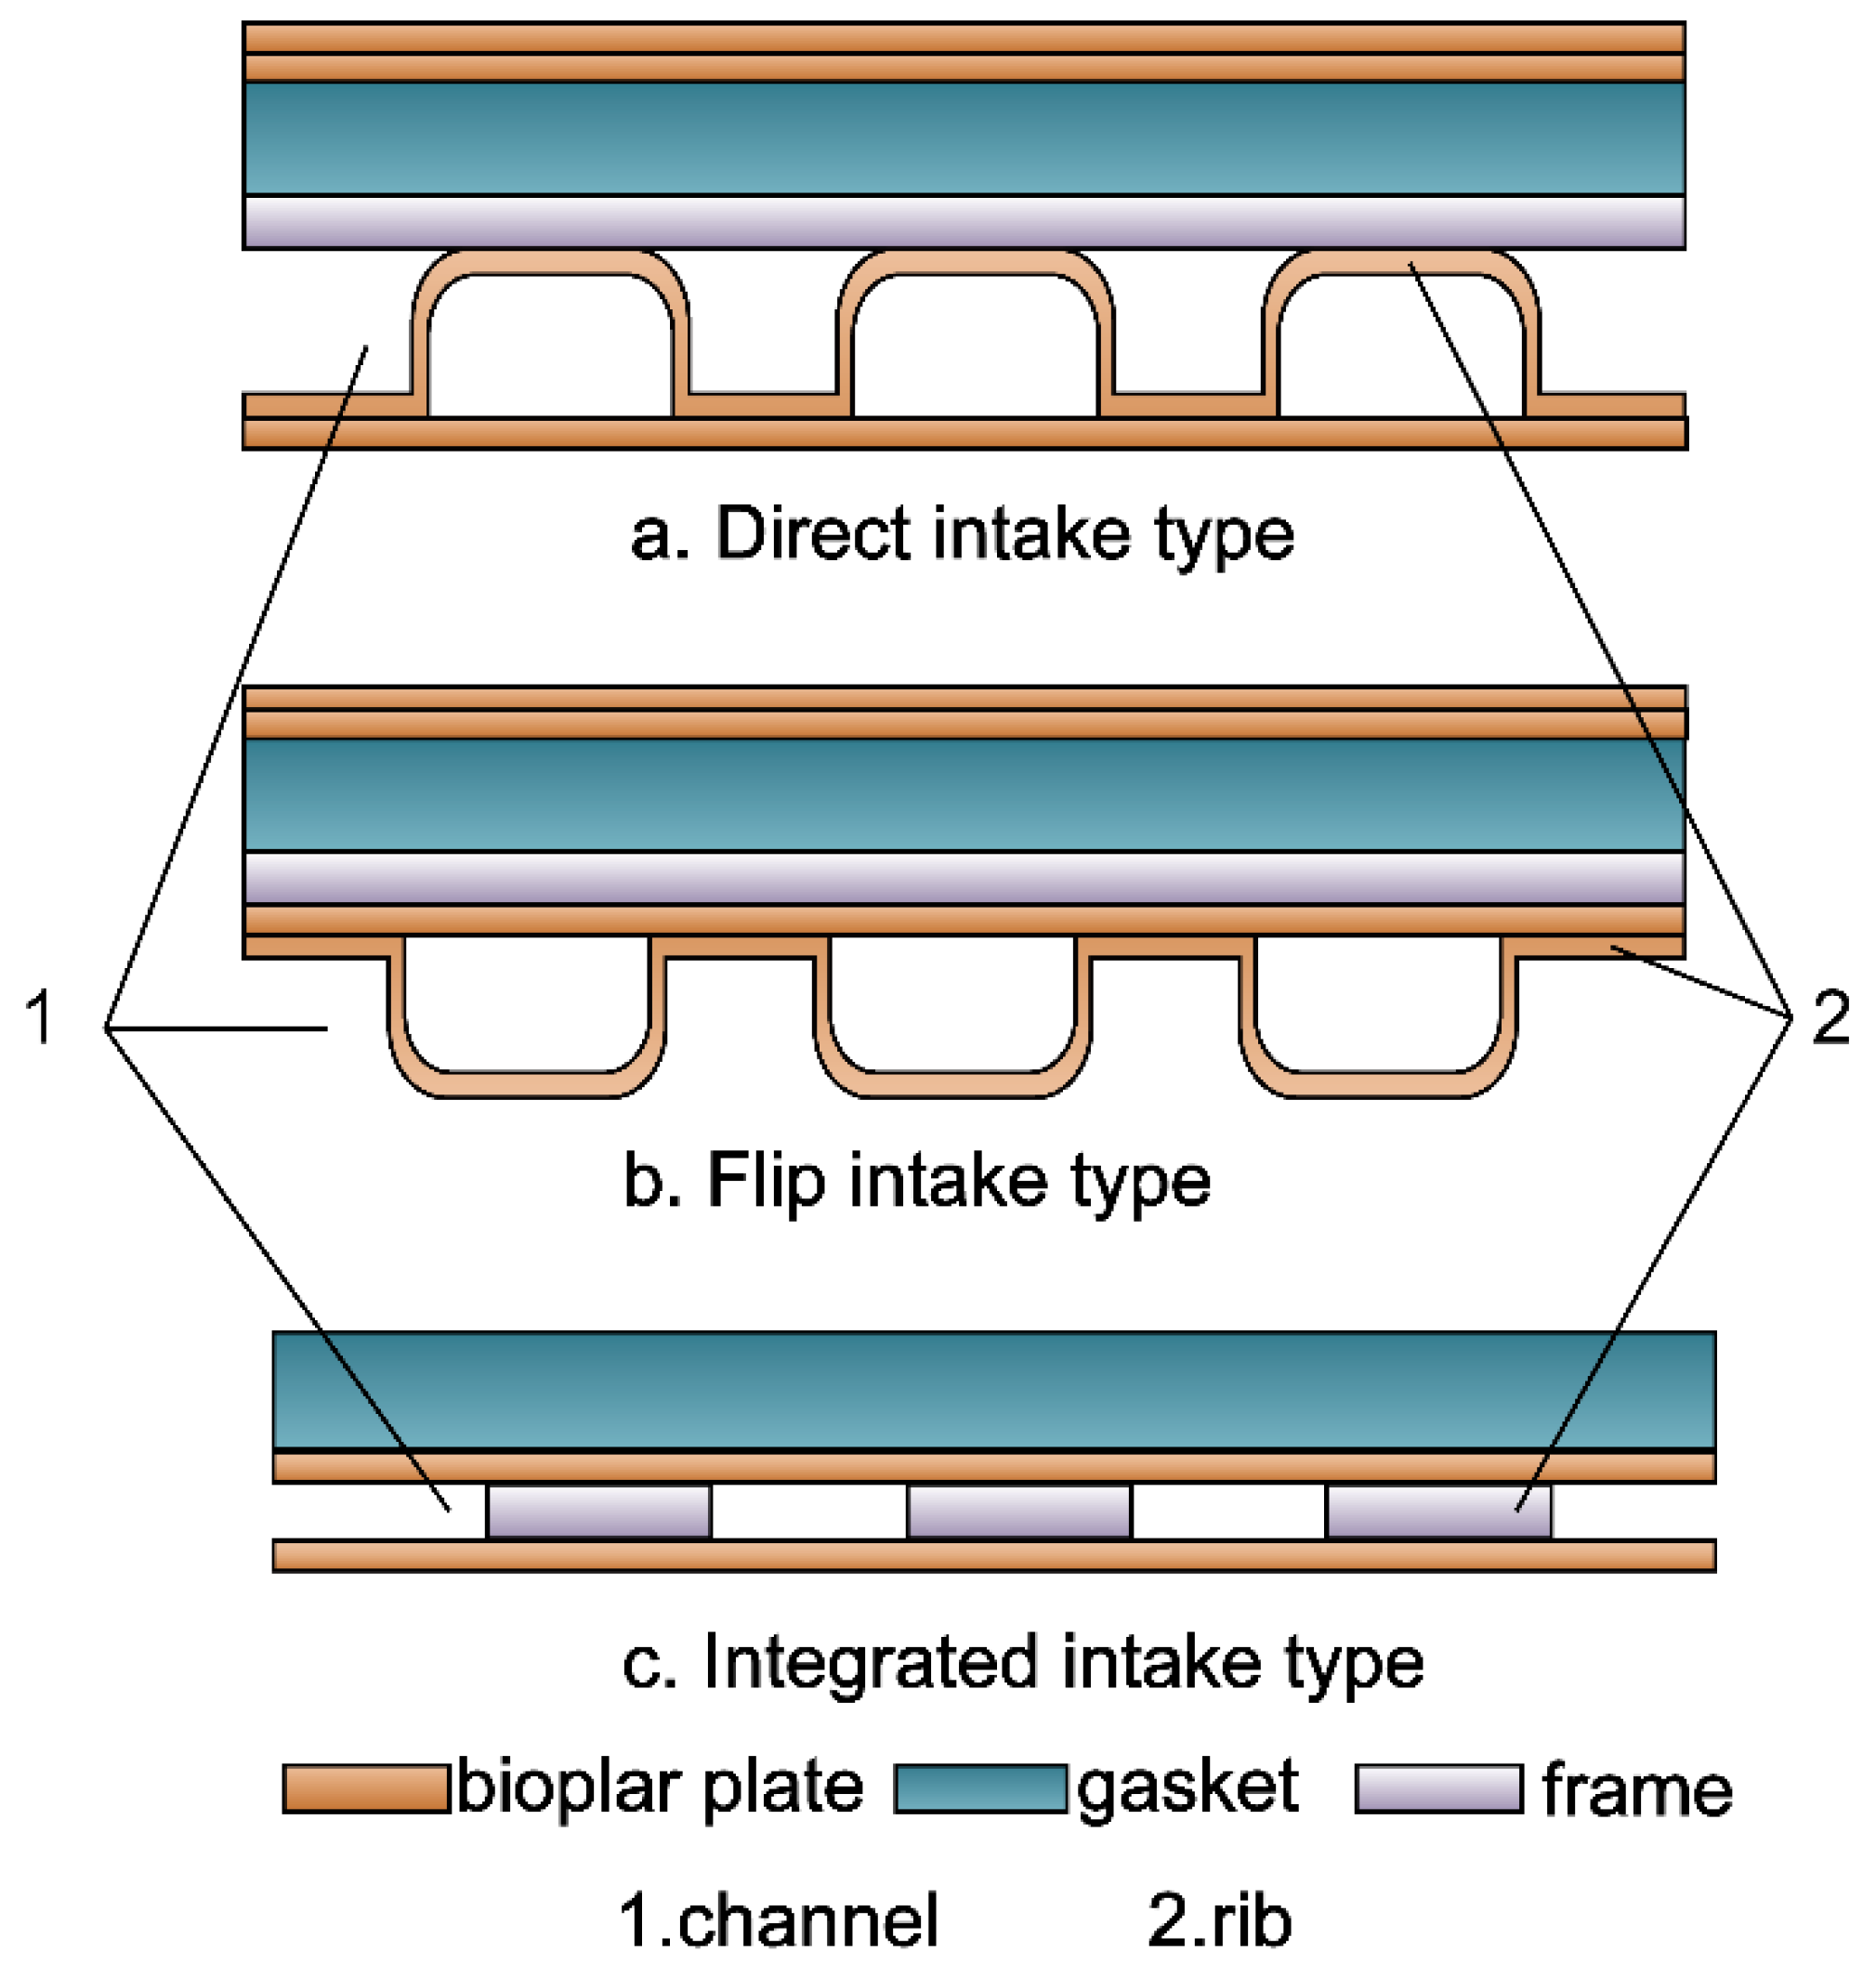
3.1. Structure of the PEMFC Neck Zone

The fuel cell stack is composed of a fuel cell unit (anode/cathode flow plate, sealing element, and MEA), collector, insulation plate, and end plate. A typical PEMFC stack consists of a pair of end plates, multiple bipolar plates, and multiple MEAs. Each MEA is sandwiched between two bipolar plates. On the endplate, four bolts hold the stack together by applying a certain pressure.
The calculation model was drawn via CATIA based on the local enlarged cross-section of the neck zone along the A-A direction, as shown in Figure 3. As described above, the MEA frame is located between the bipolar plate and the gasket and is prone to suffer from high and uneven compressive loads. Therefore, the mechanical properties of the neck zone with different MEA frame materials and physical parameters are explored in the following paper.

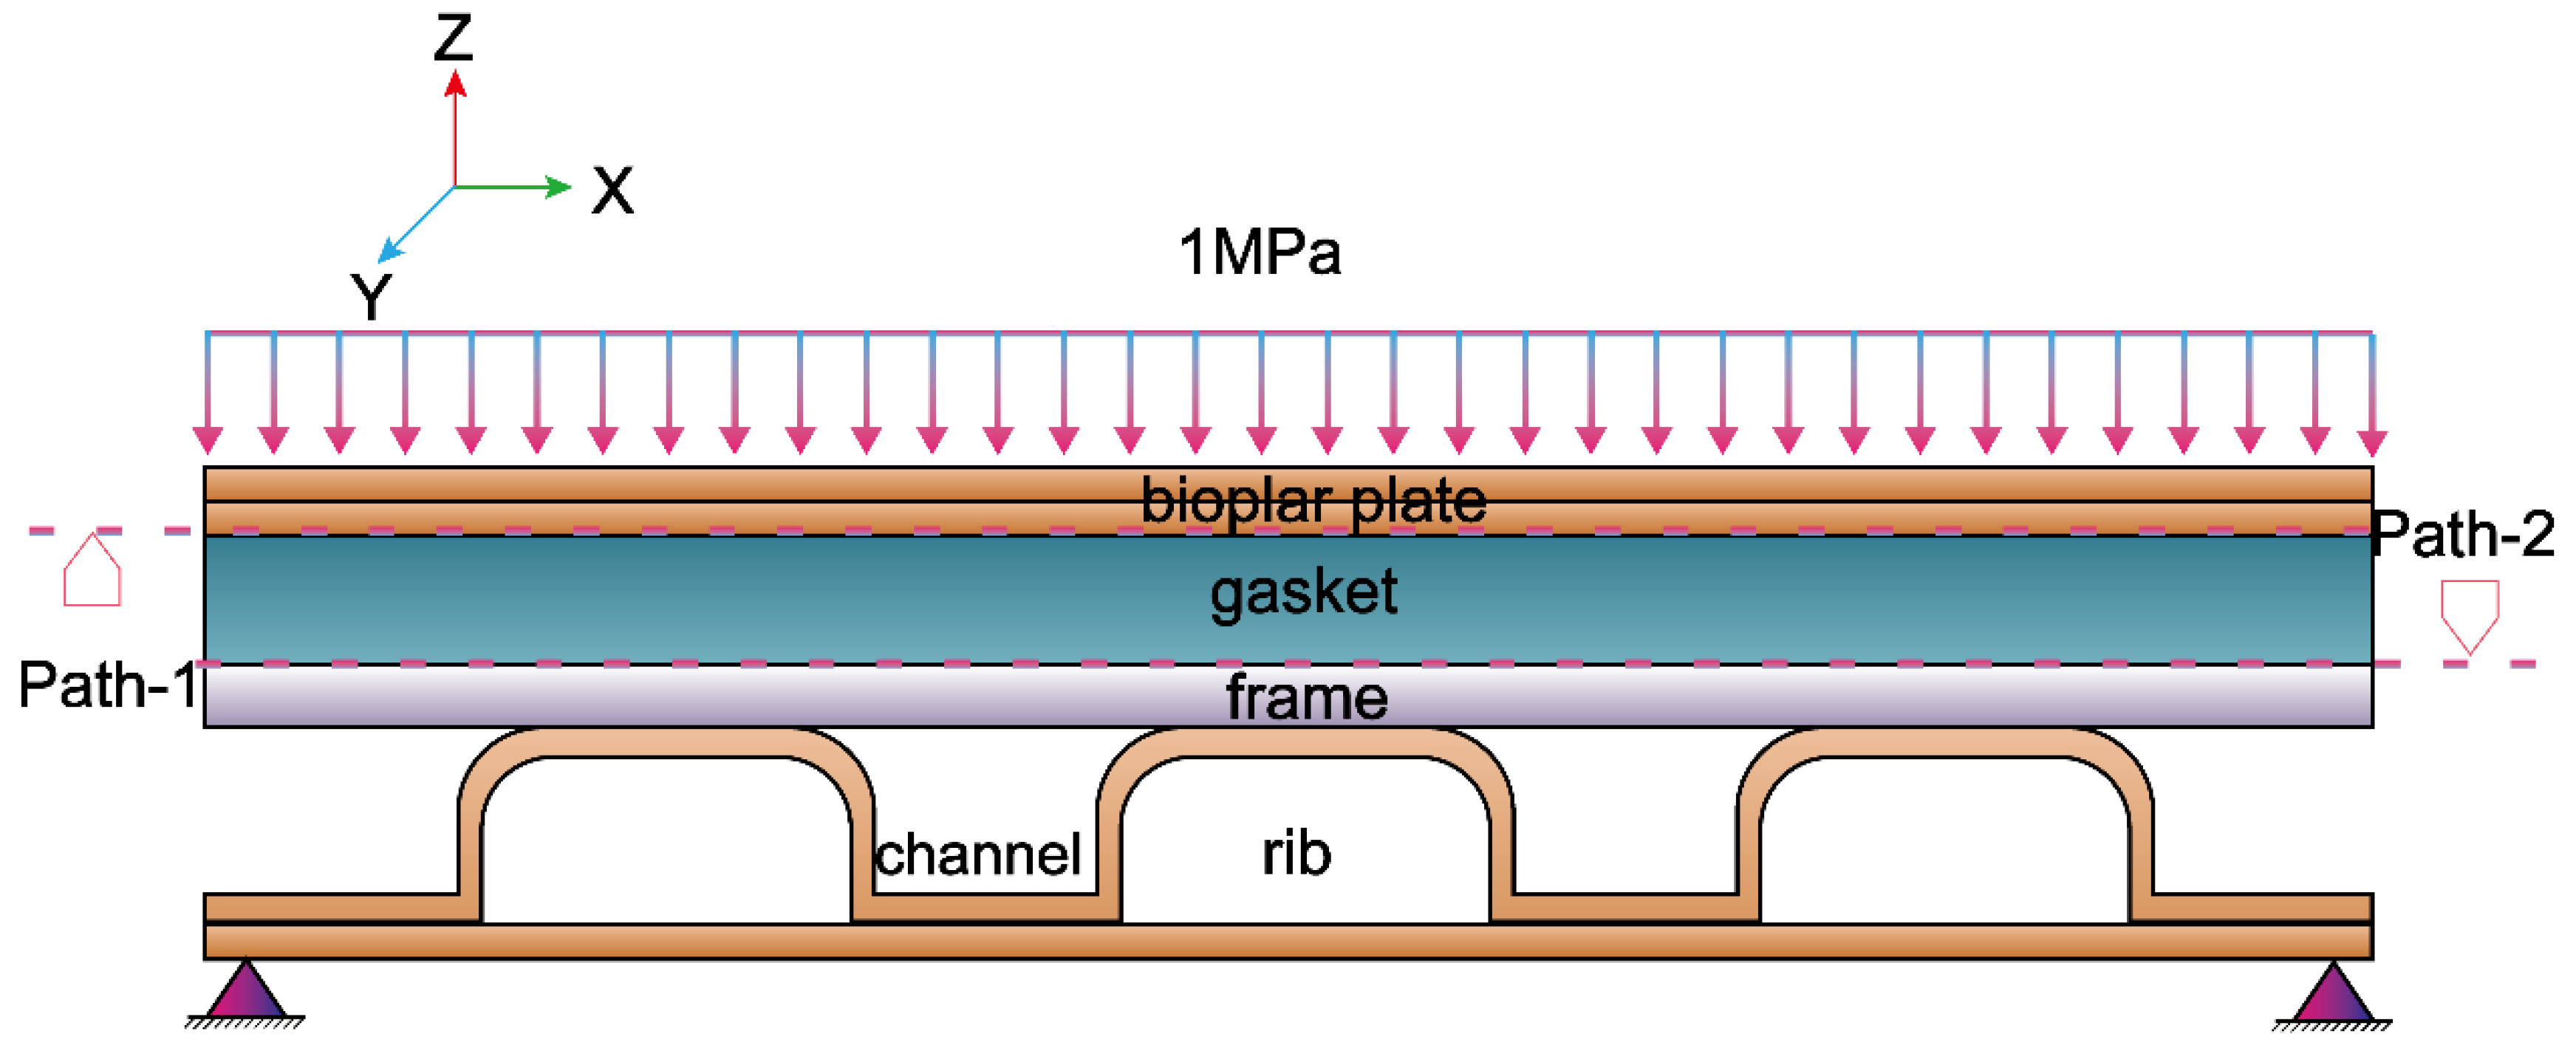
3.2. Model and Assumptions

The focus of this study is the mechanical characteristics of the neck zone in the clamping state. Two paths are coupled in the normal direction to simulate the contact behavior. Path-1 is the path of the lower surface of the bipolar plate and the upper surface of the sealing ring. Path-2 is the path of the lower and upper surfaces of the gasket. The assembly pressure is imposed directly on the contact area of the neck zone, and a uniform clamping load of 1 MPa is applied to the upper plate surface [8,10] (Figure 3).
To prevent free movement, the finite element model must be properly constrained. The lower bipolar plate surface was fixed in the x and y directions, and fixed constraints were used between the plates. The MEA frame and the upper and lower surfaces of the gasket were in frictional contact.
The individual components adopt a combination of mapping grids and automatic grids, using more than 7000 mapping grids, to ensure proper element connectivity and a correct aspect ratio.
Gas leakage usually occurs at contact interfaces, while gas transport is mainly affected by the frame invasion into the flow channel. To more effectively explain the problem of gas leakage and transport, the path between the lower surface of the bipolar plate and the upper surface of the gasket was extracted as Path-1, and the path between the lower surface of the gasket and the upper surface of the frame was extracted as Path-2 (Figure 3). In fact, Path-1 and Path-2 are the representative paths on the above-described surface. The stress and deformation of each component in different directions were calculated in a finite element simulation. Taking the calculation results of the neck zone with a 0.1 mm PTFE (polytetrafluoroethylene) MEA frame as an example, Figure S1 shows the calculation cloud diagram of the stress and deformation along the Y axis in the unified Z coordinate. As displayed in Figure S1, there are two paths with the most severe changes in the stress and deformation along the X-Y plane, which are denoted as Path-1 and Path-2. Focusing on the mechanical properties of the two paths can fully explain the mechanical behavior of the neck zone.
Considering the symmetry and repeatability of the sealing structure, similar assumptions are also used in the references. The finite element analysis was performed using the commercial finite element software ANSYS WORKBENCH:
(1)
The MEA frame and the gasket are linearly elastic, assumed to be isotropic, and plastic deformation is disregarded [8,13,14,22].
(2)
The influence of temperature, humidity, corrosion, and electrochemical reactions on the gasket is not considered [23].
(3)
Fluid action in the reaction gas is not considered [14].

3.3. Geometry and Material Properties

The gasket in the neck zone is located between the bipolar plate and the MEA frame and is responsible for the sealing performance of the stack. Rubber with suitable elasticity, corrosion, and fatigue resistance is usually applied as the sealing material [8]. Therefore, the characteristic parameters of silicone rubber materials are used in the finite element analysis in this work. The rib-to-channel width ratio of the bipolar plate is generally 0.3~1 [24], and the channel depth is 0.3~1.2 mm [11].
The partial geometric and material parameters used in this study are shown in Table 1 and Table 2. At present, the MEA frame materials are mainly polymer materials, macromolecular materials, and composite materials. Three representative frame materials with different elastic moduli were chosen to study the mechanical properties of the neck zone: PTFE, PEN (polyethylene naphthalate), and SER (SiO2-epoxy resin).
The investigated MEA frame thickness is set at 0.1 mm, 0.2 mm, and 0.3 mm. The selection of materials and geometric parameters is based on reviewed patents, literature, and commercial products [10,17,20]:

4. Results

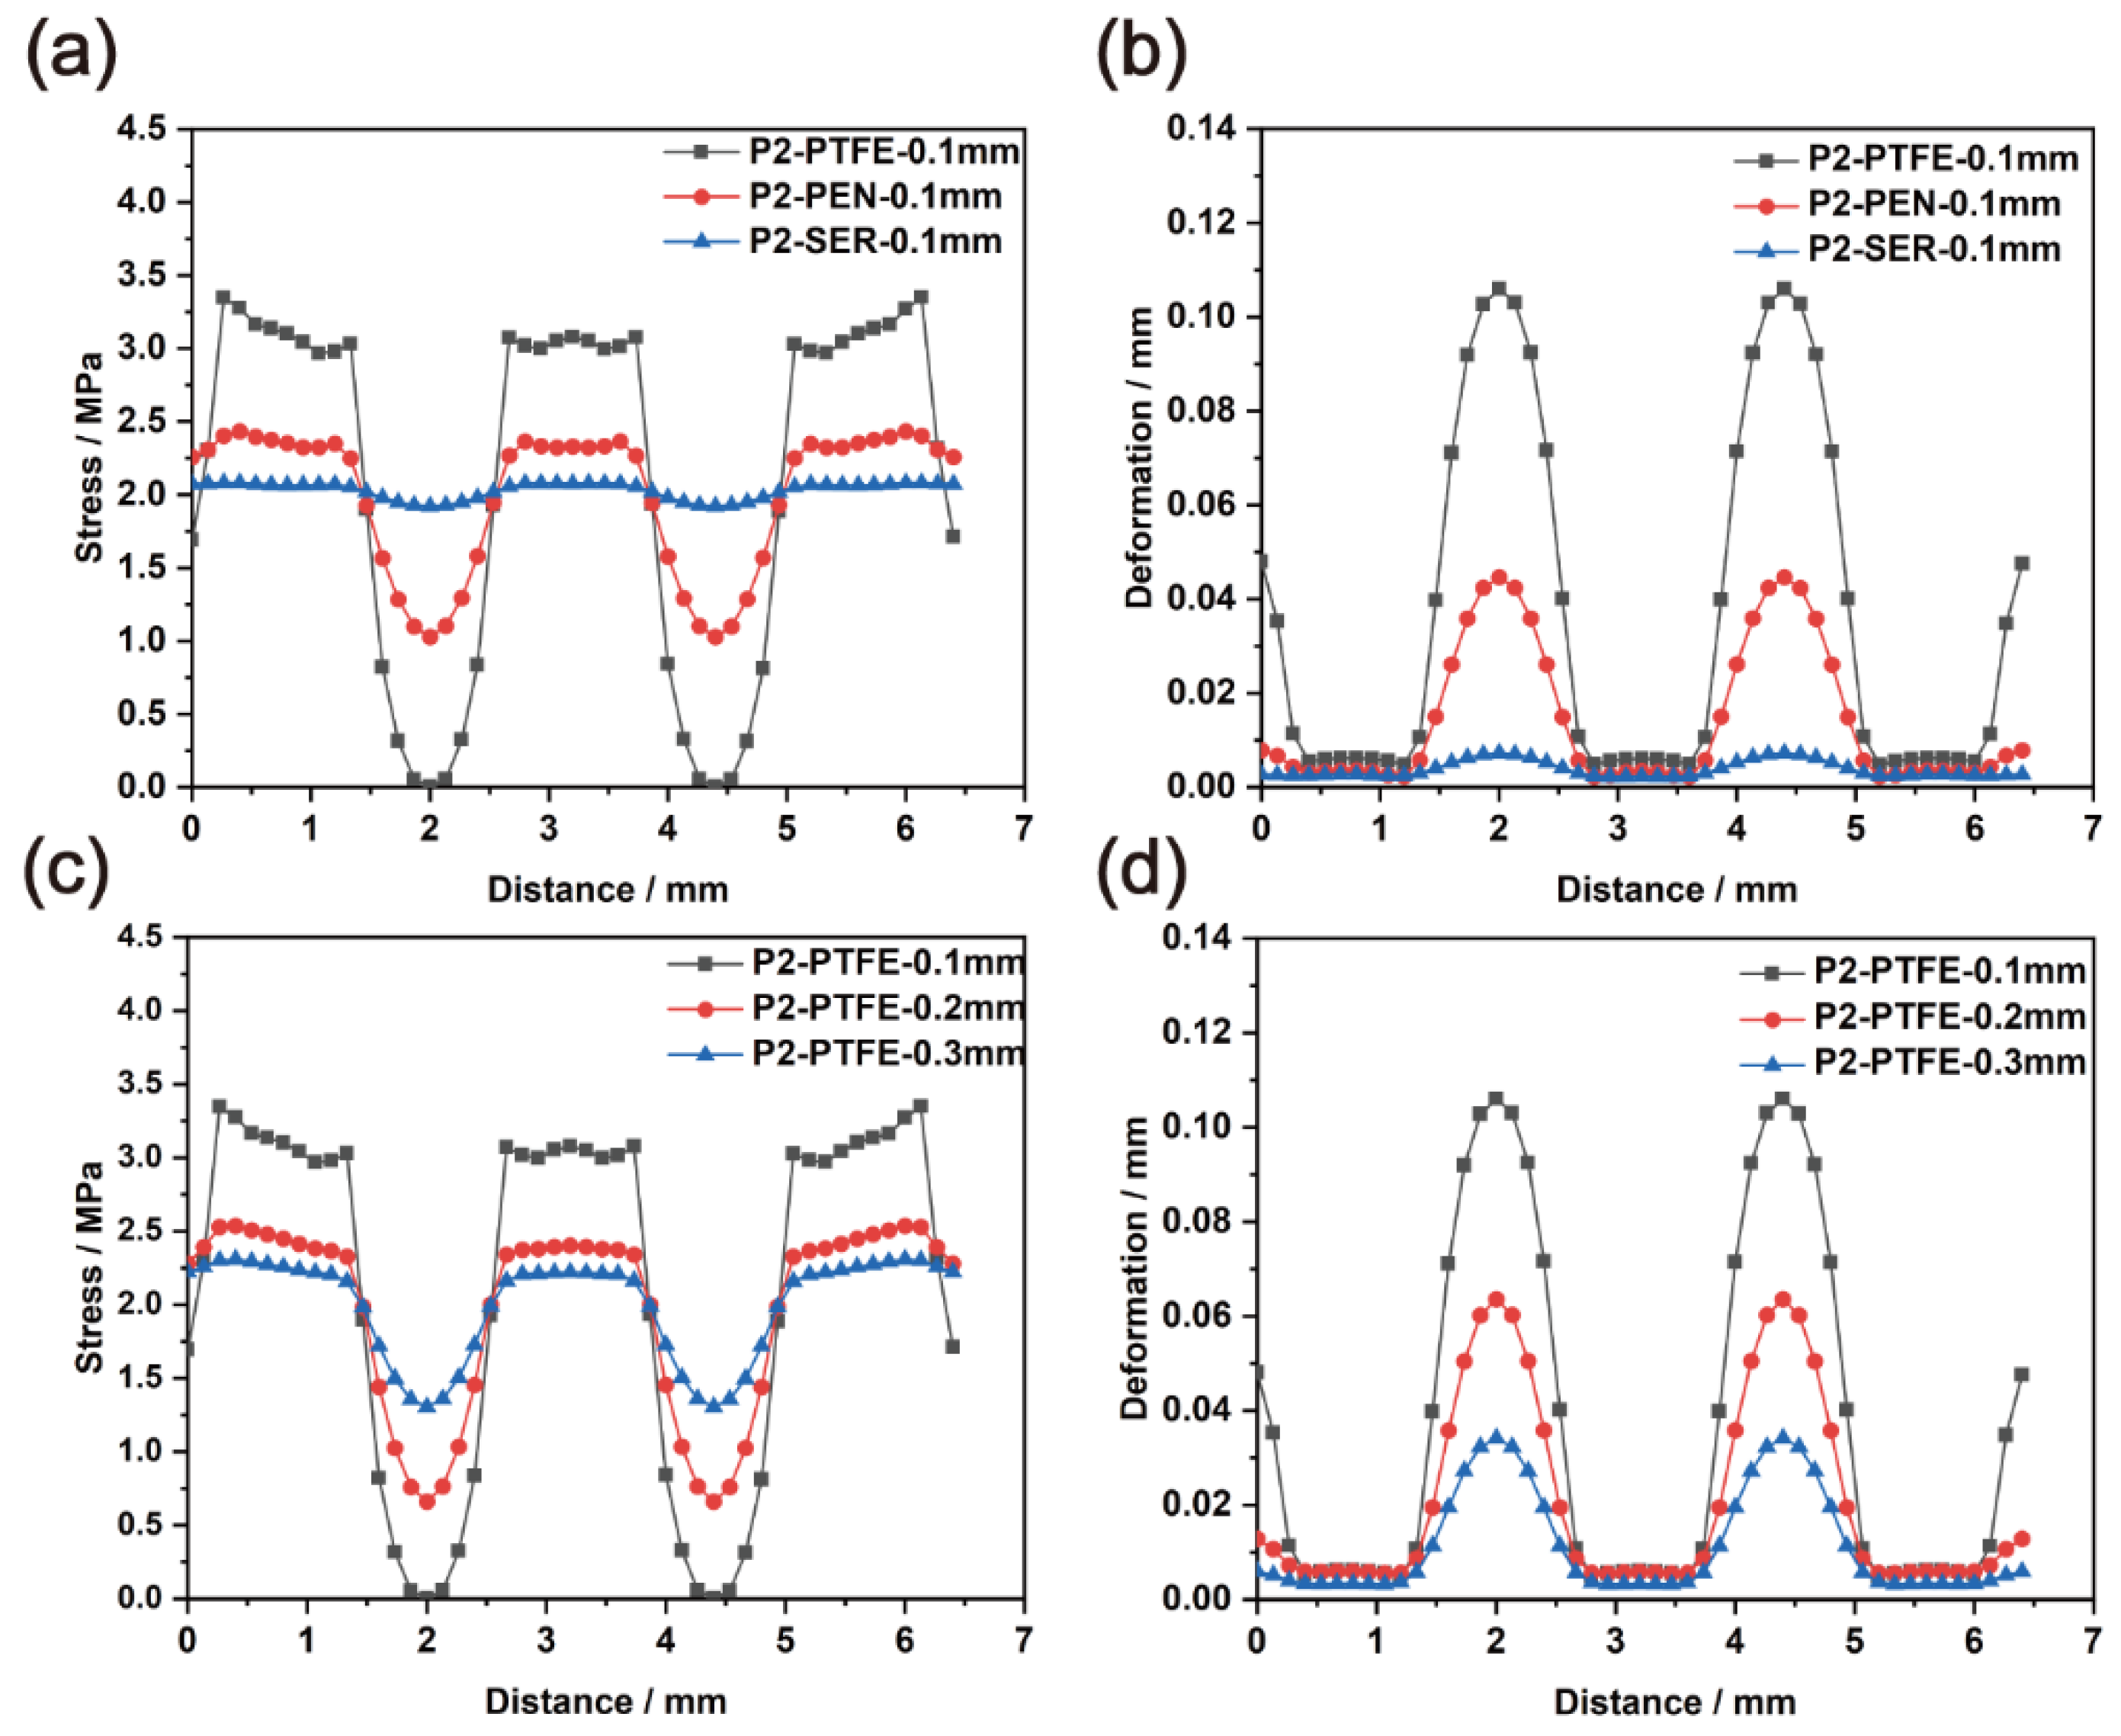
4.1. Upper Surface of the Gasket and Lower Surface of the Bipolar Plate

Stress usually occurs on the upper surface of the gasket and the lower surface of the bipolar plate (Path-1). Therefore, the deformation in the neck zone is not uniform, which is responsible for the leakage.
Figure 4a,b show the stress and deformation changes of different frame materials under the condition of Path-1. Due to the uneven support of the bipolar plate channel and rib-to-frame, large stress and deformation fluctuations occur in the flow channel part at a uniform clamping load of 1 MPa, as shown in Figure 4a. It can be observed that the degree of fluctuation decreases with an increase in the elastic modulus of the frame materials. Among them, the PTFE frame stress at the center of the flow channel is only 0.14 MPa, which is 2.76 MPa lower than the maximum stress and far lower than the sealing stress value reported in the literature [25,26]. As shown in Figure 4b, as the elastic modulus of the MEA frame increases, the deformation of the upper surface of Path-1 declines. The MEA frame of the PTFE presents obvious movement changes, and the difference between the maximum movement and the minimum movement is up to 0.005 mm, which is much higher than that of the SER frame. From the results presented in Figure 4, it can be surmised that the sealing performance of the SER frame material is better than that of the PEN and PTFE frames.
Figure 4c,d show the stress and deformation change of the PTFE frame with different thicknesses on the upper surface of Path-2. As displayed in Figure 4c, the larger the MEA frame thickness, the lower the stress fluctuation. As the frame thickness increases to 0.3 mm, the difference between the maximum and minimum stresses is reduced to 0.75 MPa, which is 27.2% less than in the case of the 0.1 mm frame thickness. The deformation change exhibited in Figure 4d presents the same trends as those in Figure 4c. The movement of the 0.3 mm PTFE frame is almost negligible, and the difference between the maximum deformation and the minimum deformation is only 0.001 mm. This result indicates that a frame with a higher thickness will contribute to a better sealing effect.

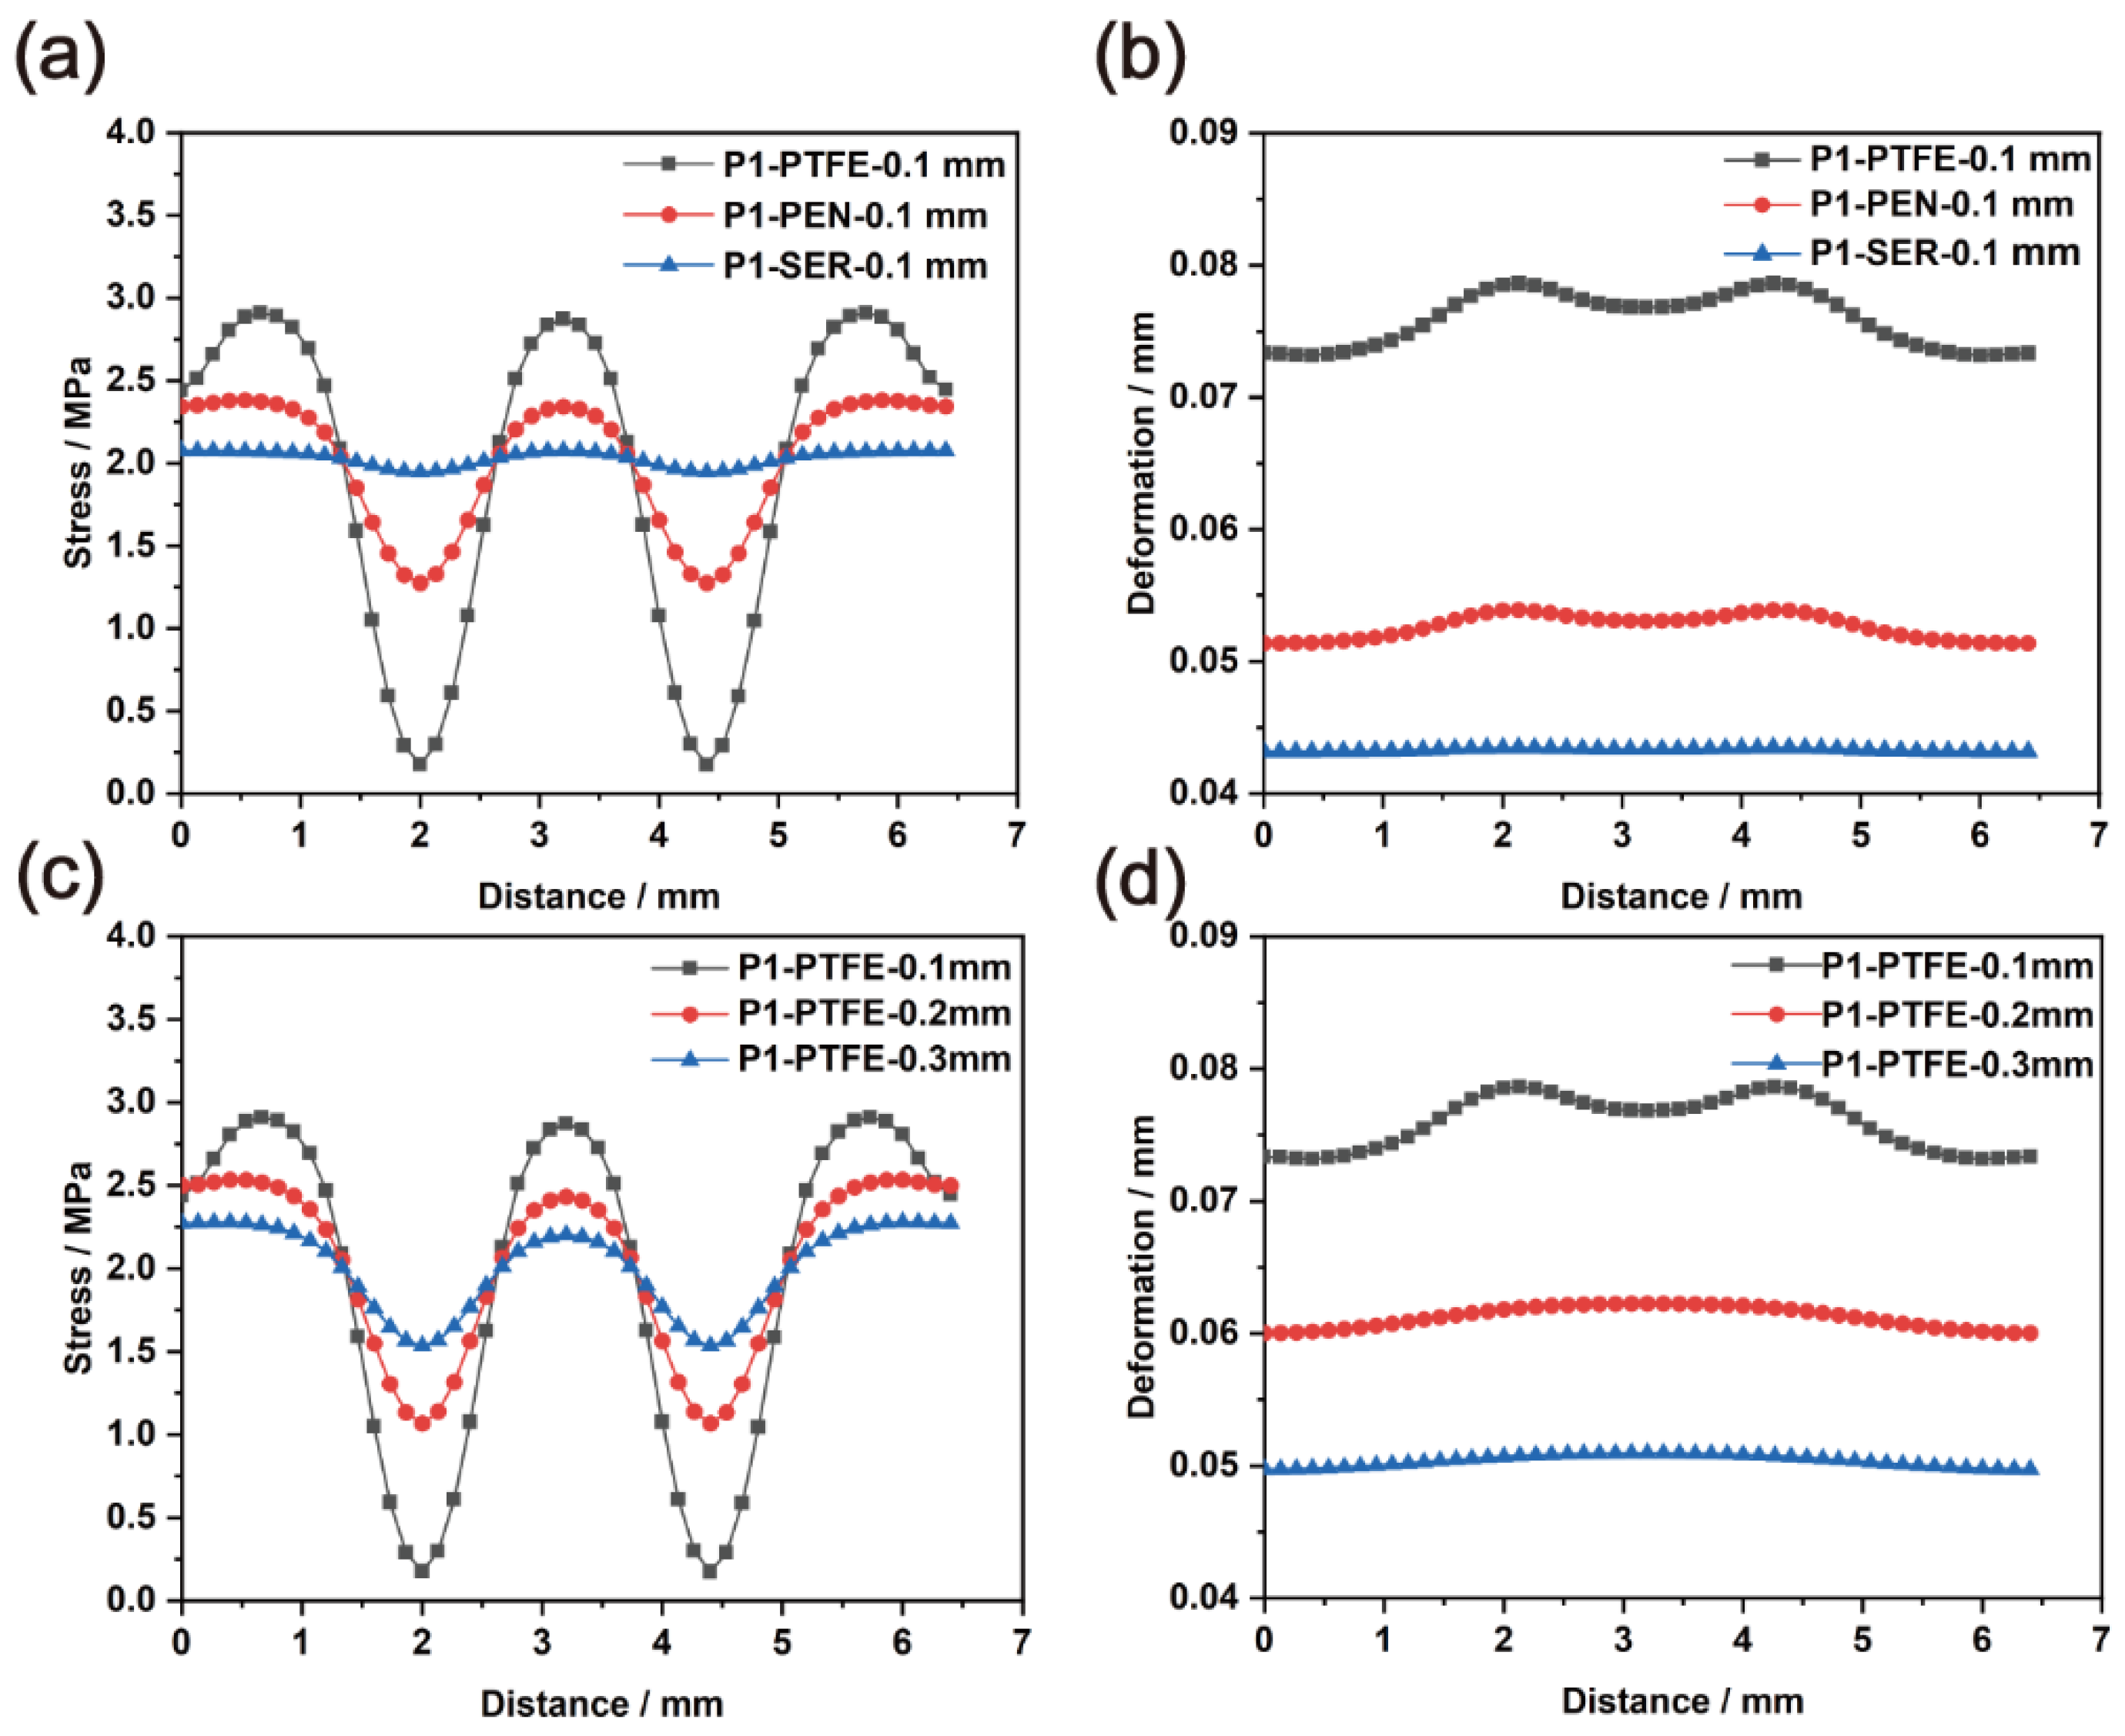
4.2. Lower Surface of the Gasket and Upper Surface of the Frame

Figure 5a,b show the stress and deformation changes of the different frame materials under the condition of Path-2. Due to the uneven support of the MEA frame of the bipolar plate flow channel and the rib, the MEA frame has a sudden decrease in the stress and deformation in the flow channel part with a uniform clamping load of 1 MPa. This unfavorable phenomenon can be ascribed to the special structure of the neck zone. There is an evident change in the stress and deformation at the part without bridge pier support, different from that at the part supported by the bridge pier. The minimum value is where the stress declines sharply as the elastic modulus of the MEA frame increases, as shown in Figure 5a. The maximum and minimum difference of the PTFE frame stress reach 3.4 MPa, and stress values are not observed at the center of the bipolar plate flow channel. Hence, the part without the stress could be prone to leakage.
As the elastic modulus of the MEA frame increases, the maximum deformation of the lower surface of the gasket decreases. In addition, the SER frame material does not appear to suffer from the mechanical problems associated with the special construction of the neck zone and displays a deformation of only 0.016 mm. However, the commercial PEN frame is seriously deformed, and the displacement variation reaches 0.04 mm, which is equivalent to 40% of the frame thickness [13].
Figure 5c shows that the minimum value of the stress drop decreases with increasing MEA frame thickness, which is consistent with the analyzed result for Path-1. The stress of the 0.1 mm PEN at the center of the bipolar plate flow channel is the smallest, only 1 MPa, which is 1.5 MPa lower than its maximum stress and the sealing stress reported in the literature [25,27]. As the elastic modulus of the frame increases, the sudden deformation of the lower surface of the gasket decreases. When the MEA frame with a thickness of 0.1 mm PTFE is used, the minimum deformation is 0.11 mm, which is almost equivalent to the frame thickness.
From the data presented in Figure 4 and Figure 5, it can be found that the stress and deformation inhomogeneity of Path-2 are larger than those of Path-1, which is due to the characteristics of the bridge deck’s support of the bridge piers in the neck zone.

5. Discussion

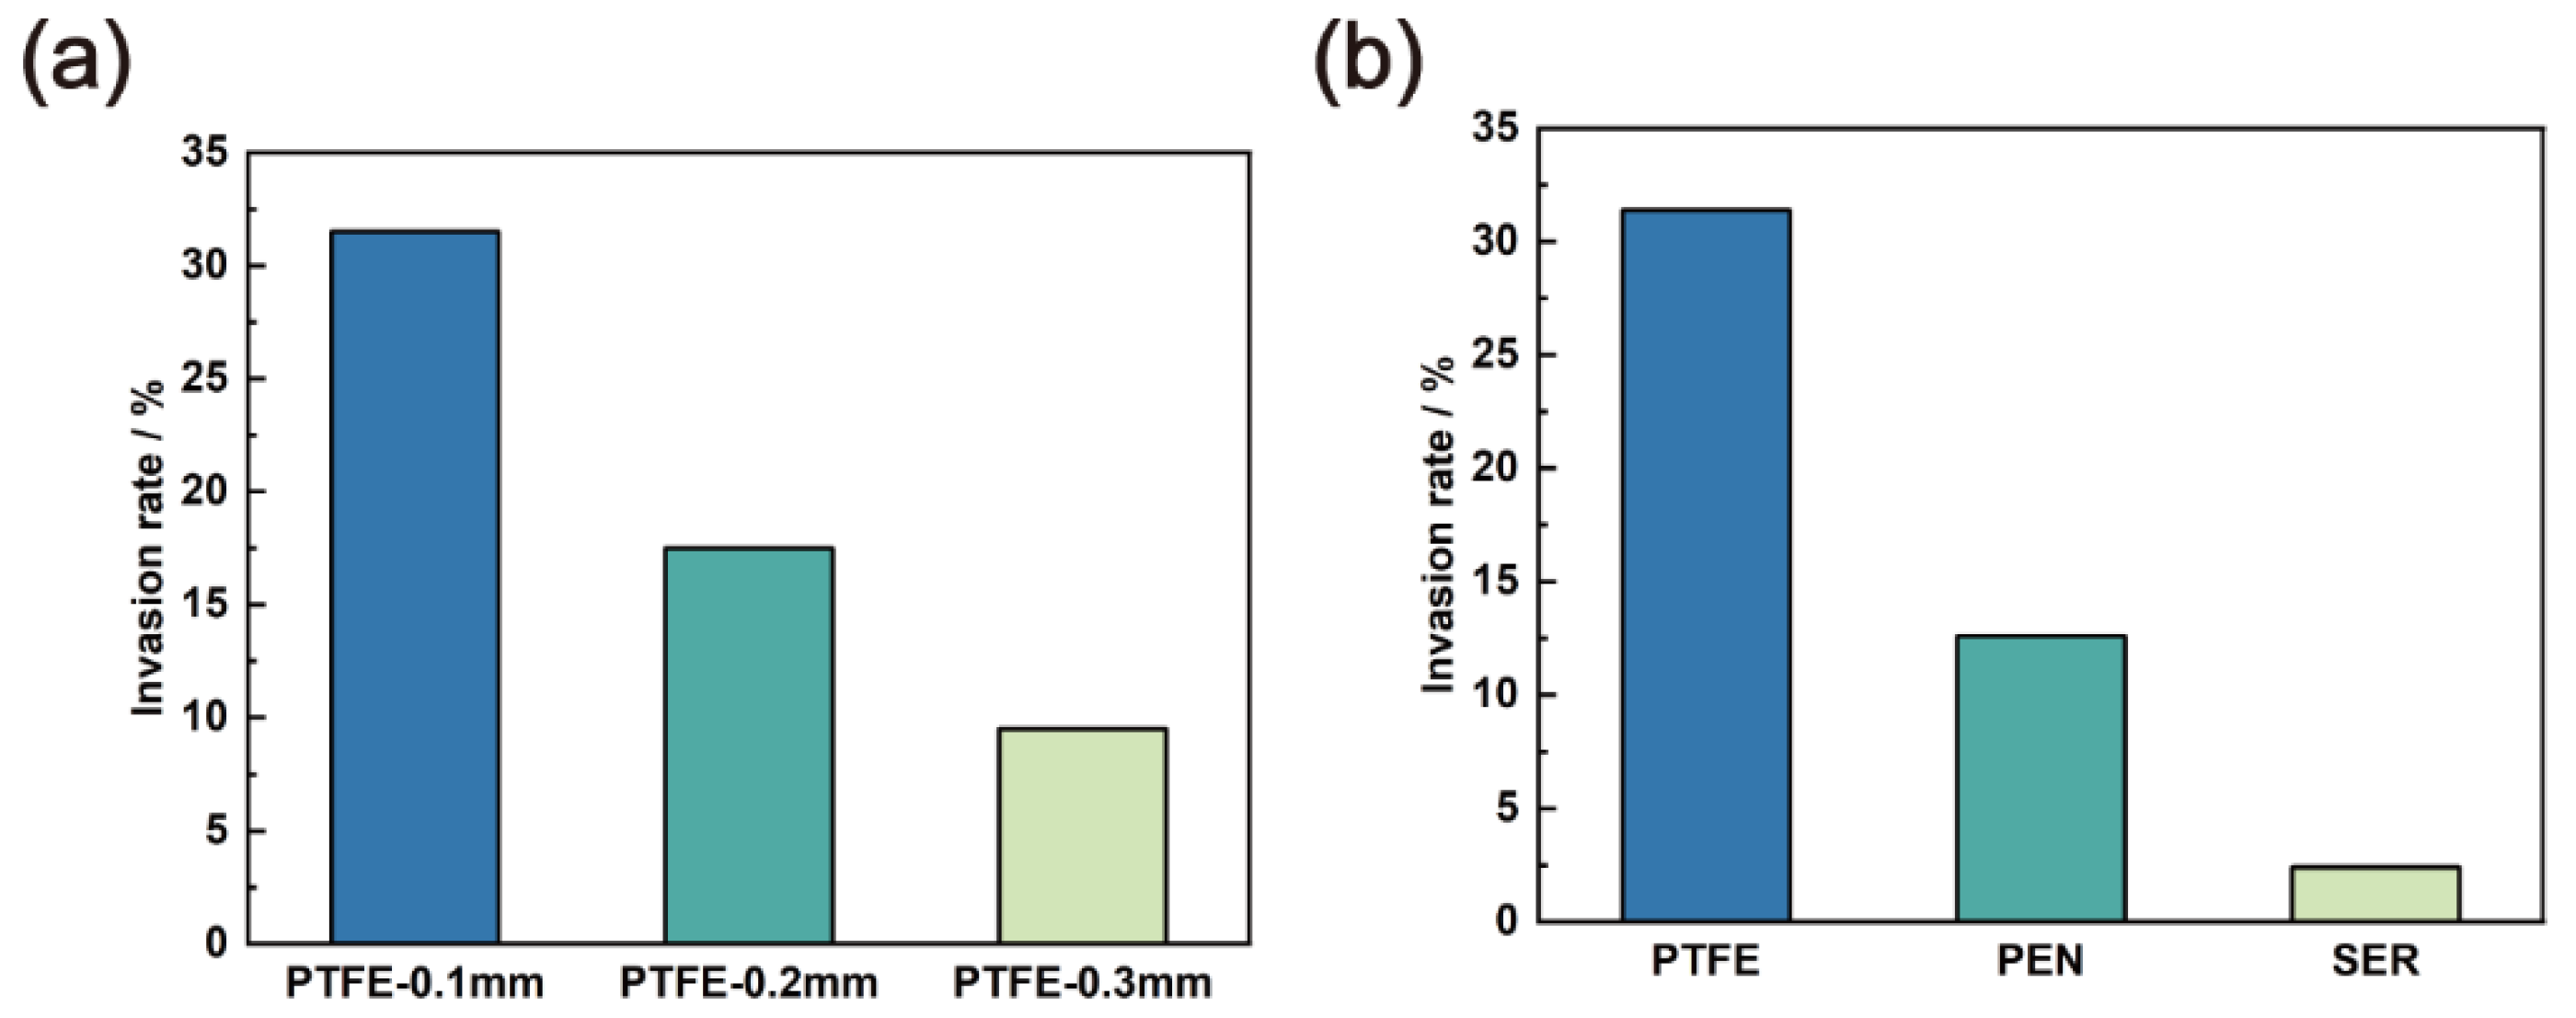
5.1. Invasion Rate Results

The invasion rates of different MEA frames were calculated according to Equation (6). The invasion rate increases from 9.5% to 32.4% with decreasing PTFE frame thickness, leading to worse water–gas transport properties in the neck zone, as displayed in Figure 6a. The invasion rates for the three MEA frame materials with equivalent thicknesses are also compared in Figure 6b. There is a huge difference in the invasion rate between the PTFE frame and the SER frame. The SER frame presents an invasion rate of only 2.4%, which seems to have no impact onwater–gas transport in the neck zone.

5.2. Sealing Performance Results

To more clearly assess whether these frame materials can meet the sealing requirements, the sealing stress standards in the neck zone are provided according to Equations (4) and (5) Although the frame material and thickness are different, the sealing stress is almost 1 MPa [25], as shown in Figure 7. The overall analysis results indicate that the sealing problem of Path-2 is more serious than that of Path-1. We can see from the stress distribution curves in Path-1, shown in Figure 7a,b, for an MEA frame with a thickness of 0.1 mm, that only the PTFE material cannot meet the sealing requirements, and 15.6% of the sealing area cannot reach the sealing standard. However, when PTFE frames with different thicknesses are adopted, the thickness must be greater than 0.2 mm to meet the sealing standards. In Figure 7c,d, under the same conditions, both PTFE and commercial PEN materials in Path-2 cannot meet the sealing requirements. Moreover, the area of the PTFE frame that does not meet the sealing standard rises to 20.3%, and the 0.2 mm PTFE frame changes from point leakage in Path-1 to face leakage in Path-2. Whether in Path-1 or Path-2, the SER frame with a high elastic modulus enables better sealing. Therefore, to ensure a good sealing performance, higher frame thickness and higher elastic module frame materials are recommended.

6. Conclusions

In this paper, the concept of the neck zone was proposed, and the mechanical properties of the region were studied with finite element model simulation. The importance of the mechanical characteristics of this zone in sealing and the water–gas transport performance was emphasized. Three typical MEA frame materials with different elastic moduli and thicknesses were considered in the stress simulation work. According to the basic principle of sealing and the invasion rate of the MEA frame, the following conclusions were obtained.
  • The stress distribution of the MEA frame in the neck zone is extremely uneven. Different MEA frame materials exhibited different effects on the mechanical characteristics of the neck zone. With the decrease in the elastic modulus and thickness of the frame materials, the stress distribution and deformation in the neck zone become more uneven and larger, respectively. The lower surface of the bipolar plate and the upper surface of the sealing ring face (Path-2) are confronted with more serious mechanical problems. The difference between the maximum and minimum stress values reached 1.5 MPa even with a 0.1 mm commercial PEN frame, and the maximum shape variable was up to 0.11 mm for the 0.1 mm PTFE MEA frame, which was responsible for the generation of the leakage point.
  • When the MEA frame had a lower elastic modulus and thickness, the invasion rate sharply increased. The 0.1 mm PTFE frame presented the highest invasion, which was up to 32.4%, greatly blocking water–gas transport.
  • If inappropriate frame material is adopted, the neck zone will suffer from severe sealing problems. The 0.1 mm PTFE frame displayed the worst sealing effect, and up to 15.6% of the position could not meet the sealing standard. Therefore, the selection of MEA frame materials is of great importance.
Moreover, selecting the frame material with a higher elastic modulus or increasing the frame thickness can improve the sealing and water–gas transport performance of the neck zone. This work provides guidance for the design and optimization of the neck zone.

Supplementary Materials

The following supporting information can be downloaded at: https://www.mdpi.com/article/10.3390/en16042038/s1, Figure S1: The calculation cloud diagrams of the X-Z plane along the Y-axis (a) Deformation, (b) Stress.

Author Contributions

Conceptualization, Z.Z. (Zhen Zhang), F.Z., Z.Z. (Zhigang Zhan) and M.P.; Methodology, Z.Z. (Zhen Zhang) and Z.Z. (Zhigang Zhan); Software, Z.Z. (Zhen Zhang), Z.Z. (Zhigang Zhan) and M.P.; Validation, Z.Z. (Zhen Zhang), Z.Z. (Zhigang Zhan) and M.P.; Formal analysis, Z.Z. (Zhen Zhang), Z.Z. (Zhigang Zhan) and M.P.; Investigation, Z.Z. (Zhen Zhang); Resources, Z.Z. (Zhen Zhang), F.Z., Z.Z. (Zhigang Zhan) and M.P.; Data curation, Z.Z. (Zhen Zhang), F.Z., Z.Z. (Zhigang Zhan) and M.P.; Writing—original draft, Z.Z. (Zhen Zhang), F.Z. and J.T.; Writing—review & editing, Z.Z. (Zhen Zhang), F.Z. and J.T.; Visualization, Z.Z. (Zhen Zhang), F.Z. and J.T.; Supervision, M.P.; Project administration, M.P.; Funding acquisition, F.Z. and J.T. All authors have read and agreed to the published version of the manuscript.

Funding

This research is supported by the National Natural Science Foundation of China (program no. 22109122 and 22209026).

Data Availability Statement

The data can be available upon reasonable request.

Conflicts of Interest

The authors declare no conflict of interest.

References

  1. Gao, W.T.; Hu, Z.Y.; Huang, H.Y.; Xu, L.F.; Fang, C.; Li, J.Q.; Wang, C.; Ouyang, M.G. All-condition economy evaluation method for fuel cell systems: System efficiency contour map. eTransportation 2021, 9, 100127. [Google Scholar] [CrossRef]
  2. Wu, C.W.; Zhang, W.; Han, X.; Zhang, Y.X.; Ma, G.J. A systematic review for structure optimization and clamping load design of large proton exchange membrane fuel cell stack. J. Power Sources 2020, 476, 228724. [Google Scholar] [CrossRef]
  3. Chen, M.; Zhao, C.; Sun, F.M.; Fan, J.T.; Li, H.; Wang, H.J. Research progress of catalyst layer and interlayer interface structures in membrane electrode assembly (MEA) for proton exchange membrane fuel cell (PEMFC) system. eTransportation 2020, 5, 100075. [Google Scholar] [CrossRef]
  4. Yu, Y.; Zhan, Z.; He, L.; Yang, X.; Wan, X.; Sui, P.-C.; Pan, M. Effects of Distribution Zone Design on Flow Uniformity and Pressure Drop in PEMFC. J. Electrochem. Soc. 2021, 168, 094505. [Google Scholar] [CrossRef]
  5. Lin, P.; Zhou, P.; Wu, C.W. A high efficient assembly technique for large proton exchange membrane fuel cell stacks: Part II. Applications. J. Power Sources 2010, 195, 1383–1392. [Google Scholar] [CrossRef]
  6. Qiu, D.; Liang, P.; Peng, L.; Yi, P.; Lai, X.; Ni, J. Material behavior of rubber sealing for proton exchange membrane fuel cells. Int. J. Hydrog. Energy 2020, 45, 5465–5473. [Google Scholar] [CrossRef]
  7. Ye, D.H.; Zhan, Z.G. A review on the sealing structures of membrane electrode assembly of proton exchange membrane fuel cells. J. Power Sources 2013, 231, 285–292. [Google Scholar] [CrossRef]
  8. Gatto, I.; Urbani, F.; Giacoppo, G.; Barbera, O.; Passalacqua, E. Influence of the bolt torque on PEFC performance with different gasket materials. Int. J. Hydrog. Energy 2011, 36, 13043–13050. [Google Scholar] [CrossRef]
  9. Liang, P.; Qiu, D.; Peng, L.; Yi, P.; Lai, X.; Ni, J. Structure failure of the sealing in the assembly process for proton exchange membrane fuel cells. Int. J. Hydrog. Energy 2017, 42, 10217–10227. [Google Scholar] [CrossRef]
  10. Ye, D.H.; Zhan, Z.G.; Lee, Y.J.; Tu, Z.K.; Zhang, Y.; Pan, M. Effects of Frame Materials and Structures on Stress Concentration of Membrane Electrode Assembly of PEMFCs. Fuel Cells 2013, 13, 1205–1212. [Google Scholar] [CrossRef]
  11. Qiu, D.; Yi, P.; Peng, L.; Lai, X. Channel Dimensional Error Effect of Stamped Bipolar Plates on the Characteristics of Gas Diffusion Layer Contact Pressure for Proton Exchange Membrane Fuel Cell Stacks. J. Fuel Cell Sci. Technol. 2015, 12, 041002. [Google Scholar] [CrossRef]
  12. Shi, L.; Xu, S.; Liu, J. Influences of assembly pressure and flow channel size on performances of proton exchange membrane fuel cells based on a multi-model. Int. J. Hydrog. Energy 2022, 47, 7902–7914. [Google Scholar] [CrossRef]
  13. Qiu, D.; Peng, L.; Liang, P.; Yi, P.; Lai, X. Mechanical degradation of proton exchange membrane along the MEA frame in proton exchange membrane fuel cells. Energy 2018, 165, 210–222. [Google Scholar] [CrossRef]
  14. Kang, H.; Zhan, Z.G.; Yang, X.F.; Zhang, Z.B.; Shi, J.R.; Jiang, P.X.; Pan, M. Numerical Study on the Stress Concentration Phenomenon in the Membranes of PEMFCs in an Assembled State. J. Energy Eng. 2020, 146, 04020053. [Google Scholar] [CrossRef]
  15. Lin, P.; Zhou, P.; Wu, C.W. A high efficient assembly technique for large PEMFC stacks Part I. Theory. J. Power Sources 2009, 194, 381–390. [Google Scholar] [CrossRef]
  16. Lee, S.J.; Hsu, C.D.; Huang, C.H. Analyses of the fuel cell stack assembly pressure. J. Power Sources 2005, 145, 353–361. [Google Scholar] [CrossRef]
  17. Junro, N. Fuel Cell Stack. Patent CN110277567A, 24 September 2019. [Google Scholar]
  18. Goebel, S.G.; Beutel, M.J.; Rock, J.A. Diffusion Medium for Seal Support in Improved Fuel Cell Design. U.S. Patent 7972741B2, 29 November 2007. [Google Scholar]
  19. Jeffrey, A.R.; Harald, S.; Kim, R.G. Stamped Full Cell Bipolar Plate. U.S. Patent 7781087B2, 24 August 2010. [Google Scholar]
  20. Masashi, S.; Yoshihito, K. Method for Producing Electrolyte Membrane ElectrodeL Assembly for Fuel Cells. Patent KR20090119675A, 19 November 2009. [Google Scholar]
  21. Zhang, Z.; Zhang, J.; Pan, T.; Liu, Y.; Yang, D. Finite element method modeling on sealant design of PEMFC metal bipolar plate. China Sci. 2017, 12, 1895–1901. [Google Scholar] [CrossRef]
  22. Liu, D.a.; Lai, X.; Ni, J.; Peng, L.; Lan, S.; Lin, Z. Robust design of assembly parameters on membrane electrode assembly pressure distribution. J. Power Sources 2007, 172, 760–767. [Google Scholar] [CrossRef]
  23. Zhang, J.; Hu, Y.; Han, C.; Zhang, H. Stress response and contact behavior of PEMFC during the assembly and working condition. Int. J. Hydrog. Energy 2021, 46, 30467–30478. [Google Scholar] [CrossRef]
  24. Zhou, Z.H.; Qiu, D.K.; Peng, L.F.; Lai, X.M. Channel/rib patterns optimization of a proton exchange membrane fuel cell by combining down-the-channel performance model and genetic algorithm. Int. J. Heat Mass Transf. 2022, 183, 122235. [Google Scholar] [CrossRef]
  25. Cui, T.; Chao, Y.J.; Van Zee, J.W. Sealing force prediction of elastomeric seal material for PEM fuel cell under temperature cycling. Int. J. Hydrog. Energy 2014, 39, 1430–1438. [Google Scholar] [CrossRef]
  26. Alizadeh, E.; Barzegari, M.M.; Momenifar, M.; Ghadimi, M.; Saadat, S.H.M. Investigation of contact pressure distribution over the active area of PEM fuel cell stack. Int. J. Hydrog. Energy 2016, 41, 3062–3071. [Google Scholar] [CrossRef]
  27. Zhang, J.; Hu, Y. Sealing performance and mechanical behavior of PEMFCs sealing system based on thermodynamic coupling. Int. J. Hydrog. Energy 2020, 45, 23480–23489. [Google Scholar] [CrossRef]
Figure 1. (a) Structural composition of unit cell from the bipolar plate perspective in a PEMFC stack. (b) Partial enlarged detail of neck zone.
Energies 16 02038 g001
Figure 2. General structure types of neck zone: (a) direct intake type, (b) flip intake type, (c) integrated intake type.
Energies 16 02038 g002
Figure 3. Finite element calculation model of the PEMFC neck zone.
Energies 16 02038 g003
Figure 4. Path-1 frame materials with the same thickness: (a) stress curves, (b) deformation curves. Path-2 PTFE frame materials with different thicknesses: (c) stress curves, (d) deformation curves.
Energies 16 02038 g004
Figure 5. Path-2 MEA frame materials with the same thickness: (a) stress curves, (b) deformation curves. Path-2 PTFE frame materials with different thicknesses: (c) stress curves, (d) deformation curves.
Energies 16 02038 g005
Figure 6. (a) Invasion rates of PTFE frames with different thicknesses. (b) Invasion rates of different frame materials of 0.1 mm.
Energies 16 02038 g006
Figure 7. Path-1: (a) sealing performance of different MEA frame materials, (b) sealing performance of different MEA frame thicknesses. Path-2: (c) sealing performance of different MEA frame materials, (d) sealing performance of different MEA frame thicknesses.
Energies 16 02038 g007
Table 1. Geometric Parameters of the PEMFC Stack Neck Zone.
ComponentLength, l (mm)Width/Height, w (mm)
Frame450.3
Sealing ring1.50.5
Bipolar plate0.40.1
Neck zone0.80.4
Table 2. Materials Parameters of the PEMFC Stack Neck Zone.
ComponentModulus of Elasticity, E (MPa)Poisson’s Ratio, VDensity, 𝜌 (kg m−3)
Gasket7.80.471000
Bipolar plate210,0000.32160
PTFE frame2000.251900
PEN frame8000.381200
SER frame60,0000.381200
Disclaimer/Publisher’s Note: The statements, opinions and data contained in all publications are solely those of the individual author(s) and contributor(s) and not of MDPI and/or the editor(s). MDPI and/or the editor(s) disclaim responsibility for any injury to people or property resulting from any ideas, methods, instructions or products referred to in the content.

