Article

Influence of Copper Foam on the Thermal Characteristics of Phase Change Materials

School of Energy and Power Engineering, University of Shanghai for Science and Technology, Shanghai 200093, China
*
Author to whom correspondence should be addressed.
Energies 2023, 16(4), 1994; https://doi.org/10.3390/en16041994
Submission received: 6 December 2022 / Revised: 14 January 2023 / Accepted: 14 February 2023 / Published: 17 February 2023
(This article belongs to the Special Issue Phase Change Materials: The Ideal Solution for Thermal Management)

Abstract

:
The phase change material is a hot research topic in solar thermal storage systems. However, the thermal conductivity of pure phase change materials is usually low, which hinders its application in facilities. In this study, copper foam is used to increase the thermal characteristics of the paraffin. Simulations are conducted to compare the melting characteristics of the pure paraffin and the paraffin/copper foam composite phase change material. A visualized experimental device was designed and built, and the copper foam composite phase change material, with a volume fraction of 15%, was prepared by filling part of the copper foam in the phase change material. The simulation results agree well with the experimental results. The root mean square errors of the temperature for the pure paraffin and the composite phase change material are 0.0223 and 0.0179, respectively. The experimental results show that the copper foam can enhance thermal conductivity and decrease melting time. It takes 870 s for the composite phase change material to melt, which is 3.44% less than that of the pure paraffin. This study deepens the understanding of the composite phase change material and provides a reference for the design of thermal energy storage devices.

1. Introduction

The phase change material (PCM) uses latent heat for thermal energy storage, which has the advantages of high energy density and a near-isothermal process for energy storage/discharge. It is a hot spot in the current research on solar thermal storage systems [1]. However, most of the pure PCM has low thermal conductivity, which limits their application in engineering facilities. The current research focus is on improving the thermal conductivity of PCMs and strengthening their heat transfer capacity. The commonly used methods include adopting fin-tubes [2,3] and PCM microcapsules [4,5], adding metal rings and graphite [6,7], filling PCM into porous matrixes such as metal foams [8,9,10], and so on.
Aluminum, copper, and nickel are often used as the metal foam in PCMs. Xu et al. [11] used Al2O3 as the porous matrix and enhanced the thermal conductivity of PCMs effectively. A new form stable phase change material for high temperature thermal energy storage was prepared and characterized. The optimum molding conditions were investigated to obtain a good compactness and stability. The results showed it can increase the performance of the PCM with relatively high stability. Guo et al. [12] investigated the PCM with copper foam to solve the problem of leaking and low thermal conductivity. The copper nano-wires and embedded flake graphite were adopted, and they provided not only greater capillary absorption force to prevent the leakage of liquid paraffin but also enhanced the thermal conductive and photo-thermal conversion efficiency of the phase change materials. The results showed that the thermal conductivity of the composite PCM is 20.5 times that of paraffin. It indicated great application prospects in the fields of solar thermal energy storage and thermal management. Xiao et al. [13] investigated the paraffin/carbon-foam composite PCMs and found that it affected the melting temperature and increased the thermal diffusivity. Additionally, the presence of the porous carbon foam affected the phase change behavior of pure paraffin and shifted its melting/freezing temperatures from 325.25/333.71 K to 324.88/334.31 K. Sauro et al. [14] used an infrared visualization method to define the melting front dynamic evolution. The results showed that a natural convection regime existed in the melting region, which aided in the melting process. The effect of gravity on the melting process was investigated by measuring time and dynamic evolution of the melted area. The results showed that the hyper-gravity condition accelerated the melting process. It was 12% faster, ranging from 5 g to 10 g. Diani et al. [15] used a 3D printer to produce the porous matrix and then embedded the paraffin in it. The results were given in terms of the temperature of the heated side, as well as of the phase change material, during the heating process. The temperature reached by the heated side and the time needed to completely melt the paraffin were compared at the different working conditions. Then, the thermal conductivities and diffusivities were evaluated by experiments.
The simulation of porous composite PCMs often adopts the method of constructing porous structures. Zhang et al. [16] established a three-dimensional phase change model of the solid–liquid transition in aluminum foam. He numerically studied the metal foam composites with a linear change of porosity from bottom to top. The results showed that the metal foam enhanced the heat storage rate of the system by enhancing the heat transfer capability of the bottom corner. The ratio of the total heat flux magnitude was always smaller than 1, which indicated that the heat conduction dominated the entire heat transfer process. Giorgio et al. [17] used COMSOL multiphysics to simulate the coupling coefficients of the effective thermal conductivity and the porosity of the PCMs. The PCM liquefaction was treated with the apparent heat capacity method, and the governing equations were solved with a finite element scheme. The results showed that the model could accurately predict the effective thermal conductivity. Hu et al. [18] established a visualization set-up to study the enhancement effect of metal foam on the PCMs. Numerical simulations were also conducted and exhibited good agreement with experimental data, which indicated that the modified Kelvin model could be employed to predict the thermal performance of the composite PCM. The results showed that the metal foam could significantly improve the thermal conductivity of the PCM. The melting time was reduced by 45% compared with pure paraffin, and the maximum temperature difference was reduced by 83.3%. Li et al. [19] established a hexahedral metal skeleton model to simulate the performance of the NaNO3/copper foam composite PCM. The results showed that when the composite material is solid, the heat transfer coefficient is increased by 28 times, and when the composite material is liquid, the heat transfer coefficient is increased by 3.1 times. Besides, the melting and solidification times of the PCM are greatly shortened. Feng et al. [20] established a tetrahedron model of a metal foam and simulated the heat dissipation effect of the fins. The volume-averaged method and the one temperature model were adopted to simulate both the finned metal foam and conventional plate fin and metal foam structures. The results showed that when the temperature difference was small, the single-temperature thermal equilibrium model could be used.
The PCM has both thermal conductivity and natural convection during the complicated melting process, and most of the melting process is dominated by thermal conductivity, especially at the bottom. There is still a lack of research on it. Therefore, a visual experimental setup was established to study the change process of the solid–liquid interface of the composite PCM during the melting process. At the same time, the strengthening mechanism of the metal foam during the melting process of the paraffin was analyzed. The three-dimensional numerical simulation of melting process of composite PCM was carried out by using a simplified geometric model of tetradecahedron foam metal to explore its strengthening effect. The study is useful for further study on the thermal characteristics of porous matrix composite PCM.

2. Experimental System

2.1. Experimental Set-Up

In this study, the PCM are made up of the paraffin and copper foam. The paraffin is filled in an aluminum semi-cylindrical cavity (R25 mm × 90 mm, wall thickness 2 mm) with a filling height of 65 mm. The copper foam has a pore size of 5 PPI, a height of 10 mm, and a filling rate of 15%. It contacts the wall surface of the aluminum container tightly, and the contact thermal resistance is neglected.
The thermal conductivity of the paraffin is obtained by a thermal property tester. The curve measured by the differential scanning calorimeter (DSC) is shown in Figure 1. The temperature is heated from 313.15 K to 363.15 K at a heating rate of 278.5 K/min. The phase change temperature, the specific heat, and the latent heat of the paraffin are obtained. The thermal properties of the material are shown in Table 1.
The experimental system consists of a DC power supply module, a measurement module, and a data acquisition module, as shown in Figure 2. The electric heating plate (accuracy of ±0.2 W) is fixed on the side and bottom surface of the aluminum cavity. The polytetrafluoroethylene (PTEE) splints (thickness of 50 mm) were used to fix the electric heating plate and to reduce the heat loss. The front of the device is a glass window to observe the changes in the solid–liquid interface during the melting process. The temperature of the environment is 298 K. The electric heating plate supplies a constant heat flow of 42 W. The internal temperature of the paraffin is measured with the platinum resistance. The temperature measurement points 1–4 are arranged sequentially from the bottom to the upper part of the cavity, and the height from the bottom surface is 10 mm, 30 mm, 50 mm, and 60 mm, respectively, as shown in Figure 3. The temperature is recorded every 1 s.

2.2. Experimental Error Analysis

The temperature measurement system consists of the temperature sensors, the data collector, and the computer. The error analysis of the bench is given by methods provided by Kline and Mcclintock. The PT-100 platinum resistance used in the experiment has an accuracy of ±0.15 °C. The data collector used is the Agilent 34972A, which has a measurement accuracy of 0.0004%. Therefore, the maximum relative error of temperature is:
δ t = ( 0 . 15 ) 2 + ( 0 . 0004 % ) 2 = 0 . 15

3. Models and Research Methods

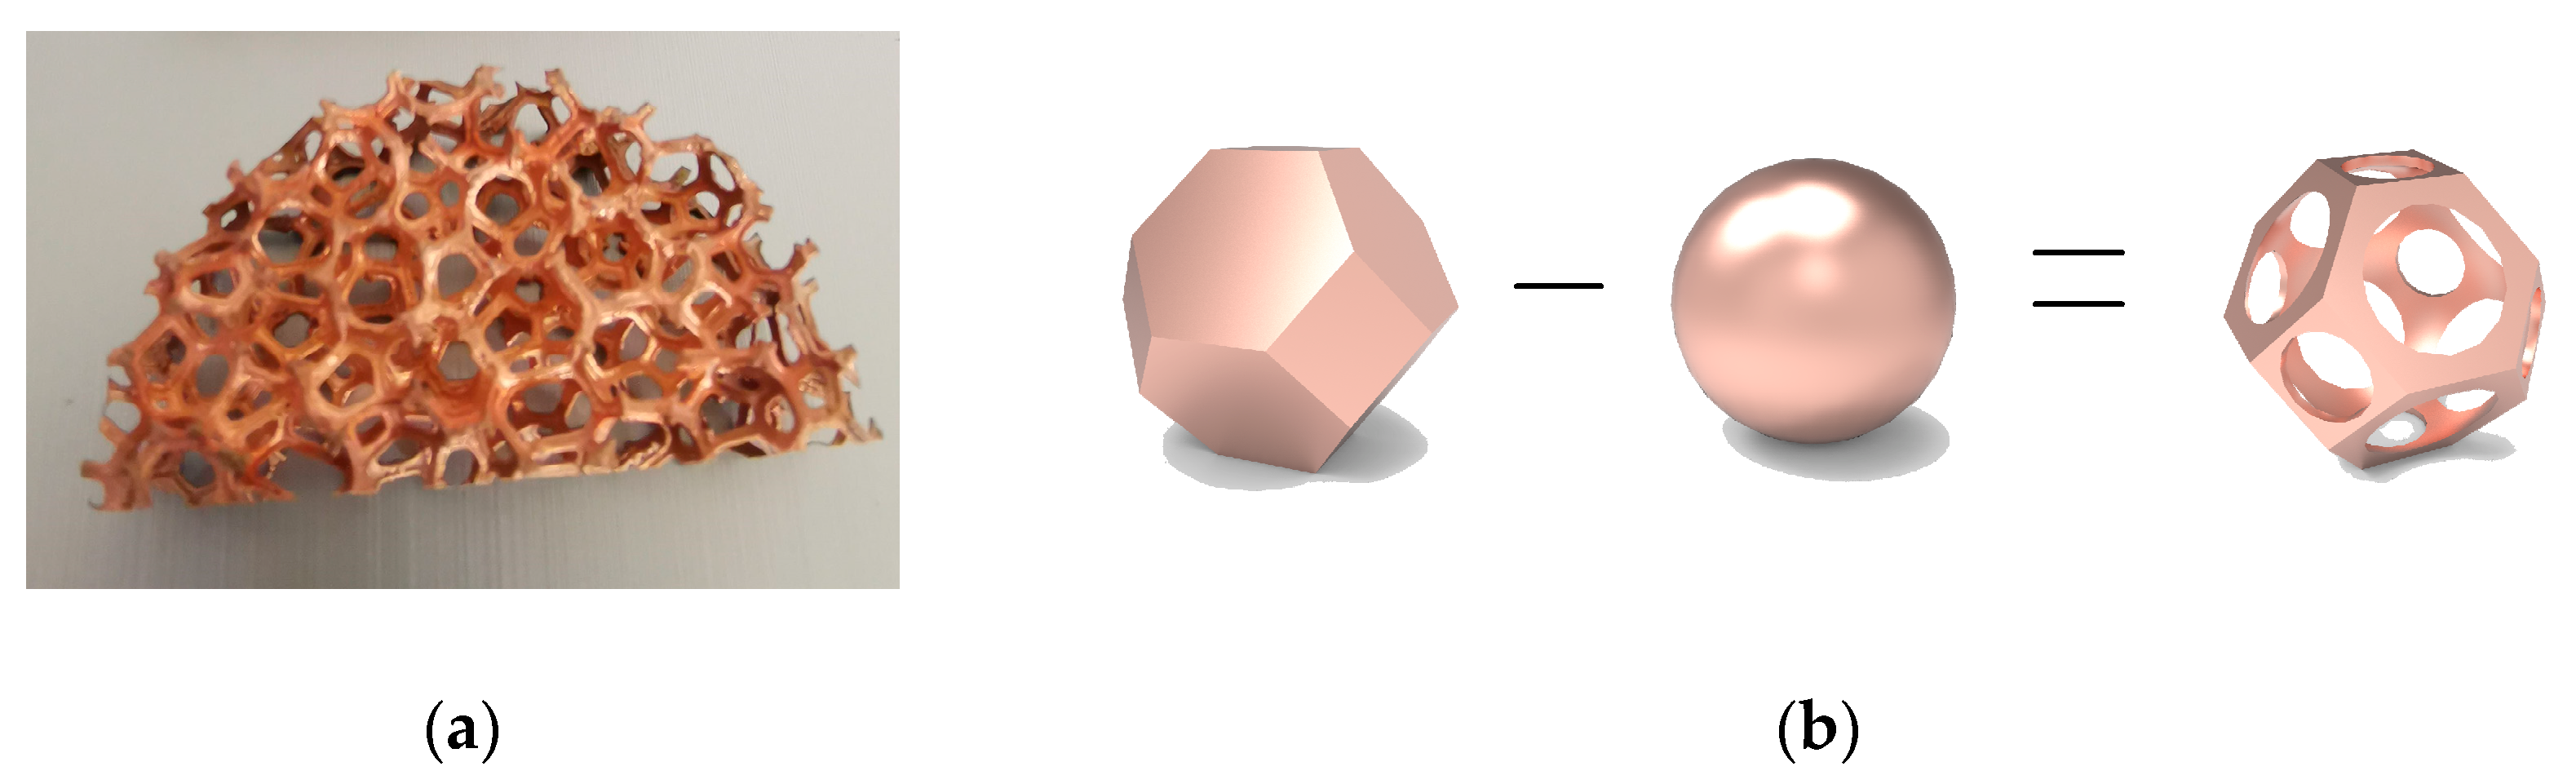
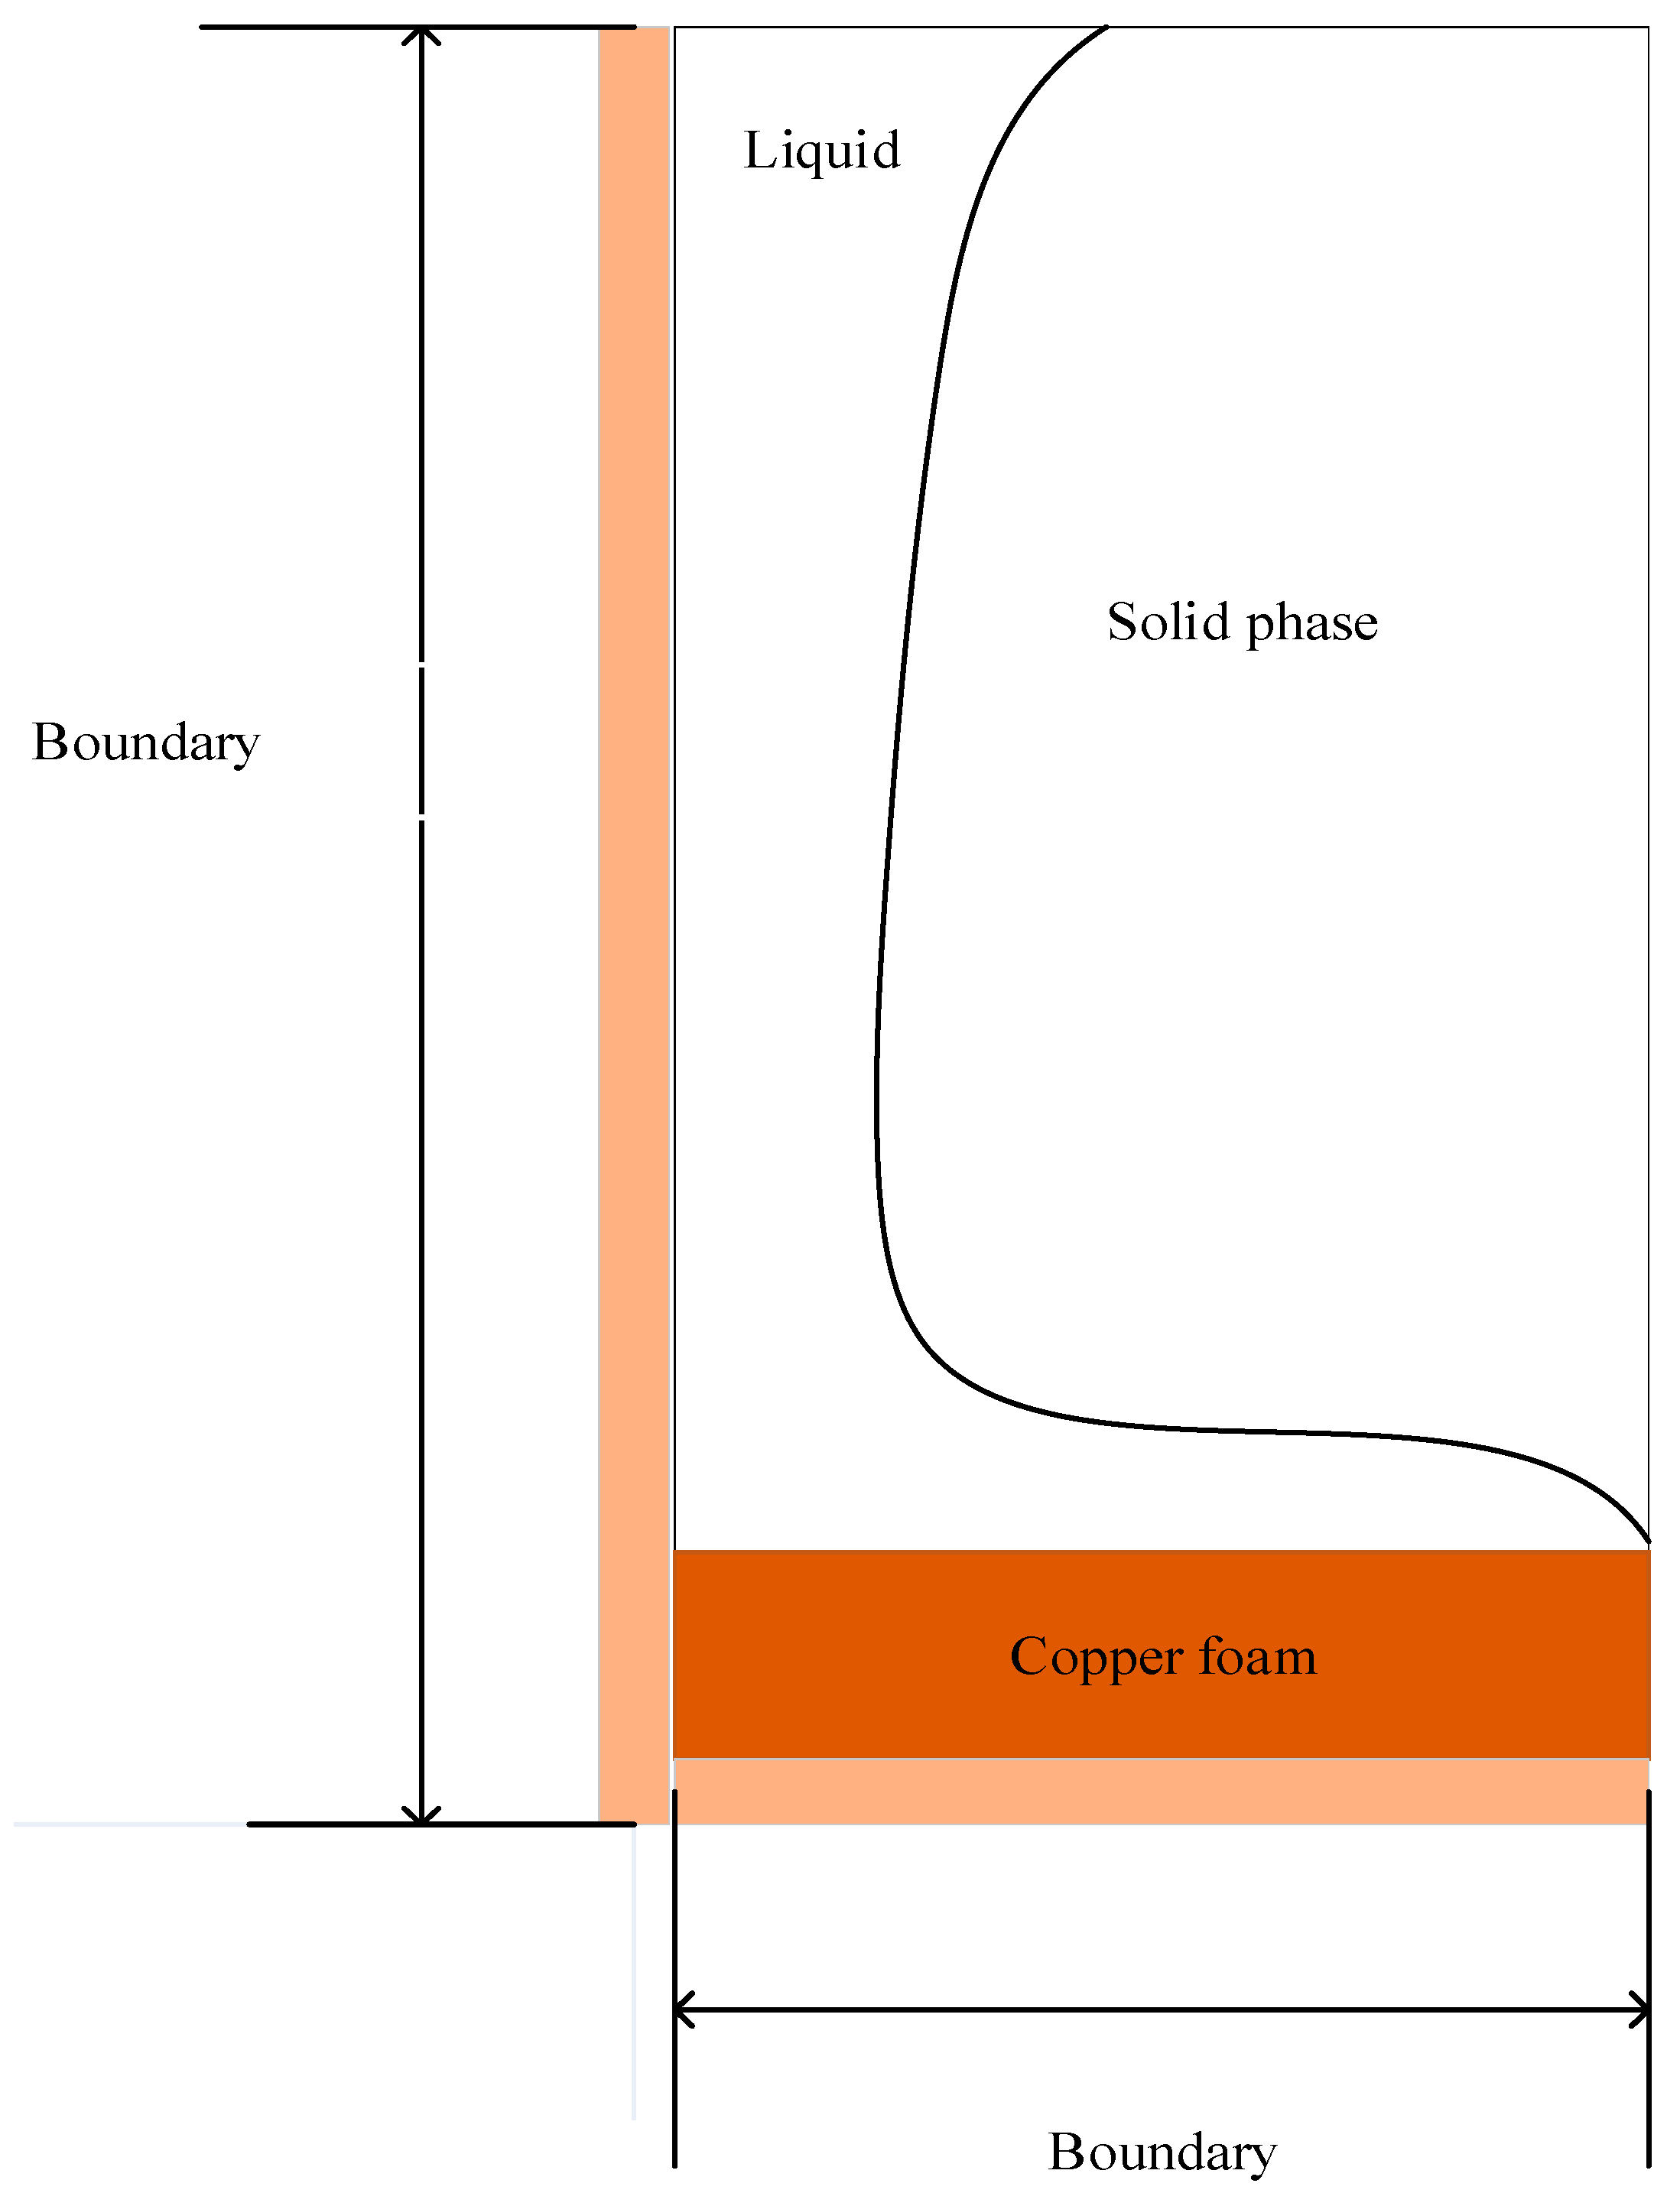
3.1. The Copper Foam Model

The simulation reconstructs the complex copper foam to a simplified spheroid-centered tetrakaidecahedron, as shown in Figure 4. The model is established by three-dimensional software. It neglects the structure inhomogeneity of the actual copper foam in different dimensions. The copper foam is deemed as the accumulation of many spheroid-centered tetrakaidecahedrons.

3.2. The Composite PCM Model

The model is symmetric. Therefore, only the x > 0 region is considered as the calculation domain. In the calculation, there are 26 copper balls laid in two layers, as shown in Figure 5. The mesh of the paraffin is not shown in Figure 5. Therefore, we can see the mesh more clearly.
The simulation domain is the filled paraffin part. The influence of the thermal radiation is ignored. The bottom and rear parts of the cavity are wrapped by PTFE. The boundary conditions are shown in Figure 6. Only the constant heat flow provided by the electric hot plate is considered, of which the boundary condition is 5200 W m−2. The liquid paraffin in the cavity is in contact with the air, and the convection coefficient is set as 30 W m−2 K−1. The model is symmetrically simplified. The convection coefficient between the front glass and the external air is 20 W m2 K−1.
The following assumptions are made in the simulation:
(1)
The thermal properties of the paraffin wax and the metal foams do not change with the temperature. They are set as constant values.
(2)
The Paraffin density is defined based on the Boussinesq hypothesis, of which the volume expansion during the melting process is ignored.
(3)
The liquid paraffin wax is incompressible Newtonian fluid and the flow is laminar flow in the study.
The phase change heat transfer process of the PCMs is governed by the continuous, momentum and energy equations [21]. It mainly refers to the conductive process of the heat source to the copper foam and the paraffin, the phase change process of the PCM, and the conductive and convective process of the paraffin.
u = 0
ρ f u t + ρ f u u = P + μ f 2 u + ρ f g β T f T m + A u
ρ f c p f T f t + ρ f c p f u T f = k f T f ρ f L f l t
The coefficient A in Equation (3) is related to the fraction of the liquid phase, and the expression is shown as follows.
A = C ( 1 f l ) 2 S + f l 3
where
f l =   1 T < T s o l i d u s T l i q u i d u s     T T l i q u i d u s     T s o l i d u s T s o l i d u s < T < T l i q u i d u s   0 T > T l i q u i d u s
In the above equations, C is a very large number, and S is a tiny number to avoid the denominator becoming 0. S has no physical meaning. It only works in the mathematical way. f l is the liquid fraction.
Import mesh file into ANSYS-FLUENT 18 to set initial conditions, solve model, time step, material property, internal iteration times, etc. The specific material property parameters are shown in Table 1. Melt-solidification model and unsteady-state calculation method were used to solve the problem. SIMPLE algorithm was used to solve the coupling of pressure and velocity, and PRESTO! format was used to discretize pressure. Third-Order MUSCL format was used for momentum equation and Second Order Upwind format was used for energy equation. By testing different time steps, after considering the calculation time and accuracy comprehensively, the time step is set at 0.02 s and the number of internal iterations is 30. The convergence criterion of the residual difference of continuity equation, momentum equation, and energy equation in each time step is 10−5, 10−5, and 10−6.
The grid independence verification is also done. The simulated results of different mesh numbers are shown in Figure 7. Three different models are conducted, of which the numbers are 2.9 million, 4.1 million, and 5.5 million, respectively. The change of the temperature point T2 is considered under these different numbers. As shown in Figure 7, the three curves are very close to each other. Compared to the temperature of the 2.9 million mesh model, the temperature errors of the 4.1 million mesh model and the 5.5 million mesh model are 3.96% and 3.03%, respectively, as shown in Table 2. Therefore, the mesh number of 2.9 million is selected in this manuscript to save the simulation time.

3.3. Rayleigh Number

The Rayleigh number is an important parameter for evaluating the strength of natural convection. It is an indication of whether the natural convection dominates in the melting process. With the assumption that the density is constant during the melting process of the paraffin, the Rayleigh number can be calculated from the following equation:
R a = ρ g α W 3 T h T m μ a

3.4. Error Analysis

The error between the theoretical calculated value and the measured value is analyzed by the root mean square error (RMSE) [22].
e = 1 n i = 1 n X i X ˜ i X ˜ i 2

4. Results and Analysis

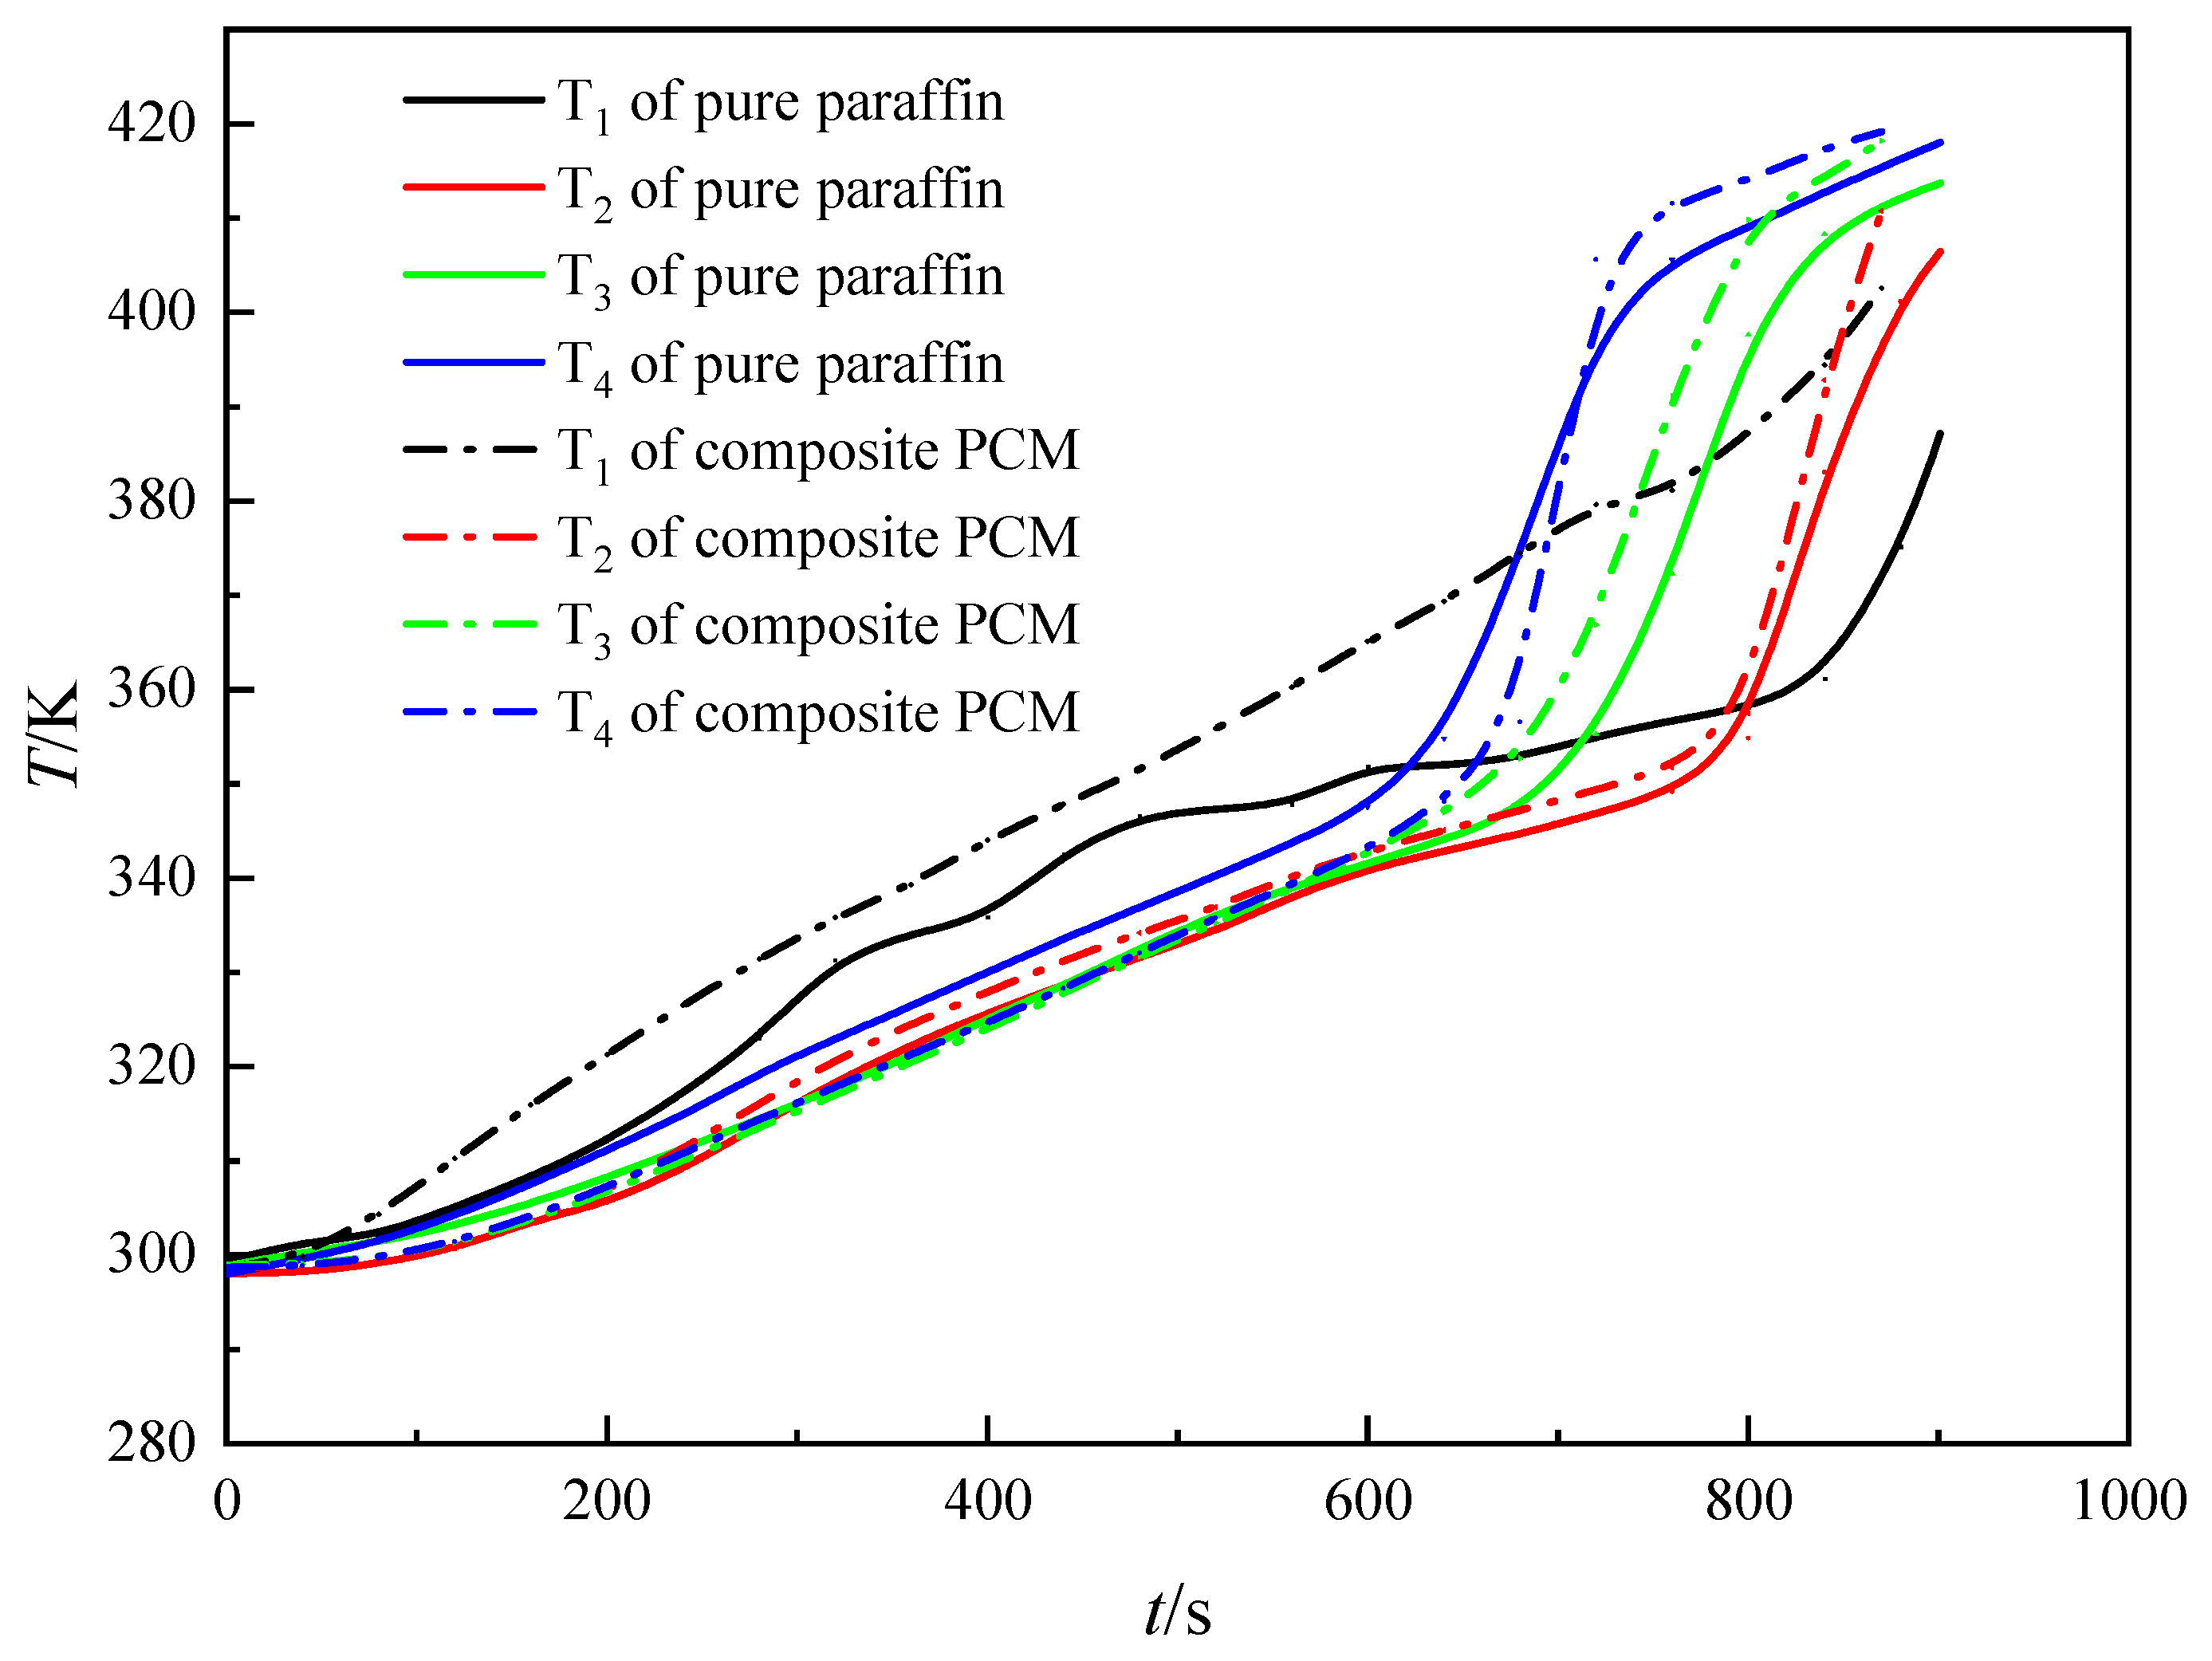
4.1. Temperature Field Analysis

The temperature change of pure paraffin and composite PCM during the melting process is shown in Figure 8. The phase transition process of paraffin occurs in a temperature range (348 K–365 K). In this range, the paraffin releases both sensible heat and latent heat, which includes the sensible heat of the solid phase, the latent heat of phase change process, and the sensible heat of the liquid phase. At first, the temperature rises at a relatively stable speed, which does not fluctuate much. Later, when the temperature rises to about 350 K, the temperature changing speed of the paraffin is accelerated. The natural convection of the liquid phase appears and increases during the melting process. The solid sedimentation in the liquid increases, which increases the internal heat transfer. The combination of the two effects accelerate the increase of the temperature.
For pure paraffin, the heat transfer process is dominated by conduction before 640 s in the melting process of the pure paraffin. The temperature of T1 is higher than the temperature of T2, T3, and T4. The temperature rising speeds of T2, T3, and T4 are more stable than that of T1. They rise at an almost constant speed. Then, the natural convection of the upper surface of the liquid paraffin increases, and it increases the melting process further. The temperature of T2, T3, and T4 become higher than T1. The temperature difference increases, which indicates that the convection increases. Finally, the melting process ended at 901 s. The temperature of T4 is 418 K, which is higher than others. The temperature difference between the top position and the bottom position is 31 K.
For paraffin/copper foam composite PCM, its melting process is faster than that of pure paraffin. Because the metal foam increases the internal heat transfer coefficient, this makes it easy to convey the heat from the heating plane to the internal PCM. As can be seen from Figure 7, the metal foam increases the conduction and decreases the convection at the bottom, which increases the temperature and decreases the temperature fluctuations. The temperature of T1 is 15 K higher than that of the pure paraffin at the end of the melting process. In the middle of the container, the metal foam also increases the conduction and convection. The temperatures of T2 and T3 are higher than those of the pure paraffin. At the top of the container, the convection dominates the heat transfer process, which makes the temperature of the pure paraffin higher. After 700 s, the temperature T4 of metal foam phase change material becomes slightly higher. The temperature of the paraffin/copper foam PCM at the middle and bottom position increases and becomes higher than that of the pure paraffin, which increases the upper temperature by conduction. At 870 s, the melting process ends, which is 3.44% less than that of pure paraffin. The temperature difference is 16 K, which is 48.39% less than that of pure paraffin. It indicates that the metal foam can effectively decrease the temperature inhomogeneity of the PCM.

4.2. Numerical Simulation

The simulated and experimental solid/liquid interface distribution of the PCMs are shown in Figure 9 and Figure 10. In the simulation, the expansion of the melting process is ignored but the forces generated by density differences are still considered, even at the Boussinesq hypothesis.
At 600 s, the bottom and side paraffin near the heating wall starts to melt. The solid/liquid interface is nearly perpendicular to the heating surface. As the solid is heavier than the liquid, it flows downwards and the liquid flows upwards, which forms a convection. Along with the melting process, the liquid region increases. The melting speed at the upper region is higher than that at the lower region. The phase change interface becomes tilted and the melting speed increases. At about 780 s, the solid paraffin is completely wrapped by the liquid paraffin and a vortex region is formed in the upper right area.
The simulated results agree well with the experimental results. For the pure paraffin, the melting process ends at 882 s, which is 2.2% faster than the experimental results. For the paraffin/copper foam composite PCM, the melting process ends at 842 s, which is 3.3% faster than the experimental results.
Compare with the pure paraffin, the paraffin/copper foam composite PCM has a shorter melting time, and its bottom liquid/solid interface is a bit higher, which indicates that the metal foam can effectively increase the conduction of the PCM.
Both the simulated results of the paraffin/copper foam composite PCM and pure paraffin PCM are faster than the experimental results. This is because the heat leaks from the boundary of the vessel. Besides, the thermal properties of the material in the simulation have some deviations from the real value, such as the viscosity, the thermal expansion, and so on. Particularly, the expansion of the liquid is ignored in the simulation, which also brings a slight amount of deviation.
The temperature differences of the simulated results and the experimental results are shown in Figure 11. The simulated results agree well with the experimental results. The trending of the curves are quite similar and the temperature difference is not very big. The temperature of the composite PCM is higher than that of the pure paraffin during the whole melting process. The final temperature of the experiments is higher than the simulated one. The reason may be that when the experiment reaches 800 s, the convection dominates as the middle and upper paraffin melting into liquid, and it is in a transition state from laminar flow to turbulent flow, which is hard to simulate. The root mean square errors of pure paraffin and composite PCM are 0.0223 and 0.0179, respectively.

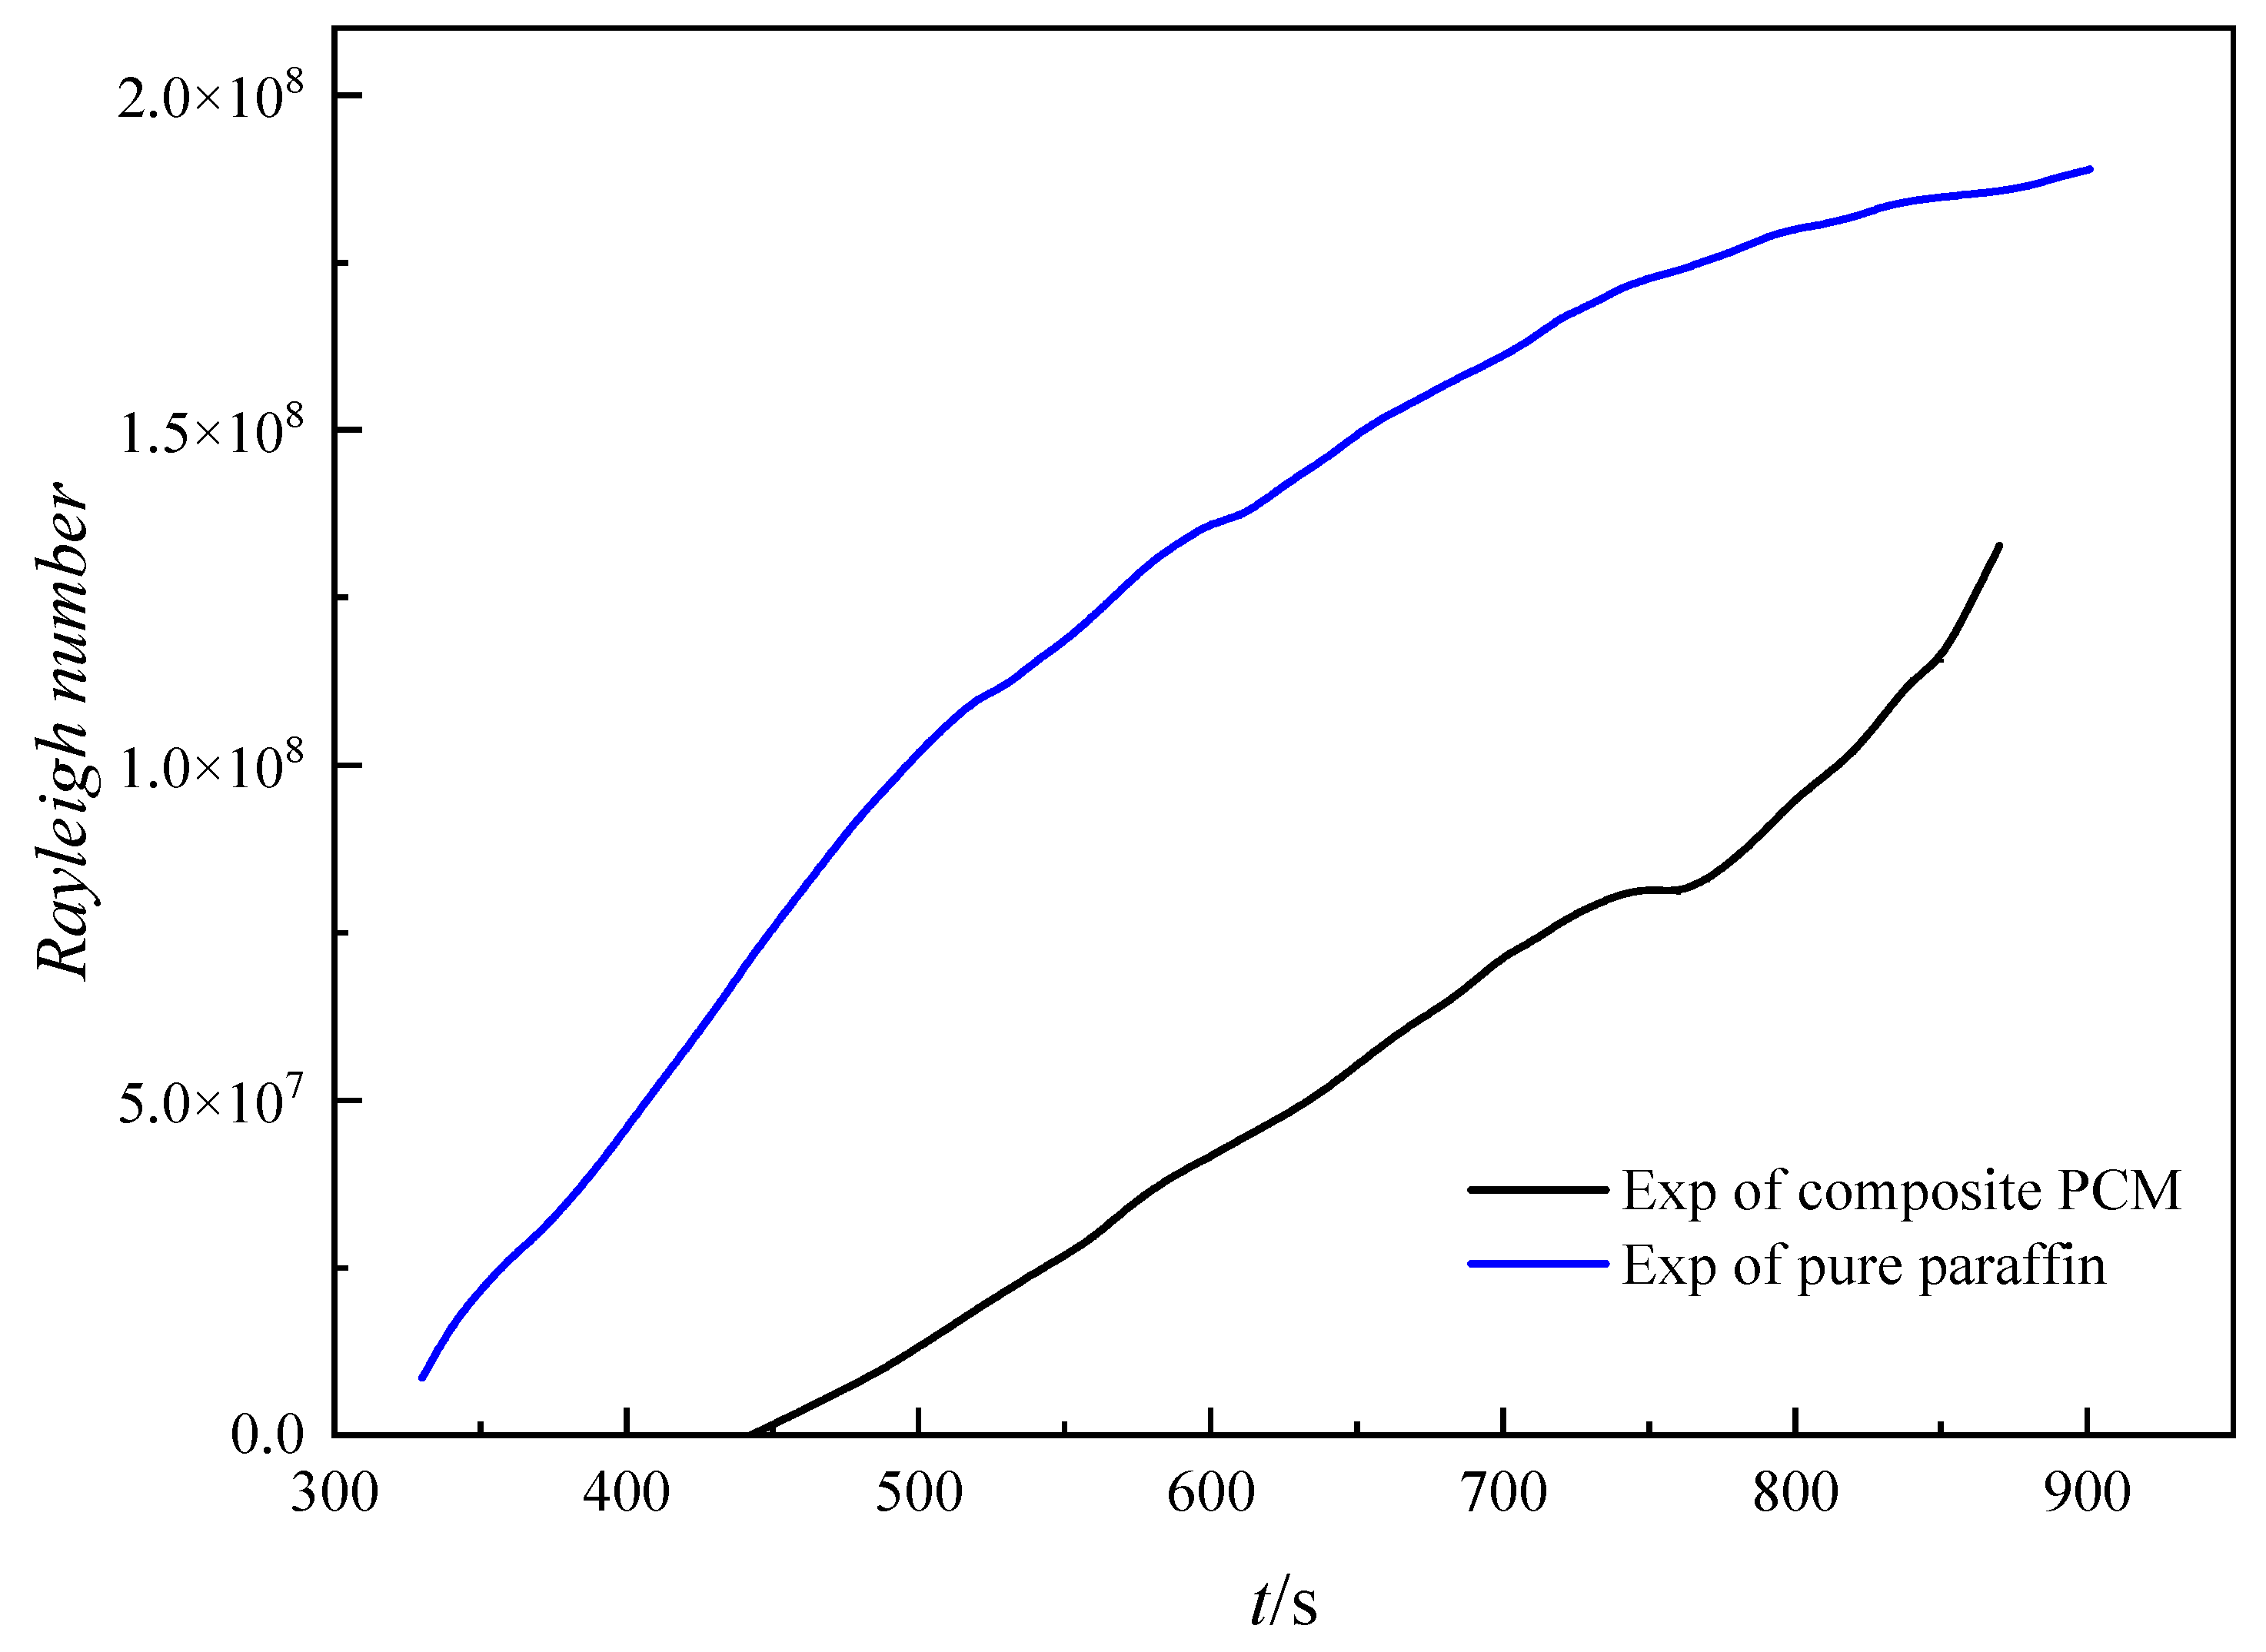
4.3. Analysis of the Internal Convection

Based on the Rayleigh number, the internal convection of the melting process is further analyzed in this part.
Considering the case in Figure 12, the main part of the PCM is in a solid phase. The liquid phase wraps around it. The metal foam is filled at the bottom of the container. The main convection boundary is the bottom and left of the solid phase. The metal foam has a very high conduction coefficient, so its temperature is considered the same as the bottom vessel boundary.
The temperatures of the boundaries are the same. They are both equal to the heating temperature. The temperature of the copper foam is also relatively high. It is quite close to the temperature of the boundary. Because the thermal conductivity of the copper foam is very high, it can transfer heat easily. The temperature of the PCM is the phase change temperature. At the beginning, there is no liquid phase in the PCM. It is all in solid phase. During the melting process, the liquid phase wraps the solid phase gradually.
The experimental Rayleigh numbers of pure paraffin wax and composite PCM calculated by Equation (7) are shown in Figure 13. It can be seen that the Rayleigh number starts from almost zero and begins to increase as the time goes, which indicates there is no natural convection at the beginning and the convection gradually increases as the increase of the liquid. Besides, the Rayleigh number of the pure paraffin is larger than that of the composite PCM, which indicates that the convection of the pure paraffin is greater. Along with the melting process, the difference of the Rayleigh number first increases and then decreases. At 650 s, the difference is the largest, which is 9.4 × 10⁷.
Wu [23] used the N-S equation to investigate the transition process of the convection and proposed that when the Rayleigh number is close to 108, the convection will transit from laminar flow to turbulent flow. Thus, the transition time of the pure paraffin and the composite PCM are 497 s and 814 s, respectively. The rates of the transition time to the total melting time are 44.8% and 6.4%, respectively.
Therefore, the metal foam reduces the convection strength of the paraffin in the melting process. However, it enhances the thermal conductivity of the material, which makes the total melting time decrease. Hence, the total effects of the metal foam improve the heat storage/release rate of the PCM, thereby improving the thermal characteristics of the heat storage devices.

5. Conclusions

The melting processes of the pure paraffin and the composite PCM were analyzed by simulations and experiments. The heat transfer mechanism of the PCM was investigated. The effects of the copper foam on the thermal conductivity and convection of the PCM are studied.
(1)
A direct numerical simulation of melting process of composite phase change materials was developed using a simplified three-dimensional model of tetradecahedron metal foam. The simulation results agree well with the experimental results. The root mean square errors of the temperature for pure paraffin and composite PCM are 0.0223 and 0.0179, respectively.
(2)
The copper foam strengthens the thermal conductivity of the PCM. It takes 870 s for the composite PCM to melt, which is 3.44% less than that of the pure paraffin. Besides, the internal temperature difference is 16 K, which is 48.39% less than that of the pure paraffin.
(3)
The copper foam decreases the Rayleigh number of the PCM, which weakens the convection process. The maximum difference of the Rayleigh number is 9.4 × 10⁷.
In this paper, the effects of foam copper on PCM thermal characteristics (such as conduction and convection) were studied experimentally and numerically. The three-dimensional simplified model of open tetradecahedron metal foam is adopted, and the simulation results are in good agreement with the experimental results, which provides a reference for the design of energy storage devices. However, due to the complex three-dimensional structure of metal foam, the number of grids is large, and the resource consumption of numerical simulation calculation for larger heat storage devices and larger pore density foam metal composite phase change materials is huge, which has certain limitations.

Author Contributions

Conceptualization, X.Y., Z.W. and H.Z.; Methodology, J.H.; Software, Z.W.; Validation, J.H. and H.Z.; Formal analysis, X.Y.; Investigation, J.H. and Z.W.; Data curation, X.S.; Writing—review & editing, X.Y. and X.S.; Supervision, Z.W. and H.Z.; Project administration, Z.W. and H.Z. All authors have read and agreed to the published version of the manuscript.

Funding

This research was funded by the [National Natural Science Foundation of China] grant number [52206104], the [Shanghai Municipal Natural Science Foundation] grant number [ZR1438600], the [Special Project of Biomedical Science and Technology Support of Shanghai Science and Technology Innovation Action Plan] grant number [21S31900200], and [Qingdao Science and Technology Plan key research and development project] grant number [21-1-2-6-nsh].

Data Availability Statement

The data that support the findings of this study are available from the corresponding author upon reasonable request.

Conflicts of Interest

The authors declare no conflict of interest.

Nomenclature

Roman Symbols
A coefficient[-]
a thermal diffusivity[m2/s]
c p specific heat[J/kg K]
C coefficient[-]
e error[-]
f fraction[-]
g gravitational acceleration[m/s2]
k conductivity coefficient[W/m K]
L latent heat[J/kg]
n number[-]
P pressure[Pa]
R a Rayleigh number[-]
S coefficient[-]
t time[s]
T temperature[K]
T m phase-change temperature[K]
u velocity[m/s]
W equivalent length[m]
X experimental value[-]
X ˜ theoretical value[-]
Greek Symbols
α coefficient of cubic expansion[1/K]
β expansion coefficient[1/K]
δ error[-]
μ viscosity[Pa s]
ρ density[kg/m3]
partial differential[-]
nabla operater[-]
Subscripts
f phase change material
h high temperature
l liquid
m phase change temperature

References

  1. Yang, T.; King, W.P.; Miljkovic, N. Phase Change Material-Based Thermal Energy Storage. Cell Rep. Phys. Sci. 2021, 2, 100540. [Google Scholar] [CrossRef]
  2. Herbinger, F.; Groulx, D. Experimental Comparative Analysis of Finned-Tube PCM-Heat Exchangers Performance. Appl. Therm. Eng. 2022, 211, 118532. [Google Scholar] [CrossRef]
  3. Ahmed, S.; Abderrahmane, A.; Saeed, A.M.; Guedri, K.; Mourad, A.; Younis, O.; Botmart, T.; Shah, N. Melting Enhancement of PCM in a Finned Tube Latent Heat Thermal Energy Storage. Sci. Rep. 2022, 12, 33–45. [Google Scholar] [CrossRef] [PubMed]
  4. Wang, S.; Lei, K.; Wang, Z.; Wang, H.; Zou, D. Metal-Based Phase Change Material (PCM) Microcapsules/Nanocapsules: Fabrication, Thermophysical Characterization and Application. Chem. Eng. J. 2022, 438, 135559. [Google Scholar] [CrossRef]
  5. Trivedi, G.V.N.; Parameshwaran, R. Cryogenic Conditioning of Microencapsulated Phase Change Material for Thermal Energy Storage. Sci. Rep. 2020, 10, 423–435. [Google Scholar] [CrossRef]
  6. Yazici, M.; Saglam, M.; Aydin, O.; Avci, M. Thermal Energy Storage Performance of PCM/Graphite Matrix Composite in a Tube-in-Shell Geometry. Therm. Sci. Eng. Prog. 2021, 23, 100915. [Google Scholar] [CrossRef]
  7. Li, W.; Dong, Y.; Zhang, X.; Liu, X. Preparation and Performance Analysis of Graphite Additive/Paraffin Composite Phase Change Materials. Processes 2019, 7, 447. [Google Scholar] [CrossRef] [Green Version]
  8. Falcone, M.; Rehman, D.; Dongellini, M.; Naldi, C.; Pulvirenti, B.; Morini, G.L. Experimental Investigation on Latent Thermal Energy Storages (LTESs) Based on Pure and Copper-Foam-Loaded PCMs. Energies 2022, 15, 4894. [Google Scholar] [CrossRef]
  9. Noghrehabadi, A.; Behbahan, A.S.; Wong, C.; Behbahani-Nejad, M. Investigation on the Effect of Metal Foam Properties on the PCM Melting Performance Subjected to Various Heat Fluxes. J. Comput. Appl. Mech. 2020, 52, 320–331. [Google Scholar]
  10. Thakur, A.K.; Ahmed, M.S.; Kang, H.; Prabakaran, R.; Said, Z.; Rahman, S.; Sathyamurthy, R.; Kim, J.; Hwang, J.Y. Critical Review on Internal and External Battery Thermal Management Systems for Fast Charging Applications. Adv. Energy Mater. 2022, 2202944. [Google Scholar] [CrossRef]
  11. Xu, Y.; He, Y.-L.; Zhu, G.-H.; Lv, S.; Shan, B. Al/Al2O3 Form-Stable Phase Change Material for High Temperature Thermal Energy Storage. Energy Procedia 2017, 2017, 4328–4333. [Google Scholar] [CrossRef]
  12. Guo, P.; Zhao, C.; Sheng, N.; Zhu, C.; Rao, Z. Enhancement of Solar Thermal Storage Properties of Phase Change Composites Supported by Modified Copper Foam. Sol. Energy Mater. Sol. Cells 2022, 247, 111950. [Google Scholar] [CrossRef]
  13. Xiao, X.; Zhang, P. Morphologies and Thermal Characterization of Paraffin/Carbon Foam Composite Phase Change Material. Sol. Energy Mater. Sol. Cells 2013, 117, 451–461. [Google Scholar] [CrossRef]
  14. Filippeschi, S.; Mameli, M.; Di Marco, P. Experimental Analysis of the Melting Process in a PCM/Aluminum Foam Composite Material in Hypergravity Conditions. Interfacial Phenom. Heat Transf. 2018, 4, 451–467. [Google Scholar] [CrossRef] [Green Version]
  15. Diani, A.; Moro, L.; Rossetto, L. Melting of Paraffin Waxes Embedded in a Porous Matrix Made by Additive Manufacturing. Appl. Sci. 2021, 11, 5396. [Google Scholar] [CrossRef]
  16. Zhang, Z.; He, X. Three-Dimensional Numerical Study on Solid-Liquid Phase Change within Open-Celled Aluminum Foam with Porosity Gradient. Appl. Therm. Eng. 2017, 113, 298–308. [Google Scholar] [CrossRef]
  17. Di Giorgio, P.; Iasiello, M.; Viglione, A.; Mameli, M.; Filippeschi, S.; Di Marco, P.; Andreozzi, A.; Bianco, N. Numerical Analysis of a Paraffin/Metal Foam Composite for Thermal Storage. J. Phys. Conf. Ser. 2017, 2016, 12032. [Google Scholar] [CrossRef]
  18. Hu, X.; Zhu, F.; Gong, X. Experimental and Numerical Study on the Thermal Behavior of Phase Change Material Infiltrated in Low Porosity Metal Foam. J. Energy Storage 2019, 26, 101005. [Google Scholar] [CrossRef]
  19. Li, Z.; Wu, Z.-G. Numerical Study on the Thermal Behavior of Phase Change Materials (PCMs) Embedded in Porous Metal Matrix. Sol. Energy 2014, 99, 172–184. [Google Scholar] [CrossRef]
  20. Feng, S.; Shi, M.; Li, Y.; Lu, T.J. Pore-Scale and Volume-Averaged Numerical Simulations of Melting Phase Change Heat Transfer in Finned Metal Foam. Int. J. Heat Mass Transf. 2015, 90, 838–847. [Google Scholar] [CrossRef]
  21. Yang, X.; Bai, Q.; Guo, Z.; Niu, Z.; Yang, C.; Jin, L.; Lu, T.J.; Yan, J. Comparison of direct numerical simulation with volume-averaged method on composite phase change materials for thermal energy storage. Appl. Energy 2018, 229, 700–714. [Google Scholar] [CrossRef]
  22. Kline, S.; McClintock, F.A. The Description of Uncertainties in Single Sample Experiments. Mech. Eng. 1953, 75, 3–9. [Google Scholar]
  23. Wu, W.; Chang, K.-C. Revisiting Transition to Chaos of Air in a Cubical Cavity Heated from One Vertical Side and Cooled from the Opposite Side. AIAA Thermophys. Conf. 2004, 2004, 2–9. [Google Scholar]
Figure 1. Differential scanning calorimeter (DSC) curves of pure paraffin.
Energies 16 01994 g001
Figure 2. Performance testing diagram of the paraffin/copper foam composite PCMs.
Energies 16 01994 g002
Figure 3. Temperature measuring point location distribution.
Energies 16 01994 g003
Figure 4. Copper foam. (a) Optic image. (b) Simplified structure.
Energies 16 01994 g004
Figure 5. Mesh of paraffin/copper foam composite PCM.
Energies 16 01994 g005
Figure 6. Boundary conditions of the model.
Energies 16 01994 g006
Figure 7. Temperature of T2 at different grids.
Energies 16 01994 g007
Figure 8. Temperature distribution at different temperature measuring points in PCM.
Energies 16 01994 g008
Figure 9. Experimental and simulated results of the melting pure paraffin.
Energies 16 01994 g009
Figure 10. Experimental and simulated results of the melting paraffin/copper foam composite PCM.
Energies 16 01994 g010
Figure 11. Temperature distribution of pure paraffin and composite PCM.
Energies 16 01994 g011
Figure 12. Schematic of the solid–liquid interface.
Energies 16 01994 g012
Figure 13. Rayleigh numbers of the pure paraffin and the composite PCM.
Energies 16 01994 g013
Table 1. Thermal properties of pure paraffin.
NameDensitySolid
Specific Heat
Liquid
Specific Heat
Thermal
Conductivity
Phase Transition
Start Point
Phase Change
Termination Point
Phase Change
Latent Heat
Dynamic
Viscosity
Coefficient of
Thermal Expansion
kg/m3J kg−1·K−1J kg−1·KW m−1·K−1KKJ kg−1Pa·sK−1
paraffin837175024500.305348365218,4000.0040.00583
Table 2. Grid independence verification.
Girds (Million)Melting Time (s)Error Compared to 2.9 Million
2.9858-
4.18243.96%
5.58323.03%
Disclaimer/Publisher’s Note: The statements, opinions and data contained in all publications are solely those of the individual author(s) and contributor(s) and not of MDPI and/or the editor(s). MDPI and/or the editor(s) disclaim responsibility for any injury to people or property resulting from any ideas, methods, instructions or products referred to in the content.

