Article

A Comparison of Grid-Connected Local Hospital Loads with Typical Backup Systems and Renewable Energy System Based Ad Hoc Microgrids for Enhancing the Resilience of the System

1
Center for Research on Microgrids (CROM), AAU Energy, Aalborg University, 9220 Aalborg, Denmark
2
Department of Electrical Engineering, Quaid-e-Awam University of Engineering, Science and Technology, Nawabshah 67450, Pakistan
3
Department of Electrical and Computer Engineering, Hawassa University, Hawassa P.O. Box 05, Ethiopia
4
Department of Project Management, Universidad Internacional Iberoamericana, Campeche 24560, Mexico
*
Authors to whom correspondence should be addressed.
Energies 2023, 16(4), 1918; https://doi.org/10.3390/en16041918
Submission received: 22 December 2022 / Revised: 30 January 2023 / Accepted: 2 February 2023 / Published: 15 February 2023
(This article belongs to the Special Issue Control of Renewable Energy Sources in Power Systems and Smart Grids)

Abstract

:
Extreme weather conditions and natural disasters (ND) are the main causes of power outages in the electric grid. It is necessary to strengthen the electrical power system’s resilience during these catastrophic occurrences, and microgrids may be seen as the best way to achieve this goal. In this paper, two different energy system scenarios were proposed for increasing the resiliency of the electric power system during random outages. In the first scenario, a diesel generator (DG) was used to deliver energy to key loads during grid disruptions, in conjunction with a utility electric grid (UEG) and local electric load (ELL). A grid-connected ad hoc microgrid (MG) with a photovoltaic (PV) system, a battery energy storage (BES) system, and local electric loads made up the second scenario. The PV system and the BES system were used to supply the key loads with electricity during the outage. The major aim of this research was to compare the two resilient-based systems from the perspectives of technology, economics, and the environment. Given that it requires greater resilience than the other loads during severe weather, a hospital load on Indonesia’s Lombok Island was chosen as the critical load. The objective function considers the system’s predefined constraints to reduce the overall net present cost (NPC) and the cost of energy in order to maximize the system resilience (COE). The Optimization of Multiple Energy Resources (HOMER) Grid simulated a 3-day outage in August 2021, and the results demonstrated that the resiliency enhancement for both scenarios was nearly identical. The first scenario resulted in fewer CO2 emissions; however, the second scenario delivered lower operating costs and COE. The simulation’s findings showed that system 1 created an annual emission of 216.902 kg/yr while system 2 only produced an emission of 63.292 kg/yr. This study shows that since RES-based MGs don’t burn fossil fuels to generate power, they are more environmentally friendly resources.

1. Introduction

Currently, natural disasters and extreme weather conditions have significant effects on electrical power networks. Among the most crucial problems of electric power systems are the vulnerability of supply during natural disasters (NDs) and extreme weather conditions, such as earthquakes, floods, and storms in the rings of fire, which have increased globally day by day [1]. These events are high-impact, low-probability (HILP) events but threaten the critical power supply infrastructure of most countries in the world. Most of the power outages are directly linked to these natural disasters and extreme weather events [2].

1.1. Related Work

Researchers have performed a variety of different studies to address the resiliency of the various hybrid systems.
For instance, in 2011, a tsunami and earthquake in Japan caused a power outage for 8.5 million customers for approximately a week [3]. When Superstorm Sandy hit the United States of America’s (USA) east coast in 2012, it caused power outages for almost one million customers [4]. Similarly, a storm hit the United Kingdom (UK) in 2015, causing a power outage and affecting the electricity supply of 0.1 million customers for almost 16 hours [5]. Hurricane Maria’s landfall in Puerto Rico in 2017 strongly affected the power networks of this island; some users faced power outages for 10 months [6]. Indonesia has also experienced numerous NDs. On average, at least one major ND has happened in Indonesia since 2004, when the country was hit by a tsunami. Earthquakes, floods, and even volcanic eruptions are among the NDs experienced in Indonesia [7]. According to Indonesia’s National Disaster Mitigation Agency (BNPB), 3622 NDs, including tornadoes, floods, and landslides, occurred across the country in 2019. As a standout example, a 6.9-magnitude quake on the island of Java in August 2019 resulted in a 9 hour blackout affecting 21.3 million customers, including industries, mass rapid transit, and the telecommunications system [7]. NDs and extreme weather events will become more frequent and last longer as the world’s climate changes [7].
Resiliency is often defined in the literature as “the capability of the power system to sustain the high impact of low probability events and fast restoration times” [8,9,10,11]. To enhance the resiliency of a power system, two options are often suggested in the literature. The first option involves using a traditional diesel generator in combination with a battery energy storage (BES) system [12], and the second option involves using renewable energy resources (RES) with a BES, which is the more expensive option. As previously stated, some critical loads are not cost-effective; for example, in hospitals, an outage could endanger patients’ lives; in this case, a resilient power supply to save lives must be considered. Compared to a renewable energy system, traditional diesel generators are less expensive up front and remain idle for the majority of the time. RES can be utilized for resiliency enhancement for the following purposes:
(a)
Reduced dependency on oil and emission-free energy;
(b)
The modern PV system and the BES reduce the cost and increase efficiency [13].
(c)
RES and BES-based island MGs for critical loads with improved resilience [14].
Reference [15] offers a resilience-based method after a significant disaster by deploying MGs to restore vital facilities on the distribution feeders. The proposed method is applied on the campus of Washington State University as a case study to restore power to the hospital and the city hall during a blackout. This research solely examines two distinct backup scenarios with regard to technological, economic, and environmental factors. Instead of enhancing the overall grid resilience, the paper focuses on demand-side power system resilience enhancement [16,17,18]. The design and testing of a handy pipe defect recognizer (HPD) based on a personal image classifier were included [19]. The development and marketing of a low-cost IOT-based heart rate monitoring system were presented by the authors in [20]. The distributed multi-energy storage cooperative optimization control strategy for improving power grid voltage stability was presented by the authors in [21]. To increase the stability of shaky networks, researchers in [22] suggested the positioning and sizing of utility-size battery energy storage devices. In order to increase the frequency stability of a low inertia grid, the writers in [23] presented an improved adaptive hybrid controller for the battery energy storage systems. The improvement of grid stability through the use of battery energy storage devices on tiny islands was discussed by the authors in [24].

1.2. Research Gaps

Based on the above discussion, it can be concluded that there is an urgent need to provide electricity to critical loads during power outages. The reliability of the DG systems is low as compared to other systems [12]. As a result, the RES with a BES system has greater resilience for the above-mentioned critical loads.

1.3. Contributions

The contributions of this research are as follows:
1.
In this study, two systems were used for resiliency enhancement of the critical load, i.e., a local hospital load during the power outage.
2.
The two systems under study were:
System 1: utility electric grid (UEG) and local electric load (ELL) with a DG.
System 2: Grid-connected Photovoltaic (PV) systems, battery energy storage systems, and local electric loads, which are all included in an ad hoc MG.
3.
A comparison was performed between the two resilient-based systems from the perspectives of technology, economics, and the environment.
4.
The objective function was used to consider the system’s predefined constraints to reduce the overall net present cost (NPC) and cost of energy in order to maximize system resilience (COE).

1.4. Organization of the Manuscript

The organization of this study is as follows:
The general concept of standby redundancy, its application to enhance resiliency, and its corresponding economic aspects are discussed in Section 1. The input data for the system analysis for Lombok Island is found in Section 2. The modeling of electrical systems is introduced in Section 3. The case studies and discussion of the simulation findings are presented in Section 4. Finally, Section 5 concludes the paper.

2. Methodology

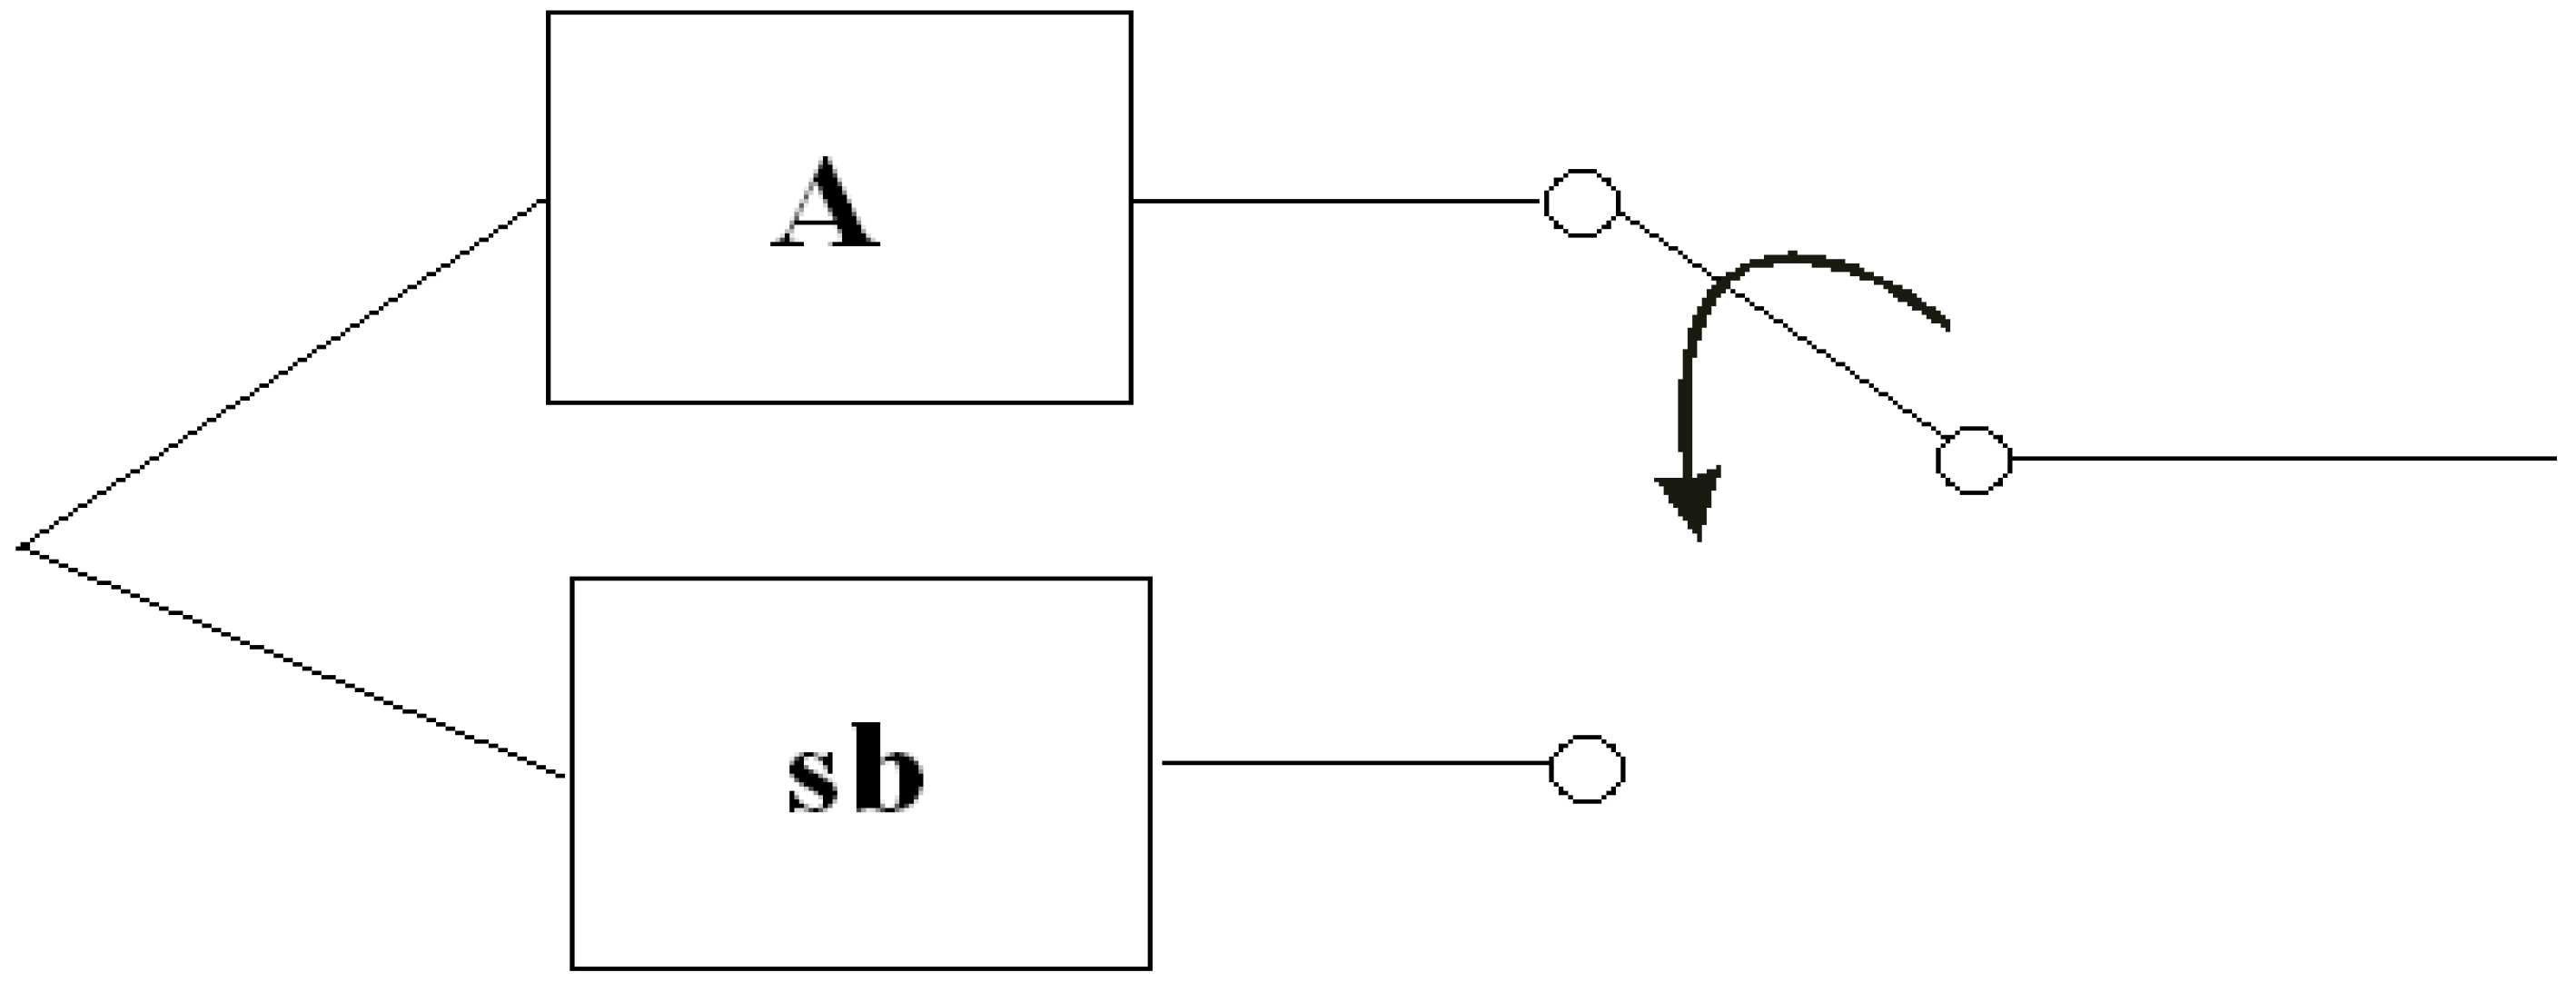
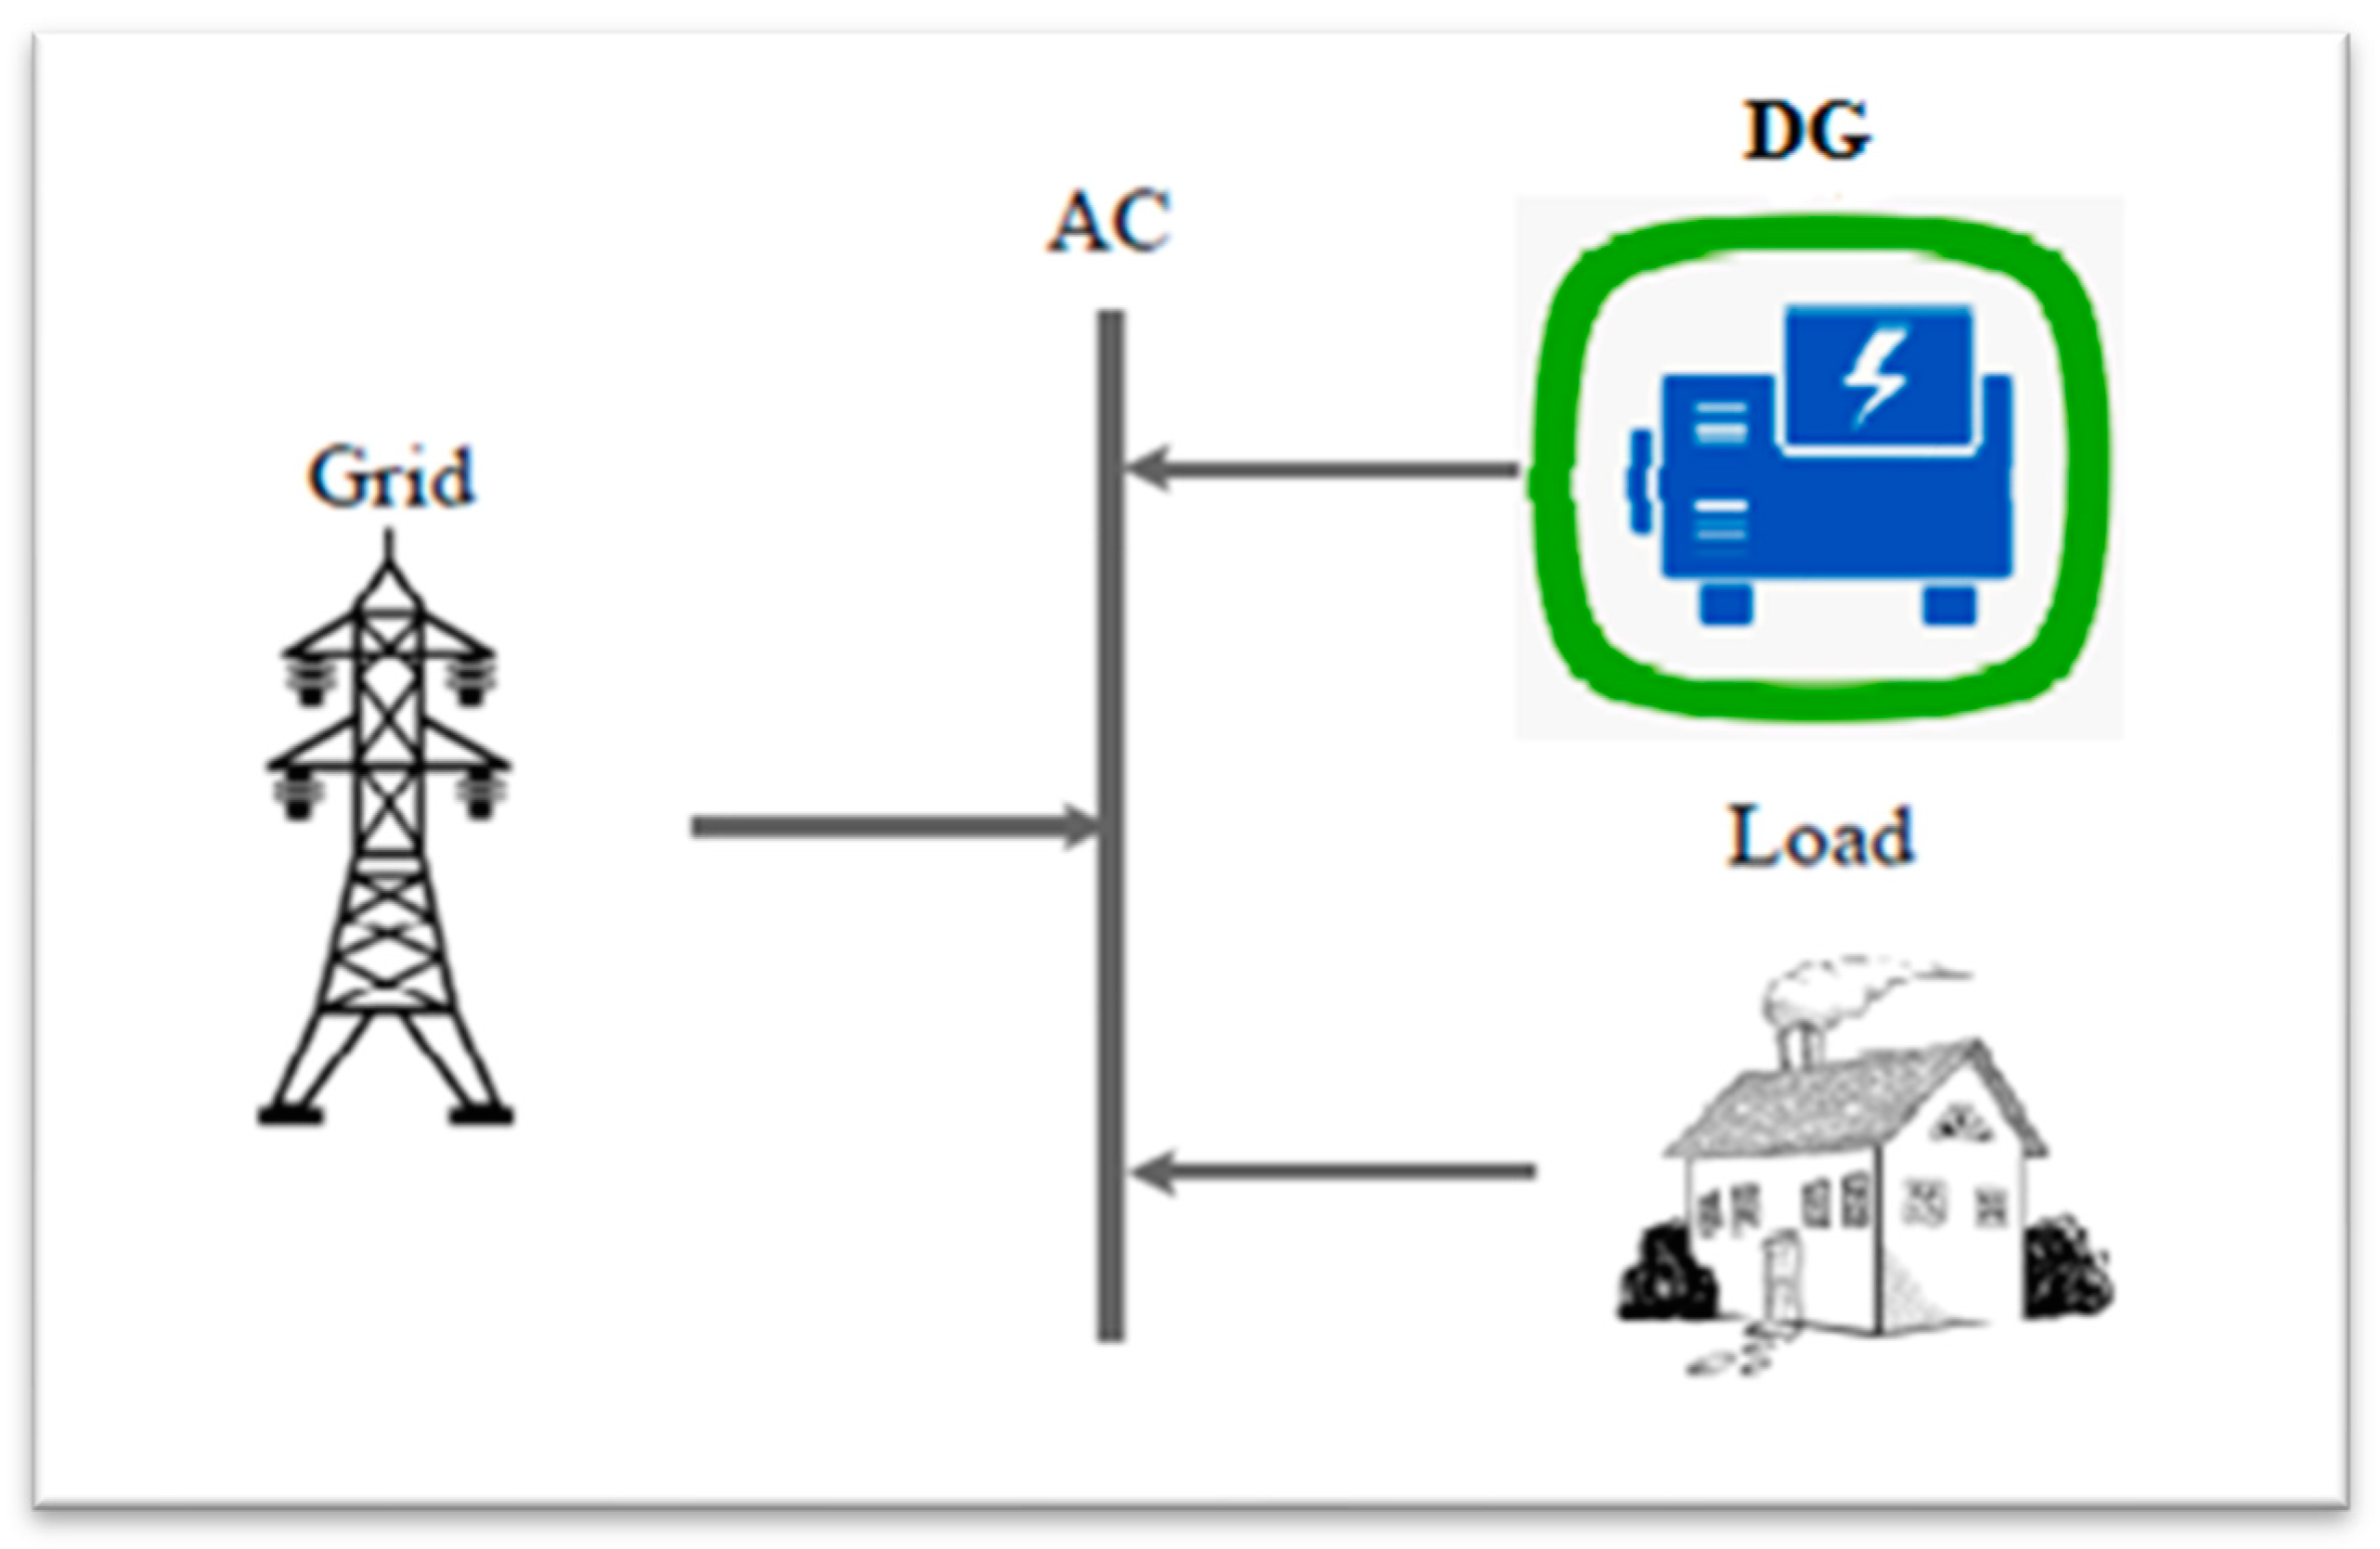
Figure 1 presents the basic concept of the proposed system. The general idea underlying standby (sb) redundancy is the same as that of a UPS system: all the components are still present even when they are not functioning. Only a system (A) power outage will enable the other standby components to function [25,26].
During a power outage in the system, these two components work as a standby system. For example, in system 1 (system A), when the power outage occurs, the critical load is connected to the DG via an auto-switching device. In system 2 (system sb), when the power outage occurs, the critical load is connected to PV + BES via an auto-switching device.
In this study, resiliency is measured by the term “survivability,” because it is the probability of the system having an electric supply during a power outage until the system is restored. Critical loads such as clinics, hospitals, and water filtration plants require 100% survivability during power outages [27].
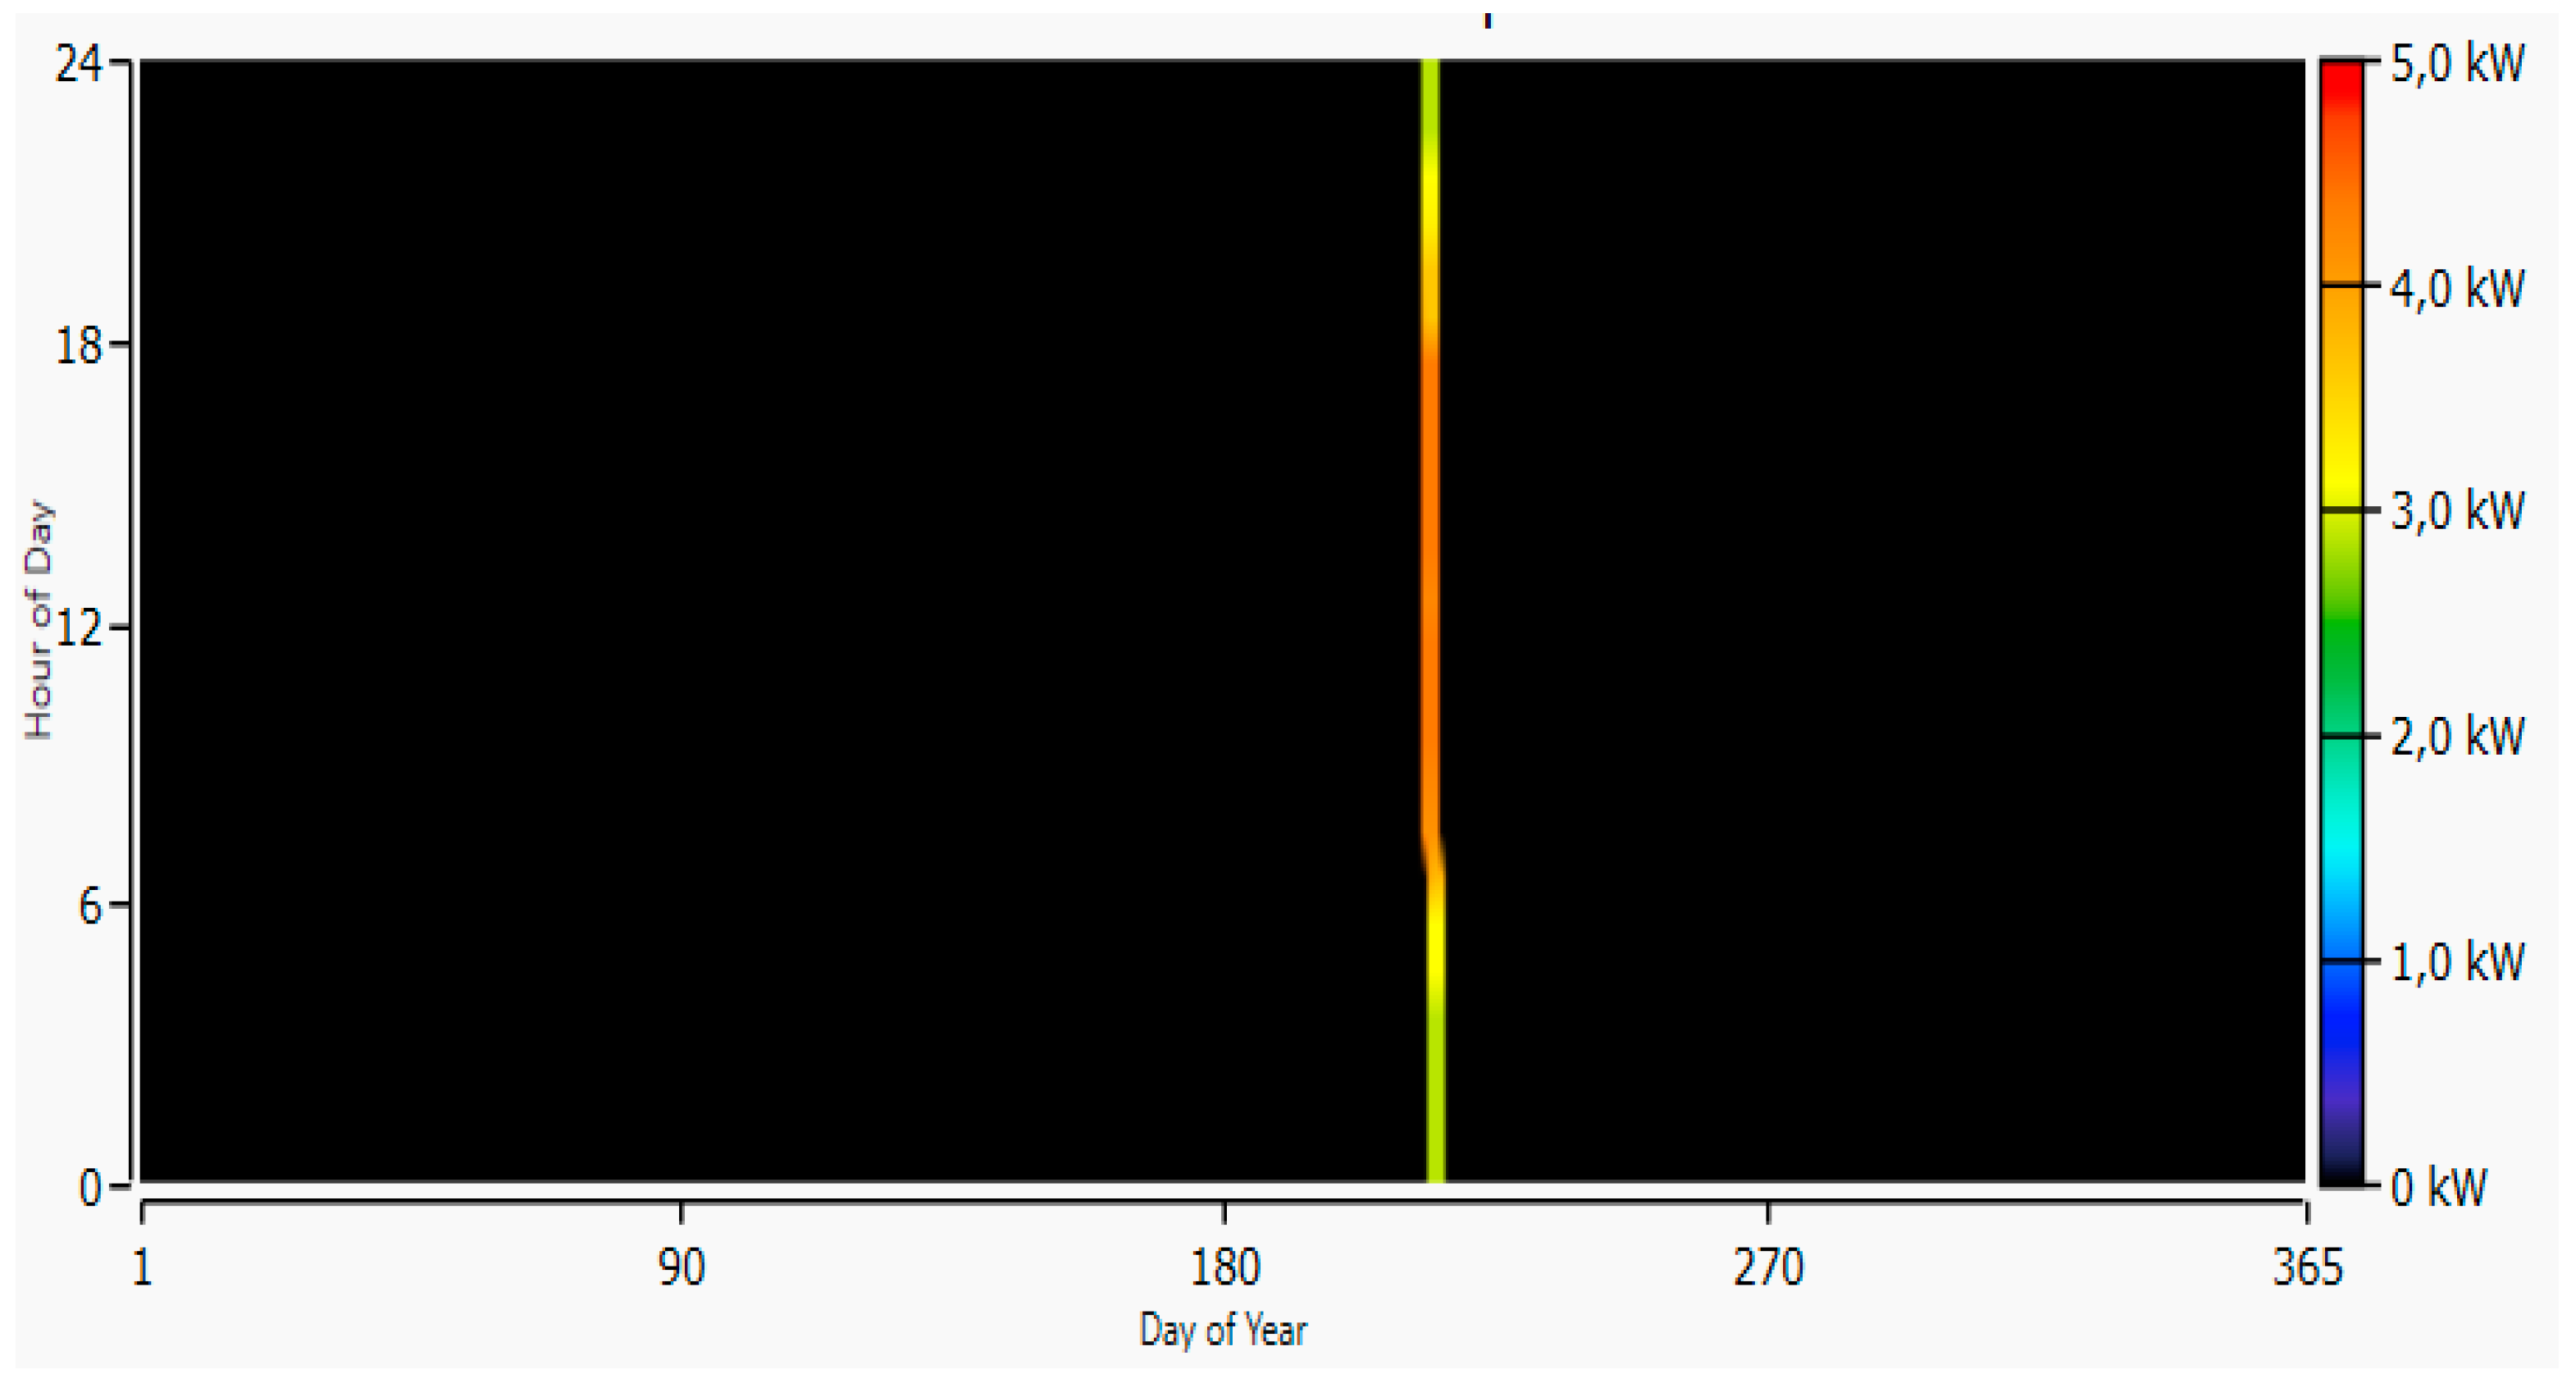
Figure 2 presents the grid outage data of the system 1 and system 2. The outage is assumed to last for 3 days during the year 2019, starting on 5 August at 7:00 AM and ending on 8 August at 7:00 AM, by using the HOMER Grid outage resilience function for both systems 1 and 2. In this simulation, two different systems, 1 and 2, consider supplying electric power to unmet loads during outages. HOMER Grid software is used for the simulations [28]. The main purpose of this paper is to investigate the real-time analysis of the resiliency of the different systems during the outage of the power grid and to make an economic comparison between both systems.
NPC = Cn , t CRF ( j , n )
CRF ( j ,   n ) = j ( 1 + j ) n ( 1 + j ) n 1
The HOMER Grid provided the most favourable technology, size of the system, and optimal minimum net present cost (NPC).
COE = Cn , t Ep , ac + Ep , dc + Ef + Eg , sale
The NPC cost is the whole system cost, which includes: (1) the capital costs; (2) the replacement costs; (3) the operation and maintenance cost (O&M); (4) the fuel cost; (5) the emission cost; and (6) the cost of purchasing power from the grid [29,30,31,32]. When determining the capital recovery factor (CRF) in Equation (2), the project life of 25 years is taken into account. A 10% annual increases in electricity costs as well as operating and maintenance expenses are taken into account in simulations. For HOMER grid simulations in 2019, there is an assumed 8% discount rate (DR) and a 2.8% inflation rate (IRR) [33]. The generator was run for 72 h during a blackout at a cost of $0.527 per hour. Equation (3) represented the total cost of energy (COE), generated form the system.

2.1. Input Data

Input data for the proposed models are given as follows:
(A) 
Electrical Load Data
For the case study, a small local hospital in Lombok (Mandalika) with a yearly load profile was chosen for both systems. The hospital’s emergency room, heating, cooling, and lighting systems were all considered while determining the critical load. The proposal of this study was to maximize resiliency during an outage for critical loads. The daily load profile for the hospital located in Mandalika is shown in Figure 3.
(B) 
Solar radiation
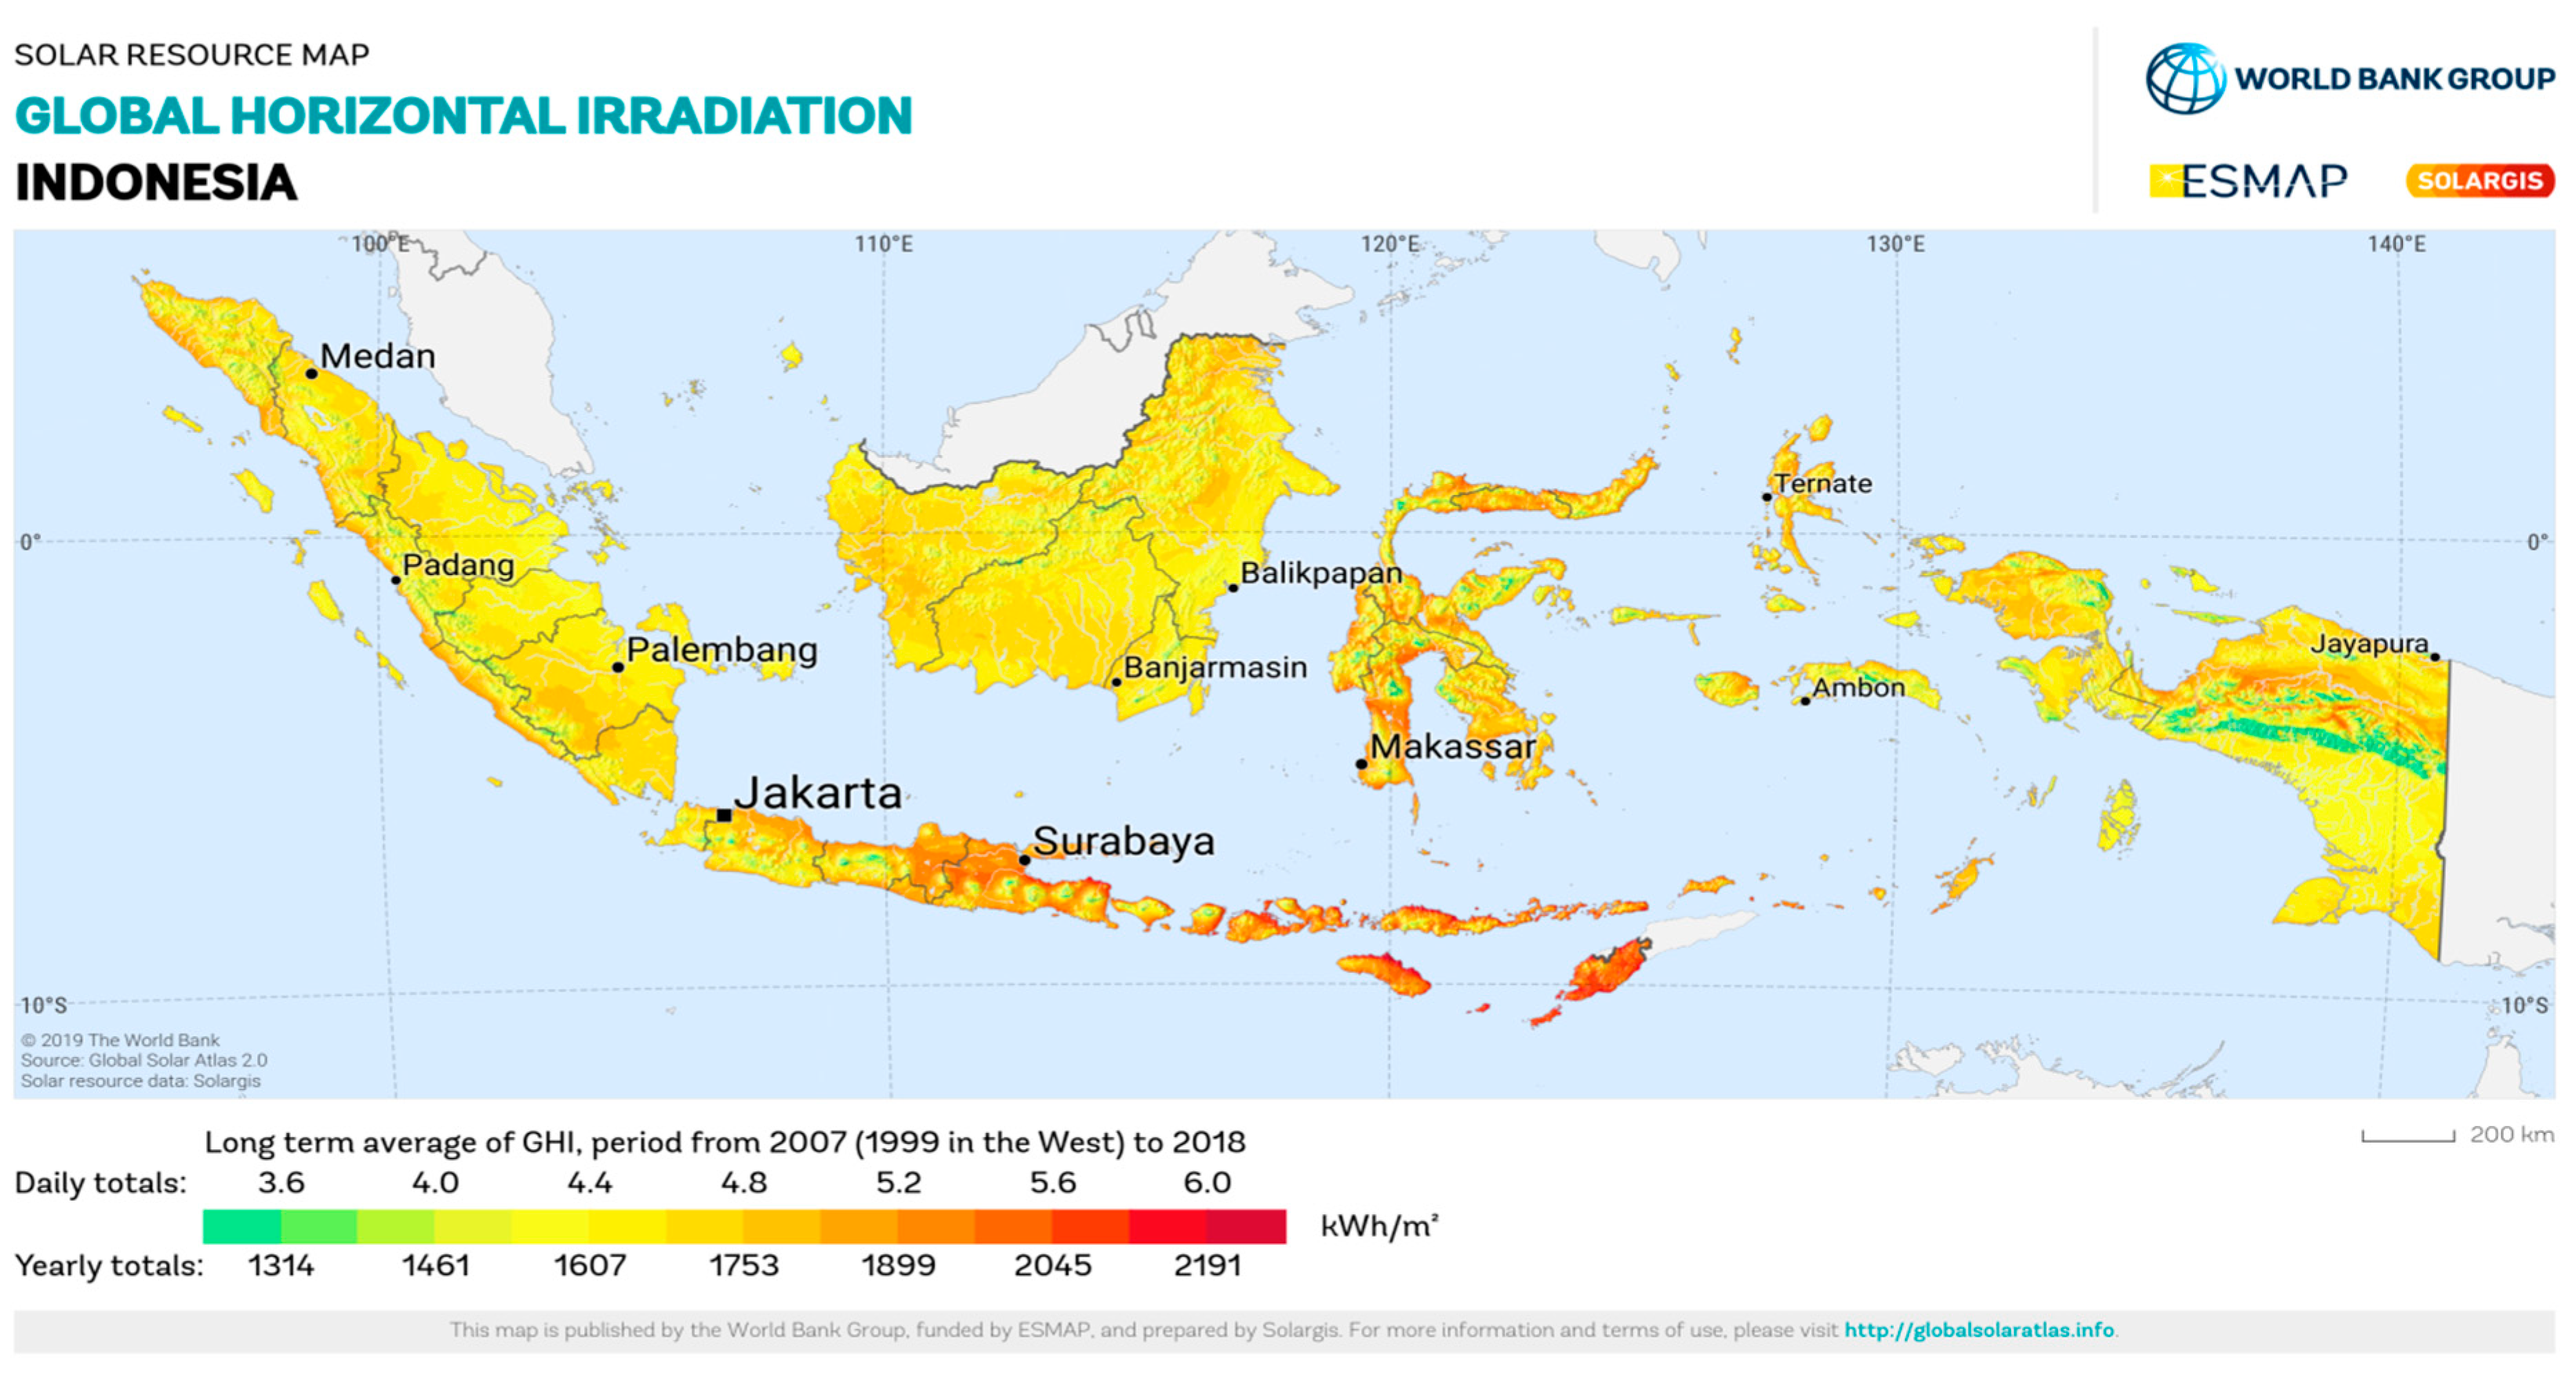
The yearly solar radiation data is shown in Figure 4. This is for the site located in Mandalika, Lombok Island. The data is available online at the National Aeronautics and Space Administration (NASA): Prediction of Worldwide Energy Resources (POWER). The pattern illustrated the peak value available from September to November as well as from March to May. The data shows that January to February and June to July has the lowest temperatures. The maximum annual solar radiation is 6.06 kWh/m2/day during October. Yearly global horizontal irradiation (GHI) and photovoltaic power potential in Indonesia are shown in
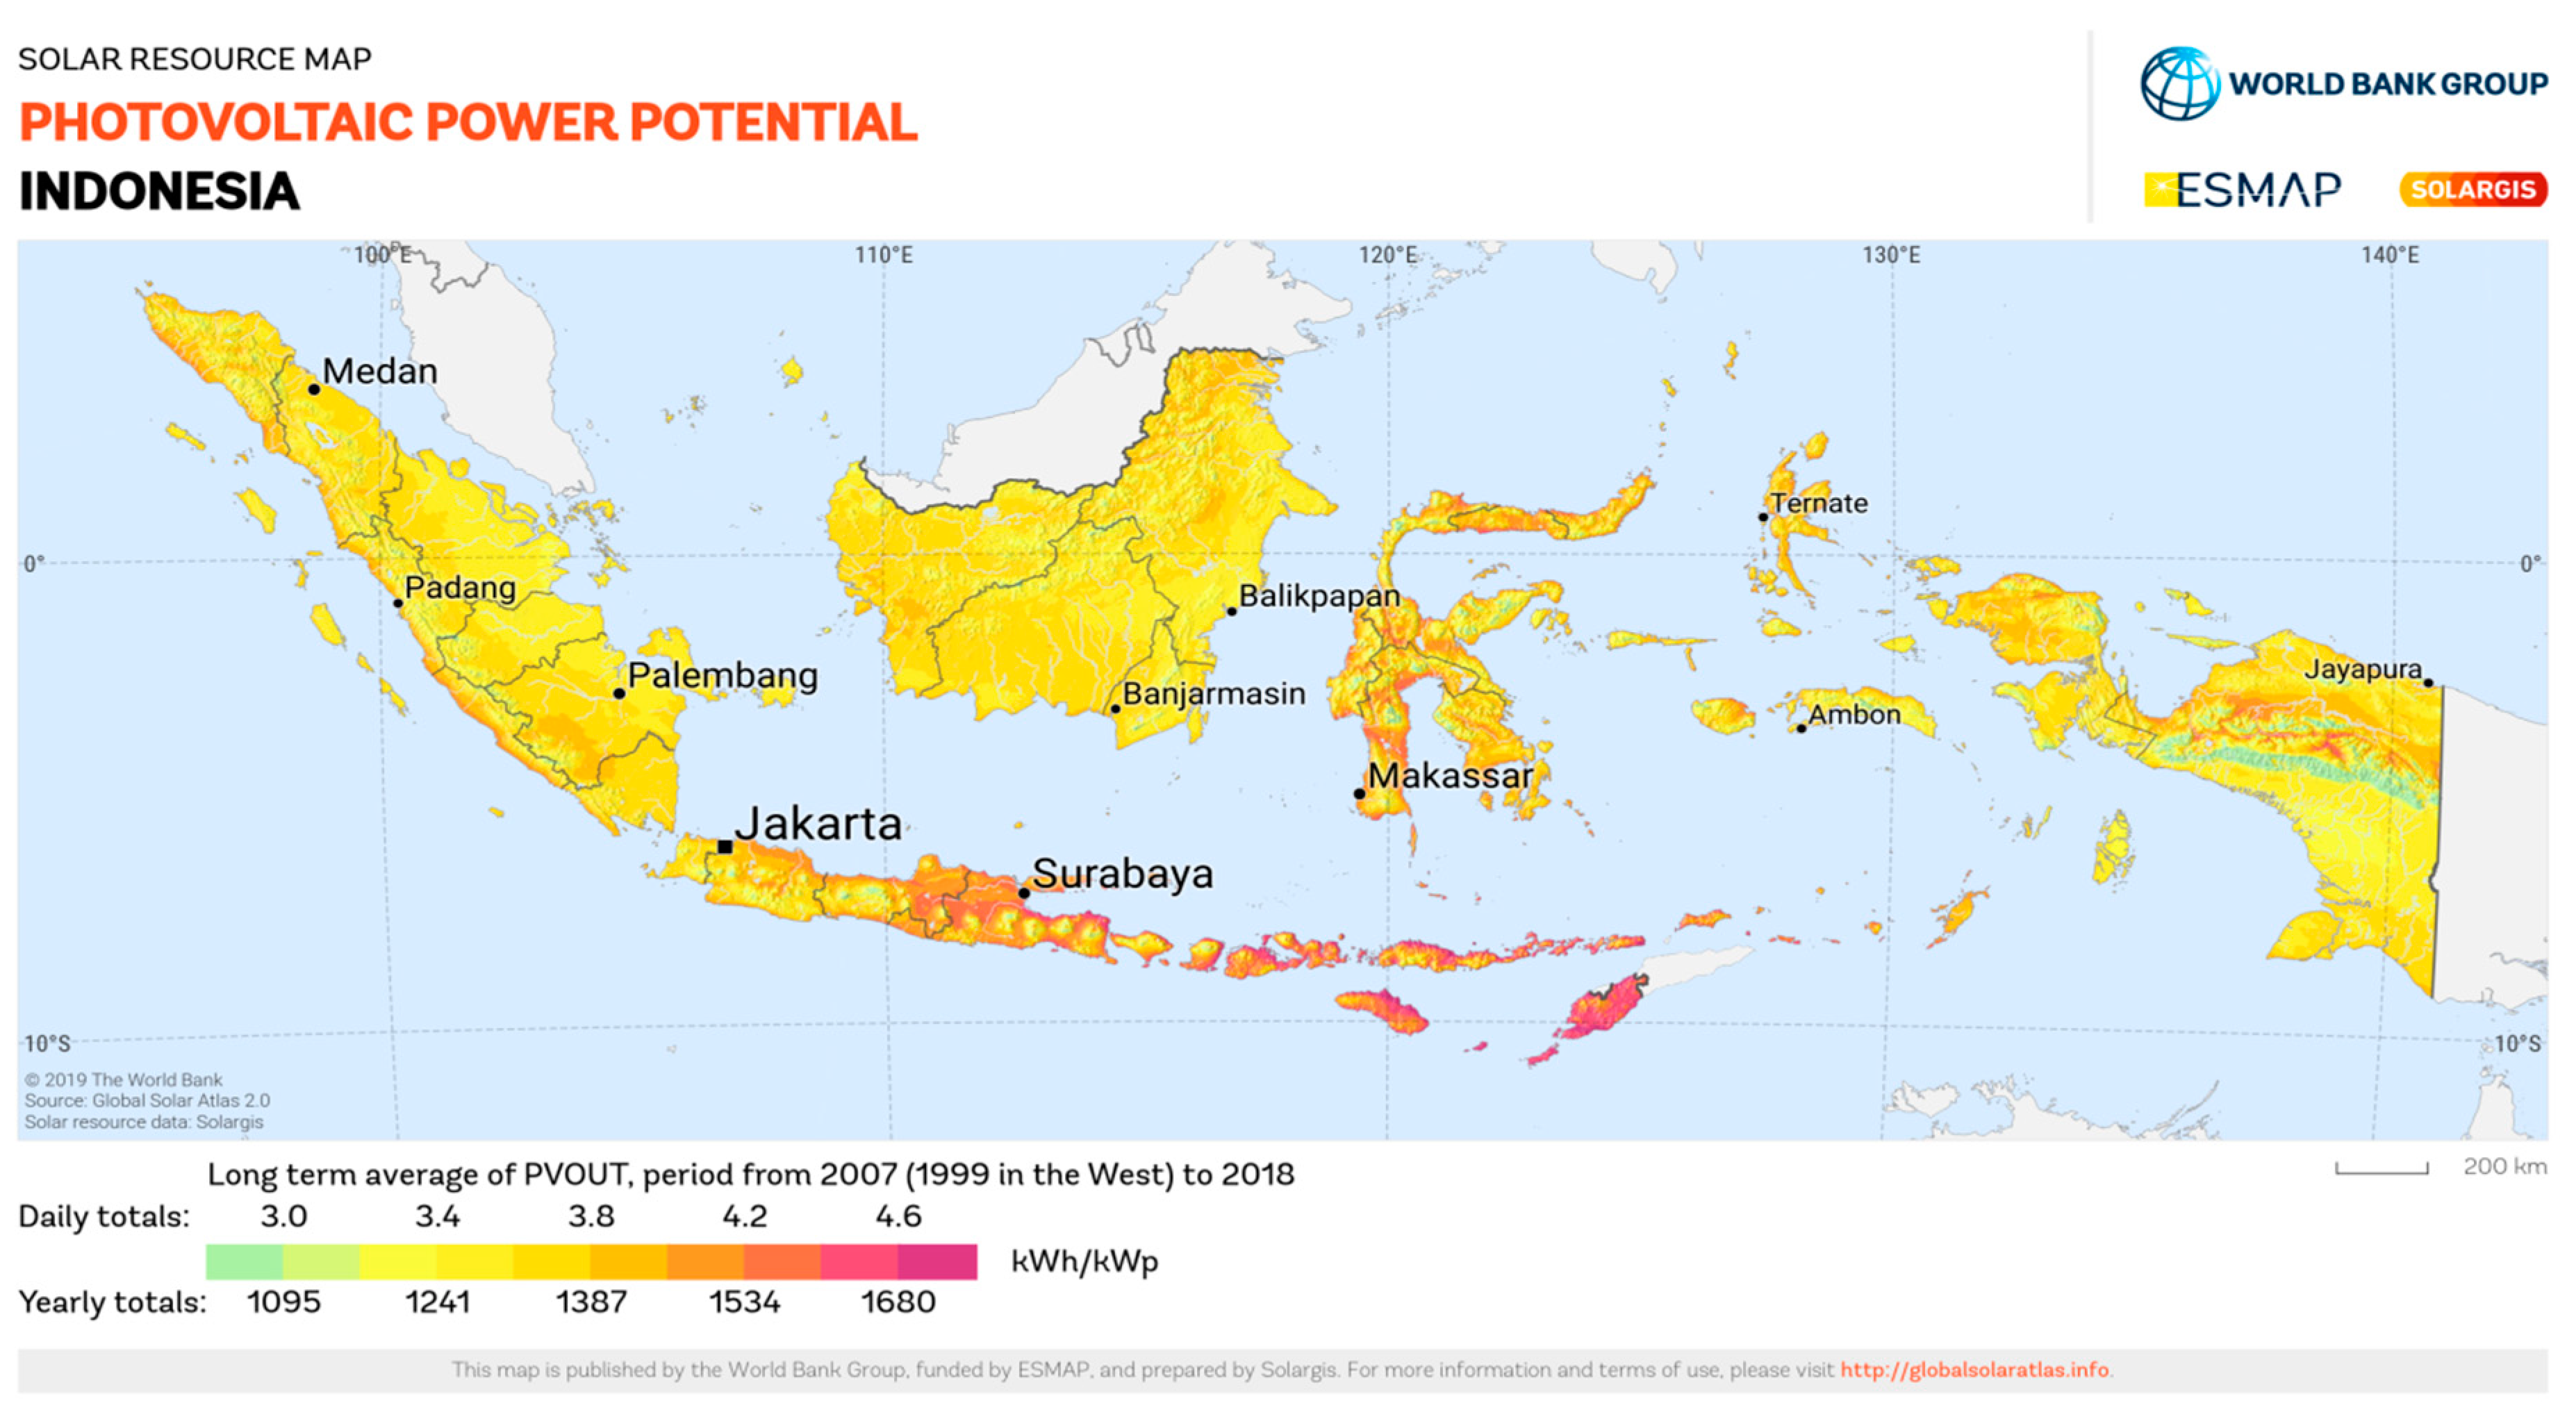
 Figure 5 and Figure 6, respectively [34].
Figure 5 presents the yearly global horizontal irradiation in Indonesia, which was utilized in this work. Moreover, Figure 6 presents the yearly photovoltaic power potential in Indonesia used in this study.
(C) 
Electricity generation cost
Lombok Island’s electricity generation costs are $0.13 per kWh [30]. As a result, for the HOMER grid simulations in this paper, the authors take into account the 0.13 dollars per unit cost of energy consumption on Lombok Island. The electricity tariffs in Indonesia [35] are shown in Table 1.

2.2. System Modelling

(A) 
Power Grid
The power grid provides the system with unlimited power but experiences grid outages during the ND. The grid emission was also considered in this paper. During the grid operation, the HOMER grid showed carbon dioxide at 632 g/kWh, sulfur dioxide at 2.74 g/kWh, and nitrogen oxides at 1.34 g/kWh.
(B) 
PV System
In this study, 24 kW solar panels were used for the simulation. The technical characteristics of the solar system are shown in Table 2. Installation, replacement, and maintenance (O&M) costs for a 1 kW solar PV system would be $350 per kW, $350 per kW, and $10 per year, respectively. Table 2 displays the technical specifications for this PV system. The output power of PV, which was introduced in the following equations [36], was affected by environmental conditions such as temperature and irradiance.
Ppv ( t ) = ȵ m × ȵ m × Am   × Mt ( t ) × ( 1 β t ( Tc ( t )   Tr ) )
Tc ( t ) =   Ta ( t ) +   Mt ( t ) × ( NOCT 20 / 800 )
The energy delivered by the PV system is [37,38,39,40,41]
Epv ( t ) = t = 1 n Ppv ( t ) × ȵ con
Equation (4) presented the Solar generation (Ppv(t)) in kW/hour. Tc(t) presented the temperature of cell (°C) and Epv(t) presented the produced energy from photovoltaic generation in kWh.
(C) 
Battery Energy Storage
Battery Energy Storage (BES) was used to store the extra energy available from the PV system during normal operating conditions and to provide energy to the load during abnormal conditions like power outages due to weather conditions. As this is a grid-connected MG, the battery would discharge to supply the load during normal operation, considering the economic factor, for instance, when the electricity price from the utility is high during the peak load. This paper used 60% of the battery’s state of charge (SOC) for power outage shaving, with the remaining 20% not being used as a minimum state. The battery’s SOC after a specific period of time (SOC (t + Dt)) during the charging and discharging procedures is defined in previous paragraphs, respectively. These equations demonstrate that the SOC equation has two essential parts: 1. SOC at the preceding period; and 2. The generation and consumption power at Dt.
These two Equations were only utilized when the SOC of BES was within the permitted ranges (9) [37]:
SOC ( t + Dt ) =   SOC ( t ) × ( 1 α b ) + ( Ppv ( t ) × ȵ inv Pl ( t ) / ȵ inv ) × ȵ ac × Dt
SOC ( t + Dt ) =   SOC ( t ) × ( 1 α b ) + ( Ppv ( t ) × ȵ bd Ppv ( t ) / ȵ inv ) × ȵ bd × Dt
SOCmax and SOCmin were the battery’s upper and lower storage bounds, respectively. These two boundaries should be the SOC of BES. When the battery’s SOC reached SOCmax and SOCmin, the used control system ceased charging and stopped discharging, respectively.
SOCmin     SOC ( t )     SOCmax
The lithium-ion battery is used as a storage device. The cost of each battery is $124; replacement charges are also $124; and operation and maintenance (O&M) charges are $10 per year. The technical specification for this battery energy storage is shown in Table 3.
(D) 
System Converter
A converter is required to interconnect the BES with the AC and DC buses. The efficiency of this converter was about 95% in both directions. The specification of the converter is illustrated in Table 3. The estimated costs of the converter are as follows: capital cost = $137/kW, replacement cost = $137/kW, and $10/year for operation and maintenance (O&M) [32,42,43]. The technical specification for this system converter is shown in Table 4.
(E) 
Diesel generator
In this simulation, the DG was operated with natural gas fuel. Generally, natural gas generators are better than diesel generators and good for plug-and-play operations at local clinics [32]. Normally, the DG operates for off-grid generation and operation when there are outages in the power grid. The specification of the diesel generator (DG) is shown in Table 5. The initial cost of DG is $1500 per kW, the replacement cost is $750 per kW, and operation and maintenance costs are $0.05 per hour. Furthermore, the emissions produced by the DG were included, which considered: 6.42 g/m3 of fuel in carbon monoxide; 0.0 g/m3 of fuel in unburned hydrocarbons; 0.181 g/m3 of fuel sulfur converted to particulate matter; and 13.47 g/m3 of fuel nitrogen oxides [31]. The technical specification for this system converter is shown in Table 5.

3. Results and Analysis

The load considered in this study is a local hospital located in Mandalika, Lombok Island, with 84 kWh/day and a 4.73 kW peak in a day, and the critical load during an outage is 42 kWh/day with a 2.36 kW peak in a day.
(A) 
Grid-connected load without backup
As seen in Figure 7, a grid-connected demand without a backup power supply is displayed, as is the load’s survival, in Figure 8.
(B) 
System 1: Grid-connected load with DG Backup
In this system, the DG was connected to the load by using an AC bus, and standby served as a power source for emergencies like power outages due to natural disasters or weather conditions. The system-1 grid-connected load with a backup power system and HOMER grid configuration are shown in Figure 9 and Figure 10, respectively. As stated previously, the grid provides supply to the load without breaking during normal conditions and switches to the DG when the blackout happens. The generator supplied only critical loads when the outage occurred.
As shown in Figure 11, during the outage, the generator would provide supply to the load, and there was no unmet load during an outage. As shown in Figure 12, there is no power from the grid during an outage.
This paper considers a random blackout resulting from natural disasters with a mean frequency of one each year, and the duration of the blackout is assumed to be 72 h. Both systems 1 and 2 were simulated during the same blackout duration. A grid failure during the blackout would lead to a deficit of capacity as well as an ineffective supply of energy for the electrical load. As a result, the backup power system was created to make up for the electrical load that was not met. When there was a power outage, the DG System 1, as depicted in Figure 13, delivered electricity. The electrical and economic parameters for System 1 are shown in Table 6.
Figure 14 shows the monthly electric production by utility and generator. Except during blackouts, the utility-supplied electricity to the load.
System 1, which included a DG, produced emissions by burning fossil fuels. The simulation’s findings showed that System 1’s overall emissions amounted to 216.902 kg/year. The emission profile for system 1 is shown in Table 7.
(C) 
System 2: Grid-connected load with RES Based ad hoc MG Backup
The proposed grid-connected ad hoc MG in this system consisted of a PV system, a BES system, and a load. The PV + BES system provides power in emergencies due to natural disasters or weather conditions. The system 2 grid-connected load with a backup power system and HOMER grid configuration are shown in Figure 15 and Figure 16, respectively. As previously mentioned, the electric grid and the MG supply the load during normal conditions, and the backup system PV + BES is supplied when the blackout happens.
There was no unmet load during an outage, as depicted in Figure 17, because the PV and the BES supplied the load. There was no power coming from the grid during an outage, as depicted in Figure 18.
As shown in Figure 19, during the outage in System 2, the PV + BES-based ad hoc MG operated in the off-grid mode to supply the critical load. The maximum value of the SOC was 100%, and the minimum value of the SOC was 20%. The electrical and economic parameters for system 2 are shown in Table 8. The BES results are shown in Table 9 for System 2.
As per the simulation result, most of the power provided by the PV system to the load during the daytime is shown in Figure 20.
The primary goal of each of the simulations was to increase the resilience by increasing the essential loads’ capacity to survive the system disruptions. Systems 1 and 2 were used to present two various optimal systems. As previously said, the DG is a typical system that offers electrical resilience. However, it is believed that the RES-based MGs are a highly effective apparatus for enhancing the resilience of the power supply. The persistence of the key loads improved the power system’s resilience, as shown in Figure 11 and Figure 17 for system 1 and system 2, respectively, from the results of the sensitivity analyses for systems 1 and 2. The standby systems that were operational during the outages were responsible for this increase in resilience.
The total net present cost of electricity over the year was $136,805.50, and the yearly operating cost was $3369.21 with a COE of $0.2151 as shown in Table 8. The optimization results of the battery energy storage system are presented in the Table 9. According to the results in Table 9, autonomy of the system was 9.12 h, energy in was13,452 kWh/year, energy out was 12,322 kWh/year, storage depletion was 0 kWh/year, system losses was 1062 kWh/year and annual throughput was 12,847 kWh/year.
According to the simulation results in Table 10, system 2 showed a total emission of 63.292 kg/yr, which was very low when compared to system 1.
The resilience of both systems was the same as a result of the optimal design, but the economic outcome was different. NPC and the initial cost of System 2 were higher than System 1, but the COE and operating cost of System 2 were lower as compared to System 1. According to the simulation results, system 1 produced an emission of 216.902 kg/yr, and system 2 produced an emission of only 63.292 kg/yr. According to this research, RES-based MGs are more environmentally beneficial resources since they produce power without the use of fossil fuels.

4. Limitations

This study presented the comparison analysis of grid-connected local hospital loads with typical backup systems and renewable energy system based ad hoc microgrids for enhancing the resilience of the system. There are some limitations of the proposed work which are as follows:
  • More recent optimization techniques can be utilized to further improve the analysis.
  • The work can be extended to a larger system.
  • Practical implementation of the system can be performed to verify the results of the software analysis.
The above-mentioned limitations can be considered as the future scope for the proposed work and addressed as separate research problems.

5. Conclusions

This study enhanced the resiliency of the system and the supply of electricity to a critical load during a power outage in the main grid system. The main aim of this study was to design resilience-based systems for a local hospital to provide power during outages. Both systems worked as standby, being the DG in system 1 and the PV with BES in system 2. Despite the fact that both systems were equally resilient, system 2 produced fewer emissions than system 1. Given that climate change and emissions are important considerations when designing a system, the RES-based system produced fewer emissions. The NPC and the initial cost of system 2 were higher than system 1, but the COE and operating cost of system 2 were lower as compared to system 1. This study was performed for Lombok Island in Indonesia. The simulation’s findings showed that system 1 created an annual emission of 216.902 kg/yr while system 2 only produced an emission of 63.292 kg/yr. This study shows that since RES-based MGs do not burn fossil fuels to generate power, they are more environmentally friendly resources.
As the future enhancement of this work, it can be utilized for other locations as per different design parameters, e.g., economic and weather conditions. Furthermore, various optimization techniques under different operational, natural and economic constraints can be utilized for optimization of the proposed system.

Author Contributions

Investigation, writing, review, M.A.; edit, Y.G., J.D.L.C., S.G., B.K. and M.A.K.; project administration and supervision, J.C.V. and J.M.G. All authors have read and agreed to the published version of the manuscript.

Funding

This work was sponsored by the Ministry of Foreign Affairs of Denmark, DANIDA Fellowship Centre (Project No. 20-M06-AAU) and supported by DANIDA Fellowship Centre and TECHIN Cerner of Research on Microgrids AAU Energy, Aalborg University, Aalborg Denmark.

Data Availability Statement

Data will be available on request.

Acknowledgments

This paper is an expanded version of the conference “Interdisciplinary Conference on Mechanics, Computers, and Electrics-2022”, which took place on 6–7 October 2018, at UPC Barcelona, Spain, under the supervision of Juan C. Vasquez, Josep M. Guerrero, and Yajuan Guan at AAU Energy, Aalborg University, Aalborg, Denmark.

Conflicts of Interest

The authors declare no conflict of interest.

Nomenclatures

Variables
NPC(t)Net present cost (USD)
CNPC(t) Cumulative annualized cost (USD/year)
COE(t) Total Cost of energy (USD)
Ep, ACAC primary demand (kWh/year)
Ep, DC DC primary demand (kWh/year)
EfDeferrable load (kWh/year)
Eg, sales(t)Total grid sales (kWh/year)
Ppv(t)Solar generation (kW/hour)
Mt(t)PV irradiation (W/m2)
Tc(t)Temperature of cell (°C)
Ta(t)Ambient temperature (°C)
Epv(t)PV generated energy (kWh)
SOCState of charge battery (%)
Pl(t)Required Load (kWh)
Dt(t)Time interval (hour)
Parameters
CRF(j,n)Capital regaining factor
jDiscount rate (%)
nProject lifetime (year)
ȵmPV Module efficiency (%)
ȵconConverter Efficacy (%)
AmArea under PV cells (m2)
NOCT(C)Temperature at Nominal Operating PV Cell
βtThermal factor
Tr(C)Reference temperature
αbSelf-discharge rate (%)
ȵinvInverter efficiency (%)
ȵbcCharging efficiency of BES (%)
ȵbdDischarging efficiency of BES (%)
SOCminMinimum SOC of BES
SOCmaxMaximum SOC of BES
Indices
t Hour

Abbreviations

DGDiesel Generator
RESRenewable Energy Source
PVPhotovoltaic
MGMicrogrid
ELLLocal Electrical Load
O&MOperational and Maintenance
TOUTime of Use
SOCState of Charge
HOMERHybrid Optimization of Multiple Energy Resources
UEGUtility Electric Grid
NDNatural disasters
CLCritical Load
HILPHigh impact and low probability
USAUnited States of America
UKUnited Kingdom
BNPBIndonesia’s National Disaster Mitigation Agency
UPSUninterruptible Power Supply
SbStandby
Ad-Hoc MGConstrained Microgrid
AAutomatic Switch
NASANational Aeronautics and Space Administration
POWERPrediction of Worldwide Energy Resources
kWhKilowatt Hour
GHIGlobal horizontal irradiation
TRTemperature Reference
ULUnmet Load
TGTraditional Generator
ACAlternating Current
DCDirect Current
NCNon-Critical
CECarbon Emission
DANIDADanish International Development Agency
TECHINMicrogrid Technologies for Remote Indonesian Islands
ICEMEInterdisciplinary Conference on Mechanics, Computers, and Electrics-2022
AAUAalborg University
CROMCenter for Research on Microgrids

References

  1. Extreme Weather Threatens African Society and Economy|Environment|All Topics from Climate Change to Conservation|DW|04.10.2018. Available online: https://www.dw.com/en/extreme-weather-threatens-african-society-and-economy/a-45713490 (accessed on 31 May 2022).
  2. Hussain, A.; Bui, V.H.; Kim, H.M. Microgrids as a resilience resource and strategies used by microgrids for enhancing resilience. Appl. Energy 2019, 240, 56–72. [Google Scholar] [CrossRef]
  3. Aki, H. Demand-Side Resiliency and Electricity Continuity: Experiences and Lessons Learned in Japan. Proc. IEEE 2017, 105, 1443–1455. [Google Scholar] [CrossRef]
  4. Yates, D.; Luna, B.Q.; Rasmussen, R.; Bratcher, D.; Garre, L.; Chen, F.; Tewari, M.; Friis-Hansen, P. Stormy weather: Assessing climate change hazards to electric power infrastructure: A sandy case study. IEEE Power Energy Mag. 2014, 12, 66–75. [Google Scholar] [CrossRef]
  5. Kemp, R. Electrical system resilience: A forensic analysis of the blackout in Lancaster, UK. Proc. Inst. Civ. Eng.-Forensic Eng. 2017, 170, 100–109. [Google Scholar] [CrossRef] [Green Version]
  6. Kwasinski, A.; Andrade, F.; Castro-Sitiriche, M.J.; O’Neill-Carrillo, E. Hurricane Maria Effects on Puerto Rico Electric Power Infrastructure. IEEE Power Energy Technol. Syst. J. 2019, 6, 85–94. [Google Scholar] [CrossRef]
  7. Millions Affected by Major Blackout to Be Compensated: PLN-Business-the Jakarta Post. Available online: https://www.thejakartapost.com/news/2019/08/05/millions-affected-by-major-blackout-to-be-compensated-pln.html (accessed on 31 May 2022).
  8. Economic Benefits of Increasing Electric Grid Resilience to Weather Outages. Executive Office of the President. 2013. Available online: http://energy.gov/sites/prod/files/2013/08/f2/Grid%20Resiliency%20Report_FINAL.pdf (accessed on 31 May 2022).
  9. Holdmann, G.P.; Wies, R.W.; Vandermeer, J.B. Renewable energy integration in Alaska’s remote islanded microgrids: Economic drivers, technical strategies, technological niche development, and policy implications. Proc. IEEE 2019, 107, 1820–1837. [Google Scholar] [CrossRef]
  10. Bayati, N.; Aghaee, F.; Sadeghi, S.H.H.; Bayati, N.; Aghaee, F. The Adaptive and Robust Power System Protection Schemes in the Presence of DGs. vbn.aau.dk, 2019; Volume 9. Available online: https://www.ijrer.org/ijrer/index.php/ijrer/article/view/9154 (accessed on 31 May 2022).
  11. Available online: https://vbn.aau.dk/en/publications/the-adaptive-and-robust-power-system-protection-schemes-in-the-pr (accessed on 4 December 2022).
  12. National Infrastructure Advisory Council. A Framework for Establishing Critical Infrastructure Resilience Goals Final Report and Recommendations by the Council. 2010. Available online: https://www.dhs.gov/xlibrary/assets/niac/niac-a-framework-for-establishing-critical-infrastructure-resilience-goals-2010-10-19.pdf (accessed on 15 December 2022).
  13. Overbye, T.; Vittal, V.I.D.-I.P. Energy, and Undefined 2012. Engineering Resilient Cyber-Physical Systems. Documents.pserc.wisc.edu. 2013. Available online: https://ieeexplore.ieee.org/document/6344943 (accessed on 31 May 2022).
  14. Available online: https://documents.pserc.wisc.edu/documents/general_information/presentations/pserc_seminars/psercwebinars2013/TA-6_PSERC_Webinar_Apr2_2013_Slides.pdf (accessed on 17 December 2022).
  15. Bayati, N.; Hajizadeh, A.M.S.-R.A. Grid, and Undefined 2022. Fault Analysis and Protection of Low-Voltage DC Microgrid Equipped by Renewable Energy Resources. igi-global.com. Available online: https://www.ijert.org/fault-analysis-and-protection-of-dc-microgrid (accessed on 31 May 2022).
  16. Available online: https://www.igi-global.com/chapter/fault-analysis-and-protection-of-low-voltage-dc-microgrid-equipped-by-renewable-energy-resources/289917 (accessed on 17 December 2022).
  17. Kavlak, G.; McNerney, J.; Trancik, J.E. Evaluating the causes of cost reduction in photovoltaic modules. Energy Policy 2018, 123, 700–710. [Google Scholar] [CrossRef] [Green Version]
  18. Fenimore, T.; Gould, A.L.W. In Proceedings of the 2017 70th A. Conference, and Undefined 2017. Implementing a Microgrid Using Standard Utility Control Equipment. ieeexplore.ieee.org. Available online: https://ieeexplore.ieee.org/abstract/document/8090030/ (accessed on 31 May 2022).
  19. Xu, Y.; Liu, C.; Schneider, K.P.; Tuner, F.K.; Ton, D.T. Microgrids for Service Restoration to Critical Load in a Resilient Distribution System. IEEE Trans. Smart Grid. 2018, 9, 426–437. [Google Scholar] [CrossRef]
  20. Hirsch, A.; Parag, Y.; Guerrero, J. Microgrids: A review of technologies, key drivers, and outstanding issues. Renew. Sustain. Energy Rev. 2018, 90, 402–411. [Google Scholar] [CrossRef]
  21. Zuo, H.; Teng, Y.; Cheng, S.; Sun, P.; Chen, Z. Distributed multi-energy storage cooperative optimization control method for power grid voltage stability enhancement. Electr. Power Syst. Res. 2023, 216, 109012. [Google Scholar] [CrossRef]
  22. Ramos, A.F.; Ahmad, I.; Habibi, D.; Mahmoud, T.S. Placement and sizing of utility-size battery energy storage systems to improve the stability of weak grids. Int. J. Electr. Power Energy Syst. 2023, 144, 108427. [Google Scholar] [CrossRef]
  23. Hasan, M.M.; Chowdhury, A.H. An improved adaptive hybrid controller for battery energy storage system to enhance frequency stability of a low inertia grid. J. Energy Storage 2023, 58, 106327. [Google Scholar] [CrossRef]
  24. Curto, D.; Favuzza, S.; Franzitta, V.; Guercio, A.; Navia, M.A.N.; Telaretti, E.; Zizzo, G. Grid Stability Improvement Using Synthetic Inertia by Battery Energy Storage Systems in Small Islands. Energy 2022, 254, 124456. [Google Scholar] [CrossRef]
  25. Gholami, A.; Shekari, T.; Amirioun, M.H.; Aminifar, F.; Amini, M.H.; Sargolzaei, A. Toward a consensus on the definition and taxonomy of power system resilience. IEEE Access 2018, 6, 32035–32053. [Google Scholar] [CrossRef]
  26. Ali, M.; Zia, M.F.; Sundhu, M.W. Demand side management proposed algorithm for cost and peak load optimization. In Proceedings of the 4th International Istanbul Smart Grid Congress and Fair, ICSG 2016, Istanbul, Turkey, 20 June 2016. [Google Scholar] [CrossRef]
  27. Moshayedi, A.J.; Khan, A.S.; Yang, S.; Zanjani, S.M. Personal Image Classifier Based Handy Pipe Defect Recognizer (HPD): Design and Test. In Proceedings of the 2022 7th International Conference on Intelligent Computing and Signal Processing (ICSP), Xi’an, China, 15–17 April 2022; pp. 1721–1728. [Google Scholar]
  28. Moshayedi, A.J.; Kolahdooz, A.; Roy, A.S.; Rostami, S.A.L.; Xie, X. Design and promotion of cost-effective IOT-based heart rate monitoring. In Proceedings of the International Conference on Cloud Computing, Internet of Things, and Computer Applications (CICA 2022), Luoyang, China, 28 July 2022; SPIE 12303. Volume 123031N. [Google Scholar] [CrossRef]
  29. Arani, A.A.K.; Bayati, N.; Mohammadi, R.; Gharehpetian, G.B.; Sadeghi, S.H. Fault Current Limiter Optimal Sizing Considering Different Microgrid Operational Modes Using Bat and Cuckoo Search Algorithm. yadda.icm.edu.pl. 2018. Available online: https://www.semanticscholar.org/paper/Fault-Current-Limiter-optimal-sizing-considering-Li-Sghar/ee21da7e569b45ba0a193b7b682a024d5f514158 (accessed on 1 June 2022).
  30. Available online: https://yadda.icm.edu.pl/yadda/element/bwmeta1.element.oai-journals-pan-pl-104087/c/oai-journals-pan-pl-104087_full-text_AEE-67-2-art07.pdf (accessed on 17 December 2022).
  31. Reliability of Standby Systems with a Switching Device. Available online: https://www.weibull.com/hotwire/issue22/relbasics22.htm (accessed on 1 June 2022).
  32. Jongerden, M.R.; Hüls, J.; Remke, A.; Haverkort, B.R. Does Your Domestic Photovoltaic Energy System Survive Grid Outages? Energies 2016, 9, 736. [Google Scholar] [CrossRef] [Green Version]
  33. Okedu, K.; Uhunmwangho, R. International Journal of Renewable, and Undefined 2014. Optimization of Renewable Energy Efficiency Using HOMER. dergipark.org.tr, 2014; Volume 4. Available online: https://dergipark.org.tr/en/download/article-file/148213 (accessed on 2 June 2022).
  34. Lau, K.Y.; Muhamad, N.A.; Arief, Y.Z.; Tan, C.W.; Yatim, A.H.M. Grid-connected photovoltaic systems for Malaysian residential sector: Effects of component costs, feed-in tariffs, and carbon taxes. Energy 2016, 102, 65–82. [Google Scholar] [CrossRef]
  35. Lombok Prefeasibility Studies on RE Solutions. 2019. Available online: https://ens.dk/sites/ens.dk/files/Globalcooperation/prefeasibility_studies_on_re_solutions_in_lombok_-_jan_2019.pdf (accessed on 6 June 2022).
  36. Gasoline vs. Diesel Generators. Available online: https://www.absolutegenerators.com/blog/gasoline-vs-diesel-generators (accessed on 6 June 2022).
  37. Mojumder, M.R.H.; Hasanuzzaman, M.; Cuce, E. Prospects and challenges of renewable energy-based microgrid system in Bangladesh: A comprehensive review. Clean Technol. Environ. Policy 2022, 24, 1987–2009. [Google Scholar] [CrossRef]
  38. Indonesia: 2019 Article IV Consultation-Press Release; Staff Report; and Statement by the Executive Director for Indonesia by IMF. Available online: https://www.imf.org/~/media/Files/Publications/CR/2019/1IDNEA2019001.ashx (accessed on 21 November 2022).
  39. RE Resource Mapping of Indonesia (Global Horizontal Irradiation and Photovoltaic Power Potential). Available online: https://globalsolaratlas.info/download/indonesia (accessed on 21 November 2022).
  40. The Electricity Tariffs in Indonesia. Available online: https://www.esdm.go.id/en/media-center/news-archives/electricity-tariffs-for-april-june-2021-remain-unchanged (accessed on 21 November 2022).
  41. Babaei, M.; Beheshti, M.T.H. Demand Side Management of a Stand-alone Hybrid Power Grid by Using Fuzzy Type-2 Logic Control. In Proceedings of the 2018 Smart Grids Conference (SGC), Sanandaj, Iran, 28–29 November 2018; pp. 1–6. [Google Scholar]
  42. Eltamaly, A.M.; Mohamed, M.A. A Novel Design and Optimization Software for Autonomous PV/Wind/Battery Hybrid Power Systems. Math. Probl. Eng. 2014, 2014, 637174. [Google Scholar] [CrossRef]
  43. Shahinzadeh, H.; Gheiratmand, A.; Fathi, S.H.; Moradi, J. Optimal design and management of isolated hybrid renewable energy system (WT/PV/ORES). In Proceedings of the 2016 21st Conference on Electrical Power Distribution Networks Conference (EPDC), Karaj, Iran, 26–27 April 2016; pp. 208–215. [Google Scholar]
Figure 1. Standby component system with an auto-switching device.
Energies 16 01918 g001
Figure 2. Grid outage for both System 1 and System 2.
Energies 16 01918 g002
Figure 3. Daily load profile for the hospital (Mandalika).
Energies 16 01918 g003
Figure 4. Yearly Solar Radiation in Mandalika (HOMER Grid).
Energies 16 01918 g004
Figure 5. Yearly Global horizontal irradiation in Indonesia [35].
Energies 16 01918 g005
Figure 6. Yearly Photovoltaic power potential in Indonesia [35].
Energies 16 01918 g006
Figure 7. Grid-connected load without a backup power system.
Energies 16 01918 g007
Figure 8. Grid Outage.
Energies 16 01918 g008
Figure 9. System 1: Grid-connected load with a backup power system.
Energies 16 01918 g009
Figure 10. System 1: HOMER grid configuration.
Energies 16 01918 g010
Figure 11. Resilience diagram for System 1.
Energies 16 01918 g011
Figure 12. Grid and load for System 1 during an outage.
Energies 16 01918 g012
Figure 13. Generator output power.
Energies 16 01918 g013
Figure 14. Monthly electric production for System 1.
Energies 16 01918 g014
Figure 15. System 2: Grid-connected load with RES Based ad-hoc MG Backup.
Energies 16 01918 g015
Figure 16. System 2: HOMER grid configuration.
Energies 16 01918 g016
Figure 17. Resilience diagram for System 2.
Energies 16 01918 g017
Figure 18. Grid and load for System 2 during an outage.
Energies 16 01918 g018
Figure 19. SOC of the BES for System 2 during an outage.
Energies 16 01918 g019
Figure 20. Monthly electric production for System 2.
Energies 16 01918 g020
Table 1. The Electricity Tariffs in Indonesia [35].
Sr.Electricity Tariffs for Non-Subsidized CustomersRp/kWh
1Low Voltage (TR) 6600 to 200 kVA1444.70
2Medium Voltage (TR) power >200 kVA1114.74
3High Voltage (TR) power ≥30,000 kVA996.74
Table 2. Technical specification of PV system.
SpecificationData
Nominal capacity24 kW
Coefficient of Temperature−0.380
Temperature at Operation45 °C
Efficacy16.30%
Project Lifespan25 year
Levelized Cost0.121 $/kWh
Capacity Factor18.2%
Table 3. Technical specification of BES.
SpecificationData
Nominal voltage 3.70 V
Quantity67
Nominal capacity68.7 kWh
The initial SOC 100%
Minimum SOC20%
Lifetime5 years
Table 4. Technical specification of the system converter.
SpecificationData
Nominal capacity7.94 kW
Efficacy95%
Project Lifespan15 years
Table 5. Technical specification of the diesel generator (DG).
SpecificationData
Nominal capacity7.10 kW
Efficiency95%
Project Lifespan15 years
Table 6. Parameters for system 1.
SpecificationData
DG Size (kW)7.10
NPC ($)90,110.32
COE ($)0.1520
Operating costs ($/year)6146.60
Initial costs ($)10,650.00
Load consumption (kWh/yr)45,851
Grid purchases (kWh/yr)45,574
Unmet load (kWh/yr)0
Grid Sales (kWh/yr)0
Table 7. Emission profile for system 1.
QuantityValue/Units
Carbon Dioxide28.984 kg/yr
Carbon Monoxide0.601 kg/yr
Particulate Matter0.0170 kg/yr
Sulfur Dioxide125 kg/yr
Nitrogen Oxides62.3 kg/yr
Table 8. Parameters for SYSTEM 2.
SpecificationData
PV (kW)24
Converter (kW)7.94 kW
Battery (qty)67
NPC ($)136,805.50
COE ($)0.2151
Operating costs ($)3369.21
Initial costs ($)89,759.49
Load consumption (kWh/yr)13,436
Grid sale (kWh/yr)3336
Unmet load (kWh/yr)0
Table 9. BES Result.
QuantityValue/Units
Autonomy9.12 h
Energy in13,452 kWh/year
Energy out12,322 kWh/year
Storage depletion0 kWh/year
losses1062 kWh/year
Annual throughput12,847 kWh/year
Table 10. Emission profile for system 2.
QuantityValue/Units
Carbon Dioxide8.492 kg/yr
Sulfur Dioxide36.8 kg/yr
Nitrogen Oxides18.0 kg/yr
Disclaimer/Publisher’s Note: The statements, opinions and data contained in all publications are solely those of the individual author(s) and contributor(s) and not of MDPI and/or the editor(s). MDPI and/or the editor(s) disclaim responsibility for any injury to people or property resulting from any ideas, methods, instructions or products referred to in the content.

