Article

A Comparison of Double-End Partial Discharge Localization Algorithms in Power Cables

by
Asfarina Abu Bakar
1,
Chai Chang Yii
1,*,
Chin Kui Fern
1,
Yoong Hou Pin
1,
Herwansyah Lago
1 and
Mohamad Nur Khairul Hafizi Rohani
2
1
Faculty of Engineering, Universiti Malaysia Sabah, 88400 Kota Kinabalu, Sabah, Malaysia
2
Faculty of Electrical Engineering & Technology, Universiti Malaysia Perlis, 02600 Arau, Perlis, Malaysia
*
Author to whom correspondence should be addressed.
Energies 2023, 16(4), 1817; https://doi.org/10.3390/en16041817
Submission received: 5 January 2023 / Revised: 27 January 2023 / Accepted: 2 February 2023 / Published: 11 February 2023

Abstract

:
The double-end partial discharge (PD) measurement method is the most common method for measuring and localizing PD sources in power cables. The sensitivity of the PD sensor, the processing speed of the data acquisition unit, and the method of the PD localization algorithm are the three main keys to ensuring the accuracy of the PD source localization on power cables. A new multi-end PD localization algorithm known as segmented correlation trimmed mean (SCTM) has recently demonstrated excellent accuracy in the localization of PD sources on power cables. The algorithm, however, is only applicable to multi-end PD measurement methods. In this paper, the mathematical equation of the SCTM algorithm is customized to match the double-end PD measurement method. A MATLAB simulation was conducted to assess the performance of the SCTM algorithm in the double-end PD measurement method. The maximum peak detection (MPD) algorithm, segmented correlation (SC), and SCTM algorithm were compared as PD localization algorithms. The SC algorithms have shown that identifying the correlation bond between two cues instead of the peak of the PD signal in the MPD algorithm significantly increases the PD localization accuracy. The results show that the SCTM algorithm outperforms the MPD and SC algorithms in terms of accuracy.

1. Introduction

Partial discharge is defined as an electrical discharge that occurs across a localized region of insulation between two conducting electrodes but does not completely bridge the gap [1]. It may be caused by gaps or imperfections in the insulation system. Most power equipment is damaged due to insulation degradation caused by long-term operation, insufficient grounding distance, insufficient discharge distance, poor contact, or poor environmental quality [2]. As a result, PD source detection and localization are the best early warning indicators of electrical insulation deterioration in the power network. Although many of the cited research works focused on high-voltage (HV) and extra-high-voltage (EHV) applications, our research will only focus on medium-voltage (MV) assets. As illustrated in Table 1, PD detection and localization techniques [3,4,5,6] can be classified as electrical, chemical, acoustic, electromagnetic, ultrasonic, and ultraviolet.
Underground cable systems can transmit large amounts of power while minimizing damage from natural disasters such as earthquakes and man-made accidents such as poor cable joint workmanship. To avoid power cable interruption or breakdown, the insulation status of the cable must be determined [1]. The location of PD sources is critical for power cable monitoring and maintenance. For the localization of PDs, the time difference of arrival (TDoA) method is widely used in the literature. In recent years, researchers have developed numerous multi-end PD localization algorithms, including the “Partial Discharge Localization Method in Transformers” [33], Multi-end Correlation-based PD Location Technique (MEC) [34], Segmented Correlation and Trimmed Mean Data Filtering Techniques for MV Underground Cable (SCTM) [35] and others. According to the paper, SCTM [35] outperforms the MEC algorithm in terms of PD localization accuracy, but it has limitations due to it being only used for multi-end PD measurement. This paper proposes modified mathematical equations of the SCTM algorithm to fit in double-end PD measurement. The SCTM algorithm for double-end PD measurement was created specifically to address the issue of low accuracy in other PD localization algorithms.

2. PD Measurement Methods

2.1. Single-End PD Measurement

The PD measurement methods on power cables can be categorized into single-end, double-end, and multi-end PD measurement methods. The single-end PD measurement method requires a PD sensor mounted on the front end of the monitored power cable, and the Time Domain Reflectometry (TDR) time delay estimation method is used to estimate the PD localization [36]. The TDR method uses the time of the first arrival PD signal and the time of the reflected PD signal to estimate the PD source on the power cable. The mathematical equation of TDR for the single-end PD measurement method is as follows [37]:
%   PD   location = 1 2 1 TD L × 100
where:
  • TD—Time difference between consecutive pulses;
  • L—Cable length.

2.2. Double-End PD Measurement

The double-end PD measurement method is the most widely used method of PD measurement for power cables. This method requires two PD sensors mounted on the front end and the tail end of the monitored power cable. The mathematical equation for double-end PD measurement method is as follows [38]:
PD   location = 1 2 v × TD + L
where:
  • v—Propagation velocity of the PD signal that travels along the cable;
  • TD—Time difference of the PD signal that arrives at two adjacent sensors;
  • L—Total length of the cable.

2.3. Multi-End PD Measurement

The multi-end PD measurement method had been proposed in [35] to measure a power cable that is longer than 2 km by clamping multiple PD sensors on the power cable. Three PD sensors were mounted on the monitored power cable as shown in Figure 1. The result proves the workability of the concept.
The multi-end PD measurement method uses the TDoA method to estimate the PD source on the power cable. However, the equation of TDoA for multi-end PD localization is different from the equation of TDoA for the double-end PD measurement method because the multi-end PD measurement method has three input measured signals while the double-end PD measurement method only has two input measured signals. The mathematical equation of TDoA for the multi-end PD measurement method is as follows [35,38]:
  • Case 1: t ab t cb
PD   location = 1 4 L   t ab   t cb + 1
  • Case 2: t ab   >   t cb
PD   location = 1 4 L 3 t cb t ab
where:
  • tab—Time difference between signal A[n] and signal B[n];
  • tcb—Time difference between signal C[n] and signal B[n].
  • If tab is less than tcb, then Equation (3) is applied. Otherwise, Equation (4) is applied.

3. Methodology

3.1. PD Localization Algorithm

Figure 2 shows a pictorial diagram of the online PD localization estimation system for underground cables proposed in this research work. The double-end PD measurement method is used in this proposed PD localization estimation system. Two PD sensors are mounted 2 km apart at locations A and B to measure PD arrival signals from an underground cable PD source.
The model of the PD signal is based on the transient signal mathematical model as present in Equation (5) [39]:
S t = A e a 1 t cos w d t φ e a 2 t cos φ
where:
  • A—The magnitude coefficient, assumed to be 0.01;
  • a 1 1   Ms 1 ;
  • a 2 10   Ms 1 ;
  • φ tan 1 w d a 2 ;
  • w d 2 π f d ;
  • f d 1   MHz .
In addition, the propagation velocity of the PD signal in the underground cable depends on the cable’s dielectric and semiconducting screen layers. The propagation velocity of the PD signal along the cable, v , is present in Equation (6) [40]:
v f = v s ε
where:
  • v s Propagation   velocity   in   free   space   300   m / μ s ;
  • ε—Effective relative permittivity of the cable dielectric and semiconducting screen layers.
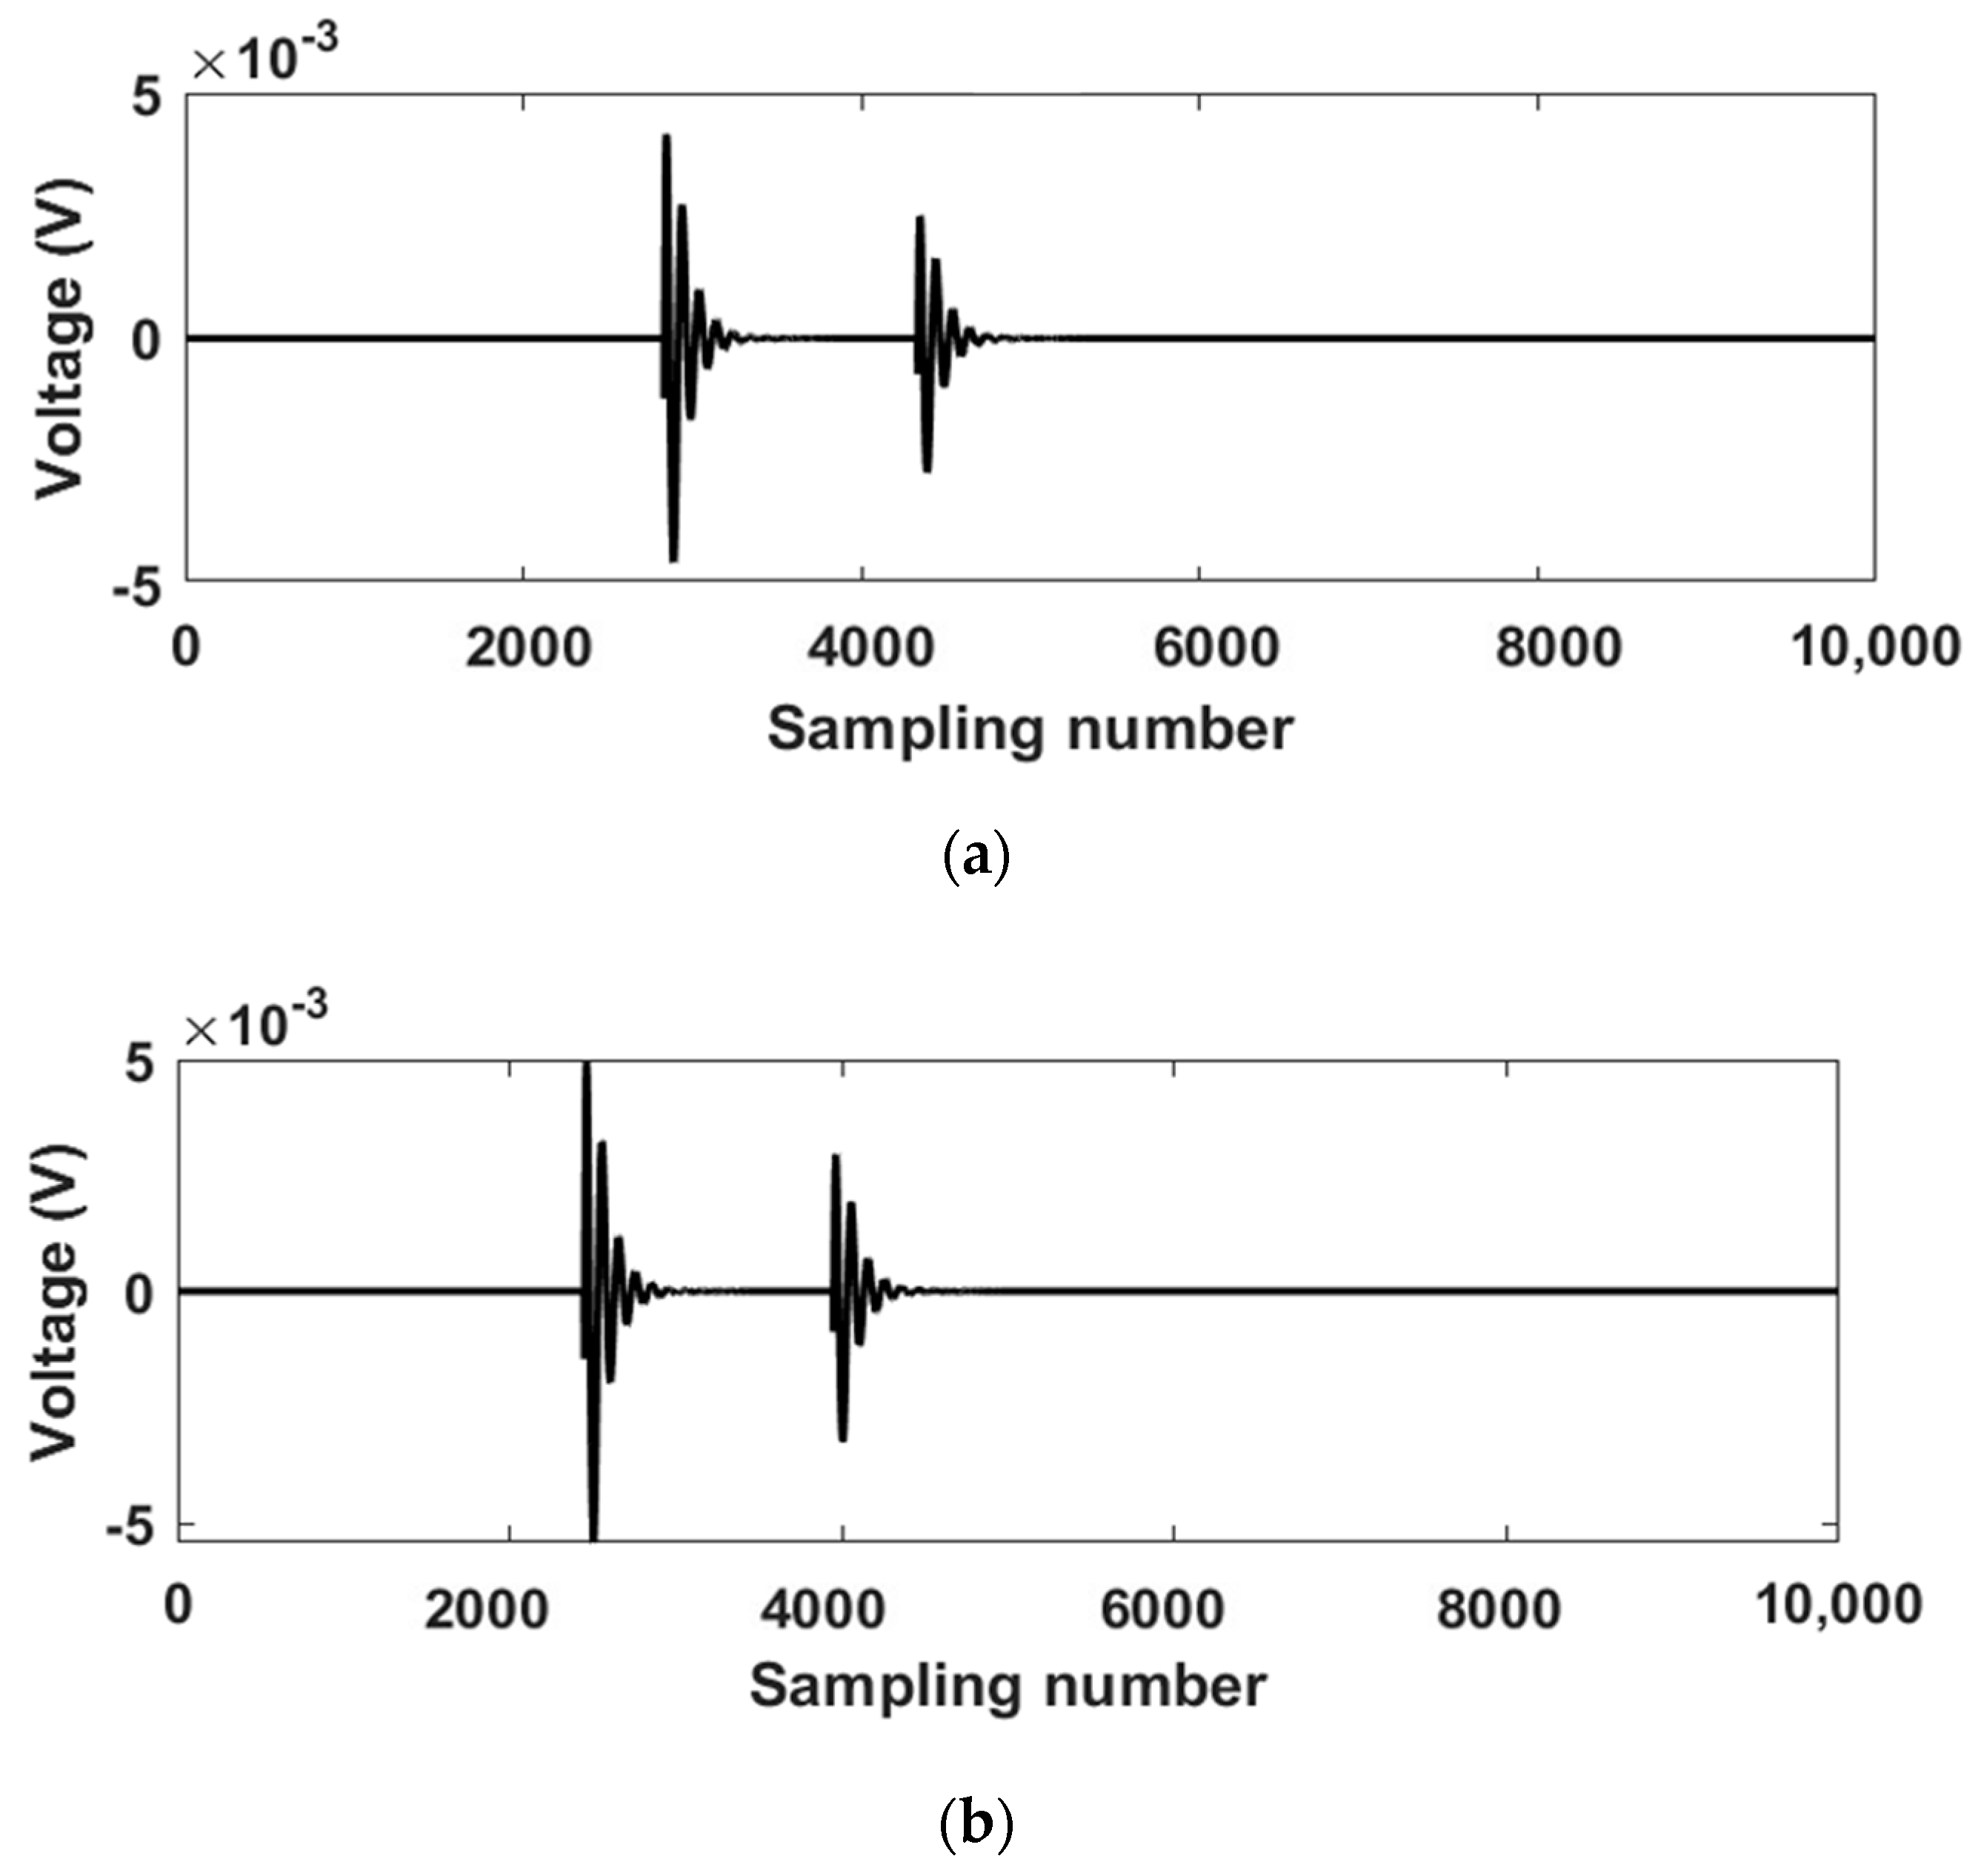
A laboratory experiment had been conducted in [40] for the specific medium-voltage three-core cable ( 50   mm 2 Cu / XLPE / PVC ,   8.7 / 15   kV ). The propagation velocity of the three-core cable is 156 m⁄μs. Thus, the propagation velocity of the cable is used to simulate the time delay of the PD signal from the PD source to the PD sensors assuming the three-core cable is the monitored cable. Figure 3 show the simulated PD pulses measured at PD Sensor A and PD Sensor B, respectively, using the PD mathematical model and shifted corresponding to the propagation velocity. White Gaussian noise (WGN) that varies from 4 dB to −18 dB will be added to the PD signals and discrete wavelet transform (DWT) with “bior3.5” mother wavelet will be used to de-noise the noisy signal. After obtaining the de-noised signals, a robust algorithm is required for an online PD localization estimation system to accurately estimate the PD location on underground cable even in the presence of strong environmental noise. In this research, the MPD, SC, and SCTM algorithms will be tested in the MATLAB environment using the online-PD source localization estimation system model.

3.2. Maximum Peak Detection Algorithm

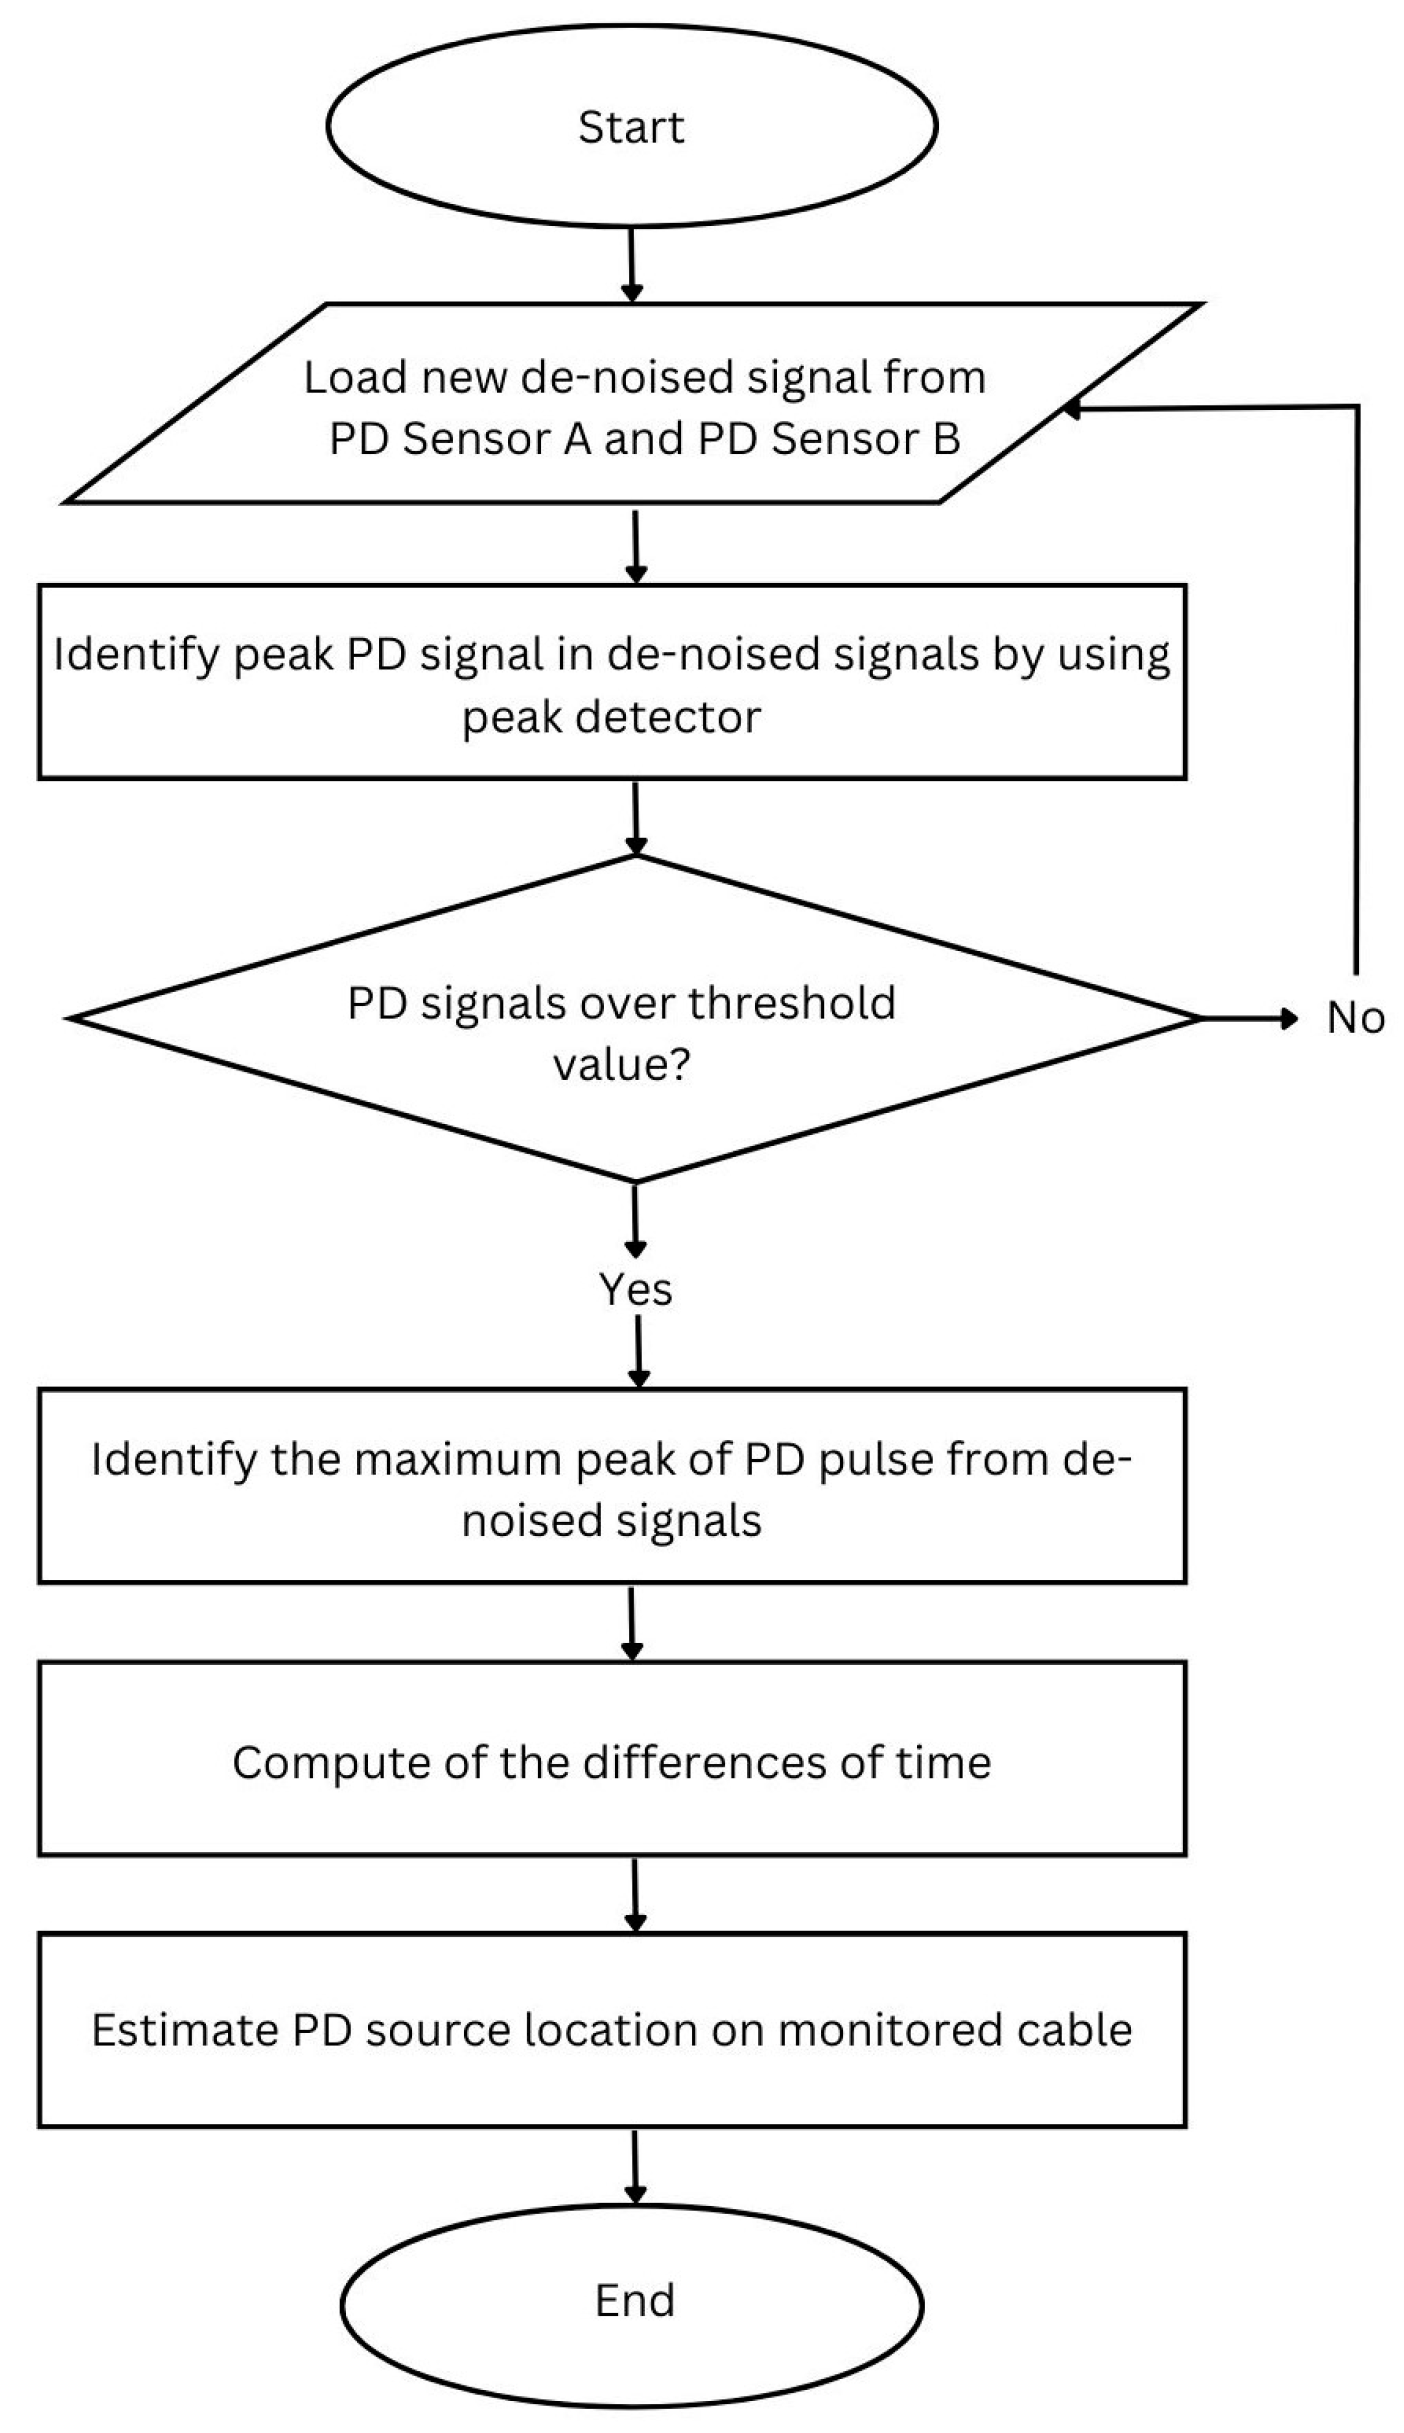
The Maximum Peak Detection (MPD) algorithm determines the estimated PD location by detecting the maximum peak in de-noised signals from PD Sensor A and PD Sensor B. Figure 4 shows the process flow of the MPD algorithm. The MPD algorithm begins by loading new de-noised signals from PD Sensor A Signal   A n and PD Sensor B Signal   B n . Second, using a peak detector, the de-noised signals will be checked for the presence of a PD pulse. If the maximum peak of the de-noised signals is greater than 3 mV, the algorithm will recognize the presence of a PD pulse. Otherwise, the algorithm will load new de-noised signals and enter a loop. The threshold value is set to 3 mV because it is the lowest PD value for the threshold value. If the threshold is less than 3 mV, the algorithm may detect the noise as a PD signal. Once the PD pulse is detected in the de-noised signal, the time that yields the maximum peak of the PD pulse in the de-noised signal is identified.
The time difference (TD) can then be calculated using Equation (7):
TD =   t max , A t max , B
where:
  • t max ,   A The   time   that   yields   a   maximum   peak   in   Signal   A n ;
  • t max ,   B The time that yields a maximum peak in Signal   B n
Finally, the estimated PD localization in the monitored cable will be determined using the time difference of arrival (TDoA) equation as shown in Equation (2) in Section 2.2.

3.3. Segmented Correlation (SC) Algorithm

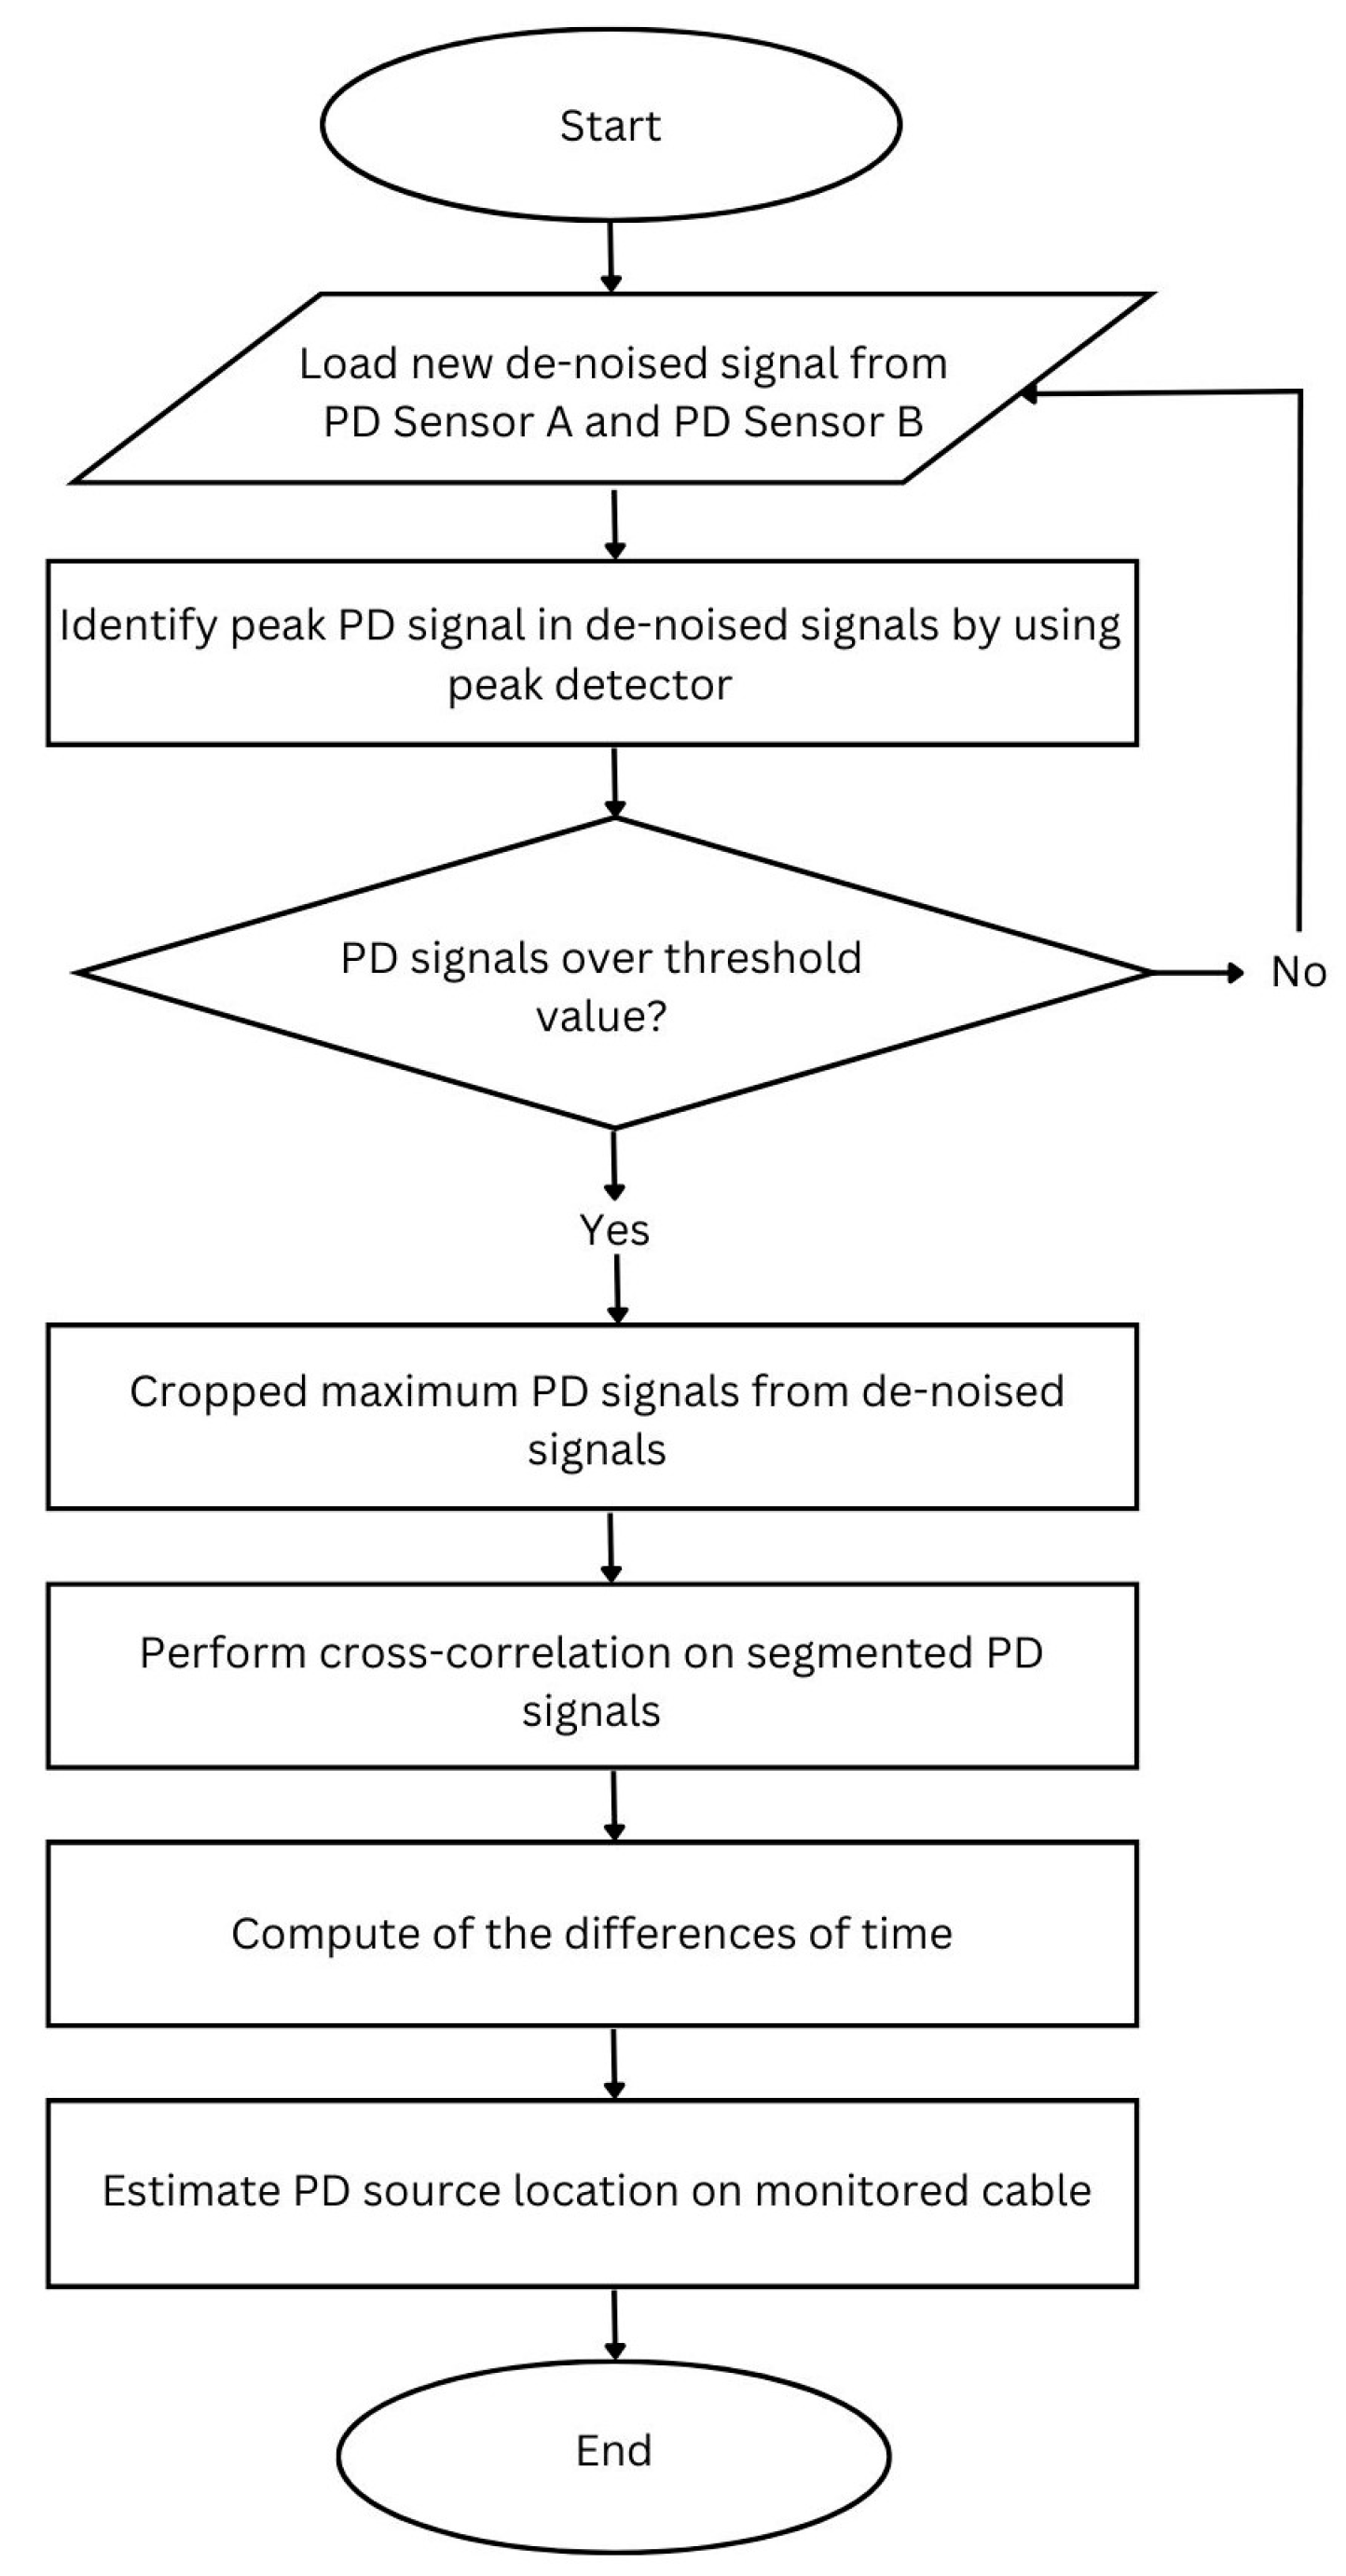
The segmented correlation (SC) technique was introduced in [25] in order to drastically reduce the program run time of the PD localization algorithm using a mathematical formula to calculate the exact shifted sample difference. The SC algorithm is first applied to the double-end PD measurement method in this paper after it was previously applied to the multi-end PD measurement method. Figure 5 shows the process flow of the SC algorithm for PD localization. The SC algorithm starts by loading new de-noised signals from PD Sensors A and B. Second, the de-noised signals will be checked for the presence of a PD pulse using a peak detector. The algorithm will recognize the presence of a PD pulse if the maximum peak of the de-noised signals is greater than 3 mV. Otherwise, the algorithm will load new de-noised signals and enter a loop. Once the PD pulse is detected in the de-noised signal, the two de-noised signals will be absolute into positive vector signals and cropped. Based on the MATLAB simulation setting, the de-noised signals from PD Sensor A ( Signal   A n ) will be the shifting signal and PD Sensor B ( Signal   B n ) will be set as the reference signal. ( Signal   A n ) and ( Signal   B n ) originally contain ten thousand samples for a ten milliseconds signal that were simulated with the sampling rate of 10 MHz. Three thousand samples are cropped from the shifting signal at its maximum peak while one thousand samples are cropped from the reference signal at its maximum peak because the shifting signal must be triple samples longer than the reference signal for the SC process.
Equation (8) shows the mathematical equation of the SC process to find the segmented correlation factor (SCF) between the shifting signal and reference signal.
SCF = k = 0 3000 A n × B n
Using Equation (8), the SCF can be determined by circularly shifting the shifting signal by one sample, multiplying it with the reference signal, and summarizing the product of two signals for three thousand times until the shifting signal is successfully shifted one cycle. Table 2 shows the SC process. The shifting signal peak leads the reference signal peak and yields a low SCF value in the left column of Table 2, the shifting signal peak meets the reference signal peak and yields the highest SCF value in the middle column of Table 2, and the shifting signal peak lags the reference signal and yields a low SCF value in the right column of Table 2.
The time difference (TD) between ( Signal   A n ) and ( Signal   B n ) can be determined by identifying the corresponding number of shifted samples that give the maximum segmented correlation factor ( NSCF max ). The NSCF max will be used to determine the number of shifted samples that give the maximum full correlation factor ( NFCF max ) . Equation (9) shows the mathematical equation to obtain NFCF max .
NFCF max = NSCF max + SS
SS is the sample of shifting difference between the number of samples in the reference signal that yield a maximum peak ( SSR max ) and the number of samples in the shifting signal that yield a maximum peak ( SSO max ) . If SSR max is more than SSO max , the SS equation is defined as in Equation (10). Otherwise, the SS equation is defined as in Equation (11):
SS = TSR + SSR max SSO max TSR cropped
SS = SSR max SSO max TSR cropped
where:
  • TSR—Total samples of the reference signal before the signal was cropped;
  • TSRcropped—Total samples of the reference signal after the signal was cropped.
Next, the sample difference can be determined using Equations (12) and (13). If NFCF max is less than half of TSR, the sample difference equation is defined in Equation (12). Otherwise, the sample difference equation is defined in Equation (13). Then, the TD can be determined using Equation (14). Finally, the estimated PD location can be determined using the TDoA equation as shown in Equation (2).
Sample   difference = NFCF max
Sample   difference = TSR NFCF max
TD = Sample   difference Sampling   frequency

3.4. Segmented Correlation Trimmed Mean Data Filtering (SCTM) Algorithm

The segmented correlation trimmed mean data filtering (SCTM) algorithm is a PD localization algorithm that applies the trimmed mean data filtering (TMDF) technique to further enhance the accuracy in estimating PD location after the SCTM algorithm estimates 200 estimated PD localization samples using the SC technique. This is also the first SCTM algorithm applied in the double-end PD measurement method which was previously applied in the multi-end PD measurement method. The TMDF technique in the SCTM algorithm is a statical analysis technique that trims out the potential inaccurate estimated PD localization samples and finds the average of the high-precision estimated PD localization samples to produce a new estimated PD location. Figure 6 shows the process flow of the SCTM algorithm.
First, the SCTM algorithm will use the SC technique to estimate 200 samples of the estimated PD location. The TMDF requires a large number of 200 estimated PD localization samples to perform the statistical analysis. Second, the SCTM algorithm will sort the estimated PD localization samples according to the ascending value as the pre-processing act for the trimming process. Third, the SCTM algorithm will trim out the first quartile and third quartile of the estimated PD samples as the first layer of data filtering. The mathematical equation for determining the interquartile range (IQR) is defined in Equation (15).
IQR = Q 3 Q 1
The lower twenty-fifth percentile and the upper seventy-fifth percentile of the estimated PD localization samples have a PD localization value that differs from most of the samples, making this the most robust scale for the trimming process. Table 3 depicts this process by displaying 200 estimated PD locations derived from the SC algorithm. As the first data filtering step, the first 50 estimated PD locations and the last 50 estimated PD locations were trimmed out. As shown in Table 3, any false detections will be listed in the first 50 PD and last 50 PD sample locations.
The clustering process will then be applied to the 100 estimated PD localization samples that fall within the IQR, as shown by the 100 unshaded estimated PD locations in Table 3. As shown in Figure 7, the 100 estimated PD localization samples will be divided into 15 classes. Figure 7 depicts a bar chart depicting the estimated PD location during the clustering process. The lowest PD localization value ( S min ) and highest PD localization value ( S max ) from the 100 estimated PD localization samples will be used to determine the class interval k as defined in Equation (16).
k = S max S min 15
The mod class that has the highest estimated PD localization samples will be selected for the averaging process because all the samples in the mod class are high precision. Finally, the new estimated PD location can be computed by determining the mean of the mod class’s estimated PD localization samples as defined in Equation (17):
Mean PD = n = 1 m S n m
where:
  • n 1 , 2 , 3 m ;
  • Sn—Estimated PD localization samples that enter the mod class;
  • m—Total number of samples that enter the mod class.

4. Result and Discussion

A series of simulations in the MATLAB environment was run to evaluate the accuracy of the PD estimates for the MPD, SC, and SCTM algorithms. The results are divided into two parts: maximum PD estimation error and average PD estimation error.

4.1. Maximum PD Estimation Error

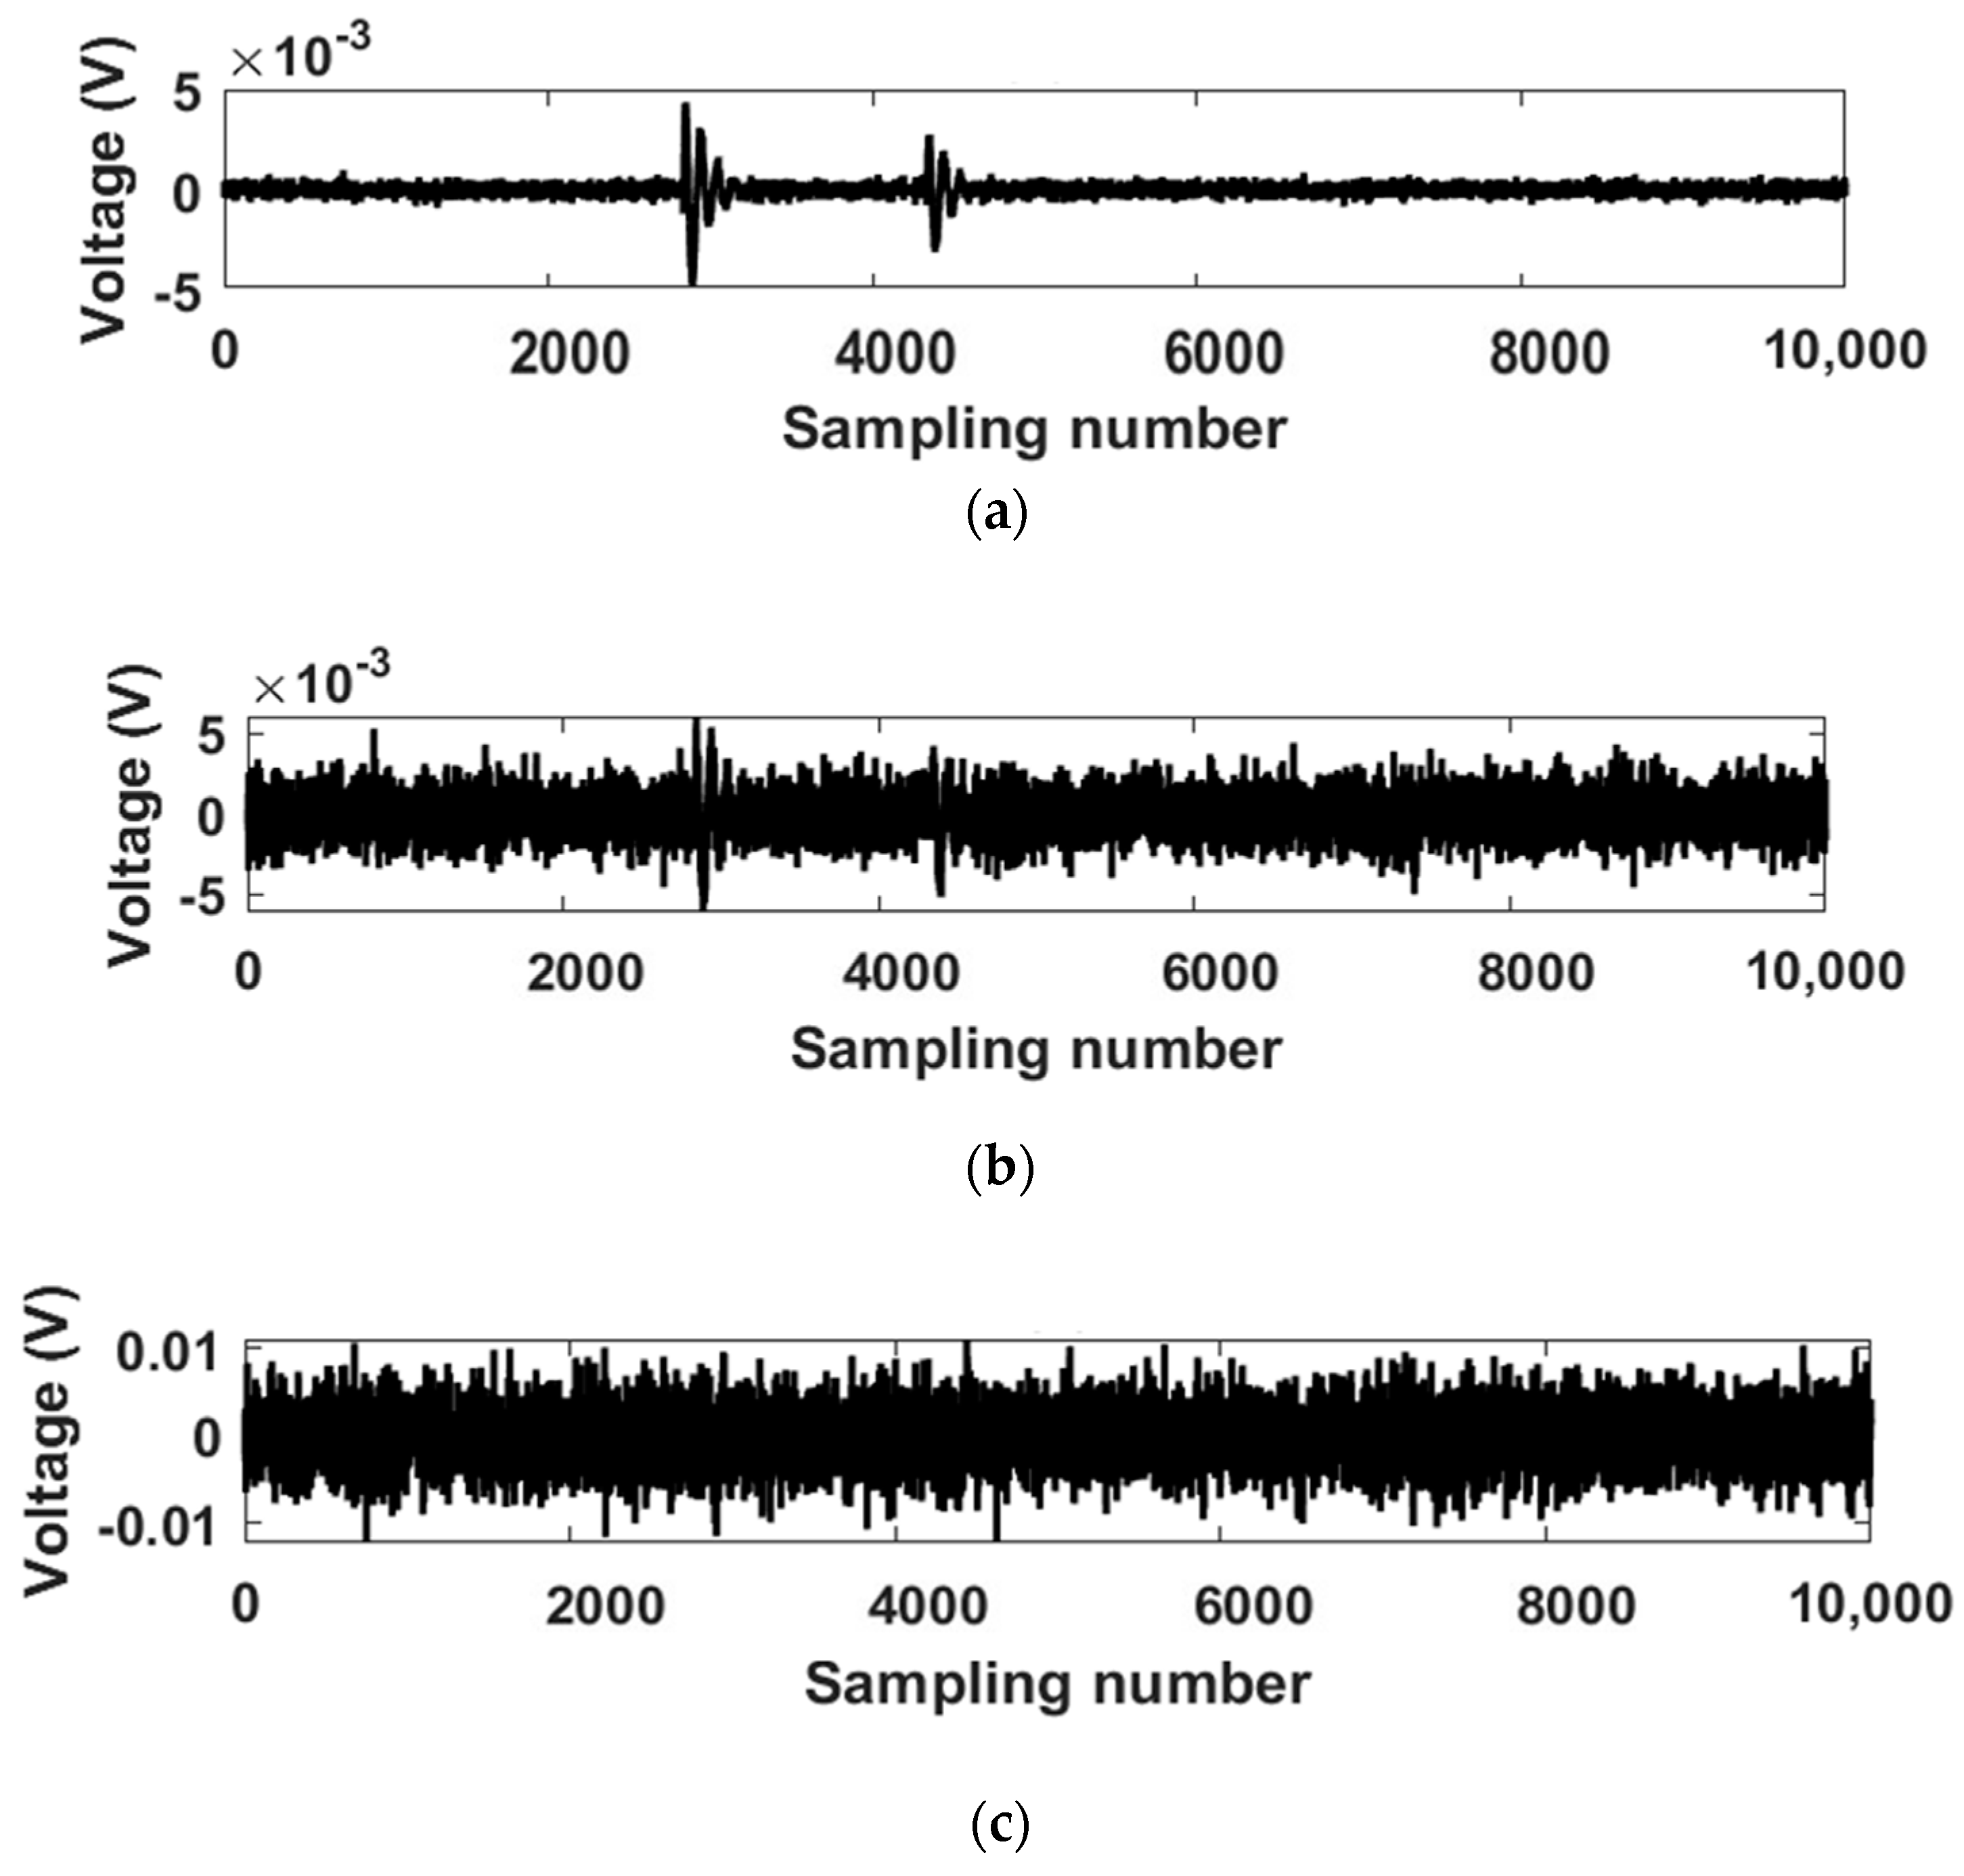
The MPD, SC, and SCTM algorithms were run one hundred times in this section to generate one hundred estimates of the PD location on the power cable for each signal-to-noise (SNR) level. The SNR range, as shown in Table 4, varies from 4 dB to −18 dB with a 2 dB decrease step. Figure 8 shows the PD signals added with 4 dB SNR, −10 dB SNR, and −18 dB SNR, respectively. Figure 9 shows the DWT de-noised PD signals with 4 dB SNR, −10 dB SNR, and −18 dB SNR, respectively. The higher the noise in the measured PD signal, the lower the SNR value.
The maximum PD estimate error is the largest error generated using each algorithm out of one hundred estimated PD locations. When the SNR is reduced from 4 dB to −18 dB, all three algorithms exhibit an increase in error percentage, as calculated using Equation (18). The SC and SCTM algorithms have the same low maximum PD estimation error of only 0.0102% when the SNR is 4 dB. Meanwhile, the maximum PD estimation error for the MPD algorithm is 0.1068%. When the SNR value MPD decreases, the MPD algorithm has the highest increase in maximum PD estimation error, followed by the SC algorithm and finally the SCTM algorithm.
%   Error = Actual   fault   location Estimated   fault   location Total   system   length × 100
Based on the comparison of the MPD algorithm and the SC algorithm in Table 4, the segmented correlation technique in the SC algorithm improved the PD localization accuracy. The segmented correlation technique has demonstrated that in the MPD algorithm, identifying the correlation bond between two signals rather than the peak of the PD signal has a significant effect on improving PD localization accuracy.
When the SNR drops below −16 dB, however, both the MPD and SC algorithms exhibit more than 50% error in the maximum PD estimate. This is because high noise levels are possible, and DWT de-noising techniques fail to suppress a well-measured PD signal. The graphs in Figure 10 and Figure 11 show the maximum PD estimation error versus SNR for the MPD algorithm and the maximum PD estimation error versus SNR for the SC algorithm, respectively. The sharp increase in both graphs when SNR reaches −16 dB and below indicates that both the MPD and SC algorithms are likely to lose accuracy after −14 dB and are, therefore, unsuitable for performing PD localization estimation. As a result, the effective operating range of the MPD and SC algorithms is SNR greater than −16 dB.
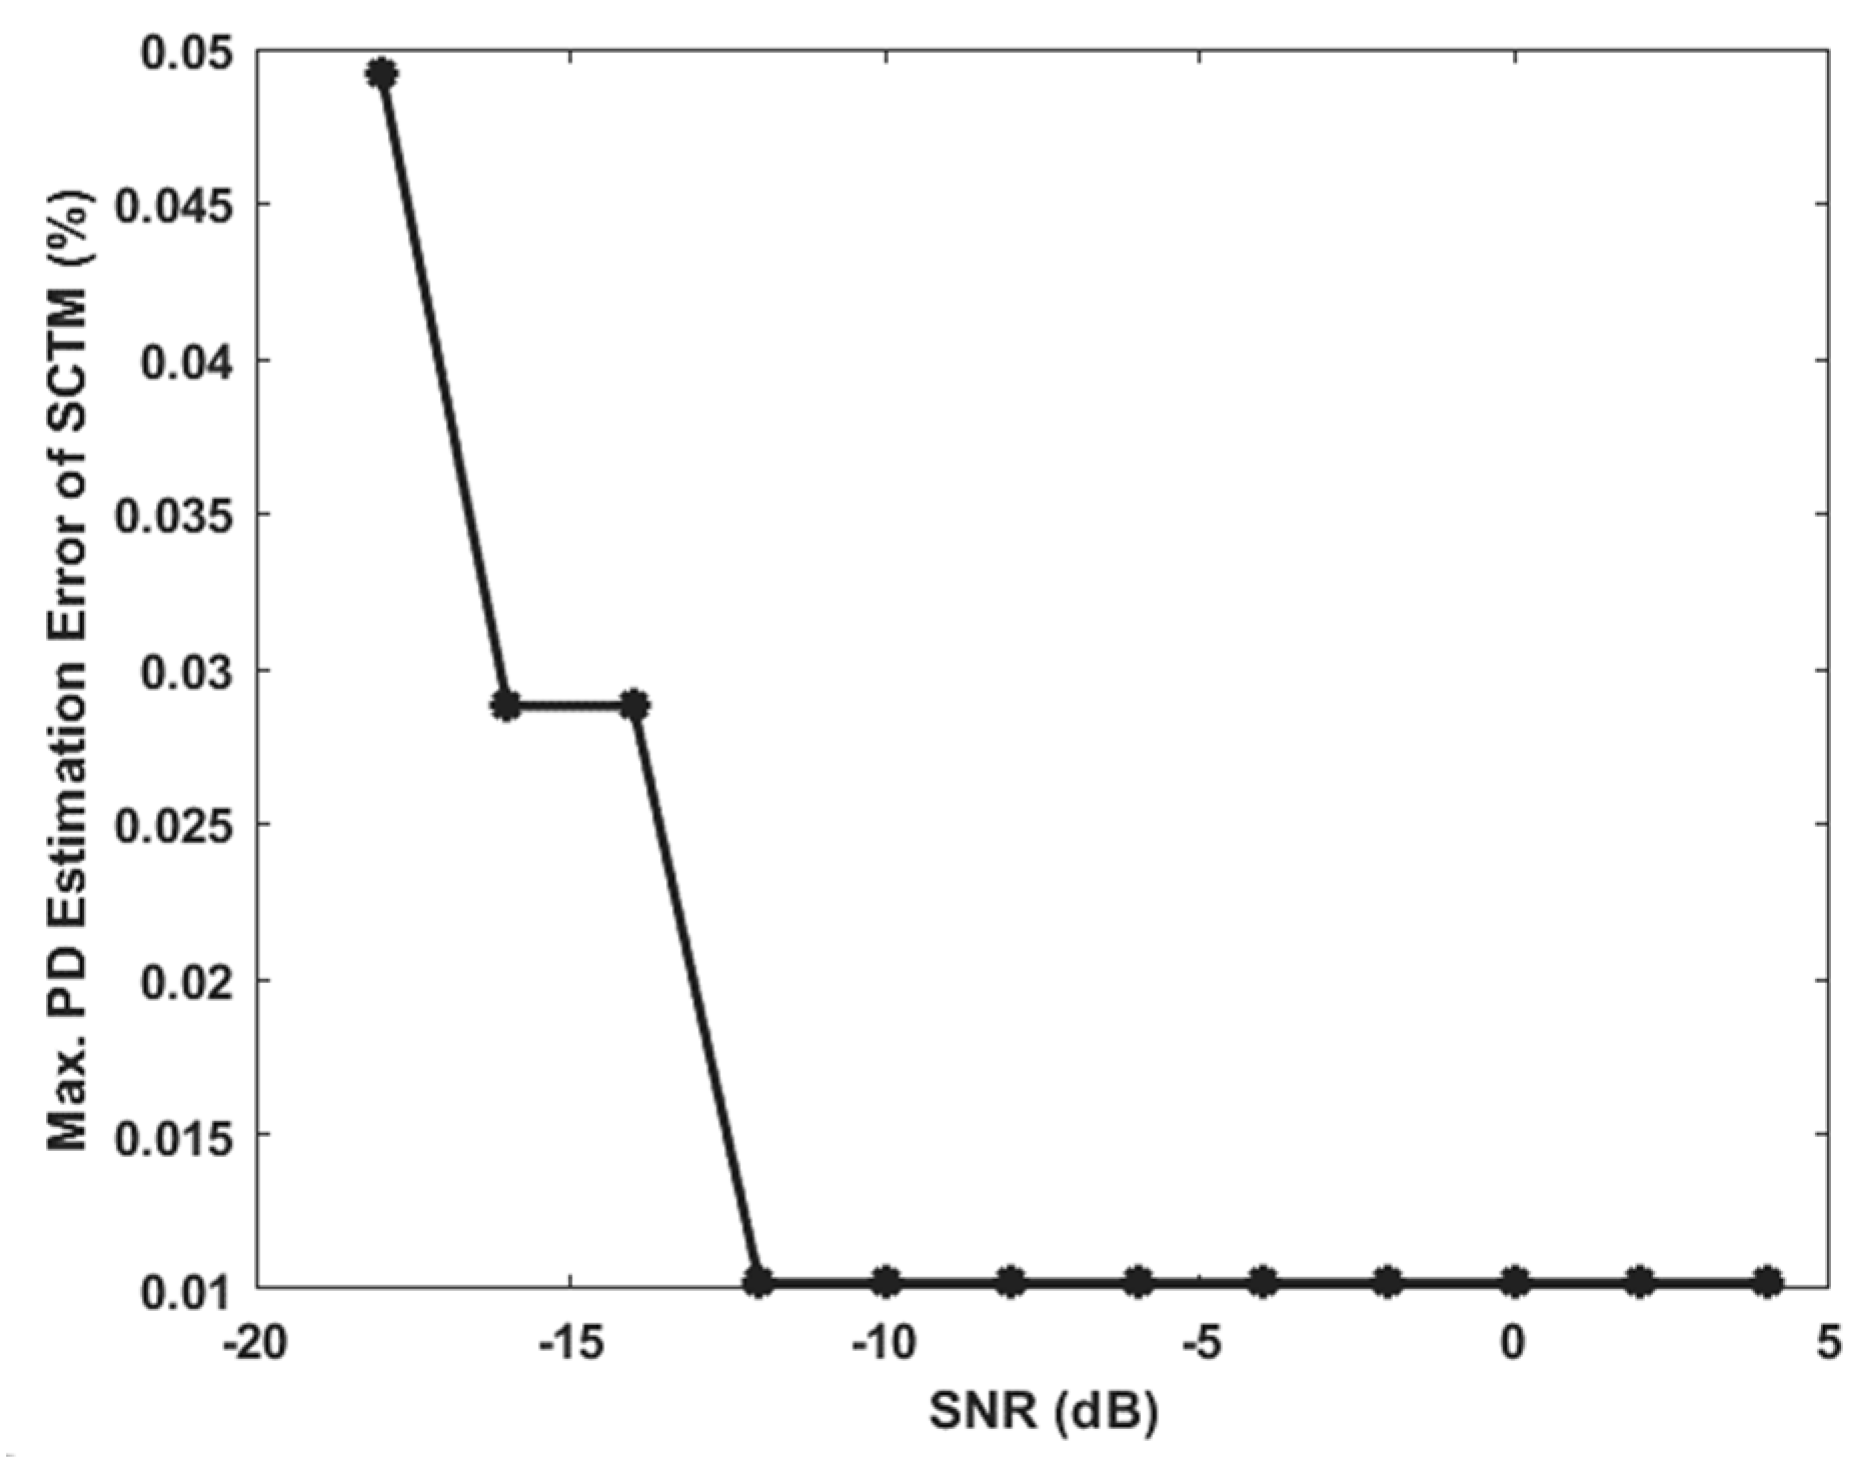
As shown in Table 4, SCTM has the lowest maximum PD estimation error of the three algorithms, with SNR ranging from 4 dB to −18 dB. As the SNR decreased from 4 dB to −12 dB, the maximum PD estimation error for the SCTM algorithm remained constant. After the SNR falls below −12 dB, the maximum PD estimation error increases slightly. The maximum PD estimation error is still less than 0.05% when the SNR reaches −18 dB.
The maximum PD estimation error of the SCTM algorithm increased more slowly than that of the SC algorithm as the SNR increased from 4 dB to −18 dB. Figure 12 depicts a graph of the SCTM algorithm’s maximum PD estimation error versus SNR. According to Figure 12, the accuracy of the SCTM algorithm begins to decrease after −12 dB and remains below 0.05% when it reaches −18 dB, whereas the SC algorithm already has a probability of having a false PD localization estimation.
The maximum PD estimation error of the SCTM algorithm is predicted to increase further based on Figure 12 because the graph in Figure 12 shows the same exponential upward trend line as in Figure 11. The trimmed mean data filtering technique, on the other hand, slowed the increase in maximum PD estimation error as SNR increased. As a result, the operating limit of the SCTM algorithm cannot be determined because the algorithm’s maximum PD estimation error accuracy is still less than 0.05% when the SNR is −18 dB.

4.2. Average PD Estimation Error

In this section, the MPD, SC, and SCTM algorithms were run one hundred times to generate one hundred estimates of PD locations on the power cable for each SNR level. Similar to Section 4.1, the SNR level decreased from 4 dB to −18 dB with a 2 dB decrease step, as shown in Table 5. One hundred PD localization error estimates for each level will be averaged to identify the average errors of each PD localization algorithm. A lower PD average estimate error indicates a higher accuracy of the PD localization algorithm. For average PD estimation errors of less than 0.5%, the MPD algorithm can operate at SNR above −10 dB, the SC algorithm at SNR above −14 dB, and the SCTM algorithm at SNR below −18 dB as SCTM has a very low average PD estimation error at an SNR of −18 dB. Thus, the SCTM algorithm is able to detect the early stage of the PD source on the power cable because the amplitude of the PD signal from the PD source is low during the early stage. The SCTM algorithm is the most noise robust, followed by the SC algorithm and, finally, the MPD algorithm.
Figure 13 shows the graph of average PD estimation error versus SNR for the MPD algorithm. The average error of the MPD algorithm exponentially increases with the decrease in SNR. Figure 14 shows the graph of average PD estimation error versus SNR for the SC algorithm. The average PD estimation error of the SC algorithm remains low and almost static when the SNR decreases from 4 dB to −14 dB. When the SNR is less than −14 dB, the average PD estimation error of the SC algorithm increases drastically. This characteristic of the graph is also shown in the graph of average PD estimation error versus SNR for the SCTM algorithm in Figure 15. This shows that the SC technique can suppress the average PD localization error until a certain limit, although the noise level keeps increases. When the noise level surpasses the limit, the average PD localization error will increase severely. Although the trend in the SC algorithm and SCTM algorithm are similar in term of average PD estimation error versus SNR, the value of the percentage error for the SCTM algorithm is significantly lower than for the SC algorithm. This is because the SCTM algorithm applies the TMDF technique to further suppress the PD estimation error. The results of the maximum PD estimation error versus SNR and average PD estimation error versus SNR coincidently show that the SCTM algorithm has the highest noise robustness, followed by the SC algorithm, and lastly by the MPD algorithm.

5. Conclusions

This research discovered that as the SNR decreases, the error of estimated PD localization increases. In other words, the higher the noise in the environment, the lower the accuracy of the PD localization algorithm. Among the three algorithms that use the double-end PD localization method, the SCTM algorithm has the highest accuracy in estimating the PD location on a power cable, followed by the SC algorithm, and lastly by the MPD algorithm. The finding of this paper shows that the SC technique and TMDF technique are suitable to apply in the PD localization for the double-end PD measurement method. The accuracy of the estimated PD localization has been increased after applying both the SC and TMDF techniques. Further research and development can be incorporated into the trimming data filtering algorithm to obtain higher precision data. Determining the total absolute difference between the reference sample and the PD localization sample, for example, can reduce the PD localization estimation error and increase accuracy.

Author Contributions

Conceptualization, A.A.B., C.C.Y. and C.K.F.; methodology, C.C.Y. and C.K.F.; software, A.A.B. and C.C.Y.; validation, C.C.Y., Y.H.P.; H.L. and M.N.K.H.R.; formal analysis, A.A.B., C.C.Y. and C.K.F.; investigation, A.A.B.; resources, C.C.Y.; data curation, A.A.B., C.C.Y. and C.K.F.; writing—original draft preparation, A.A.B.; writing—review and editing, C.K.F., H.L. and M.N.K.H.R.; visualization, A.A.B.; supervision, C.C.Y. and Y.H.P.; project administration, A.A.B. and C.K.F.; funding acquisition, C.C.Y. All authors have read and agreed to the published version of the manuscript.

Funding

This research was funded by a grant from Universiti Malaysia Sabah (SPLB Grant: SLB2204 & SLB2213).

Institutional Review Board Statement

Not applicable.

Informed Consent Statement

Not applicable.

Data Availability Statement

Not applicable.

Acknowledgments

The authors would like to thank the High Voltage Laboratory and HiPER UMS for their technical support.

Conflicts of Interest

The authors declare no conflict of interest.

References

  1. Duan, L.; Hu, J.; Zhao, G.; Chen, K.; He, J.; Wang, S. Identification of Partial Discharge Defects Based on Deep Learning Method. IEEE Trans. Power Deliv. 2019, 34, 1557–1568. [Google Scholar] [CrossRef]
  2. Lu, B.; Li, S.; Cui, Y.; Zhao, X.; Zhang, D.; Kang, Y.; Dong, H. Insulation Degradation Mechanism and Diagnosis Methods of Offshore Wind Power Cables: An Overview. Energies 2022, 16, 322. [Google Scholar] [CrossRef]
  3. Jin, Y.; Zhang, B.; Mu, H.; Zheng, Y.; Zhan, J.; Xianjun, S.; Li, C.; Zhang, C.; Zhang, G. A Novel Partial Discharge Localization Method in Transformer Based on Signal Propagation in Winding. In Proceedings of the 2021 International Conference on Advanced Electrical Equipment and Reliable Operation (AEERO), Beijing, China, 15–17 October 2021; IEEE: Piscataway, NJ, USA; pp. 1–5. [Google Scholar] [CrossRef]
  4. Sun, C.; Che, R.; Zhao, Y. Simulation Analysis of Partial Discharge Detection and Localization of Power Cable Based on ATP-EMTP. In Proceedings of the 2020 Asia Energy and Electrical Engineering Symposium (AEEES), Chengdu, China, 29–31 May 2020; IEEE: Piscataway, NJ, USA; pp. 275–279. [Google Scholar] [CrossRef]
  5. Mao, Y.; Ding, Y.; Wu, J.; Chen, J. Research on Partial Discharge Detection Technology for Power Transformers. In Proceedings of the 2020 IEEE 4th Conference on Energy Internet and Energy System Integration (EI2), Wuhan, China, 30 October–01 November 2020; IEEE: Piscataway, NJ, USA; pp. 3956–3959. [Google Scholar] [CrossRef]
  6. Wen, Z.; Xiong, B.; Gu, G. Detection and Localization of Partial Discharge Based on Flexible Piezoelectric Thin Film Material. In Proceedings of the 2019 22nd International Conference on Electrical Machines and Systems (ICEMS), Harbin, China, 11–14 August 2019; IEEE: Piscataway, NJ, USA; pp. 1–4. [Google Scholar] [CrossRef]
  7. Rahimbakhsh, M.; Torres, J.; Werle, P.; Gockenbach, E.; Azirani, M.A. Investigation of Partial Discharge Localization Based on Electrical Measurements. In Proceedings of the 2018 IEEE 2nd International Conference on Dielectrics (ICD), Budapest, Hungary, 1–5 July 2018; IEEE: Piscataway, NJ, USA; pp. 1–4. [Google Scholar] [CrossRef]
  8. Ali, N.H.N.; Giannakou, M.; Nimmo, R.D.; Lewin, P.L.; Rapisarda, P. Classification and Localisation of Multiple Partial Discharge Sources within a High Voltage Transformer Winding. In Proceedings of the 2016 IEEE Electrical Insulation Conference (EIC), Montreal, QC, Canada, 19–22 June 2016; IEEE: Piscataway, NJ, USA; pp. 519–522. [Google Scholar] [CrossRef]
  9. Predl, F.; Guo, W.; Hoek, S.; Krüger, M. Combining Acoustic and Electrical Methods to Locate Partial Discharge in a Power Transformer. In Proceedings of the 2015 IEEE 11th International Conference on the Properties and Applications of Dielectric Materials (ICPADM), Sydney, Australia, 19–22 July 2015; IEEE: Piscataway, NJ, USA; pp. 424–427. [Google Scholar] [CrossRef]
  10. Duval, M. A Review of Faults Detectable by Gas-in-Oil Analysis in Transformers. IEEE Electr. Insul. Mag. 2002, 18, 8–17. [Google Scholar] [CrossRef] [Green Version]
  11. Rathod, V.B.; Kumbhar, G.B.; Bhalja, B.R. Single-Sensor Based Acoustic Time Reversal Technique for Partial Discharge Localization in Power Transformer. In Proceedings of the 2021 IEEE 5th International Conference on Condition Assessment Techniques in Electrical Systems (CATCON), Kozhikode, India, 3–5 December 2021; IEEE: Piscataway, NJ, USA; pp. 151–156. [Google Scholar] [CrossRef]
  12. Karami, H.; Rachidi, F.; Azadifar, M.; Rubinstein, M. An Acoustic Time Reversal Technique to Locate a Partial Discharge Source: Two-Dimensional Numerical Validation. IEEE Trans. Dielectr. Electr. Insul. 2020, 27, 2203–2205. [Google Scholar] [CrossRef]
  13. Ghosh, R.; Chatterjee, B.; Dalai, S. A new method for the estimation of time difference of arrival for localization of partial discharge sources using acoustic detection technique. In Proceedings of the 2016 IEEE 7th Power India International Conference (PIICON), Bikaner, India, 25–27 November 2016; pp. 1–5. [Google Scholar] [CrossRef]
  14. Markalous, S.M.; Tenbohlen, S.; Feser, K. Detection and Localization of Partial Discharges in Power Transformers Using Acoustic and Electromagnetic Signals. IEEE Trans. Dielectr. Electr. Insul. 2008, 15, 1576–1583. [Google Scholar] [CrossRef]
  15. Lundgaard, L.E. Partial Discharge. XIV. Acoustic Partial Discharge Detection-Practical Application. IEEE Electr. Insul. Mag. 1992, 8, 34–43. [Google Scholar] [CrossRef]
  16. Zhao, L.; Ye, L.; Yu, B.; Lin, H.; Yang, Y.; Zheng, W. Research on Partial Discharge Localization in 252kV GIS Using Ultrasonic Associated with Electromagnetic Wave Method. In Proceedings of the 2020 IEEE 5th International Conference on Integrated Circuits and Microsystems (ICICM), Nanjing, China, 23–25 October 2020; IEEE: Piscataway, NJ, USA; pp. 14–18. [Google Scholar] [CrossRef]
  17. Shen, P.; Chen, T.; Tang, D.; He, T.; Ju, L.; Wang, H. The Accuracy Improvement Method for Partial Discharge UHF Measurement Data Based on Kalman Filter Algorithm. In Proceedings of the 2022 Power System and Green Energy Conference (PSGEC), Shanghai, China, 25–27 August 2022; IEEE: Piscataway, NJ, USA; pp. 1082–1086. [Google Scholar] [CrossRef]
  18. Tian, Y.; Qi, B.; Zhuo, R.; Fu, M.; Li, C. Locating Partial Discharge Source Occurring on Transformer Bushing by Using the Improved TDOA Method. In Proceedings of the 2016 International Conference on Condition Monitoring and Diagnosis (CMD), Xi’an, China, 25–28 September 2016; IEEE: Piscataway, NJ, USA; pp. 144–147. [Google Scholar] [CrossRef]
  19. Tienghong, T.; Promwong, S. A Study of Partial Discharge Localization in Transformer. In Proceedings of the 2019 16th International Conference on Electrical Engineering/Electronics, Computer, Telecommunications and Information Technology (ECTI-CON), Pattaya, Thailand, 10–13 July 2019; IEEE: Piscataway, NJ, USA; pp. 333–336. [Google Scholar] [CrossRef]
  20. Raja, K.; Floribert, T. Comparative Investigations on UHF and Acoustic PD Detection Sensitivity in Transformers. In Proceedings of the 2002 IEEE International Symposium on Electrical Insulation (Cat. No.02CH37316), Boston, MA, USA, 7–10 April 2002; IEEE: Piscataway, NJ, USA; pp. 150–153. [Google Scholar] [CrossRef]
  21. Judd, M.; Yang, L.; Hunter, I. Partial Discharge Monitoring of Power Transformers Using UHF Sensors. Part I: Sensors and Signal Interpretation. IEEE Electr. Insul. Mag. 2005, 21, 5–14. [Google Scholar] [CrossRef]
  22. Tenbohlen, S.; Denissov, D.; Hoek, S.M.; Markalous, S. Partial Discharge Measurement in the Ultra High Frequency (UHF) Range. IEEE Trans. Dielectr. Electr. Insul. 2008, 15, 1544–1552. [Google Scholar] [CrossRef]
  23. Wang, B.; Dong, M.; Xie, J.; Ma, A. Ultrasonic Localization Research for Corona Discharge Based on Double Helix Array. In Proceedings of the 2018 IEEE International Power Modulator and High Voltage Conference (IPMHVC), Jackson, WY, USA, 3–7 June 2018; pp. 297–300. [Google Scholar] [CrossRef]
  24. Samaitis, V.; Mažeika, L.; Jankauskas, A.; Rekuvienė, R. Detection and Localization of Partial Discharge in Connectors of Air Power Lines by Means of Ultrasonic Measurements and Artificial Intelligence Models. Sensors 2020, 21, 20. [Google Scholar] [CrossRef]
  25. Riba, J.-R.; Gomez-Pau, A.; Moreno-Eguilaz, M. Sensor Comparison for Corona Discharge Detection Under Low Pressure Conditions. IEEE Sens. J. 2020, 20, 11698–11706. [Google Scholar] [CrossRef]
  26. Riba, J.-R.; Gómez-Pau, A.; Moreno-Eguilaz, M. Experimental Study of Visual Corona under Aeronautic Pressure Conditions Using Low-Cost Imaging Sensors. Sensors 2020, 20, 411. [Google Scholar] [CrossRef] [PubMed]
  27. Shen, Z.; Wang, J.; Wei, G. An Improved Partial Discharge Detection System Based on UV Pulses Detection. Sensors 2020, 20, 4767. [Google Scholar] [CrossRef] [PubMed]
  28. Wang, J.; Li, P.; Deng, X.; Li, N.; Xie, X.; Liu, H.; Tang, J. Evaluation on Partial Discharge Intensity of Electrical Equipment Based on Improved ANFIS and Ultraviolet Pulse Detection Technology. IEEE Access 2019, 7, 126561–126570. [Google Scholar] [CrossRef]
  29. Chen, J.; Wang, J.; He, W.; Xu, Z. Assessing Partial Discharge Intensity of Electrical Equipment Based on UV Detection and the ANFIS Algorithm: Assessing Partial Discharge Intensity Based on ANFIS Algorithm. IEEJ Trans. Electr. Electron. Eng. 2019, 14, 245–251. [Google Scholar] [CrossRef]
  30. Wen, Q.; Pan, X.; Yan, N.; Xu, N. Design of Intelligent Ultraviolet Pulse Detector for GIS Partial Discharge. In Proceedings of the 2018 2nd IEEE Conference on Energy Internet and Energy System Integration (EI2), Beijing, China, 20–22 October 2018; IEEE: Piscataway, NJ, USA; pp. 1–5. [Google Scholar] [CrossRef]
  31. Riba, J.-R.; Abomailek, C.; Casals-Torrens, P.; Capelli, F. Simplification and Cost Reduction of Visual Corona Tests. IET Gener. Transm. Distrib. 2018, 12, 834–841. [Google Scholar] [CrossRef]
  32. Zhang, Z.; Zhang, W.; Zhang, D.; Xiao, Y.; Deng, J.; Xia, G. Comparison of Different Characteristic Parameters Acquired by UV Imager in Detecting Corona Discharge. IEEE Trans. Dielectr. Electr. Insul. 2016, 23, 1597–1604. [Google Scholar] [CrossRef]
  33. Wang, S.; He, Y.; Yin, B.; Zeng, W.; Deng, Y.; Hu, Z. A Partial Discharge Localization Method in Transformers Based on Linear Conversion and Density Peak Clustering. IEEE Access 2021, 9, 7447–7459. [Google Scholar] [CrossRef]
  34. Isa, M.; Elkalashy, N.I.; Lehtonen, M.; Hashmi, G.M.; Elmusrati, M.S. Multi-End Correlation-Based PD Localization Technique for Medium Voltage Covered-Conductor Lines. IEEE Trans. Dielectr. Electr. Insul. 2012, 19, 936–946. [Google Scholar] [CrossRef]
  35. Yii, C.C.; Rohani, M.N.K.H.; Isa, M.; Hassan, S.I.S. Multi-End PD Localization Algorithm Using Segmented Correlation and Trimmed Mean Data Filtering Techniques for MV Underground Cable. IEEE Trans. Dielectr. Electr. Insul. 2017, 24, 92–98. [Google Scholar] [CrossRef]
  36. Wild, M.; Tenbohlen, S.; Gulski, E.; Jongen, R.; De Vries, F. Practical aspects of PD localization for long length power cables. In Proceedings of the 2013 IEEE Electrical Insulation Conference (EIC), Ottawa, ON, Canada, 2–5 June 2013; pp. 499–503. [Google Scholar] [CrossRef]
  37. Abdullah, A.; Rohani, M.; Isa, M.; Hamid, H.; Arshad, S.; Othman, M. Real On-Site Partial Discharge Measurement Technique in Medium Voltage Power Cable. In Proceedings of the 2018 IEEE 7th International Conference on Power and Energy (PECon), Kuala Lumpur, Malaysia, 3–4 December 2018; IEEE: Piscataway, NJ, USA; pp. 405–408. [Google Scholar] [CrossRef]
  38. Yii, C.C.; Rohani, M.N.K.H.; Isa, M.; Hassan, S. Three-Point Technique for Partial Discharge Localization on XLPE Armoured Underground Cable. Appl. Mech. Mater. 2015, 793, 119–123. [Google Scholar] [CrossRef]
  39. Li, J.; Jiang, T.; Grzybowski, S.; Cheng, C. Scale Dependent Wavelet Selection for De-Noising of Partial Discharge Detection. IEEE Trans. Dielectr. Electr. Insul. 2010, 17, 1705–1714. [Google Scholar] [CrossRef]
  40. Khan, A.A.; Malik, N.; Al-Arainy, A.; Alghuweinem, S. Investigation of Attenuation Characteristics of PD Pulse during Propagation in XLPE Cable. In Proceedings of the 2013 IEEE Power & Energy Society General Meeting, Vancouver, BC, Canada, 21–25 July 2013; IEEE: Piscataway, NJ, USA; pp. 1–5. [Google Scholar] [CrossRef]
Figure 1. (a) PD occurs between A and B. (b) PD occurs between B and C.
Energies 16 01817 g001
Figure 2. Diagram of the online PD localization estimation system for underground cables.
Energies 16 01817 g002
Figure 3. (a) Simulated PD signals measured at PD Sensor A. (b) Simulated PD signals measured at PD Sensor B.
Energies 16 01817 g003
Figure 4. Process flow of the MPD algorithm.
Energies 16 01817 g004
Figure 5. Process flow of the SC algorithm.
Energies 16 01817 g005
Figure 6. Process flow of the SCTM algorithm.
Energies 16 01817 g006
Figure 7. Bar chart of the estimated PD locations in the clustering process.
Energies 16 01817 g007
Figure 8. (a) PD signals added with 4 dB SNR. (b) PD signals added with −10 dB SNR. (c) PD signals added with −18 dB SNR.
Energies 16 01817 g008
Figure 9. (a) De-noised PD signals with 4 dB SNR. (b) De-noised PD signals with −10 dB SNR. (c) De-noised PD signals with −18 dB SNR.
Energies 16 01817 g009
Figure 10. Maximum PD estimation error versus SNR for the MPD algorithm.
Energies 16 01817 g010
Figure 11. Maximum PD estimation error versus SNR for the SC algorithm.
Energies 16 01817 g011
Figure 12. Maximum PD estimation error versus SNR for the SCTM algorithm.
Energies 16 01817 g012
Figure 13. Average PD estimation error versus SNR for the MPD algorithm.
Energies 16 01817 g013
Figure 14. Average PD estimation error versus SNR for the SC algorithm.
Energies 16 01817 g014
Figure 15. Average PD estimation error versus SNR for the SCTM algorithm.
Energies 16 01817 g015
Table 1. PD detection and localization techniques.
Localization TechniquesDescriptions
Electrical [7,8,9]
  • The high-frequency content is used to estimate the presence of PD.
  • Allows for calculating the apparent charge measured in picocoulomb (pC) associated with PD.
  • Susceptible to low PD activity.
  • Allows precise calibration.
  • Must have a sufficiently high signal-to-noise ratio (SNR).
Chemical [10]
  • Composition of dissolved gases is examined to detect PD.
Acoustic [9,11,12,13,14,15]
  • Installed online acoustic monitoring systems to provide a remote location with an early warning of an impending fault.
  • Abnormal gas-in-oil test results or sounds indicate PD.
  • Detection of sound waves emitted by PD sources.
  • A non-invasive technique with lower sensitivity to weak PDs.
  • Might be contaminated by the external acoustic environmental noise.
  • Electromagnetic interference in the measurement environment has no effect.
  • Based on the time difference of arrival (TDoA) of signals.
  • Highly sensitive to noise.
  • Need at least four time-synchronized sensors to operate.
  • Provide reasonable accuracy through proper signal processing and appropriate propagation paths from the PD sources to the multiple sensors.
Electromagnetic [14,16,17,18,19,20,21,22]
  • Valve to measure the electromagnetic emission from a PD source.
  • The tank’s metal surface filters out external electrical interferences.
  • Detect electromagnetic waves emitted by PD sources.
  • Ultra-High Frequency (UHF) radiation (UHF-PD) is susceptible to weak PDs.
  • Based on the time difference of arrival (TDoA) of signals.
  • Highly sensitive to noise.
  • Need at least four time-synchronized sensors to operate.
  • Suffer from inaccuracies because of inhomogeneities and scattering.
Ultrasonic [23,24]
  • It is a reliable method of locating corona discharges at locations with a high signal-to-noise ratio and resolution.
  • Can quickly and accurately determine the elevation angle and azimuth angle of a corona source occurring outside of electrical equipment.
  • Detect the sound waves produced by the discharge with sensor arrays of various shapes, such as circular and cross-shaped arrays and measure the time difference between subsequent channels to determine the approximate location of the source.
Ultraviolet [25,26,27,28,29,30,31,32]
  • The UV imaging method has high sensitivity, non-contact, anti-interference capability and high positioning accuracy, but it is costly and difficult to operate.
  • UV Pulse Detection is light and inexpensive; however, the detection system must be extremely sensitive in order to respond to weak UV signals.
Table 2. Segmented correlation process.
Reference signal
( B n )
Energies 16 01817 i001Energies 16 01817 i002Energies 16 01817 i003
Shifting signal
( A n + m )
Energies 16 01817 i004Energies 16 01817 i005Energies 16 01817 i006
Multiplication of signals
( B n · A n + m )
Energies 16 01817 i007Energies 16 01817 i008Energies 16 01817 i009
Summation
( B n · A n + m )
1.36367 × 10 5 1.7088 × 10 3 1.3637 × 10 5
Correlation profileEnergies 16 01817 i010
Table 3. The 200 estimated PD locations for the trimming process.
128.34911298.8741299.6541300.4351301.215
130.69011298.8741299.6541300.4351301.215
1259.8571298.8741299.6541300.4351301.215
1264.5391298.8741299.6541300.4351301.995
1294.9721298.8741299.6541300.4351301.995
1295.7531298.8741299.6541300.4351301.995
1296.5331298.8741299.6541300.4351301.995
1296.5331298.8741299.6541300.4351301.995
1297.3131298.8741299.6541300.4351301.995
1297.3131298.8741299.6541300.4351301.995
1297.3131298.8741299.6541300.4351301.995
1297.3131298.8741299.6541300.4351301.995
1297.3131298.8741299.6541300.4351301.995
1297.3131298.8741299.6541300.4351301.995
1297.3131298.8741299.6541300.4351301.995
1297.3131298.8741299.6541300.4351302.776
1297.3131298.8741299.6541300.4351302.776
1298.0941298.8741299.6541300.4351302.776
1298.0941298.8741299.6541300.4351302.776
1298.0941299.6541299.6541300.4351302.776
1298.0941299.6541299.6541300.4351303.556
1298.0941299.6541299.6541300.4351303.556
1298.0941299.6541299.6541300.4351304.337
1298.0941299.6541299.6541300.4351304.337
1298.0941299.6541299.6541300.4351305.117
1298.0941299.6541299.6541300.4351335.551
1298.0941299.6541299.6541301.2151336.331
1298.0941299.6541299.6541301.2151866.969
1298.0941299.6541299.6541301.2151866.969
1298.0941299.6541300.4351301.2151868.53
1298.8741299.6541300.4351301.2151873.212
1298.8741299.6541300.4351301.2151879.454
1298.8741299.6541300.4351301.2152467.838
1298.8741299.6541300.4351301.2152470.179
1298.8741299.6541300.4351301.2152472.52
1298.8741299.6541300.4351301.2152472.52
1298.8741299.6541300.4351301.2152473.301
1298.8741299.6541300.4351301.2152475.642
1298.8741299.6541300.4351301.2152476.422
1298.8741299.6541300.4351301.2152502.174
Table 4. Maximum PD estimation error.
SNR (dB)MPDSCSCTM
40.10680.01020.0102
21.64900.01020.0102
01.66750.02880.0102
−21.68800.02880.0102
−41.68800.04920.0102
−61.70660.04920.0102
−81.74560.06780.0102
−101.76600.08830.0102
−121.80500.12730.0102
−141.84400.12730.0288
−1658.711158.51600.0288
−1859.902158.69250.0492
Table 5. Average PD estimation error.
SNR (dB)MPDSCSCTM
40.02540.01020.0102
20.03670.01020.0102
00.04150.01130.0102
−20.17570.01270.0102
−40.27840.01340.0102
−60.33010.01670.0102
−80.46550.02040.0102
−100.58440.02150.0102
−120.59960.02570.0102
−140.76450.03910.0104
−161.32360.63430.0117
−183.14094.17560.0182
Disclaimer/Publisher’s Note: The statements, opinions and data contained in all publications are solely those of the individual author(s) and contributor(s) and not of MDPI and/or the editor(s). MDPI and/or the editor(s) disclaim responsibility for any injury to people or property resulting from any ideas, methods, instructions or products referred to in the content.