1. Introduction
In order to reduce the effects of global climate change, the increase in the average global temperature must be limited to 1.5 °C compared with the pre-industrial level. As part of the United Nations Framework Convention on Climate Change, member states have committed to meet national and international climate protection targets (Federal Climate Protection Act). For example, Germany must reduce greenhouse gas (GHG) emissions (referring to CO
2 equivalents, CO
2eq, including carbon dioxide, nitrous oxide, and methane emissions with various global warming potentials) by 88% by 2040 compared with 1990 levels [
1]. In detail, the major proportion of CO
2 emissions arises from fossil fuel combustion processes [
2], providing energy for mobility and transport, or thermal and electrical energy. Similar information can be applied currently to many other states, and the importance of GHG mitigation extends to all states considering global climate change.
Agricultural animal husbandry contributes directly and indirectly to climate change with significant GHG and ammonia (NH
3) emissions [
3]. Emission mitigation measurements are, therefore, increasingly the subject of research and development; using proven mitigation technologies is becoming more important or even mandatory for (German and Dutch) farmers [
4,
5,
6]. GHG emissions are an essential indicator for deriving the carbon footprint of animal husbandry and the corresponding provision of animal-based food. Sustainability is composed of environmental (e.g., climate change impact of GHG emissions), economic (e.g., rentability of animal husbandry), and social aspects (e.g., air quality for animals and workers within the barn building). The sustainability of animal-based food production plays an increasing role, considering the growing global population and the availability of plant-based food or meat substitutes.
Pig farms have a high demand for electrical energy, e.g., to operate the ventilation and feeding systems [
7,
8,
9,
10,
11,
12]. An exhaust air purification system—used for mitigating ammonia, particulate matter, and odor emissions—increases this energy demand. It is therefore associated with acquisition costs and increased operating costs for the farmer [
13,
14,
15]. The demand for exhaust air purification systems is increasing in Germany [
4] and other central European states (e.g., The Netherlands and Denmark) or regions with high livestock intensities [
5,
6]. The provision of the electrical energy used is often associated with further climate-relevant emissions; for example, the German electricity mix was responsible for 0.427 kg CO
2eq kWh
el−1 in 2020 [
16]. However, the GHG emission intensity of electricity generation varies widely in the various countries, depending on the sources of electricity provision [
17]. Consequently, the operation of air purification systems involves a trade-off between reduced emissions of environmentally relevant substances (e.g., NH
3 and particulate matter) and increased climate-relevant emissions (e.g., CO
2). In the long term, using regenerative sources for electricity or low-emission on-site energy sources can make sense.
In addition to electrical energy, piglet rearing barns have a high demand for thermal energy to meet the piglets’ temperature requirements [
18,
19]. However, some parameters of exhaust air purification depend on the exhaust air temperature, e.g., the biological ammonia separation efficiency decreases with increasing exhaust air temperatures [
20,
21]. Reducing exhaust air temperature using heat recovery (HR) before air purification could positively affect the purification parameters. However, this topic can be considered an open question and needs research.
Continuous air exchange is essential for maintaining an appropriate animal housing climate, which is vital for animal welfare and development. Especially in winter, it is often difficult to keep the barn climate stable: cold outside air only allows a reduced air supply into the barn without exposing the animals to draughts and temperature stress, and control settings of the heating system can lead to air temperature fluctuations [
22]. At the same time, reduced ventilation increases harmful gas concentrations like ammonia in the barn. The incoming and barn air heating is associated with additional thermal energy demand, e.g., by combusting fossil fuels. This combustion is associated with increased operating costs and additional CO
2 emissions [e.g., 0.237 kg CO
2 kWh
th−1 combusting liquefied natural Gas (LNG)] primarily in the winter period [
23].
Heat recovery systems transfer thermal energy from a warmer to a colder medium. The recovered thermal energy can therefore be reused [
24]. In animal barns, 70–90% of thermal energy losses are caused by the warm exhaust air leaving the barn [
25,
26]. A heat exchanger can transfer parts of this energy to the cold fresh air. The preheated supply air helps to achieve a more stable barn climate and reduce fossil fuel combustion, especially in the cold months. At the same time, heat recovery can lead to savings in fuel costs and CO
2 emissions [
27,
28].
There are several technical principles of heat recovery systems, such as air-to-air heat exchangers [
22,
29,
30], water-to-air-based systems [
31,
32,
33,
34], or heat pumps [
31,
35,
36,
37] in the field of mechanically ventilated barn building construction. In addition, geothermal energy (e.g., underfloor air circulation [
38,
39,
40]) and solar thermal energy [
40,
41,
42] can play an essential role in barn air conditioning. However, these technologies are neither new in the field of heating, ventilation, and air conditioning (HVAC) or in industrial processes [
43,
44,
45] nor in (German) agricultural animal husbandry; some scientific studies date back several decades [
46,
47,
48]. Furthermore, demand in agriculture has not been constant in recent decades and has been partly dependent on the development of energy prices [
29].
Bokkers et al. (2010) [
27] published a study describing the effects of heat exchangers in practical use in broiler husbandry and farmers’ experiences before and after their installation. This survey complements scientific studies on the performance parameters of heat exchangers, e.g., [
22,
28,
30,
33], and practical guides on how to use heat exchangers in practice, e.g., [
49]. Besides, heat recovery can be used to mitigate ammonia concentrations and emissions in hen housing using manure belt drying [
30]. Although, some of these studies have short investigation periods (e.g., one month [
22,
30]) or inaccuracies in the calculation methods (e.g., unclear additional electricity needed to operate the heat exchangers [
28,
29]). Moreover, the advancing climate change, fossil fuel shortages, partly increasing energy costs, and the social focus on more sustainability and environmental responsibility has led to a change in mentality. Heat recovery can improve the sustainability of processes and should also be increasingly focused on animal husbandry in mechanically ventilated barns. Furthermore, it should be recognized and used in practice as the best available technique depending on production systems and climate regions [
6].
Therefore, the object of this study was to investigate the energy consumption and efficiency of a piglet rearing barn using an air-to-air heat exchanger and an exhaust air purification system in a long-term case study. For this purpose, the thermal energy recovered was quantified, and various performance parameters of the heat exchangers were determined. At the same time, the amount of CO2 emission mitigation and energy cost savings were quantified for two cases: the barn with heat exchangers (reality) and the barn without heat exchangers (hypothetical, calculated case). The study aimed to demonstrate the potential of using a heat recovery system to make pig farming more sustainable.
In detail, the results are farm-specific as a single case study, so generalizability to global animal husbandry is only possible with caution and limitations. However, the presentation of the findings is intended to ensure a high grade of transferability. Furthermore, due to the long-term measurements of two years, the results offer detailed insights concerning the influence of different operating situations. By presenting ecological and economic savings potentials, the farmers’ and stakeholders’ interest in investing in energy-efficient, resource-saving, and emission-mitigating technologies is to be increased. We hypothesize that those technologies and their combination in an efficient way can contribute to more sustainable agriculture in the future.
2. Materials and Methods
2.1. Barn Building, Ventilation System, and Technical Equipment
The study was conducted under practical conditions in a piglet rearing barn in Germany (Lower Saxony), which had outside dimensions of 6.923 × 4.324 × 292.5 cm [811.4 cm height including the roof, Length × Width × Height (L × W × H); for abbreviations, please see the Nomenclature in the
Supplementary Material, Section S1]. Data recording took place over two years, from December 2019 to December 2021 (730 days total). The barn building of the farm included 4140 animal places (AP) in piglet rearing, 128 AP for gilt rearing, and 110 AP in the breeding center. Since the animals were of different weights, the total mass of the animals in the barn could be calculated using livestock units (LU, 1 LU = 500 kg animal life weight). The nominal livestock unit (based on AP per animal compartments) was 124.2 LU for piglet rearing, 15.4 LU for gilt rearing, and 33.0 LU for the breeding center. However, the barn building was not fully occupied during the trial period. The following mean values were considered for year 1 (17 December 2019–15 December 2020) 98.4 LU in piglet rearing, 12.1 LU in gilt rearing, and 31.8 LU in the breeding center; and for year 2 (16 December 2020–15 December 2021) 101.0 LU in piglet rearing, 11.3 LU in gilt rearing and 32.2 LU in the breeding center.
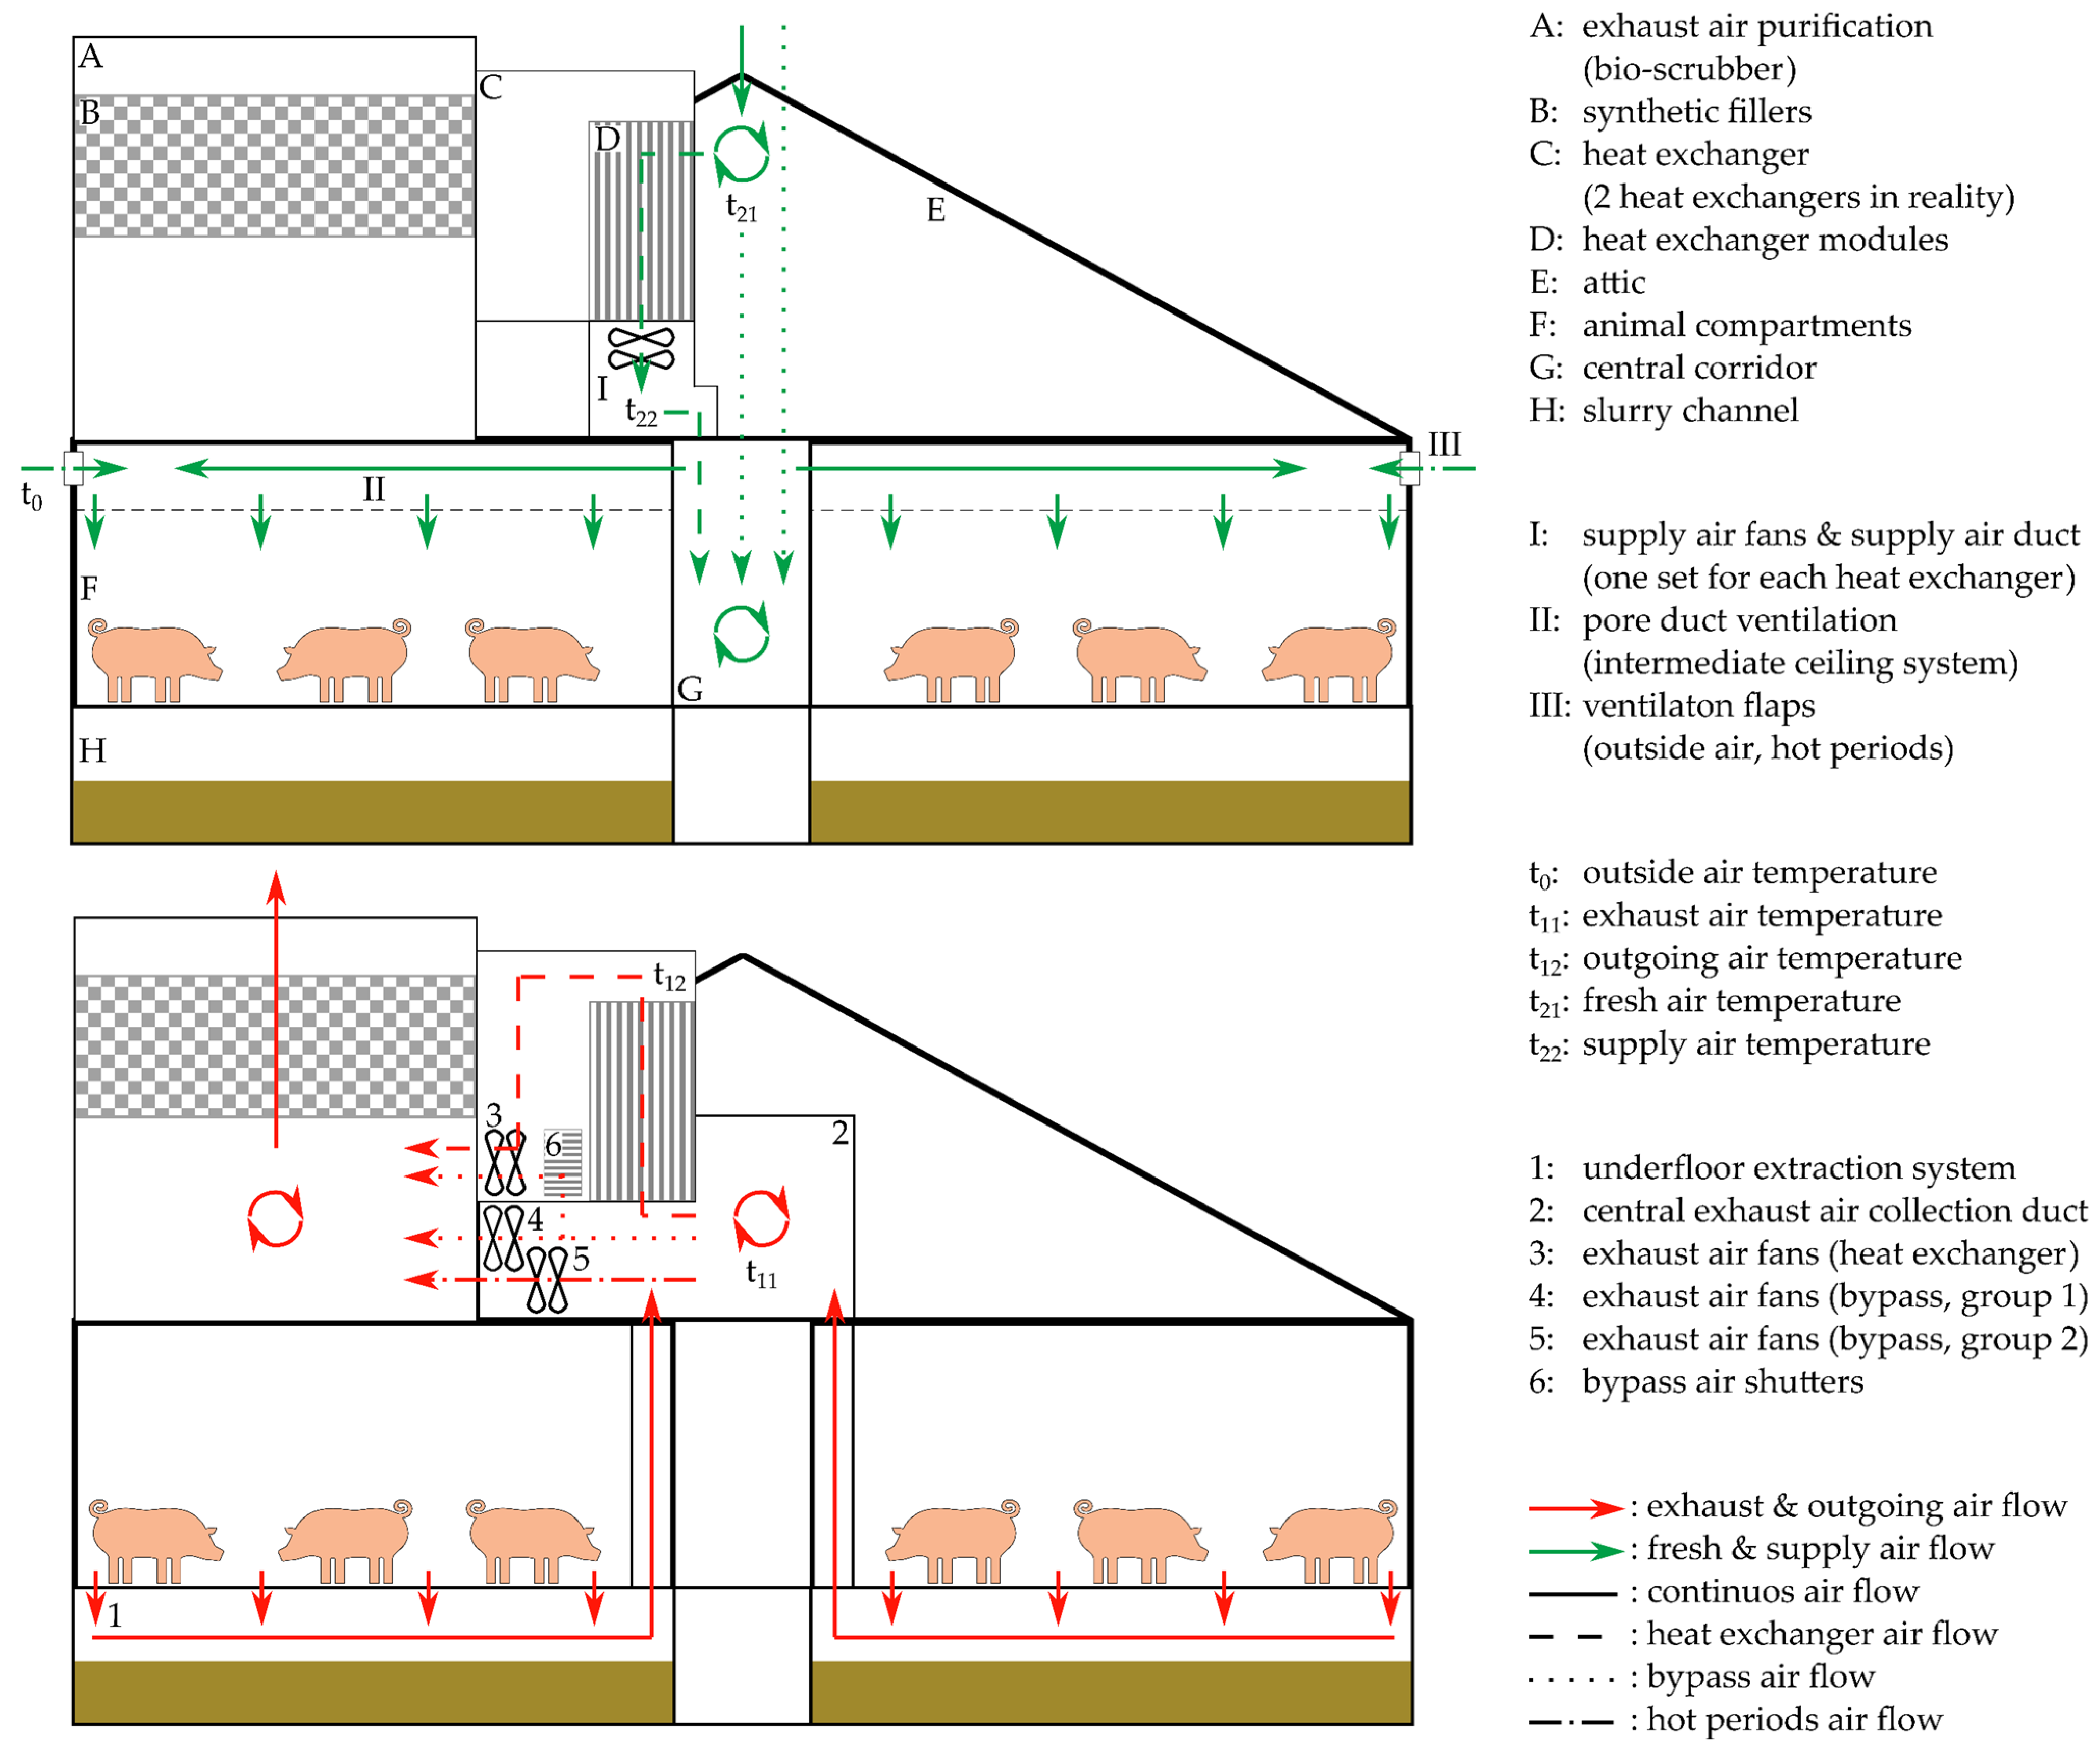
The barn was mechanically ventilated with a central underfloor extraction system (
Figure 1), leading to a central exhaust air collection duct. Furthermore, the barn was equipped with six exhaust fans with a diameter of 990 mm each (A3G990-AZ02-35, ebm-papst Mulfingen GmbH & Co. KG, Mulfingen, Germany). From the central exhaust air collection duct, air could be supplied to two air-to-air heat exchangers using two of the six exhaust fans. These two fans were operated continuously and identically throughout the year. At higher ventilation rates, the excess exhaust air could bypass the heat exchangers in two ways: (1) the exhaust air was conveyed by the two fans mentioned above, but the air did not flow through the heat exchanger heat transfer plates using bypass air shutters inside the heat exchanger shell, or (2) the four other exhaust fans conveyed the exhaust air in a regular manner. The air was then supplied to a following exhaust air purification system before leaving the barn.
The supply air system consisted of a pore duct ventilation with an intermediate ceiling system. Fresh air could be led in different ways to the central corridor from where a mixed supply air was guided to the barn compartments and then through the pore duct to the animals. In winter, the fresh air from the attic was passed through the two heat exchangers before being guided into the supply air duct and the central corridor. During warmer temperatures, the fresh air from the attic bypassed the heat exchangers directly to the central corridor, or outside air could enter the central corridor via air shutters. In addition, during hot periods, outside air could enter the barn compartments’ pore ducts directly through additional air shutters below the eaves. If the fresh air was conveyed through the heat exchangers, this was done by additional fans (one fan per heat exchanger, and these two fans were operated identically and in parallel throughout the year; Model FC080-6DQ.6K.A7_XBS, Ziehl-Abegg SE, Künzelsau, Germany).
The ventilation system was controlled automatically by a digital controller depending on the temperatures of outside air, supply air, room air in the animal compartments, the number of animals housed, and the minimum air flow rates for each animal compartment. The control system also regulated the management of flow paths (e.g., whether the exhaust air bypassed the heat exchangers or outside air was directed into the central corridor) and the air flow rates conveyed along the different paths. The control settings were developed by the ventilation system manufacturer (hdt Anlagenbau GmbH, Diepholz, Germany) to meet legal requirements and ensure good air quality in the animal compartments. The controller of the ventilation system recorded all operating parameters at intervals of about 30 s; adjustments to the system control were made at irregular intervals of a few minutes.
The heat exchangers were two recuperative air-to-air heat exchangers (Product type WT-BTK 200) from the manufacturer hdt Anlagenbau GmbH with a size of 332 × 114.6 × 442 cm (L × W × H) each. Each heat exchanger had an exchange surface of 266.64 m
2 made out of high heat acrylonitrile butadiene styrene (ABS-HH) exchange plates (thickness 0.5 mm). Each plate had a nominal thermal transmittance (U-value) of ≈ 5.79 W (K m
2)
−1 (thermal conductivity of ABS-HH 0.180–0.250 W (K m)
−1; for more details, see
Table S1). Recuperative systems are characterized by continuous thermal flow according to the physical heat transfer process without storage processes [
24]. Inside the exchangers, fresh and exhaust air were passed by each other in opposite directions (counter-flow) in a vortex flow process so the thermal energy could be transferred from the warm exhaust air to the cooler fresh air. However, thermoformed plastic plates separated the two air flows to prevent pollution and ensure the hygienic quality of the fresh air. The transfer area was increased through the helical surfaces of the plastic heat transfer plates used in the exchangers, and the turbulent air flow improved heat transfer. Each heat exchanger was designed for a maximum air volume flow rate of approximately 16,800 m³ h
−1; the sum of both heat exchangers corresponded to about one-sixth of the maximum air volume flow rate for ventilating the barn building in warm summer periods. As described above, both heat exchangers were continuously operated identically, i.e., the same exhaust and supply air volume flow rates were conveyed through both heat exchangers at all times (see
Section 2.3).
The barn was equipped with LNG radiant heaters for heating the compartments. In each piglet pen (approximately 300 × 500 cm), a part of the pen (approximately 150 × 200 cm) were heated during the first 7 to 14 days of the rearing period (timed control). After this period, the radiant heaters were cleaned, disinfected, and used in the next compartment.
The exhaust air purification system installed in the barn was a bio-scrubber from the manufacturer Devrie Technical Solutions B.V. (Vriezenveen, The Netherlands), certified by the German Agricultural Society [
50]. By sprinkling the synthetic fillers with slightly acidic or alkaline scrubbing water (target pH 6.5–6.8), a habitat was provided for microorganisms that decomposed the ammonia and odor molecules contained in the exhaust air, thus purifying the air. In addition, fine dust and bioaerosols were filtered out of the air. The separation efficiency for the exhaust air purification system used in the barn was at least 70% for ammonia and dust, following the specifications of [
4], and achieved a prescribed maximum odor concentration of 300 odor units per cubic meter of exhaust air during certification.
2.2. Measurement of Air Temperature
Temperature and relative humidity (the latter was not further considered in this study) were measured continuously for the two-year trial period in measurement intervals of 15 min. The following measurement points apply continuously throughout the two-year trial period (
Figure 1): outside air (t
0, below the eaves of the shady north side of the barn), and inside the barn, the exhaust air (t
11), outgoing air (t
12), fresh air (t
21), and supply air (t
22). The terminology of the air masses partly contradicts the nomenclature of typical HVAC applications but adopts terms used in agricultural practice and former reports [
33]. In detail, the air entering the heat exchanger on the exhaust side corresponds to extract air in HVAC terminology (in this study, exhaust air, since it is the air that is exhausted from the animal compartments), and the air leaving the heat exchanger corresponds to exhaust air in HVAC terminology (in this study, outgoing air, since it is the air that is discharged to the purification system). Fresh, supply, and outgoing air parameters were measured for one heat exchanger; the same values were assumed for the second since both heat exchangers were used in parallel throughout the trial. Data were recorded using three different types of data loggers (Testo 174 T, Testo SE & Co. KGaA, Titisee-Neustadt, Germany, and Tinytag Plus 2 TGP-4500 and TGP-4505, Gemini Data Loggers Ltd., Chichester, United Kingdom) and additionally by implemented sensors of the manufacturer of the heat exchangers (WTR 190-A1-1A2/PT1000, promesstec GmbH, Schüttorf, Germany) at each measuring point. For each point, the mean values of all sensors were used for the subsequent calculations. All sensors were checked before and during the measurement period (eight times during the two-year trials). For more details (e.g., sensor type, measuring range, accuracy) see
Table S2.
The temperature variation (difference between the daily minimum and maximum temperature, ∆t = t
max − t
min) is an important parameter to calculate the rate of amplitude damping of buildings or HVAC systems [
51,
52]. In the context of the conducted study, amplitude damping refers to the ability of the heat exchangers to reduce the supply air temperature variation ∆t
22 compared with outside air temperature variation ∆t
0:
where:
= amplitude damping due to fresh air conditioning via heat recovery of the heat exchanger in %;
= daily temperature variation of the supply air in K;
= daily temperature variation of the outside air in K;
= daily maximum supply air temperature in °C;
= daily minimum supply air temperature in °C;
= daily maximum outside air temperature in °C;
= daily minimum outside air temperature in °C.
2.3. Calculation of the Air Flow Rates
The thermal power of the heat exchangers was calculated based on the air mass flow rate of the fresh air conveyed through the heat exchanger heat transfer plates (see
Section 2.4). However, in these trials, measuring the air volume flow rate directly (e.g., using measuring fans) was impossible due to the constructional and technical implementation of the heat exchangers into the barn building (see
Section 3.6).
Instead, all fans’ air volume flow rates were calculated based on the fan speed and the differential pressures (upstream and downstream of the fans). The derivation of the two variables was also carried out for each 15-min measurement interval. The
supplementary material file gives a detailed explanation of this procedure (see
Section S3, Figures S1 and S2).
Briefly, the fan speeds were calculated using the fans’ analog control [V] after the corresponding correlations had been derived in preliminary tests. For this, the speeds were recorded using an optical tachometer (model K06538, Voltcraft, Hirschau, Germany) and reflective markers (supply air fans from Ziehl-Abegg SE, Künzelsau, Germany) or using the BUS connection and software supplied by the manufacturer (exhaust air fans from ebm-papst Mulfingen GmbH & Co. KG, Mulfingen, Germany). Differential pressures within the ventilation system were measured using digital differential pressure transmitters [twice the model DE2752M042CK00MWU3231 (measuring range 0–100 Pa) and twice the model DE2752M042CK00MWU3233 (measuring ranges 0–200 Pa and 0–300 Pa), FISCHER Mess- und Regeltechnik GmbH, Bad Salzuflen, Germany] at several places: the central exhaust air collection duct, one heat exchanger (the heat exchanger with the temperature sensors), pressure chamber beneath the synthetic fillers of the bio-scrubber, and in the supply air duct right in front of and behind the supply air fans.
The fans were arranged in several operating groups, controlled separately by the digital controller of the ventilation system (see
Section 2.1). The supply air fans convey air through the heat exchanger as long as thermal energy is needed to raise the room air temperatures in the animal compartments. If the supply air fans have the highest electrical power input, i.e., the maximum fan speed, and the exhaust bypass air shutters are closed, this is called full workload of the heat exchanger (in the corresponding measuring interval). If the thermal energy demand decreases, the supply air flow rate is reduced, and the exhaust bypass air shutters open (=partial workload operation) until the heat exchanger stops providing thermal energy (heat exchanger off). The supply air fans were operated at t
21 ≤ 30.5 °C, however 99.0% of the heat exchanger operation intervals were observed for t
21 ≤ 23.0 °C [minimum of 6597 (m³ supply air) h
−1 total capacity for t
21 = 23.2 °C, maximum 30,864 (m³ supply air) h
−1 for t
21 = 16.4 °C].
For the user, the information concerning the ventilation system’s performance is given as a percentage of the performance of the entire ventilation system [%] (=air flow rate of the exhaust air fans). The extreme values of the system control were 19.8% at t21 = −1.9 °C [16,354 (m³ exhaust air) h−1 total capacity] as well as 96.5% at t0 = 30.8 °C [223,889 (m³ exhaust air) h−1 total capacity]. The exhaust bypass air shutters of the heat exchangers were opened for varying fresh air temperatures depending on the room air temperatures (operating range t21 ≤ 12.2 °C). The four remaining exhaust fans for bypass operation were controlled uniformly until 8 April 2020 (operating range t0 ≥ 11.7 °C), after which they were divided into two groups to provide more precise control of the barn ventilation (group A: operating range t0 ≥ −8.4 °C, group B: operating range t0 ≥ 12.9 °C).
2.4. Calculation of the Thermal Power and the Effectiveness
The thermal power
of the heat exchanger (the one with the temperature and differential pressure sensors) was calculated using the following equation for each 15-min measurement interval [
53]:
where:
= thermal power of the heat recovery system in kW;
= supply air mass flow rate in kg h
−1, calculated based on the air volume flow rate and the corresponding air density at varying air temperatures (
; where
= air volume flow rate of the supply air fan in m
3 h
−1 [
38,
54]);
= specific heat capacity of dry air in Whth (kg K)−1 ( = 1.005 kJth (kg K)−1 = 0.28 Whth (kg K)−1);
t21 = fresh air temperature in °C;
t22 = supply air temperature in °C.
The calculated thermal power was adopted for the second heat exchanger since both were operated identically (assuming identical temperatures and air flow rates). In the further course of the article, reference is always made to the summed thermal power of both heat exchangers. The amount of thermal energy recovered [kWh
th] in a given period corresponds to
. Due to the calculation of the air volume flow rates (
Section 2.3) and the possible inaccuracy (see
Section 3.6), an uncertainty analysis was carried out concerning the calculation of the thermal power (see
Section S4 and Figure S3 [
34,
55,
56,
57,
58]). This possible uncertainty consequently also influenced other performance parameters (e.g., COP
heating and PF
heating, see
Section 2.5 and
Section 2.7).
Another critical performance parameter of heat exchangers is the dimensionless effectiveness of sensible heat transfer. This parameter describes the ratio of the actual thermal power and the maximum possible thermal power of the heat recovery system for each measurement interval. The latter is determined by (a) the temperature difference between the exhaust and fresh air, which is usually the largest temperature difference of the air masses, and (b) the minimum supply or exhaust air mass flow rate and the specific heat capacity, which determines how much air emits or absorbs thermal energy. The product of (a) and (b) limits the amount of thermal energy transferable from the warmer to the colder air flow for each measurement interval. The effectiveness calculation can differ in the various studies in this field of research (see
Section 3.2). However, in this study, it was calculated as follows [
46,
47,
59]:
where:
= effectiveness of the sensible heat recovery system (heat exchangers);
= maximum possible thermal power of the heat recovery system in kW;
= the minimum of exhaust air or supply air mass flow rate for each measurement interval in kg h−1;
t11 = exhaust air temperature in °C.
2.5. Calculation of Energy Input, Coefficient of Performance, and Performance Factor
Electricity consumption of the investigated barn was recorded by individual electronic electricity meters (model DSZ15D-3x80A, Eltako GmbH, Fellbach, Germany) for each electric consumer, e.g., ventilation system, air purification system, feeding system, air compressor, and social rooms, over the whole period. The consumption of LNG was recorded using the ordered quantities and the gas tank level.
Moreover, the fans’ electricity and the barn building’s LNG consumption were calculated for the 15-min measurement intervals. For this purpose, the electrical power consumption [W] of the fans was also measured in the preliminary tests (see
Section 2.3,
Sections S3 and S4, especially
Figure S1) depending on their analog control [V]. Thus, based on the control software’s values, the eight fans’ power consumption could be calculated for each interval. The documented gas consumption was related to the recorded outside air temperatures, and the corresponding correlation was used to calculate the daily consumption [(kg LNG) d
−1] of the barn building, which was transferred to the measurement intervals (see
Section S5, Figure S4). These values were subsequently compared with the data from the actual electricity meters and purchased LNG quantities and showed only minor differences (+2.3% for LNG consumption, −2.1% for electrical energy consumption).
The coefficient of performance (COP
heating) represents the ratio of the thermal power [kW
th] (see
Section 2.4) transferred by a heat recovery system to the required electrical power [kW
el] to operate a heat recovery system. It is an indicator of the energy efficiency of heat recovery units and was calculated using the following general equation for each 15-min interval [
53,
60]:
where:
This parameter is essential for evaluating heat recovery systems and is mainly used for heat pumps or cooling units. Several former articles in the context of heat recovery in animal barns used COP for heat recovery systems, including recuperative systems, e.g., [
33,
34,
35,
36]; thus, we adopt the term. An index has been added to COP
heating to clarify that energy efficiency is considered and calculated only during heating periods.
The concept of COP
heating for heat exchangers is debatable: heat exchangers recover thermal energy via passive heat transfer. The heat exchangers used in this study did not absorb electrical energy; consequently, quotient formation as in COP
heating was, strictly speaking, not possible. However, they were part of the barn building and its ventilation system, and their presence and use resulted in increased electrical power consumption of the ventilation fans due to the rising air flow resistance (see
Section 2.7). Consequently, the ventilation system had an increased electrical energy consumption in order to be able to recover thermal energy. This input is compared with the recovered thermal energy. This ratio enables comparisons between heat exchangers and other heat recovery systems, such as heat pumps.
Moreover, the COPheating was calculated by the thermal and electrical power [kW], which means that it was calculated for one operating moment, i.e., for each measurement interval. In the further article, when talking about the quotient of thermal energy recovered [kWhth] and electrical energy consumption over a certain period [kWhel], the term Performance factor (PFheating) is used.
Since these are practice measurements in a barn building with several energy consumers within the air ventilation and treatment systems, different PFheating values (or corresponding COPsheating for each measurement interval) were calculated. These were the PFV,heating that related to the electrical power of the fans (ventilation system, V, ) and the PFVA,heating that related to the electrical power of the fans (ventilation system, V, ) and the exhaust air purification system (A, ; summed to, ) with the uniform thermal energy recovery of the heat exchangers (). For the single measurement intervals, COPV,heating and COPVA,heating were calculated.
2.6. Calculation of Substituted CO2 Emissions and Heating Costs
Based on the energy consumption and the recovered thermal energy, the resulting CO2 emissions, costs, and the corresponding reductions using heat recovery were calculated for the barn building and the various consumers.
2.6.1. Calculation of Substituted CO2 Emissions
To determine the CO
2 emissions, the factors
= 0.427 kg CO
2 kWh
el−1 for electrical energy (electricity supplied in the German power grid, [
16]) and
= 0.237 kg CO
2 kWh
th−1 for thermal energy (combustion of LNG) were assumed [
61,
62,
63]. Within this article, a simplified calculation of CO
2 emissions was made, with the barn building serving as the system boundary. This means that the emission factor of the thermal energy m
CO2,th only considered the CO
2 emissions caused by the actual combustion, and CO
2eq emissions in the course of LNG extraction, transport, and supply were not considered. For electrical energy, the emission factor m
CO2,el was simplified as pure CO
2 emissions, even though other GHG emissions may have occurred during electricity generation.
For example, the following equation is applied for the CO
2 emissions resulting from the operation of the exhaust air purification system (similar calculations apply for the other consumers):
where:
= CO2 emissions based on the electrical energy consumption of the exhaust air purification system (A) for a given period in kg CO2;
= Electrical energy consumption of the exhaust air purification system (A) for a given period in kWhel;
= CO2 emission factor for electric energy [electricity supplied in the German power grid in (kg CO2) kWhel−1].
2.6.2. Initial Capital Cost and Fixed Costs
The initial capital cost used to calculate the payback period was based on the barn-specific costs supplied by the farmer and the offer sheets of the manufacturers. The initial capital cost included the costs for the technology and material itself, assembly, and German taxes (value-added tax 19%).
Subsequently, initial capital costs were used to calculate the annual fixed costs. For this, a depreciation of 15 years was assumed. The interest rate (0.5%) and insurance costs (EUR 300 a
−1 for Case 1, and EUR 100 a
−1 for Case 2, see
Section 2.7) were added.
2.6.3. Energy Costs
For the calculation of the saved energy costs, the monthly prices for electrical energy
(mean EUR 0.2697 ± 0.0030 kWh
el−1) during the trial period were used [
64,
65]. The thermal energy costs
(in this trial, LNG costs; mean EUR 0.0658 ± 0.0169 kWh
th−1) were calculated on a monthly base via weekly online price comparisons for the German energy market.
For example, the following equation is applied for the energy costs resulting from the operation of the ventilation system (similar calculations apply for the other consumers):
where:
= energy costs based on the electrical energy consumption of the ventilation system (V) for a given period in EUR;
= electrical energy consumption of the ventilation system (V) for a given period in kWhel;
= energy costs for electrical energy (e.g., electricity of the German power grid) in EUR kWhel−1.
2.6.4. Operating and Maintenance Costs and Annual Variable Costs
The operating and maintenance costs include water and labor costs for cleaning and maintenance (EUR 1200 a
−1 for Case 1, and EUR 1150 a
−1 for Case 2, see
Section 2.7) and the repair costs (2% of the initial capital cost). These costs were added to the energy costs to calculate the annual variable costs.
2.6.5. Payback Period
The payback period is required for economic savings, primarily due to fuel cost savings using heat recovery to equal the initial capital cost. To calculate this, the initial capital costs were divided by the annual cost savings (difference between total annual costs of Case 2 and Case 1, see
Section 2.7). This was done for the initial capital cost of the heat recovery system in Case 1 and the total initial capital cost difference between Case 2 and Case 1.
2.7. Comparison between the Actual Barn Situation (with Heat Recovery) and the Hypothetical Situation (without Heat Recovery)
The procedure described above was used to determine the energy efficiency of the actual barn using a heat recovery system. As described above, a heat exchanger does not consume electrical energy itself; however, the use of heat exchangers causes higher electrical energy consumption of the fans due to higher flow resistance of the conveyed air flow [
27,
28]. Therefore, this additional electrical energy input can be opposed to the recovered thermal energy.
In order to be able to evaluate the energy efficiency of the heat recovery system, the energy consumption of the actual barn situation with a heat recovery system (Case 1) was compared with a hypothetical case without a heat recovery system (Case 2, see
Section S6 for more information). Case 2 should be an exact copy of Case 1, i.e., the same air flow rates, temperatures, and thermal energy input were assumed. For this hypothetical case (without a heat recovery system), the energy consumptions for each 15-min measurement interval were calculated. For both cases, the overall animal husbandry and management should be consistent, including the thermal energy input to ensure consistent room air temperatures in the animal compartments (inspired by [
30]). Therefore, the recovered thermal energy in Case 1 was substituted by LNG combustion in hypothetical Case 2. Consequently, the demand for LNG increased in Case 2.
The demand for electrical energy for Case 2 was calculated as follows:
The energy consumption of the supply air fans (see
Section 2.1) was not considered further since supply air fans are commonly unnecessary in ventilation systems without heat exchangers.
For the two exhaust air fans behind the heat exchangers, the calculation was done in several steps:
It was assumed that the same fans in each case convey the identical air volume flow rates.
Since the heat exchangers are associated with additional pressure losses, the corresponding differential pressure was used, which would prevail if no heat exchangers were installed (see
Figure S5). This is the differential pressure between the central exhaust air collection duct (including adjustment of the pressure conditions in this duct if the supply air fans were switched off and did not “force” any air into the barn) and the measuring point behind the fans (before the exhaust air purification). These values were recorded using digital differential pressure transmitters (see
Section 2.3).
The correlation equations (see
Section 2.3 and
Figure S2) were used to calculate the fan speed required at the assumed differential pressures to deliver the actual (unchanged) air volume flow rates. This corresponded to the operating parameters of the fans in Case 2 (without heat recovery).
It was derived which analog control and electric power input of the fans would be necessary under these circumstances.
A comparable method was used for the four additional exhaust air fans (bypass), adjusting the hypothetical pressure conditions in the central exhaust air collection duct.
The difference in electricity consumption between Case 1 and 2 will be referred to as the electrical energy consumption for the heat recovery and was calculated as follows:
where:
= electrical energy consumption to operate a heat recovery system (two heat exchangers) in the barn building’s ventilation system for a given period in kWhel;
= electrical energy consumption of the ventilation system (V) in Case 1 (with heat recovery system) for a given period in kWhel;
= electrical energy consumption of the ventilation system (V) in Case 2 (without heat recovery system) for a given period in kWhel.
To determine the energy efficiency of the heat recovery, the value PF
HR,heating was calculated: This is derived from the recovered thermal energy
and electrical energy consumption for the heat recovery
to operate the heat recovery system (see
Section 2.5, Equation (4)). The uncertainty of COP
heating calculation for COP
HR,heating was also calculated (see
Section S4).
Subsequently, the total quantities of energy (electrical and thermal) were calculated, which were input into the animal husbandry, i.e., into the barn building, through electricity consumption or liquid gas combustion. This was calculated for the two cases as follows:
where:
= energy consumption to operate the barn building for a given period in kWhel,th;
= electrical energy consumption to operate the barn building for a given period in kWhel;
= thermal energy consumption to operate the barn building for a given period in kWhth;
= energy consumption to operate the barn building in Case 1 (with heat recovery) for a given period in kWhel,th;
= thermal energy provided due to combustion of LNG in Case 1 for a given period in kWhth;
= energy consumption to operate the barn building in Case 2 (without heat recovery) for a given period in kWhel,th;
= = additional thermal energy provided due to combustion of LNG in Case 2 for a given period in kWhth; this corresponds to the recovered thermal energy in Case 1 to ensure equal indoor air temperatures in the barn building.
Finally, the energy input to the barn building was compared between Cases 1 and 2. In short, in Case 2, the electrical energy consumption to operate a heat recovery system
was subtracted, and the recovered thermal energy in Case 1
was replaced by additional thermal energy provided due to the combustion of LNG
. In addition, the energy quantities of Equations (8)–(10) were multiplied by the respective specific emission factors and energy costs for electricity and LNG combustion (see
Section 2.6) to determine the savings in CO
2 emissions and energy operating costs.
2.8. Measurement Data Analysis
In general, missing or invalid data points (for the 15-min measurement intervals) were not considered for the derivation of correlations or calculations (valid data points 93.3%; 65,421 intervals of the total of 70,084 intervals). However, the cumulated monthly values were calculated using interpolated values for the missing data points based on the corresponding monthly mean values.
Furthermore, only trial days were considered for calculating temperature amplitude damping, which provided more than 22 h of the day valid data.
Data analysis and visualization were done using Microsoft Office Excel 2019 (Microsoft Corporation, Redmond, Washington, DC, USA). Data were analyzed descriptively by sample size, mean values, standard deviation, minimum and maximum.
3. Results and Discussion
3.1. Operating Parameters and Workload of the Heat Exchangers
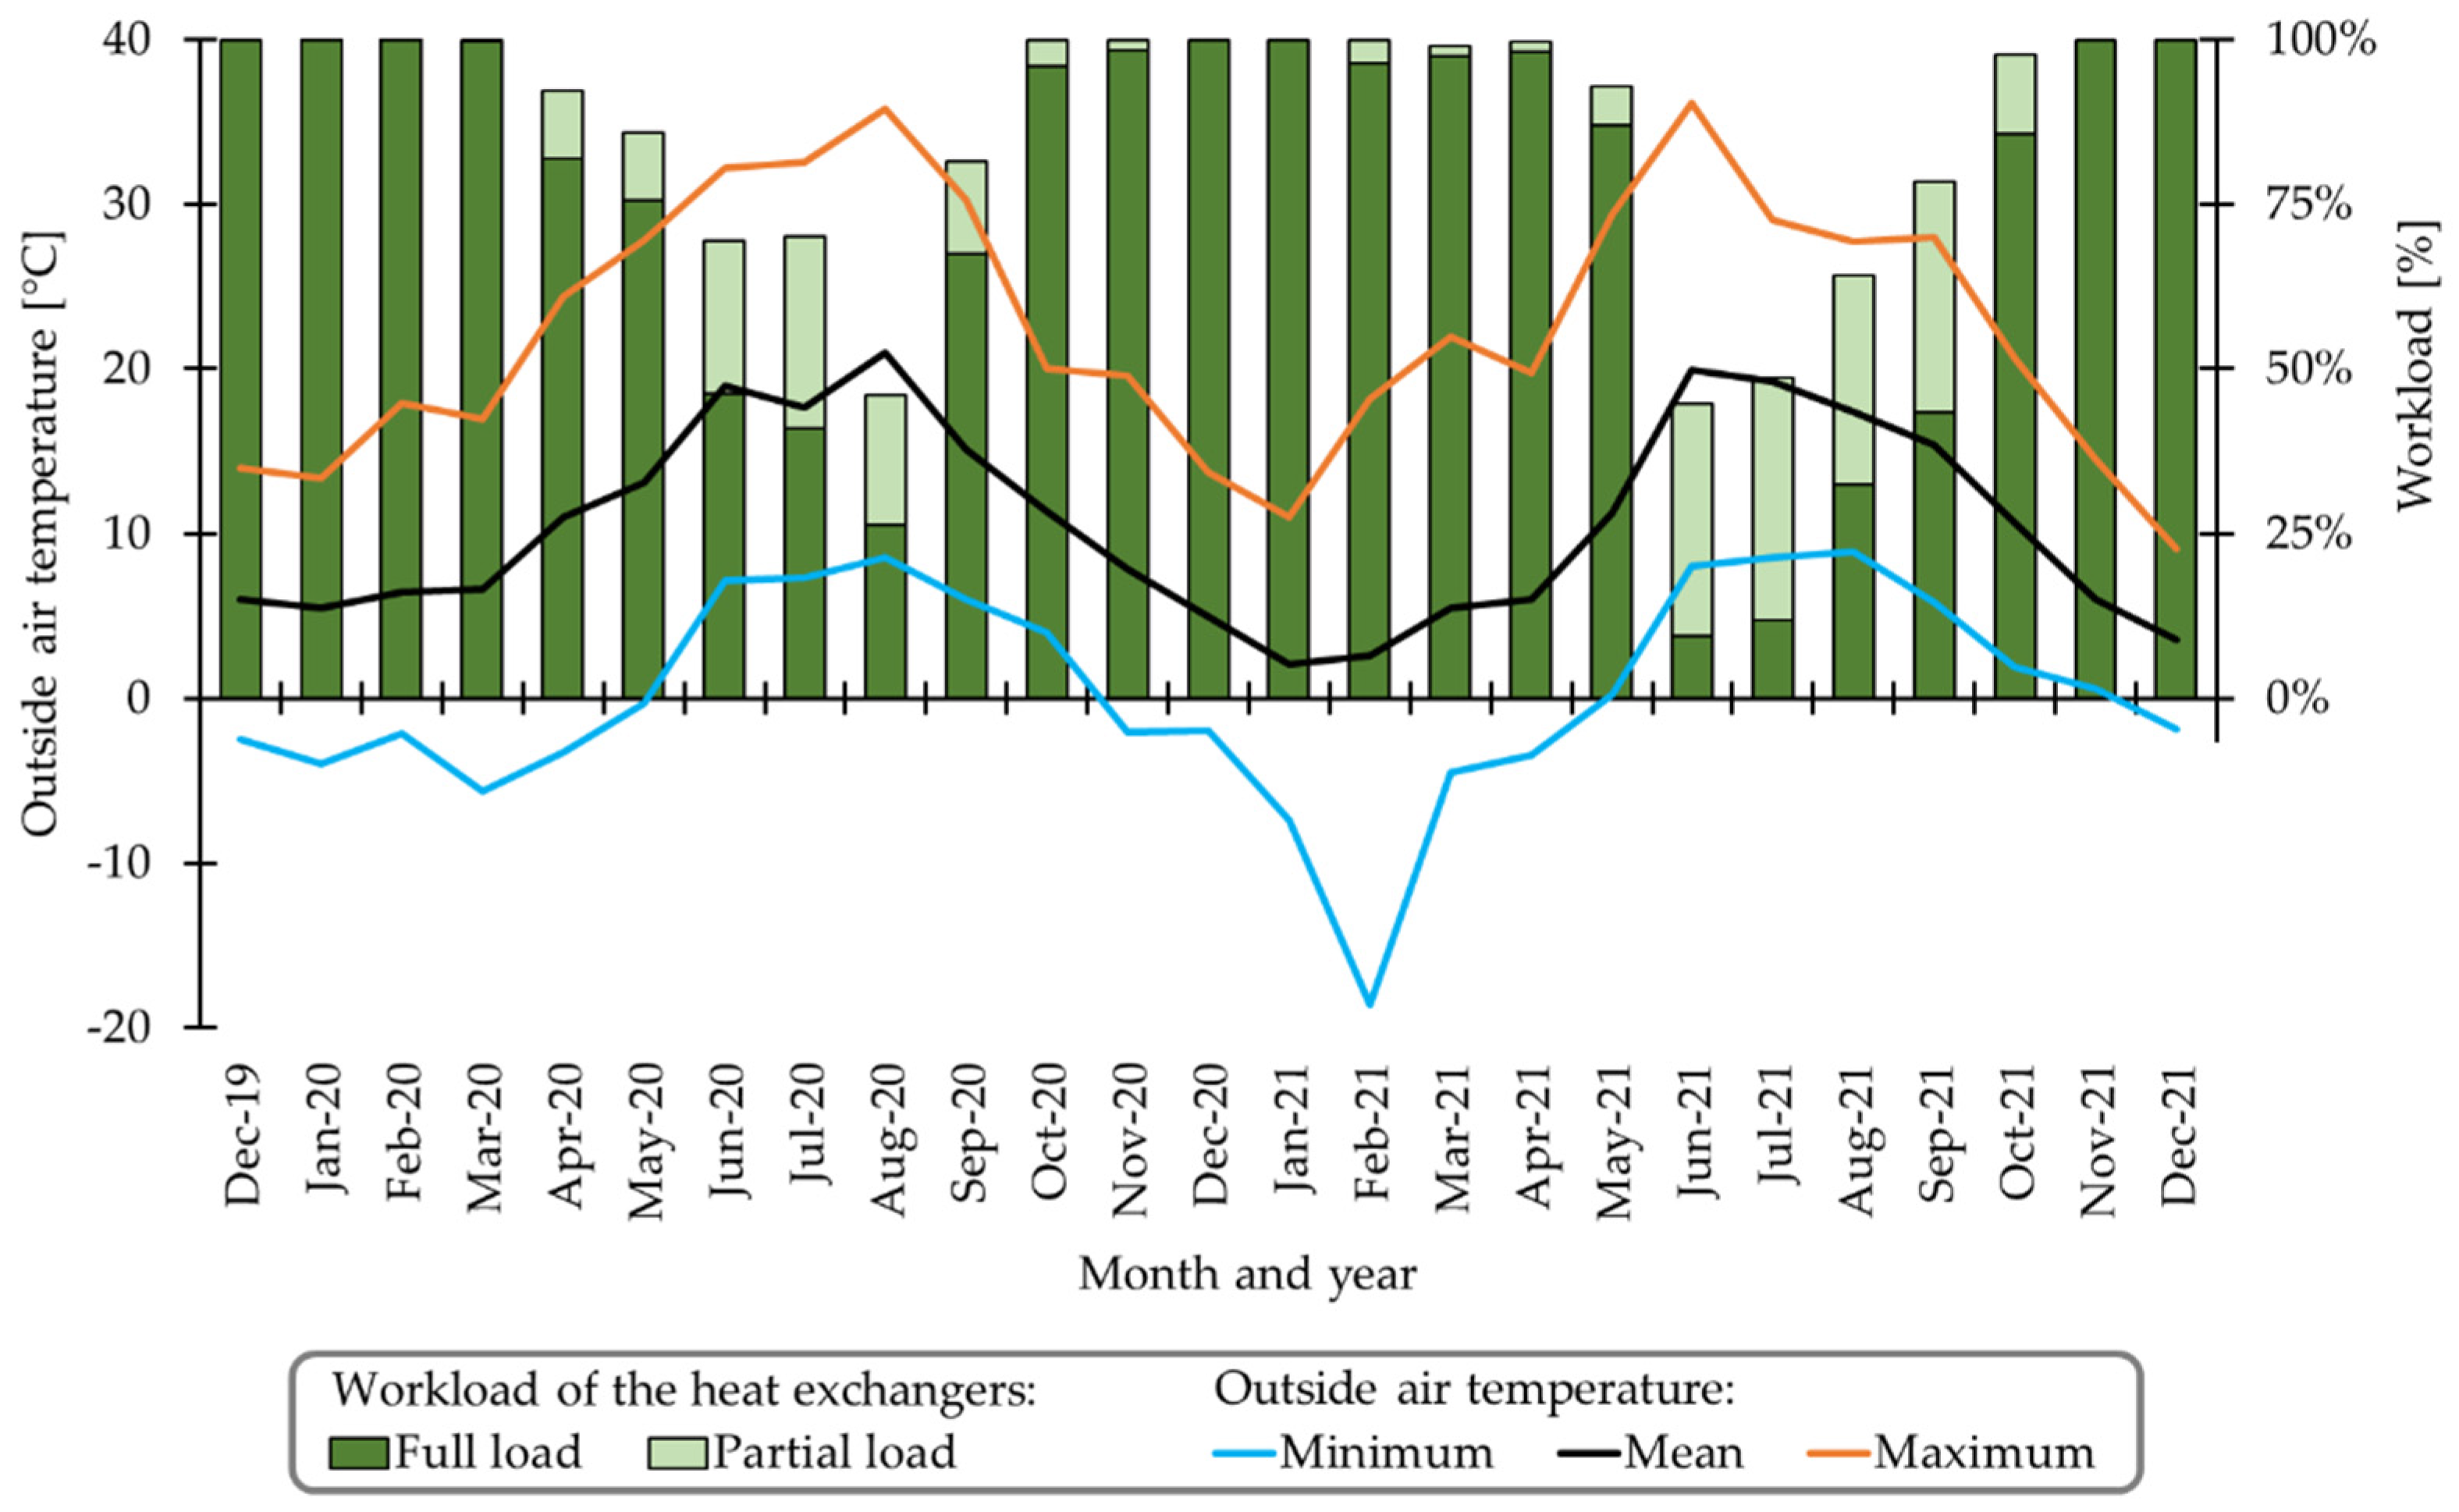
Figure 2 shows the heat exchangers’ monthly workload over the trial period of two years. The figure shows that the workload from October to March was almost constant at 100%. From April to September 2020, the heat exchangers’ workload ranged from 45% to approximately 90%, with the lowest operating workload in August. In the second year, the heat exchangers’ workload showed a similar range, with the lowest workload in June. In his studies on an air-to-air heat exchanger, Rösmann [
28] was also able to achieve an annual workload of 88.4%, with minimum values in summer of 51.2%. The results presented here are, therefore, comparable. Since the efficiency of a heat exchanger increases with the increasing temperature difference between supply and exhaust air [
66], it could be assumed that the heat exchanger generates no benefit in summer. The results refute this assumption and show that the heat exchangers also operate during summer.
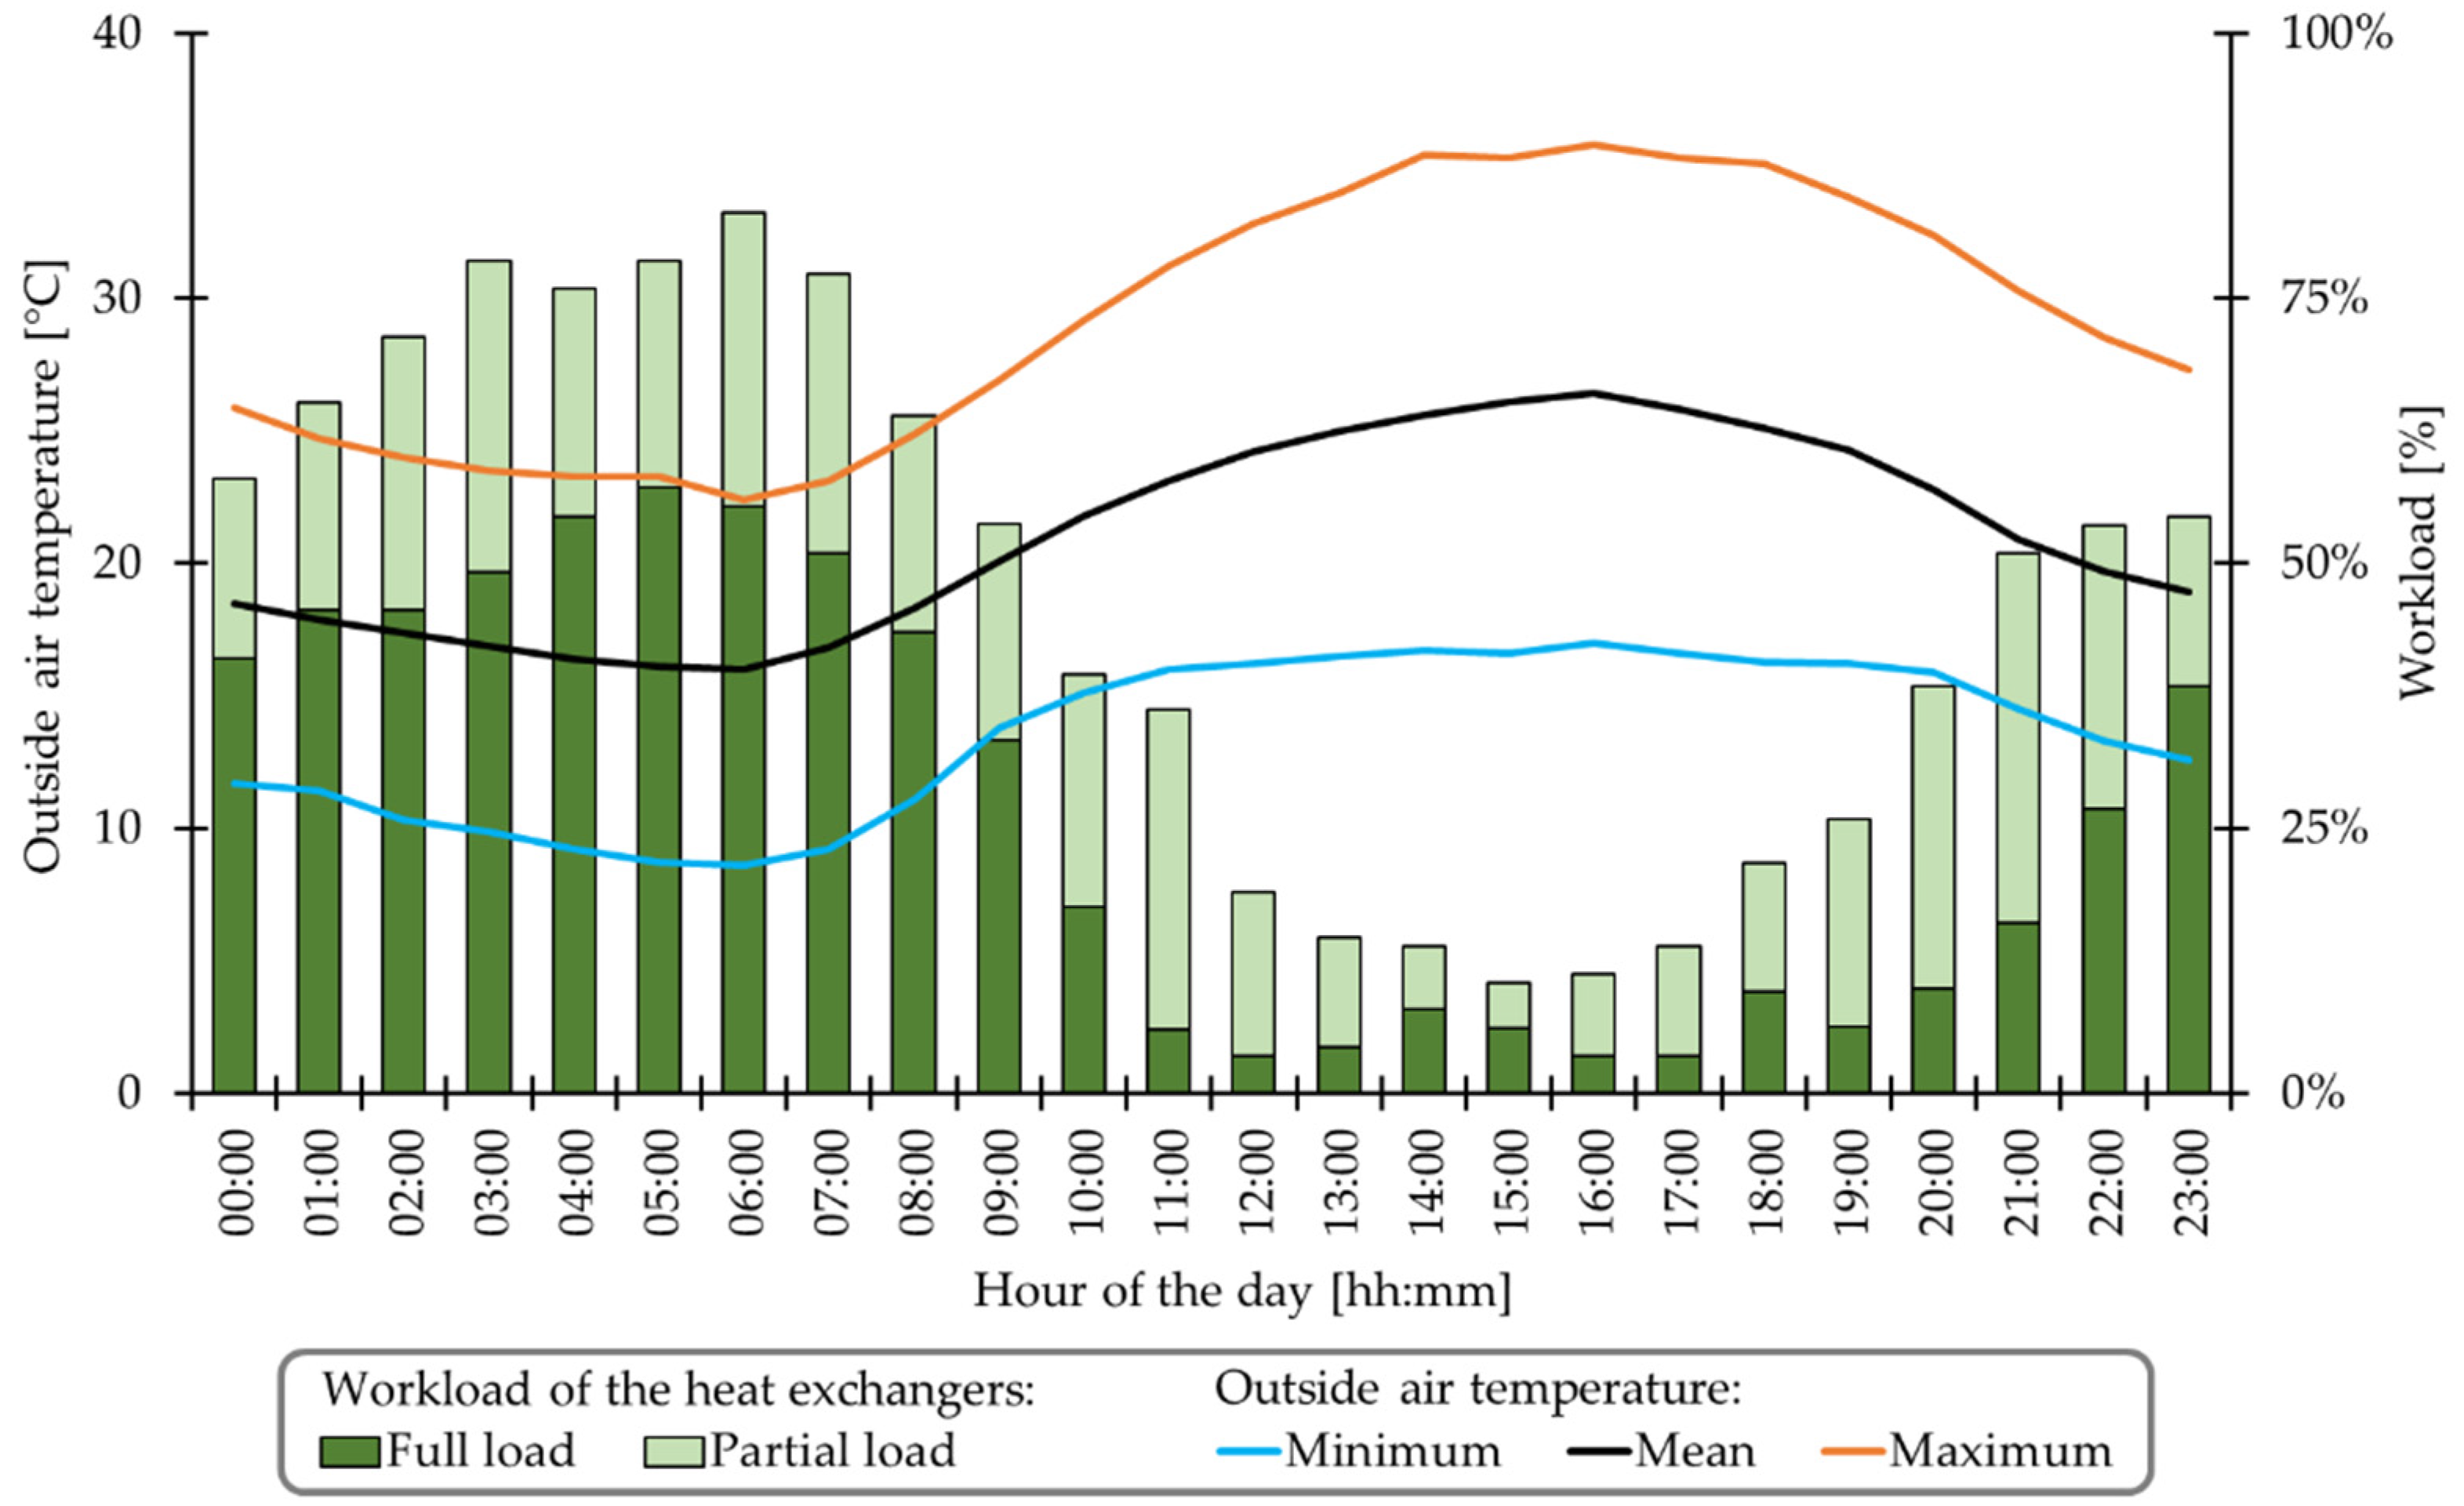
Figure 3 shows the mean workload of the heat exchangers in August 2020. For this purpose, the mean values of each hour of the day were calculated over the 31 days. The heat exchangers reached a workload of 50 to 80% during the night, despite relatively high outside air temperatures of 16–18 °C. The workload dropped to a minimum of 10% at a maximum daily mean outside air temperature of 26 °C and rose to 50% in the evening at an outside air temperature of 20 °C. Looking at the selected courses, it is again clear that a benefit is generated from the heat exchangers, even in warm summer, due to the thermal power during the cooler night hours.
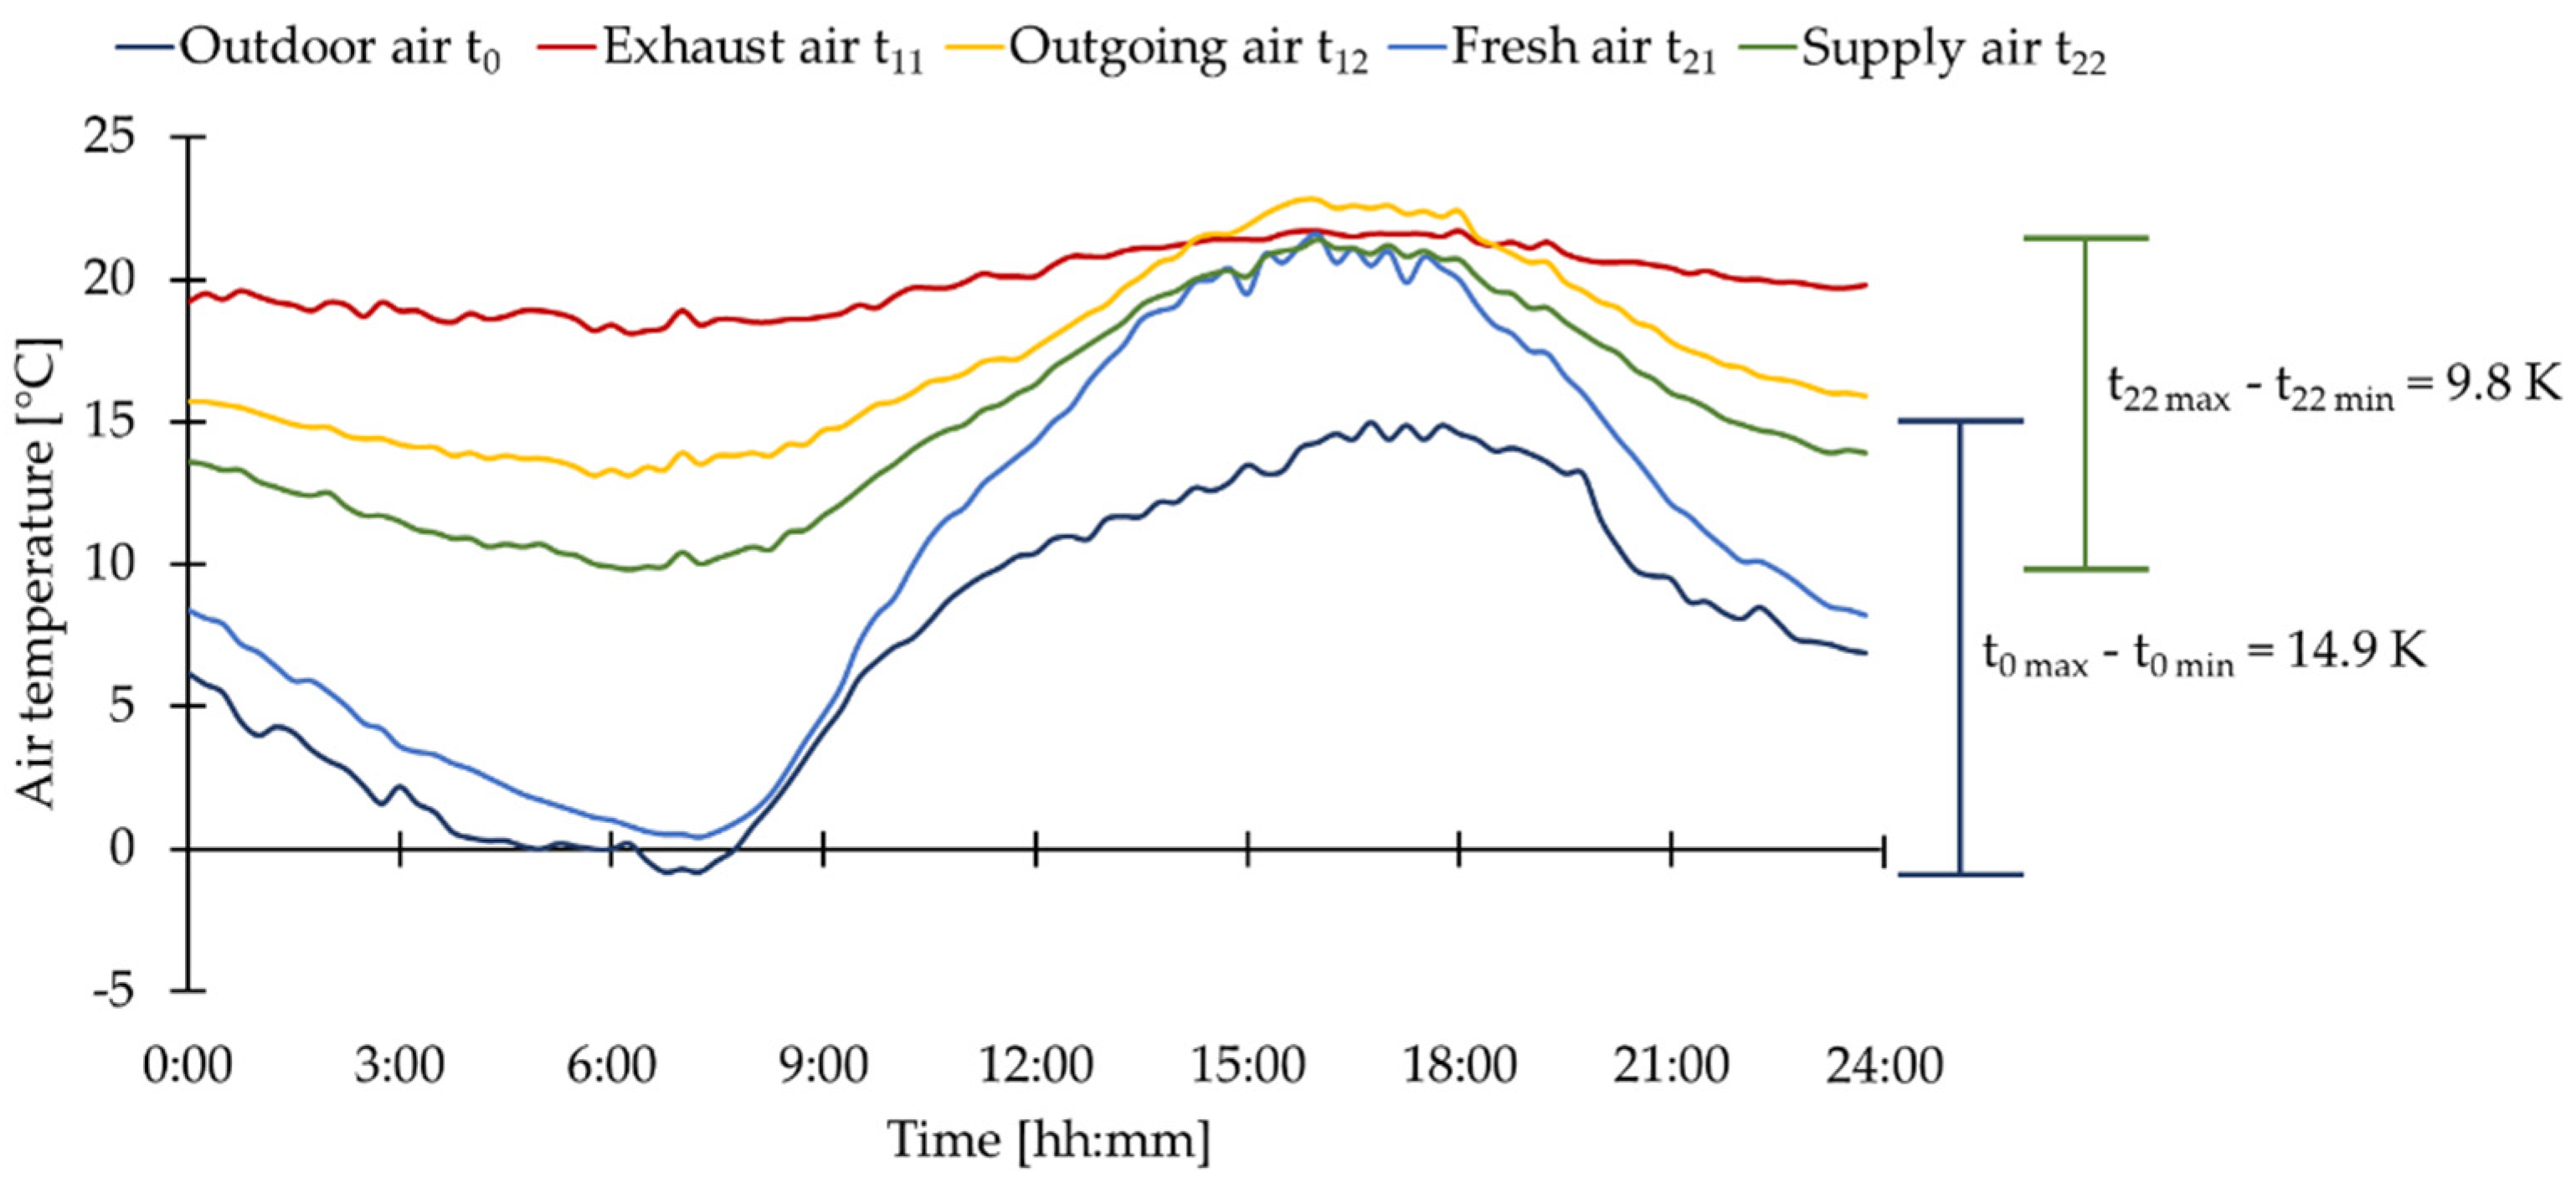
Figure 4 shows the temperature profile [°C] for a single day for outside, fresh, supply, outgoing, and exhaust air (4 April 2020). This day was a typical example of the temperature courses during the spring season and the corresponding heat exchanger operation, i.e., heating during the night and turning off in the afternoon. A closer look at the temperature courses indicates that the fresh air was already warmer than the outside air. This preheating within the attic was already reported by [
38] and can influence the thermal power of heat recovery systems.
The temperature variation of the outside air was 14.9 K (minimum of −0.8 °C and a maximum of 14.1 °C). The temperature variation of the supply air was 9.8 K (minimum of 9.8 °C and a maximum of 19.6 °C). Consequently, the heat exchangers could dampen the temperature amplitude by about −34%. Significant temperature variations occurred, especially in spring and autumn, when temperatures were already in a double-digit range during the day but could drop into negative temperature ranges at night. However, noticeable outside air temperature variations could also occur during the summer periods (
Figure 3), with corresponding heat exchanger workloads during the colder hours. Furthermore, the amplitude damping described was typical in the trial period. The mean damping for each day within the two-year trial was −34.7 ± 12.8%. The more detailed evaluation shows that the percentage damping depended neither on the daily mean outside air temperature nor the daily outside air temperature variation (
Figure S6). This means the relative amplitude damping was consistent throughout the year, but the absolute differences between outside and supply air temperature variations changed with the amount of outside air temperature variations during the seasons.
Significant temperature variations over a day can increase heating costs and thus CO
2 emissions [
67]. Furthermore, significant temperature variations must be avoided in terms of animal welfare because the animals can quickly reach the limits of their adaptability and be exposed to temperature stress [
68,
69]. The results presented here align with other studies’ results, demonstrating lower supply air temperature variations and amplitude damping using heat exchangers or other heat recovery systems [
22,
29,
38]. The decreasing temperature difference between incoming supply and compartments’ room air reduces the risk of draughts and promotes more homogenous temporal and spatial air temperatures and air flow [
22]. In poultry production, this has led to improved animal distribution in the barn building [
22,
27].
Furthermore, Han et al. (2013) [
22] reported that average air flow rates were about 10–20% higher in a broiler barn building with heat exchangers compared with a comparable building without heat exchangers. Goselink et al. (2019) [
30] reported an increase of 12%. This is especially important in cold situations: preheating the fresh air facilitates higher air flow rates for an improved discharge of harmful gases, e.g., CO
2 or NH
3. For poultry production, higher air flow rates can positively influence litter quality and animal health [
22,
27]. In addition, the practice survey showed that heat exchangers could tend (
p = 0.07) to improve the daily weight gain of broilers [
27]. There is still a need for research on piglet rearing concerning possible benefits.
Within this investigated period, it was once more shown that the temperature difference between supply and fresh air depended on the fresh air temperatures. The correlation (t22 = −0.3897 × t21 + 8.9326; R² = 0.9534) was high, and the maximum temperature difference was 14.0 K on 13 February 2021 (second year of trial; outside air temperature −17.9 °C, fresh air temperature −11.0 °C, supply air temperature 2.9 °C, supply air volume flow rate 22.790 m³ h−1, thermal power 113.8 kWth).
3.2. Thermal Power, Recovered Thermal Energy, and the Effectiveness
Table 1 shows the minimum, mean and maximum monthly temperature profiles [°C] of outside, fresh, and supply air for the first year of the trial period and the thermal power [kW
th].
In the first year of the investigations (2020), the fresh air temperature was on average 10.8 °C while the supply air temperature was on average 15.5 °C. Thus, the fresh air was heated by an average of 4.7 K when it passed through the heat exchangers, considering a mean thermal power of 39.6 kW
th. The maximum thermal power was 98.9 kW
th at a fresh air temperature of −4.1 °C and an attained supply air temperature of 6.4 °C (supply air volume flow rate of 17.272 m³ h
−1 per heat exchanger). The temperature difference was thus 10.8 K. On the other hand, the lowest thermal power was achieved at a fresh air temperature of 24.2 °C and a supply air temperature of 24.3 °C. Comparable values were also obtained in the second year of the investigation, with a maximum thermal power of 115.6 kW
th. As already shown by former studies [
28,
33], the thermal power increases with decreasing outside air temperature. The higher the temperature difference between fresh and exhaust air, the more heat that can be transferred. During the heat exchangers’ heating, the exhaust air showed constant temperature levels of 21.5 ± 2.3 °C for year 1 and 20.9 ± 2.4 °C for year 2.
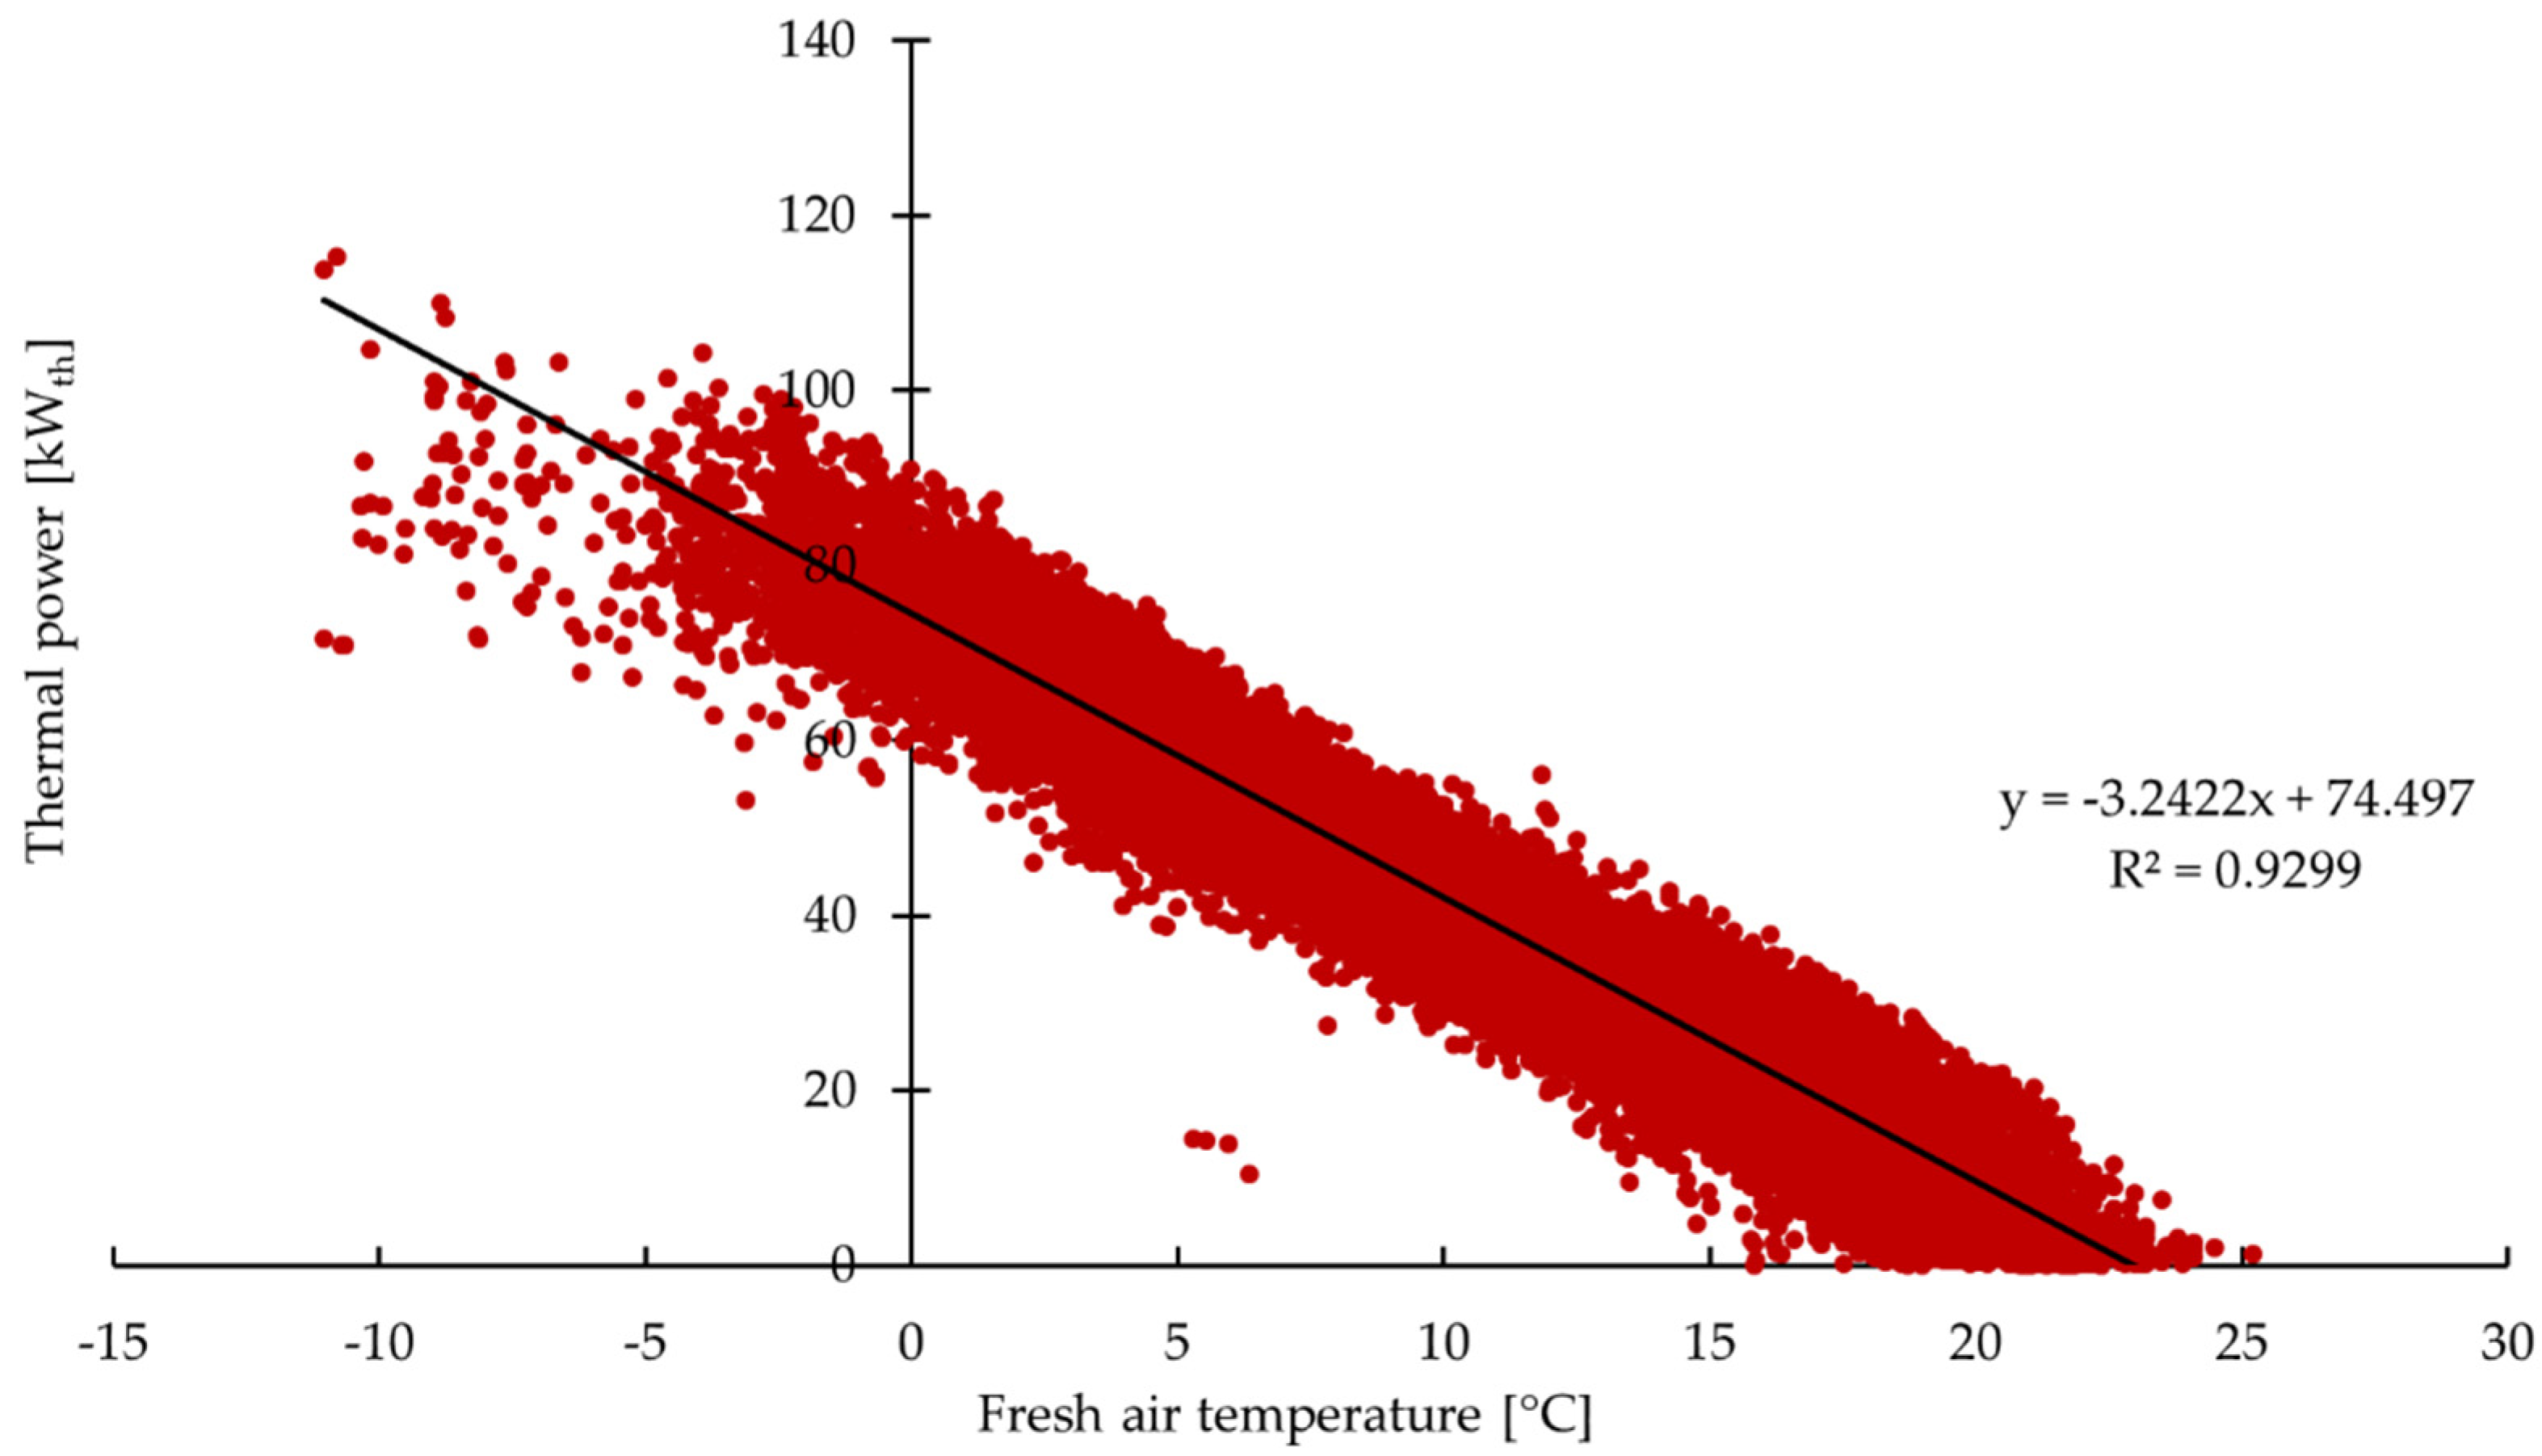
Figure 5 shows the correlation between the thermal power [kW
th] and the fresh air temperature [°C]. The highest thermal power could be achieved at low fresh air temperatures following a linear correlation.
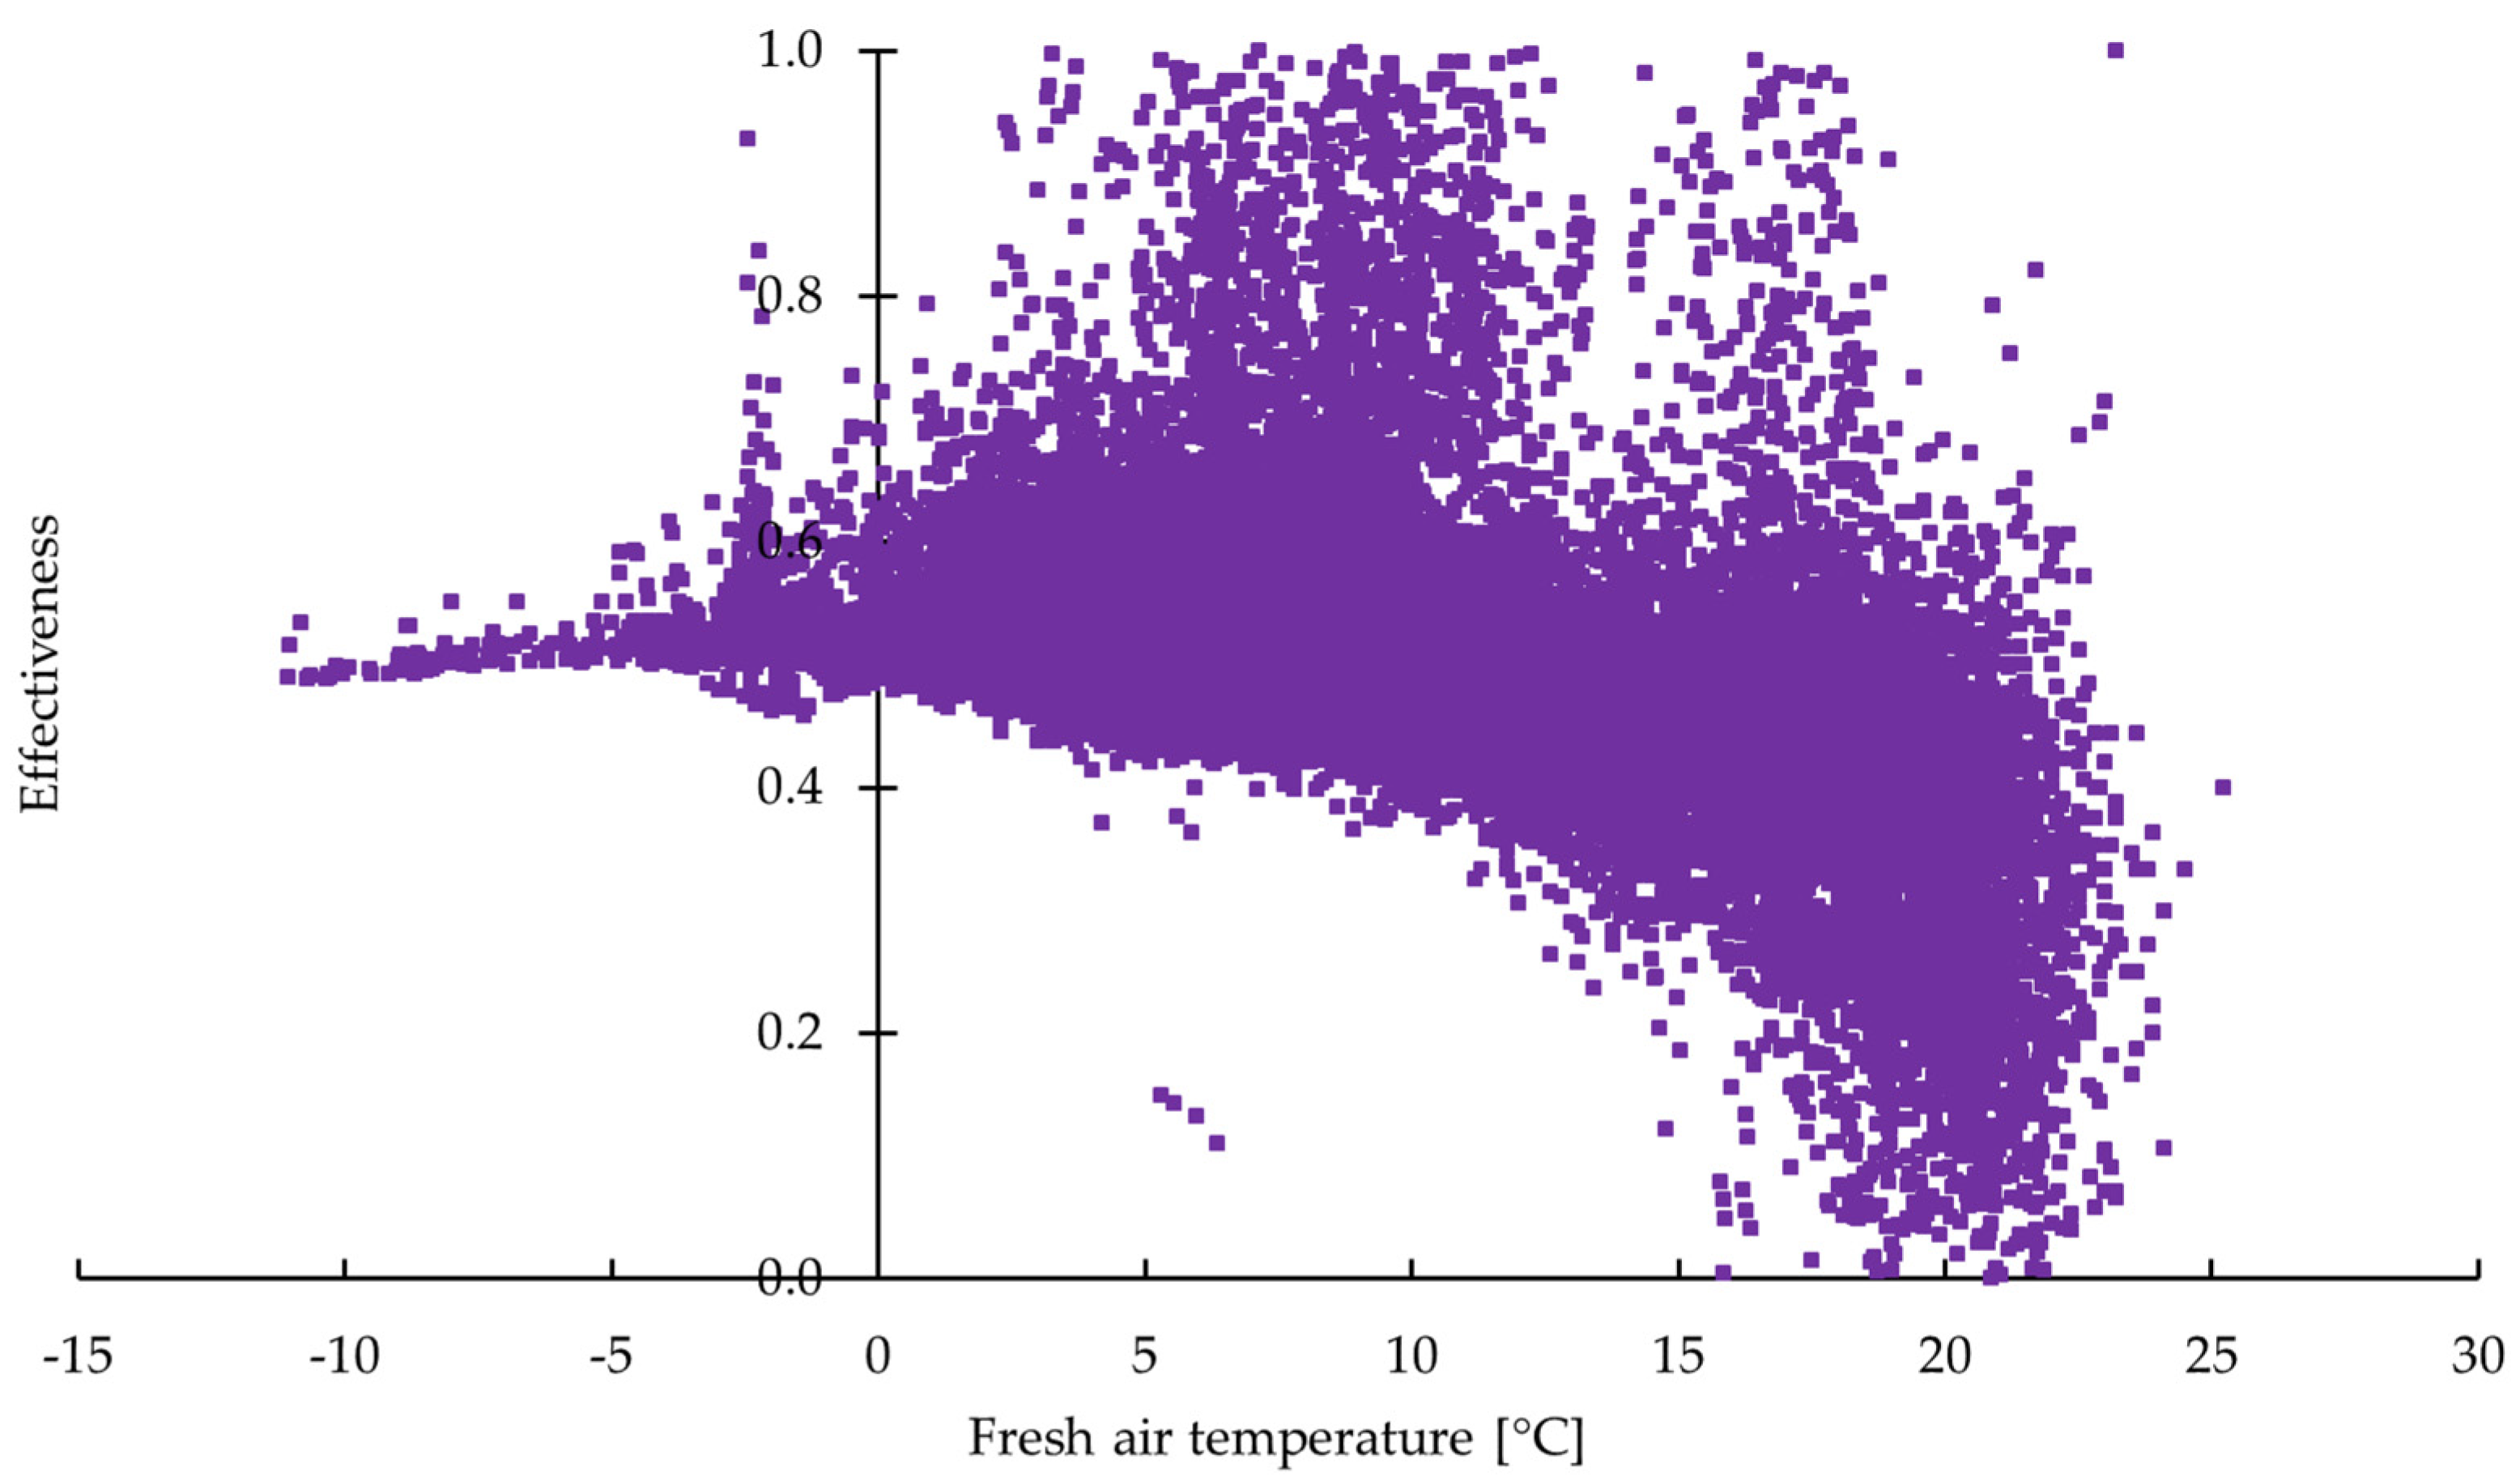
The effectiveness ε of the heat exchangers is presented in
Figure 6. The mean value of the parameter during the two-year trial was 0.49 ± 0.13. It is shown that the values were at a constant level and decreased considerably at higher fresh air temperatures, thus with decreasing temperature differences between fresh and exhaust air. While 86.6% of the data were in the range 0.4 ≤ ε ≤ 0.6, 0.6% of the values were ε > 1 and outside the actual definition range of the parameter. A detailed examination (
Figure S7) shows that these values mainly occurred at comparatively low exhaust air mass flows, and effectiveness increased with decreasing air flow rates. Due to varying fan control in short intervals, the ratio of exhaust and supply air mass flow rates drifted widely, allowing a calculated effectiveness of ε > 1. Since these irregularities of the fan control occurred in short periods within the two-year trial and were resolved after detection, these values are considered outliers, which can occur in the context of investigation under field conditions.
The effectiveness investigated in this study was considerably higher than that of earlier barn building studies [
46,
47]. Moreover, various publications state different equations for calculating heat exchangers’ effectiveness; some studies consider the exhaust or supply air mass flow rates [
46,
47], and some do not [
29,
30,
41,
70]. Therefore, comparing those publications and effectiveness values is only of limited informative value. However, the investigated heat exchangers’ effectiveness seems to be high in the context of barn building ventilation.
3.3. Energy Input, Coefficient of Performance, and Performance Factor
The PF
heating described the energy efficiency of the heat recovery and was determined for various reference variables.
Table 2 gives the annual electrical energy consumption for both trial years of all relevant consumers, the thermal energy supply, and the PFs
heating for different variables. There was no noticeable difference in electricity consumption between the two trial years. This is because both years were conducted under the same conditions with minimal modifications during the test period. Electricity consumption was higher in summer than in winter in both years due to increased ventilation rates resulting from high temperatures.
In detail, the cumulated thermal energy supply Q
Case1,th accounted for the larger share of total energy demand, with 77% and 78% for the two years, respectively (
Table 2). The electrical energy consumption Q
Case1,el accounted for the remaining 22–23%, with ventilation Q
V,Case1,el taking the most significant proportion at 11%. The data collected are comparable to those previously described in the literature [
7,
71].
For the ventilation system, 59.6–63.4% was attributed as electrical energy consumption for the heat recovery Q
HR,el. This means that only 36.6–40.4% of the corresponding electrical energy for ventilation would be necessary if the ventilation system was operated without heat exchangers. This is because using the heat exchangers causes an increased air flow resistance, which the fans must overcome. Additional electrical energy is required for this [
24]. The values align with the former literature [
22].
However, when considering the thermal energy input to operate the barn building Q
Case1,th, 65–66% was provided by heat recovery Q
HR,th, and only 34–35% was provided by the combustion of LNG Q
LNG,Case1,th (for more detailed information, see
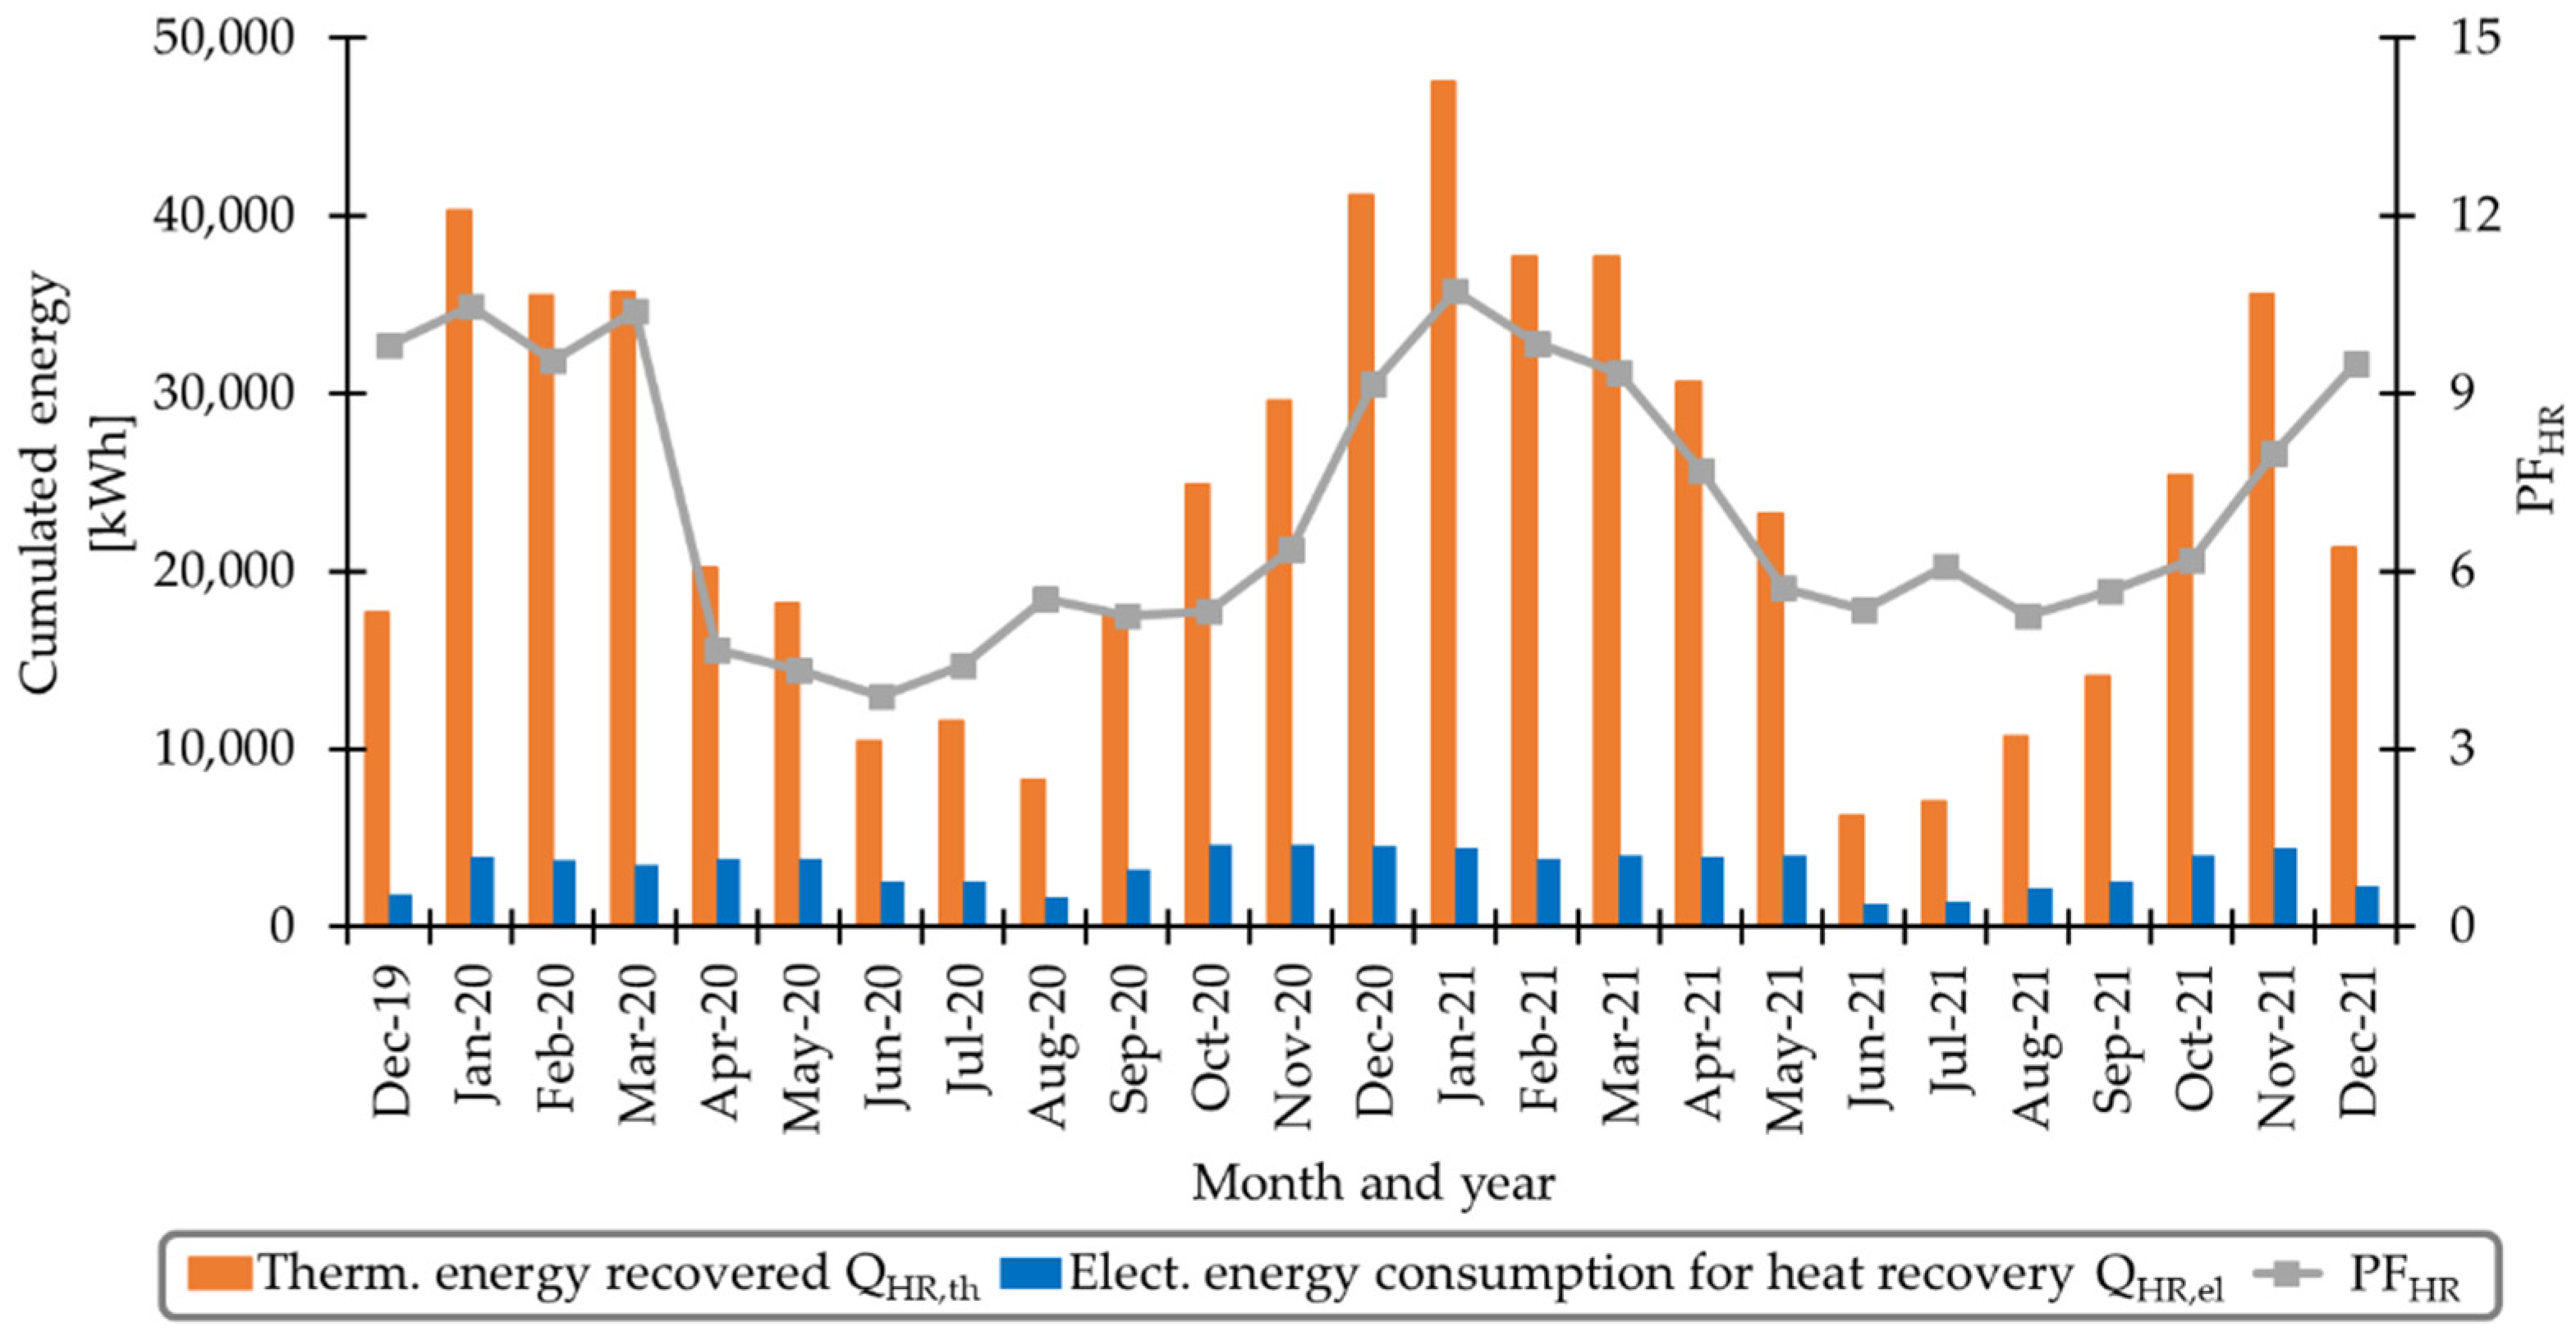
Figure S8). The electrical energy consumption for the heat recovery Q
HR,el was 40,514–41,888 kWh
el. The total thermal energy recovered Q
HR,th using the heat exchangers was 290,414–317,913 kWh
th a
−1. This means that the total energy consumption to operate the barn building in Case 1 Q
Case1 was 285,628 kWh
el,th in reality with heat exchangers (year 2: 298,980 kWh
el,th) and would be in Case 2 Q
Case2 534,154 kWh
el,th if operated without heat exchangers (year 2: 576,379 kWh
el,th). Therefore, heat exchangers reduced the energy demand of these piglet rearing buildings by −47% (year 2: −48%, see
Section 3.4). The energy demand of Case 2 (without heat exchangers) is comparable to former literature concerning German pig farms [
7,
18] in terms of energy demand per animal place (AP, concerning 4140 piglet rearing places) and year [129–139 kWh
el,th (AP a)
−1]. This value decreases noticeably in Case 1 (with heat exchangers) to 69–72 kWh
el,th (AP a)
−1. The data presented demonstrate the great potential to reduce energy consumption through the use of heat exchangers and thus act in an economically and ecologically sustainable manner. In addition, e.g., [
22,
27,
28,
30,
33,
36,
38] could already show in their investigations that reductions are possible by heat recovery technologies in barn buildings.
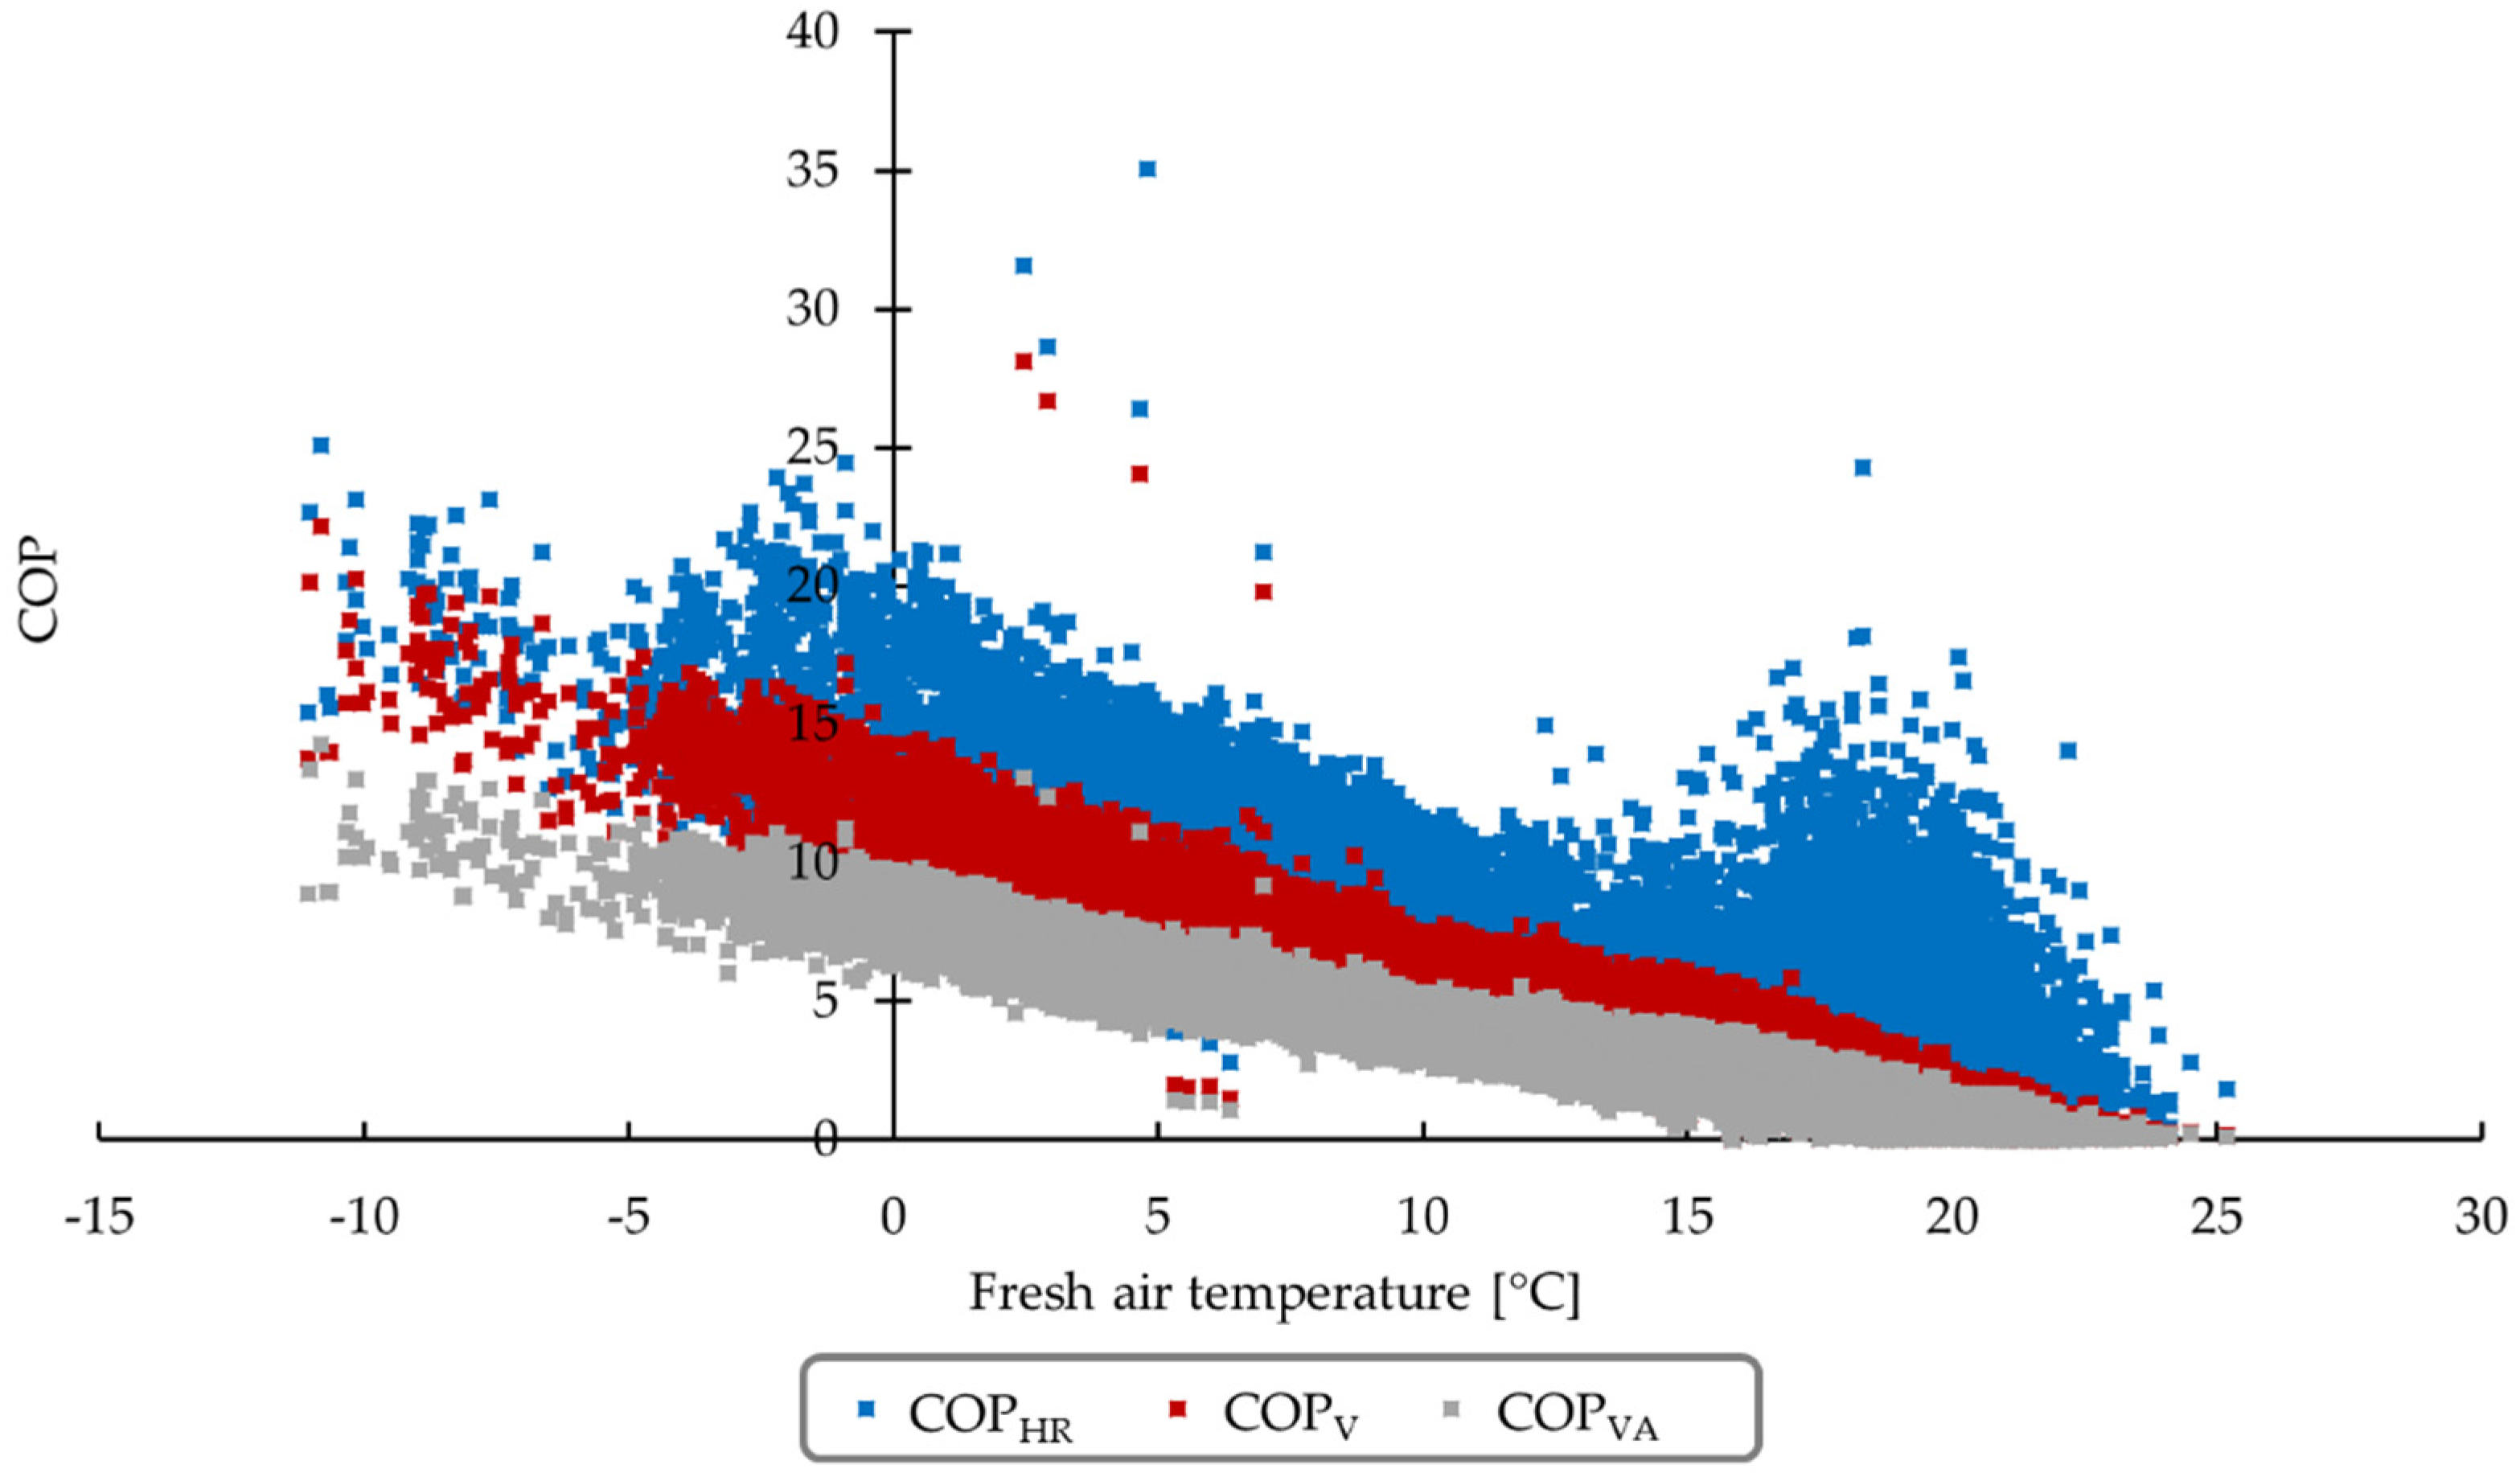
Figure 7 shows the various PFs
heating as a function of the fresh air temperature (see
Section 2.5 and
Section 2.7). In general, it can be said that the lower the fresh air temperature, the higher the PF
heating. As the fresh air temperature increased and the thermal power decreased, the COP
heating followed a negative, linear correlation. In detail, the general linear correlation was less appropriate for COP
HR,heating with fresh air temperatures above 15 °C. The increasing values can be explained based on the opening of the bypass air shutters and the corresponding effects on the differential pressures. In this case, the electrical energy consumption for the heat recovery Q
HR,el decreased noticeably while the thermal power followed the linear correlation, i.e., the COP
heating increased.
The PF
HR,heating averaged 6.9–7.8 per year and reached a COP
HR,heating maximum of 25.1 at a fresh temperature of −10.8 °C (excluding outliers). Even in the warm summer months, the PF
HR,heating was between 2.5 and 3.5 (June–August), so an energy benefit was also available here (see
Figure 8). [
33] determined comparable COP
heating values between 7.1 and 11.5 during tests with an exchange scrubber in winter. Lower values were reported by [
27,
34]. Another study could determine higher COP
heating or PF
heating values by using a heat exchanger [
28]. However, in that study, no detailed information is given about the distinction between electrical energy consumption for the barn ventilation and the electrical energy consumption for operating the heat recovery Q
HR,el. The study presented here is, to the author’s knowledge, the first that presents such a detailed approach to investigate this topic and to obtain more precise information about the energy efficiency of heat exchangers in their practical use in barn buildings.
Moreover, the COP
heating and PF
heating of the investigated air-to-air heat exchanger were, in most parts, higher than the COPs
heating or PFs
heating of other heat recovery technologies mentioned in the various cited studies concerning barn buildings. Morshed et al. (2018) [
72], for example, reported PF
heating values of 1.5 on a daily average when using an earth-to-air heat exchanger. Studies investigating heat pumps were able to determine values between 2.5 and 4.1 [
35,
36]. Nevertheless, the comparison based on the COP
heating or PF
heating between different studies is only possible to a limited extent since factors such as study design, seasonal influences (especially outside and fresh air temperatures), and technical equipment affect the trial conditions and the calculated COPs
heating or PFs
heating, respectively.
3.4. Substituted CO2 Emissions and Energy Costs
Table 3 shows the total amount of consumed energy to operate the barn, the proportions of recovered thermal energy included therein, and the resulting calculated CO
2 and cost savings for Case 1 and 2 for both trial years. For year 1, the total energy consumption corresponded to values of 95.42 kWh
el,th (m
2 a)
−1 for the barn building for Case 1 and 178.44 kWh
el,th (m
2 a)
−1 for Case 2, respectively; for year 2, 99.88 kWh
el,th (m
2 a)
−1 for Case 1 and 192.54 kWh
el,th (m
2 a)
−1 for Case 2, respectively.
In both years, the total energy consumption for operating the barn building was reduced by nearly half through heat exchangers (year 1: 46.5%; year 2: 48.1%). The energy savings correspond to reduced connected CO2 emissions of 35.5% (year 1) and 37.5% (year 2). In total, 50,950 kg and 58,056 kg CO2 per year were mitigated, respectively. The recovered thermal energy resulted in cost savings of EUR 4540 and EUR 12,028 per year for the investigated barn; this corresponds to savings of EUR 1.10 and 2.91 (AP a)−1.
The results show that heat exchangers can significantly increase energy efficiency and economic and ecological sustainability. Despite the higher demand for electrical energy due to heat recovery, cost savings can still be achieved. In this case study, the saving of energy costs followed a high correlation depending on the fresh air temperature (savings per hour [EUR h
−1] = 0.2244 × t
21 − 4.3377; R² = 0.7138). For the two-year trial, the comparison between specific heating costs using LNG (6.58 ± 1.69 ct kWh
th−1) and using the heat exchangers (concerning LNG substitution and electrical energy consumption for the heat recovery Q
HR,el, and electricity price 26.97 ± 0.30 ct kWh
el−1) underlined this fact (
Figure S9). The specific heating costs of the heat exchangers were 5.02 ± 19.38 ct kWh
th−1 and 87.2% of the time below the actual German LNG costs (based on the 15-minute intervals when the heat exchanger was heating).
This leads to a payback period after a few years, depending on the individual initial capital costs. In detail, the savings of the first trial year were considered in a barn-specific calculation: The installation of the heat recovery system cost around EUR 66,400 with a payback period of 13.0 years. In Case 2 (without heat recovery), however, there were additional costs for installing an LNG heating system with a higher heating capacity than in Case 1. The bottom line is that Case 1 would be only EUR 8300 more expensive than Case 2. The payback period for these additional costs is 1.6 years. These calculations include the maintenance costs for the heat exchangers (see
Section 2.6 and
Table S3).
Other studies have also demonstrated energy-efficient technologies’ economic and ecological benefits. In comparison with the former literature in this field of research, the study presented here is based on a larger scale (heat recovery for the whole barn building and not only for one animal compartment, e.g., [
36]), for a more extended measurement period (two years and not only trials during the winter months, e.g., [
22,
30,
33]), and more detailed (calculation of the electrical energy consumption for the heat recovery Q
HR,el and not only an estimation of a specific ratio of the total electricity consumption of the fans, e.g., [
28,
29]).
Nevertheless, the investigated system’s application and other heat recovery systems can be extended to other areas of farm animal husbandry. Several studies have, for example, already dealt with the use of heat recovery systems in poultry husbandry and have also been able to demonstrate increases in sustainability [
22,
27,
30]. Depending on the husbandry stage and form, the barn ventilation systems are fundamentally similar so that heat recovery systems can be usefully integrated into the housing concept for both animal species. Some challenges of animal husbandry can be improved in this way, whereby the animal species-specific prerequisites must be researched and considered (see
Section 3.1). However, the use of such systems remains limited to force-ventilated systems, so it is not easy to implement them, for example, in dairy farming, which is primarily free-ventilated. Nevertheless, heat recovery systems can be considered a sustainable technology in pig and poultry production which politics should fund in the future.
Concerning climate change and the legal requirements for mitigating emissions [
1], the benefits shown here should be utilized more effectively. Ecologically, using a heat exchanger also brings advantages since fossil fuels could be saved, and thus resulting CO
2 emissions could be noticeably reduced. As mentioned above, the CO
2 savings depend on the fresh air temperature too (savings per hour [(kg CO
2) h
−1]= 0.7492 × t
21 − 16.293; R² = 0.9275;
Figure S10).
3.5. Relevance for Modern, Global Pig Husbandry
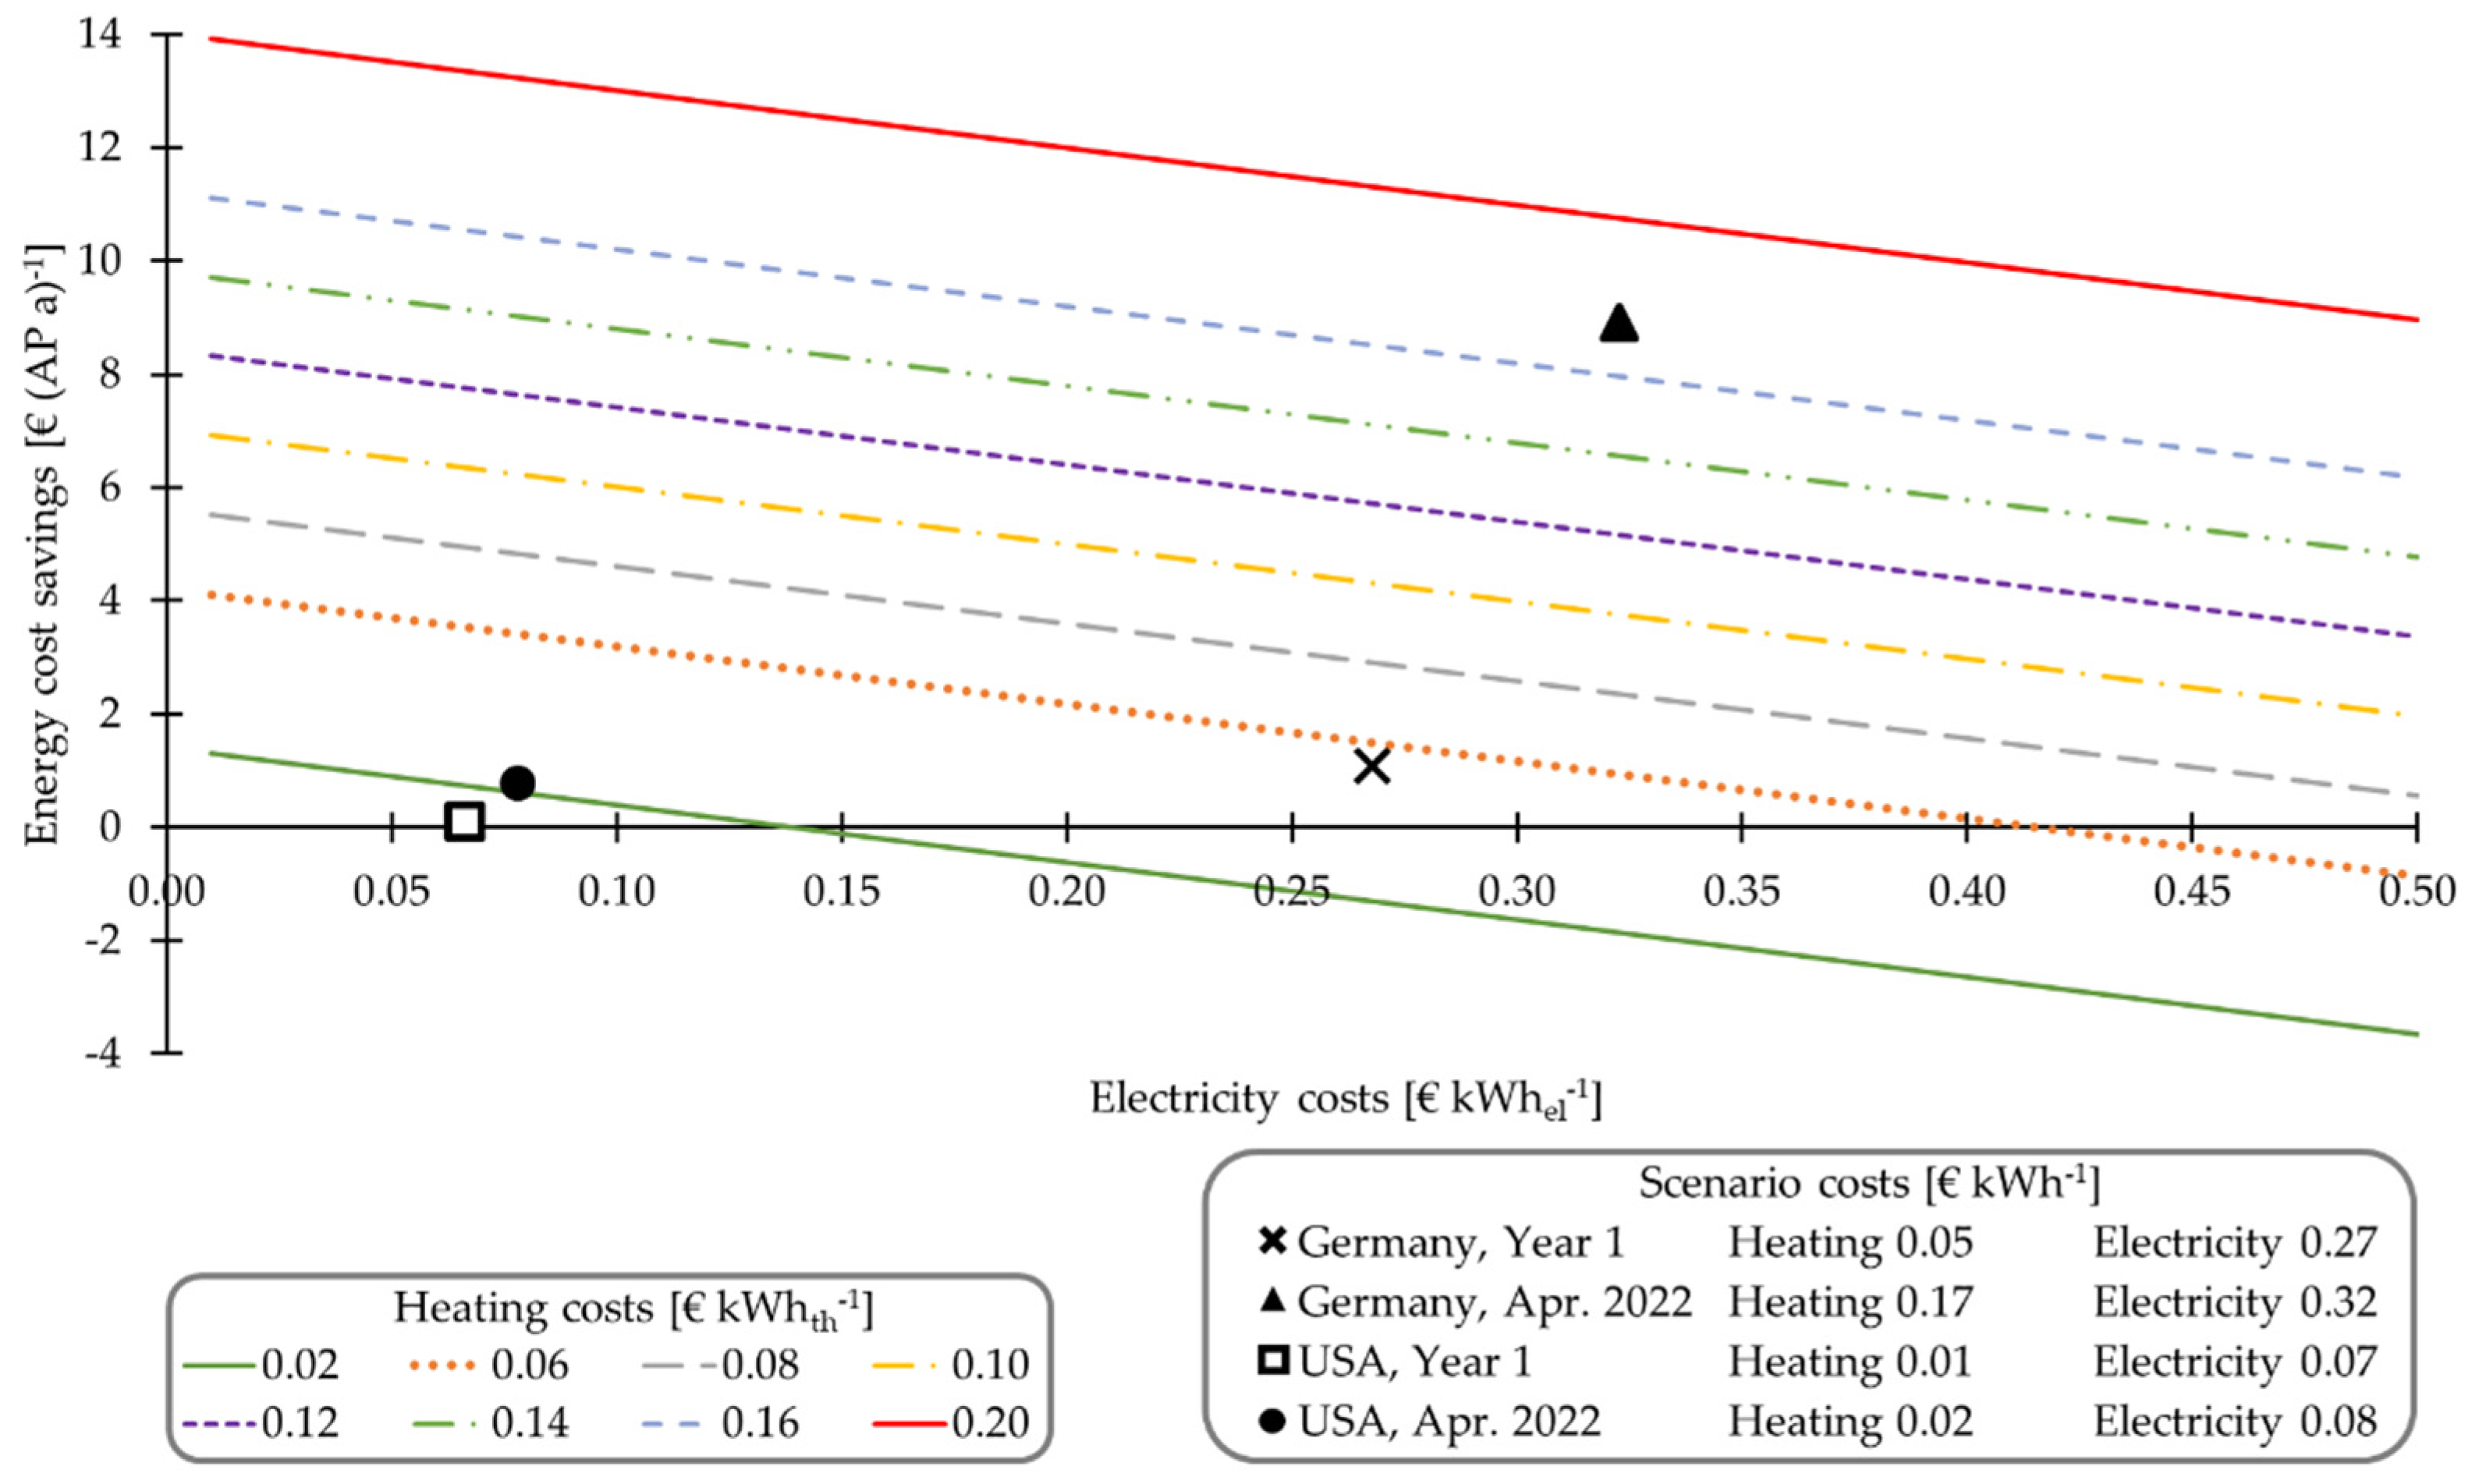
Figure 9 shows the annual savings per animal place using heat recovery [EUR (AP year)
−1] depending on the prices for electricity and liquefied natural gas [ct kWh
el,th−1] for different scenarios. The economic benefit is affected by the ratio of electricity and LNG prices. The heat recovery systems offer the highest profit at high heating and low electricity costs.
In April 2022, with a LNG price of 17.37 ct kWh
th−1 and electricity costs of 32.27 ct kWh
el−1, savings of EUR 36,940.49 could be achieved in Germany. In contrast, the given scenario of current energy costs in the US show (savings of EUR 3219.60 a
−1 in the scenario USA April 2022) that the savings can differ noticeably between the various countries. Since the (German) prices for fuels are fluctuating and following an increasing trend [
64], it can be assumed that the use of heat exchangers can also be described as profitable if the development of energy prices remains steady. Crises and advancing climate change can influence this trend.
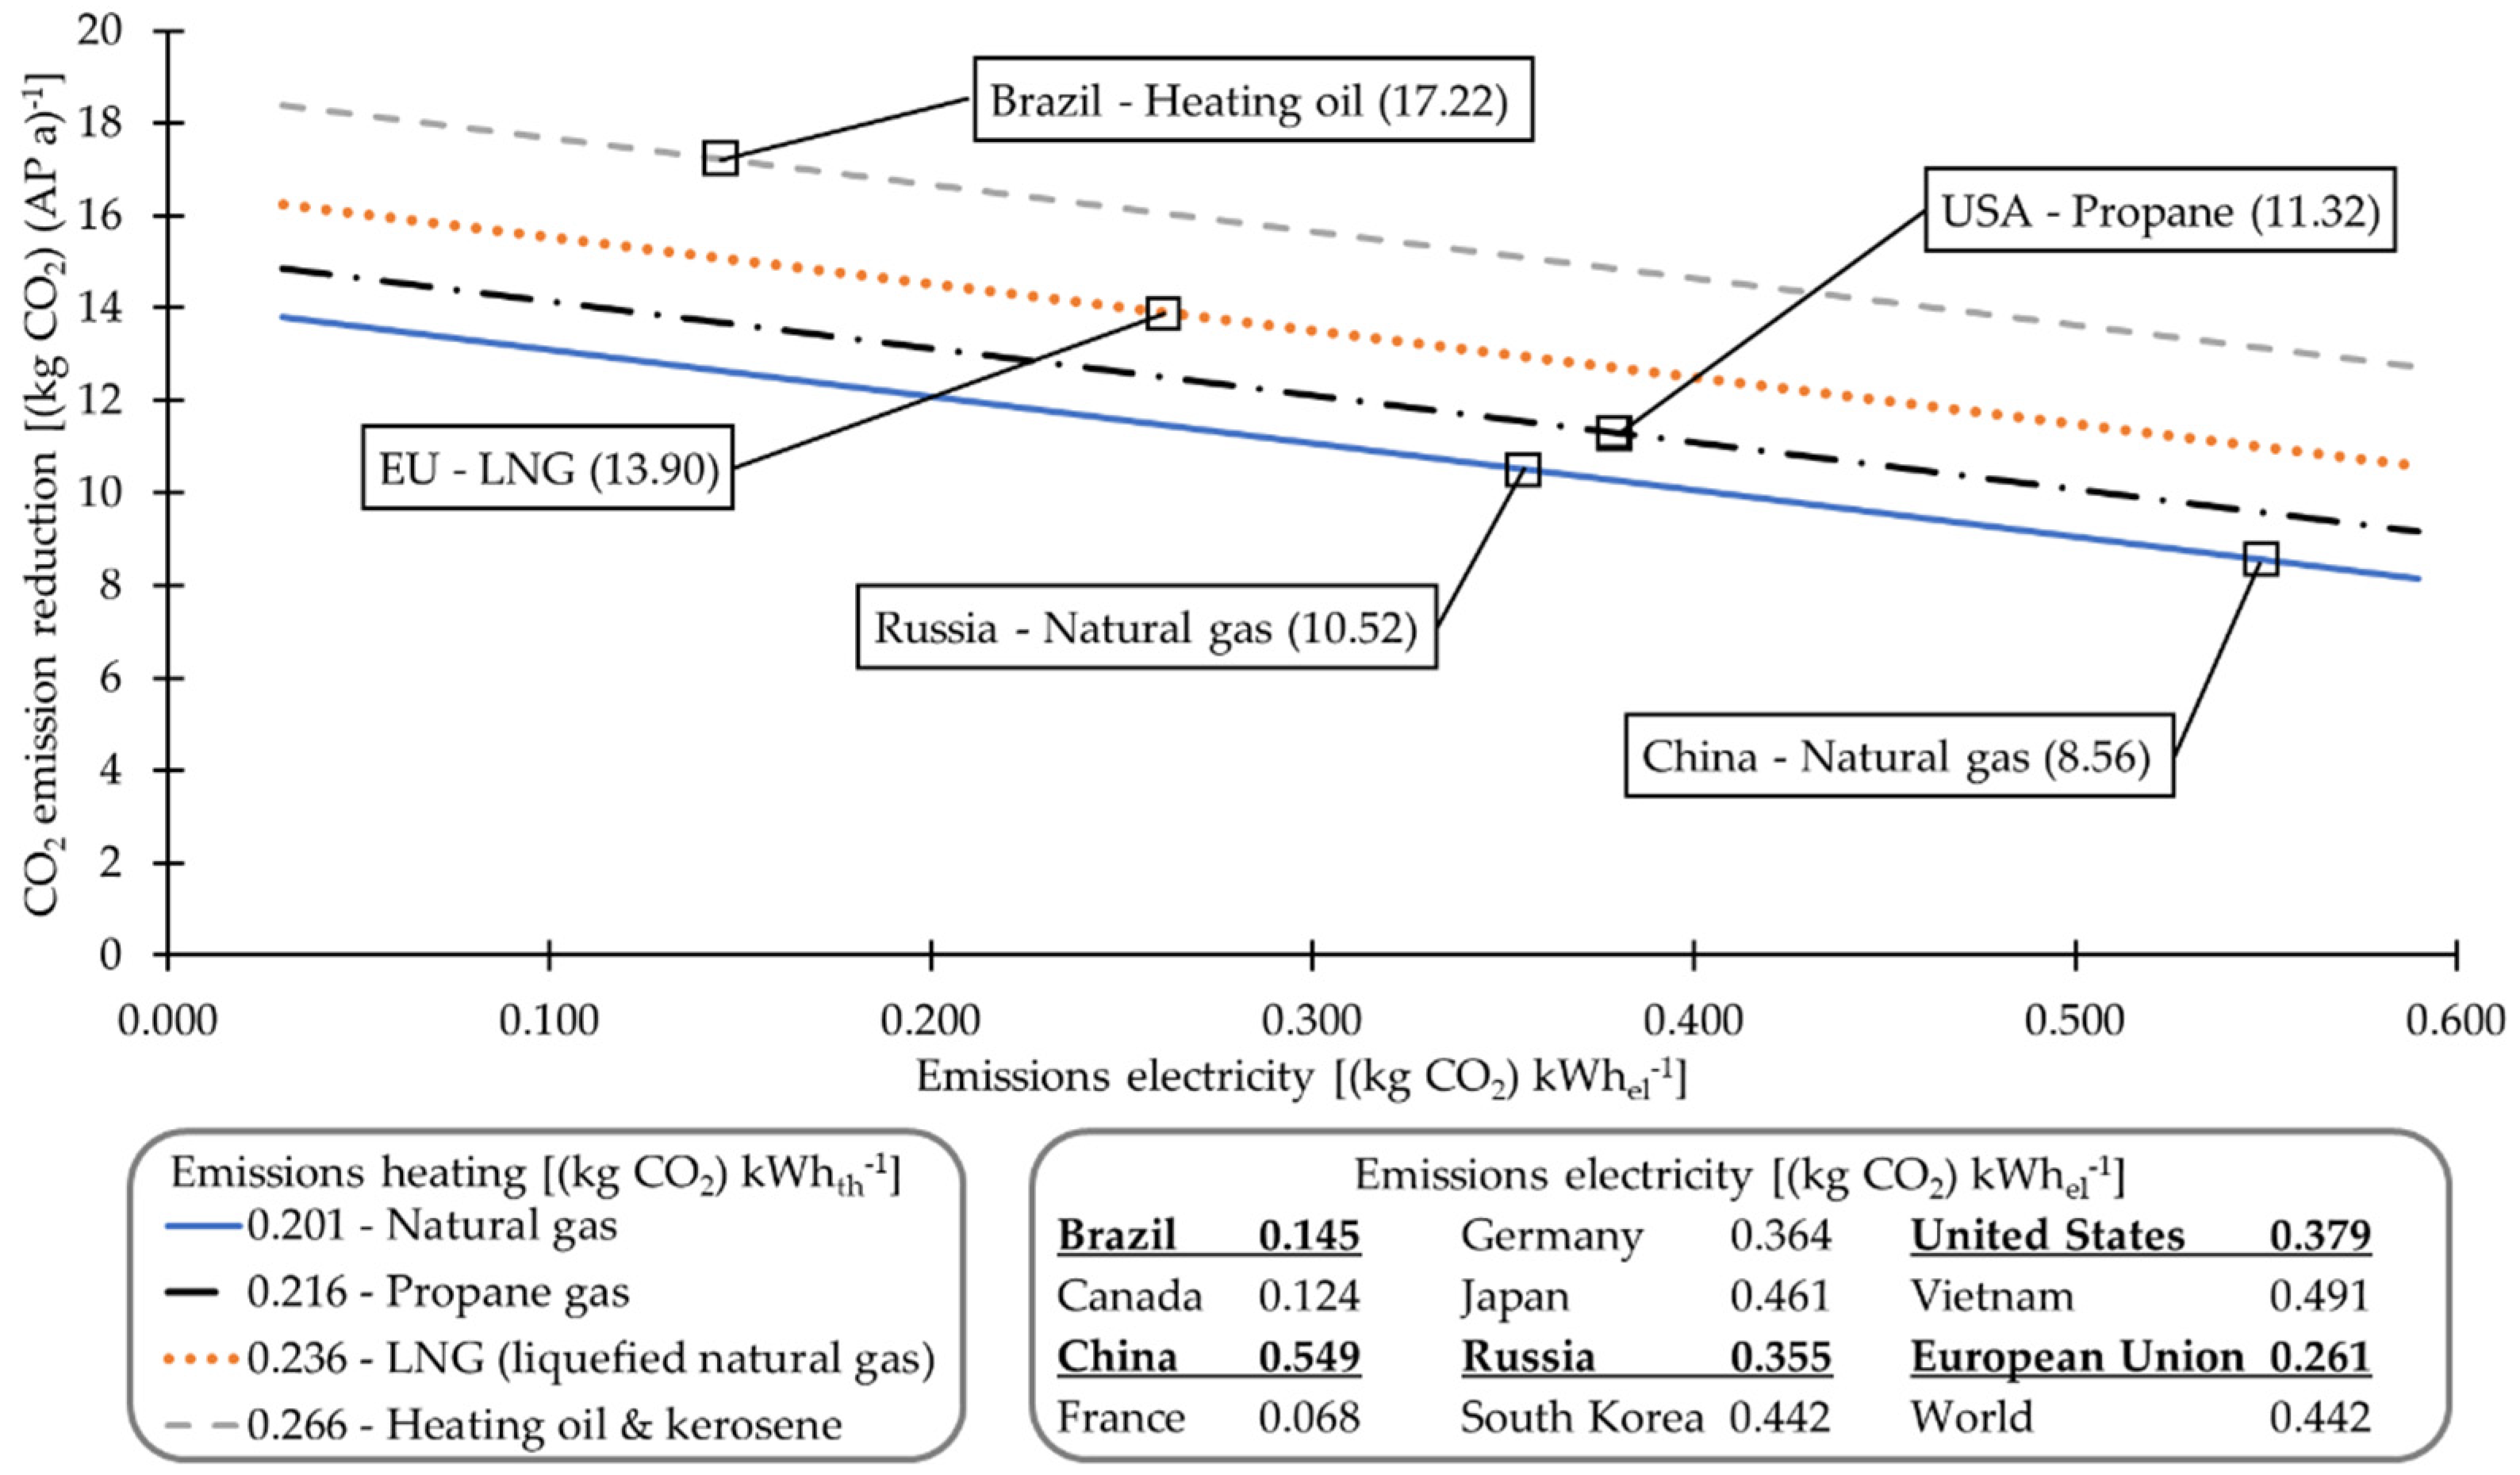
Figure 10 demonstrates the possible reductions in CO
2 emissions in several different application scenarios; depicted are the five scenarios of the world’s largest pork producers [
73]. The magnitude of the reductions strongly depends on the energy supply’s individual emission factors and the PF
HR,heating. Fossil fuels show varying CO
2 emissions during their combustion; of the standard heating fuels, the gases show lower emissions in this regard [
61]. In addition, the CO
2 emissions of the individual country-specific electricity supply vary: Brazil (electricity generation primarily using hydropower) and France (nuclear power plants) show significantly lower emission factors than China (coal-fired power plants), for example [
17]. Consequently, in the extreme situations shown (Brazil—heating oil vs. China—natural gas), CO
2 emission reduction per animal place and year could be around twice as high. Therefore, the potential for CO
2 emission reductions in China, the world’s largest pork producer [
73], is lower than in other countries. Nevertheless, the positive values show noticeable improvements in the carbon footprint of piglet rearing. This could be further improved with a large-scale or farm-specific conversion of power generation to low-emission processes. Furthermore, the comparison between the economic (
Figure 9) and environmental (
Figure 10) benefits shows that, while the calculated PF
HR,heating does not provide financial benefits in some pricing scenarios, it benefits the carbon footprint in all scenarios presented here. However, possible future pricing of CO
2 emissions or corresponding reductions, e.g., taxation, certificate trading, and higher sales revenues, could also further improve the economic situation.
The possibility of combining several energy-efficient technologies should not be disregarded in future animal husbandry. Due to their large roof areas, animal barns especially offer much potential for photovoltaic systems. By supplying self-generated solar energy to their network, farmers could partially cover their own electricity needs, e.g., for the use of heat recovery systems. Some studies have already investigated the advantages of combining different renewable energy technologies and photovoltaic systems in animal barns [
74,
75]. The sustainability of livestock production benefits economically and environmentally due to low CO
2 emissions from on-farm photovoltaic electricity generation [0.048 (kg CO
2) kWh
el−1 [
17]]. Another possibility for independent electricity generation is the use of wind energy [0.011 (kg CO
2) kWh
el−1 [
17]]. Additionally, using energy storage media could increase this benefit.
Exhaust air purification systems are listed as the best available technique and effective for emission mitigation in European Countries [
5,
6,
76,
77,
78], especially in countries with large-scale operations or high farm animal density. Furthermore, these systems are or will become mandatory for some large farms, e.g., [
4]. The additional operating costs can be reduced or compensated by combining them with a heat exchanger. Both systems require or benefit from central supply and exhaust air conduction. Furthermore, heat exchangers have been used to mitigate NH
3 formation in a laying hen barn, using the heated supply air for manure belt drying. Focusing on heat recovery, varying combinations are possible, e.g., a staged and independent sequence of systems as described in this study or integrated combinations as described by Krommweh et al. (2021) [
32,
33]. The high COP
heating values, in this case, COP
VA,heating or the values of [
32,
33], further show an improvement in the energy efficiency for the combination of systems. Should the retrofitting of an exhaust air purification system be necessary, a simultaneous installation of a heat recovery system seems to make sense because of, e.g., simultaneous reconstruction of the flow paths, saving of construction costs, or compensation of the initial and operating costs by the heating cost reduction.
Consequently, there should be significant synergy effects if heat recovery, i.e., CO2 emission mitigation, and exhaust air purification systems, i.e., NH3, particulate matter, and odor emission mitigation, are combined with on-site energy provision systems, i.e., CO2 emission mitigation. Additional studies are necessary to investigate the consequences of this system combination concerning its sustainability.
3.6. Limitations of the Study and Examination of the Methodological Procedure
Heat recovery systems are well-known and studied in many application areas. It is also known that these systems can positively influence energy efficiency and sustainability. This study, therefore, does not provide any new findings in this regard. Instead, this case study is intended to provide further numerical data to complement the small selection of scientific studies in animal barn applications. The main focus here was that the two-year trial—to the authors’ knowledge, the most extended study period to date in this specific field of research—reflects many of the possible operating conditions and provides further planning data for future barn construction. This is especially true for barn buildings under comparable environmental conditions, e.g., in moderate climate zones, but the authors are sure that the given correlations and findings apply to stakeholders in other regions, too.
The trial described here took place in a conventional piglet rearing barn in an ongoing practical operation. However, measurements in practice are limited in their continuity and accuracy compared with test bench measurements. Adjustments in the operation and systems management or fluctuating animal numbers influenced the control and performance parameters of the ventilation and heat recovery systems. In addition, adaptations for measuring were only possible to a limited extent. Measuring fans are frequently used technologies to determine air flow rates, especially in the field of emission measurements of barn buildings [
58,
79,
80]. Another applied technology is the Fan Assessment Numeration System (FANS) for in situ measurements of the actual air flow rates to determine emission mass flow rates [
81,
82,
83,
84]. However, the dimensioning of the heat exchanger’s outer shell and the resulting flow paths were not large or long enough to install these measurement technologies.
Calvet et al. [
58] state that the procedure chosen here, i.e., air flow rate calculation using manufacturer’s protocol, is the most inaccurate of the listed measurement procedures for determining the air flow rates in barn buildings, with a measurement inaccuracy of approx. 20%. Furthermore, fouling on the fans can cause the actual air flow rate to vary considerably from the manufacturer’s protocols [
58,
82,
83,
85]. Previous studies have called for increased focus on uncertainty analysis in studies such as this [
34,
55,
56,
57], which is particularly important for the inaccuracy mentioned above. The uncertainty analysis (
Section S4) indicated a mean value for the uncertainty of the thermal power of
= 9.20 ± 3.34 kW
th or 26.3% ± 32.8%, respectively, and
of 1.93 ± 1.51 or 30.6% ± 48.3%, respectively, for COP
HR,heating. The overall uncertainties for the two-year trial were
and
, respectively. The methodical procedure explains the extreme outliers (see
Section S4).
This issue can be seen as a big concern in this case study. However, the presented study showed essential findings, e.g., physical correlations, in practical barn building applications. This study advanced a similar methodology from [
30] by combining the manufacturer’s protocol information with in situ differential pressure measurements and preliminary tests. With this approach, comparable measurements can be practiced in many barn buildings of varying designs. Consequently, e.g., barn design comparisons are possible with little effort for retrofitting measurement technology and lead to valid findings under consideration of possible inaccuracies or second-order errors [
58]. Furthermore, derived air flow rates align in magnitude with the planning values concerning barn ventilation [
53,
86,
87]. The calculated exhaust air flow rates exceed the planning values of DIN 18910 [
53] by +24.7% (at outside air temperatures of −5.2 to −4.8 °C) or +77.6% (at outside air temperatures of 29.8 to 30.2 °C). Earlier studies report an increase in air flow rates of up to 20% for heat recovery in broiler barn buildings [
22,
27,
30], which agrees with the magnitude of the study presented here. The higher values at high outdoor temperatures are due to the farmer’s specific wishes in planning the barn, e.g., increased heat load removal.
The results presented for comparing the barn building with and without heat exchangers show noticeable savings to increase sustainability (see
Section 3.4). For this, barn management in Case 2 was considered identical to Case 1 (
Section 2.7). The savings described here exceed the empirical data collected in surveys by Bokkers et al. (2010) [
27]. Consequently, it is possible that barn buildings are not identically operated if they are operated with or without heat exchangers, i.e., reduced airflow rates without heat exchangers to reduce heat losses. Therefore, the comparison presented here shows the potential for maximum savings instead of practical savings.
Further research should focus on open research questions considering improvements in energy efficiency and sustainability, changes in animal behavior, and benefits for animal welfare and development for varying animal species in long-term trials.
4. Conclusions
The results of this case study indicate that the investigated heat exchangers achieve high workloads throughout the year (up to 100% in 14 of the total 24 trial months) and acceptable performance in the warmer summer (minimum 45%). An energetic benefit is not limited to the cold season but can be generated throughout the year.
Furthermore, using heat exchangers can improve the sustainability of pig farming, especially piglet production, in all three relevant aspects:
Ecological, e.g., reduction of energy input, mitigation of CO2 emissions
Due to the amount of recovered thermal energy (290,414 kWhth in year one and 317,913 kWhth in year two), the total energy consumption to operate the barn building could be significantly decreased (−46.5% in year 1 and −48.1% in year 2), and costs could be saved. The important PFHR,heating indicated a mean value of 6.9 and 7.8 for the two trial years, a noticeable energy efficiency improvement. At the same time, CO2 emissions could be reduced by up to 37.5% by substituting fossil fuel combustion. The transfer to international application scenarios shows that piglet rearing’s carbon footprint can be improved substantially for all scenarios, i.e., for the five largest pork-producing countries.
Social, e.g., barn air quality, animal welfare, occupational safety
The heat recovery reduced supply air temperature variation and led to a temperature amplitude damping by an average of −34.7%, especially in the transitional seasons. The literature review shows this can lead to higher air flow rates, more even ventilation of the barn building, and a more constant indoor climate. This can be exceptionally favorable regarding indoor air quality (e.g., improved NH3 exhaustion) and, thus, animal health, animal welfare, and occupational safety for the farm staff.
Economic, e.g., reduction of fuel and energy costs
In this study, EUR 2.90 (animal place year)−1 were saved (up to EUR 12,028 per year for the entire barn building). This led to a payback period of the additional installation costs of the heat recovery system of 1.6 years. The transfer to international application scenarios shows that savings depend noticeably on farm-specific electricity and heating costs.
Especially in combination with exhaust air purification systems, the use of heat exchangers seems to be reasonable: ecologically relevant emissions are reduced using exhaust air purification systems, e.g., NH3, particulate matter, odor; in parallel, environmental emissions can be reduced using heat recovery systems, e.g., CO2 emissions. The heat recovery can compensate for increased operating costs due to the exhaust air purification system. Thus, the study can help increase farmers’ willingness to invest in energy-efficient technologies and promote sustainable future pig farming.


