Abstract
High temperature corrosion poses a great threat to boiler water wall safe operation. To investigate the corrosion root cause, a 300 MW level boiler water wall high temperature H2S corrosion case was reported. The typical hydrogen sulfide H2S corrosion feature was large amounts of sulfur which could be found in the cut down sample tube corrosion layer, with a thickness of 482 μm. In addition, huge amounts of lead (Pb) could be found in the corrosion layer, which resulted from the lead sulfide (PbS) deposition when the high temperature flue gas condensed at the water wall tubes. Meanwhile, the sulfur in the corrosion layer was closely related to the H2S concentration in the water wall ambience. The related ambience test showed that the H2S could achieve up to 1000 ppm when the boiler was in operation, far larger than the suggested reference value of 100 ppm. Hence, the overlarge H2S concentration was a vital factor for the tube corrosion. To further investigate the reason why the H2S was kept in such high concentration in the boiler long term operation, and the reasons for the over-high sulfur content in the coal and the over-large diameter of the imaginary circle of primary air (DICPA), two factors were obtained. The peak sulfur content reached 2.5% and the suggested sulfur content was below 1%. The DICPA was so large (1580 mm) that the pulverized coal easily scoured the water wall tubes, which would boost the thinning process of the tubes. To relieve the high temperature corrosion, improve the coal qualities, decrease the DICPA, adjust the operation diameter and adopt a coating technology four measures were suggested.
1. Introduction
China has proposed the “Double Carbon Plan”, i.e., China would reach the CO2 emission peak before the year 2030 and carbon neutrality before the year 2060 []. To this end, the coal-fired power plants have to participate in kurtosis modulation running to release more electrical load for the new energy resources power plants, such as solar energy plants, wind power plants, hydropower stations, and so on []. Hence, large amounts of coal-fired boilers are forced to take as low as possible a load operation. For example, a 20–30% boiler rated load is a common operation condition for a boiler. Not only that, but the boiler, meanwhile, must achieve NOx emissions lower than 50 mg/m3 []. To achieve this goal, the boiler has to conduct low oxygen operations in the main combustion area to reduce the NOx emission, which makes the water wall tube suffer substantial high temperature corrosion. A direct phenomenon can be seen in the water wall tube thickness thinning, increasing the tube burst rate. In China, no matter how large the boiler unit capacity, 300 MW [], 600 MW [] and 1000 MW [] level boilers all have the tendency towards high temperature corrosion.
Due to the complex three-dimensional flow coupled with combustion in the real furnace, many factors can contribute to the high temperature corrosion. The steel material is a key factor. Zhao et al. [] compared the two T23 and T24 steels corrosion rates in simulated furnace atmospheres. Nimmervoll et al. [] tested and acquired five austenitic stainless steels with corrosion resistance ability under HCl and H2S ambience. Bai et al. [] studied the alloy AlFe2.5NiMoNbCr’s high temperature chloride corrosion behavior. These past lab-scale studies supplied plenty of data on the fundamental corrosion rate of multiple boiler steels. However, compared to the furnace practical corrosion rate, some of them may produce a large error when used to guide the boiler operation, because the lab scale simulation corrosion environment is substantially different from that in the real boiler furnace. Hence, directly investigating the eroded tube can produce more practical information. The general methodology is cutting down the tubes [,] where corrosion has severely occurred and analyzing the sample tubes’ outer layer compositions to judge the possible corrosion mechanism. For example, Yu et al. [], Wang et al. [] and Xiong et al. [], respectively, analyzed a 300 MW level boiler water wall tube corrosion mechanism in a section of cut down eroded tube. The same issue they reported was the H2S corrosion type for the existence of sulfur under the scaling layer covering the water wall tube. On the other hand, for the field corrosion study, besides the steel material, reducing the ambience adjacent to the water wall in the boiler operation is also an important factor. Bukowski et al. [] tested the O2 and CO concentrations in a BP-1150 boiler to evaluate the corrosion rate. Hardy et al. [] developed a CFD model to predict the O2 and CO correlations in the vicinity of the front boiler wall. These works in the literature attempted to predict the high temperature corrosion rate by evaluating the H2S or CO concentration. Note that the CO is not the direct corrosive gas, despite it being closely related to H2S content. If the mole ratio of CO/(CO + CO2) increases from 8% to 24%, the concentration of the gas phase H2S will increase from 0.02% to 0.07% []. Hence, directly measuring the H2S concentration is more meaningful for evaluating the corrosion. However, H2S data on the field boiler are rare, especially rare for the H2S and CO synchronous measurement data on the 300 MW level boiler. Only Shirai et al. [] and Tsuji et al. [] reported the H2S concentrations, but this was conducted in a 750 KW level test rig rather than a field boiler. Hence, it is necessary to measure the reducing gas concentration directly on a field boiler when investigating the corrosion mechanism.
Based on this, this paper selected a severely high temperature corrosion 300 MW boiler as the object and investigated the root cause for the corrosion from the characterization analysis of a cut down sample tube. Meanwhile, we also synchronously measured the reducing ambience, including H2S, CO, O2 and H2 adjacent to the water wall, and the H2S and CO, H2S and H2 correlations were proposed, which can be used to guide the boiler operation adjustment. Finally, four measures were proposed to relieve the high temperature corrosion.
2. Experimental Description
2.1. Boiler Basic Design Parameter
The boiler was manufactured by the Shanghai Boiler Factory, SG1025/18.3-M833. The original design capacity was 300 MW. Then, it was reconstructed to 330 MW afterward. It is a subcritical, single drum, intermediate reheating, controlled circulation, dry ash extraction and Π shape pulverized coal boiler. The furnace width is 11.97 m, the depth is 11.76 m, the width to depth ratio is 1.02:1, the elevation of the furnace top heat surface tube is 58.4 m, and the elevation of the boiler drum centerline is 59.32 m. The water wall material is 20G (Chinese standard, GB/5310), and the ribbed tube Φ45 * 6 mm. Alongside the element iron, the major composition elements are C, Si, Mn, P and S for the material 20G. The specific values can be seen in Table 1.

Table 1.
The element composition of 20G.
The daily fuel is lean coal, with a volatile (dry ash free basis, daf for abbreviation, similarly hereinafter) around 16% and an average total sulfur 1.76% (as received basis). The air dry basis ash (Aad) is 32.38% and the dry basis fixed carbon (Cd) is 55.91%. The as received basis lower calorific value (Qnet,ar) is 20.74 MJ/kg. The typical coal quality can be seen in Table 2.
Table 2.
The typical coal quality during the boiler operation.
2.2. Corrosion Status
During the boiler maintenance period, after the boiler operation was stopped, the larger water wall areas were found to be severely corroded among the four walls. The thinnest tube thickness is only 3 mm, with a 50% thickness reduction rate. Generally, the water wall tube is required to be replaced by the new tube when the thickness reduction rate exceeds 30%. Hence, large areas of the water wall tubes were cut down and renewed, as Figure 1a–c shows. As for the corrosion details, large corrosion products covered the tubes, presenting a multilayer and colorful structure, as seen in Figure 1d,e. Part of the iron substrate was corroded and fell from the tube.
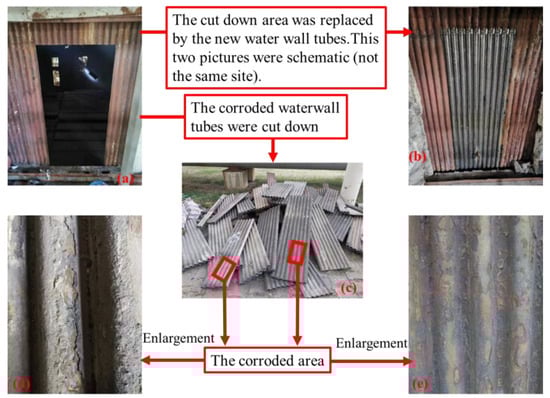
Figure 1.
The water wall inspection during the boiler maintenance period. (a) The cut down area in water wall; (b) The repaired area in water wall; (c) The cut down corrosion water wall tubes (d) The enlargement of the corrosion tubes, I; (e) The enlargement of corrosion tubes, II.
After careful observation of the inside furnace, when the boiler was stopped for maintenance, the corrosion morphology can be sorted into three types, as in the shadow area shown in Figure 2. The primary air jetted from the burners at four furnace corners formed an anticlockwise tangential flow in the furnace. For each wall (front, rear, left and right wall), near the corner adjacent to the upstream burner, the tubes are normal and uncorroded. Along with the downstream of the primary air flow, corrosion occurred on the right side of the tubes, namely type 1. As the primary air flow moved on, followed by the type 1 corrosion area, the corrosion occurred at the middle area of tubes, namely type 2. Then, continuing moving, the corrosion area occurred at both the left and right sides of the tubes, namely type 3. The corrosion location in each tube from type 1 transition to type 3 implied the change of fluid state outside the water wall tubes. Along with the direction from the upstream flow to downstream flow, the fluid state had changed from laminar to turbulent. This can explain how corrosion occurred in both two sides of the tubes (type 3).
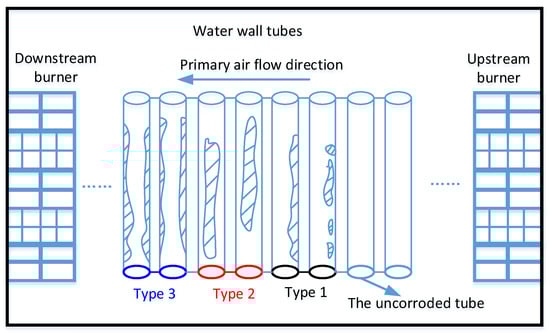
Figure 2.
Schematic diagram of three types of corrosion morphology.
2.3. The Water Wall Tubes’ Ambience Gas Sampling Methods Description
The traditional water wall tubes ambience gas sampling method is to weld an 8 mm steel tube to the membrane between the two water wall tubes, as shown in Figure 3a. The issue for this gas sampling method is that the 8 mm sampling tube no longer works once the tube is blocked by the slag. To ensure the H2S can be continually measured, a new gas sampling vent method was developed, i.e., two water wall tubes were retrofitted to ensure that the flue gas sampling tube diameter is large enough to prevent the slag blocking the sample tube, or the sample tube can be reopened by cleaning the slag. Hence, a 70 mm large diameter sampling tube was mounted on the water wall with a flange connected at the end outside, as shown in Figure 3b. The reducing ambience test diagram can be seen in Figure 3c. The CO, H2, CO2 and O2 were detected by coal gas analyzer (Gasboard 3100p), while the H2S was measured by Sulfur sentry analyzer, Event Eng corporation.
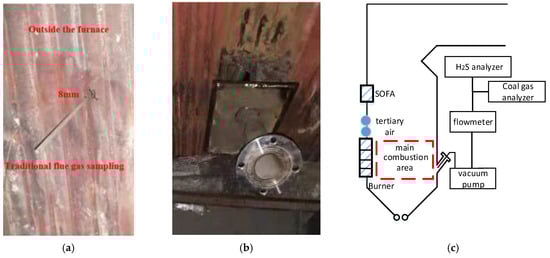
Figure 3.
The sampling tubes description and reducing ambience measurement diagram. (a) The traditional sampling tube; (b) New sampling tube in this test; (c) Reducing ambience measurement diagram.
2.4. Corroded Tube Sampling and Characterization
The boiler water wall tubes had only partly adopted coating technology due to the cost factor. To analyze the possible corrosion products, two sample tubes were cut down. One was processed with coating technology and the other was not. We cut the sample tubes into small pieces, used the epoxy resin to encapsulate these small pieces and conducted the line scan test. The micromorphology of sampling tubes was characterized by means of a JSM 7000F field emission scanning electron microscope (SEM) and the element distribution was analyzed, combining the energy dispersive X-ray spectrometer (EDS).
3. Experimental Results
3.1. Water Wall Tube Corrosion Category Evaluation: H2S Corrosion
Generally, boiler high temperature corrosion caused by sulfur can be divided into two categories of H2S corrosion and sulfate corrosion []. To further ensure the specific corrosion category, the sampling tubes element line scan test was conducted. Figure 4 displayed the element distribution of the ‘no coating’ processed tube. It was seen that adjacent to the Fe substrate was the corrosion layer, with a thickness of 482 μm. An apparent characteristic is the gradual decrease in iron content and the gradual increase of sulfur along the horizontal axis distance, as shown in Figure 4a. The existence of sulfur is a typical feature of H2S corrosion. Meanwhile, the element lead (Pb) is also largely found in the corrosion layer. Along the horizontal axis direction, the larger the distance, the more the lead (Pb) content, as shown in Figure 4b. The lead (Pb) layer resulted from the PbS deposition during the coal combustion process [].
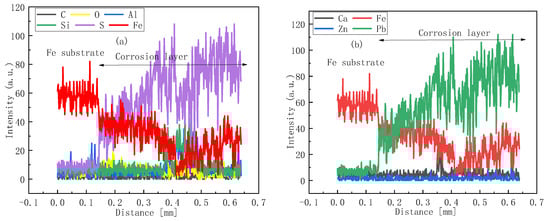
Figure 4.
The line scan results of the no coating processed tube. (a) Part I, element C, O, Al, Si, S and Fe; (b) Part II, element Ca, Fe, Zn and Pb.
Figure 5 displayed the sample tube with the coating technology processed. Differently from Figure 4, the Cr and Ni were largely found while element Pb was not found. The elements Cr and Ni were mainly from coating material elements. The coating thickness was 260 μm. Meanwhile, the amount of sulfur was largely found in the coating layer but was rare in the substrate, showing that the existence of coating effectively prevents the sulfur from permeating into the substrate. With the aid of the coating layer, the sulfur-containing layer thickness was much reduced compared to that with no coating layer.
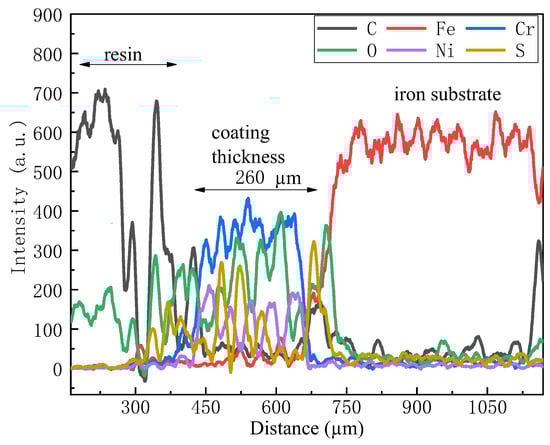
Figure 5.
The line scan results of the coating processed tube (the data were smoothed by the Savitzky–Golay method, 50 points).
Figure 6a displayed the SEM morphology of the coating processed tube. There were many round balls with a diameter around 25 μm, as label 1 shows. The EDS results in Figure 6b showed that these round balls’ element compositions were Ti, V, Al, etc., and their metallic oxides. Label 2 elements were mainly Fe and O, which were the results of iron substrate oxidation. The major label 3 element was carbon, which was from the unburnt fly ash.
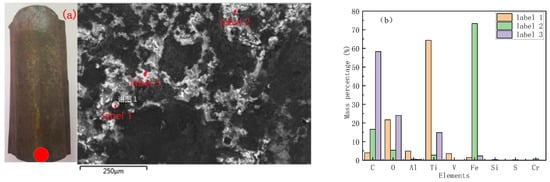
Figure 6.
The SEM morphology and EDS analysis of the coating processed tube. (a) Morphology of the cut down tube; (b)The EDS test results.
From the above characteristics analysis, it can be certified that the water wall tubes corrosion was caused by H2S produced by the coal lean oxygen combustion. To further explore the corrosion rate, it is necessary to evaluate the H2S source and concentration value.
3.2. The Source of H2S and the Water Wall H2S Concentration
The formation of H2S in the boiler was attributed to the coal combustion in an oxygen deficit ambience. Hence, the sulfur content in coal was, naturally, closely related with the H2S concentration. Figure 7 listed the coal sulfur trend in recent two years. It can be seen that the sulfur was obviously larger in the first three quarters of the year 2021 compared to the same period of 2020. The average sulfur amount was 1.8% in the first three quarters of the year 2021, and the peak sulfur value reached 2.5%, which was the typical high sulfur coal. The sulfur started to decline until October. Even so, the average sulfur was still as high as 1.1%. It was suggested to control the sulfur in coal to below 1% by coal blending technology if possible []. The high sulfur coal was detrimental to the control of H2S concentration.
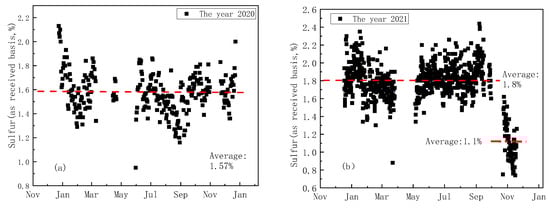
Figure 7.
The coal sulfur comparison between the years 2020 and 2021 (The boiler was stopped for maintenance in April, no sulfur data). (a) The year 2020; (b) The year 2021.
To further evaluate the reducing ambience near the water wall tubes, the H2S, CO, H2 and O2 were synchronously tested after the boiler restarted operations when the maintenance was over. Figure 8a presented the test results in the boiler main combustion area. It can be seen that the H2S and CO kept a gradual increase trend. The two parameters kept a good synchronism characteristic, i.e., increasing or decreasing concurrently. The peak value of CO reached 12%, while that of H2S reached 1000 ppm.
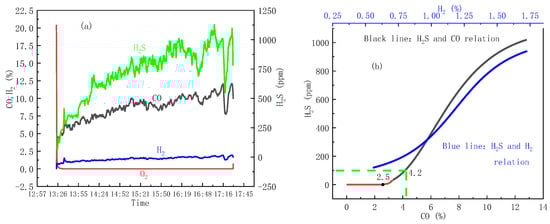
Figure 8.
The ambience near the water wall tube test in rear wall. (a) Flue gas species: H2S, CO, H2 and O2; (b) The H2S and CO, H2S and H2 fitting correlation curves based on (a).
H2 presented the same tendency with CO. The H2 mainly came from the bond break between the organic carbon hydrogen functional groups. Under the ultra-low NOx operation mode, the main combustion area had severely insufficient oxygen. Hence, this area was substantially viewed as a gasification process. Due to the high temperature (1400 °C) in this area, the hydrocarbon molecules are few. The major reducing ambience gases were CO and H2. The increase of H2 was conducive to the formation of H2S. The reactions were as follows [,]:
H2 + COS ⇔ H2S + CO
3H2 + SO2 ⇔ H2S + 2H2O
The source of CO had two paths. One was from the coal internal oxygen, such as an ether bond. The other was from the char reacting with the external oxygen.
2C + O2 ⇔ 2CO
The presence of CO also benefitted the formation of H2S by the reaction:
3CO + SO2 + H2O ⇔ H2S + 3CO2
The H2S and CO curves were fitted, respectively, and the mutual relation can be obtained as the Figure 8b black line shown. Similarly, the H2S and H2 relationship can be obtained (the blue line). Fitting formulas were proposed as below, with the Adj.R-Square values of both correlations larger than 0.99.
where [H2] and [CO] represent concentration, the CO unit was %, and the H2S unit was ppm.It was required that 0.5% < H2 < 1.75% for formular (5) and 2.5% < CO < 13% for formular (6).
3.3. The Diameter of Imaginary Circle of Primary Air (DICPA) Analysis
For the tangential combustion boiler, the DICPA is a vital parameter for the boiler design. In general, the DICPA is from 600 to 1000 mm, depending on the coal category. A recommended formular is below []:
where d is the DICPA, mm; k is an empirical coefficient, ranging from 0.05 to 0.12; a, b is the length and width of the furnace, respectively, in mm.
According to this formula, even taking the upper limit value of k, the largest DICPA should be 1424 mm. That means the DICPA parameter is required to be no more than 1424 mm when designing the boiler. However, in practice, the DICPA is as large as 1580 mm. When the boiler was in operation, the real tangential circle diameter was 5 to 10 times the DICPA []. Hence, the primary air flows at four corners of the boiler are apt to deflect to the downstream direction with the action of upstream current. Then, the primary air would erode the tubes in the downstream area of water walls, as shown in Figure 9. The shadow area represents the severely eroded water wall tube area due to the primary air deflection. Hence, the DICPA is too large for this boiler and results in the primary air flow eroding the water wall.
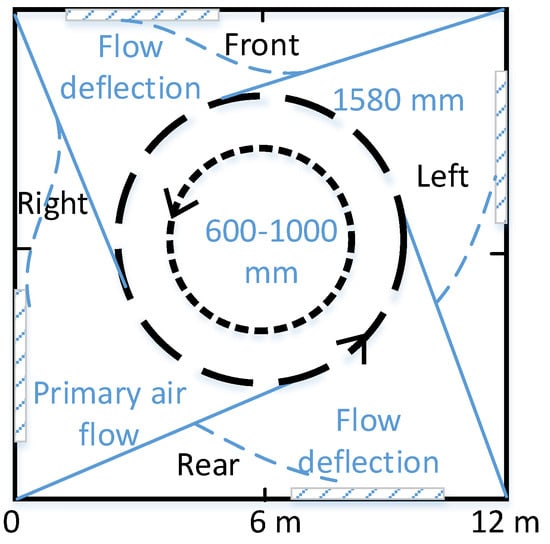
Figure 9.
The diameter of imaginary circle of primary air schematic diagram.
The slag adhering to the water wall tubes was a strong evidence for the overlarge DICPA. Figure 10 displayed the slag on the rear water wall during the boiler maintenance period. It can be seen that nearly the whole rear water wall was covered by the slag. The two red line areas were the traces of slag falling from the rear wall when the furnace temperature decreased during the boiler stop period. The length of one falling slag section was around 3 m. When the hot pulverized coal encountered the relatively cold water wall, the sticky coal particles in the primary air flow were condensed and adhered to the water wall. If the DICPA was smaller, the coal particles would have fewer possibilities to erode the water wall.
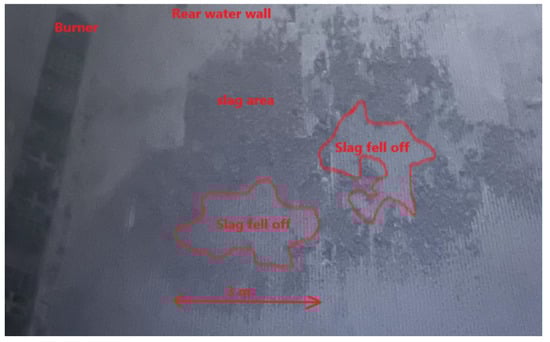
Figure 10.
The slag on the rear water wall.
3.4. Water Wall High Temperature Corrosion Root Cause Analysis
According to the above discussion, the high temperature corrosion root cause included the overly high sulfur content in coal and overlarge DICPA two factors. The over-high sulfur coal incurred high H2S concentration near the water wall tubes when the boiler was in low NOx operation mode. The corrosion rate was exponential to the H2S concentration []. The higher the H2S concentration, the faster the tube corrosion rate. In addition, the overlarge DICPA resulted in the pulverized coal eroding the water wall tubes in the downstream area. The fusion coal ash would be slagged on the water wall and further increased the tube surface temperature, which boosted the corrosion to a deepen extent. As for the specific H2S corrosion mechanism, it can be seen in Figure 11. Specifically, the active sulfur atom came from the pyrite in coal. When heating, the pyrite releases sulfur atoms. Further, the sulfur atoms reacted with hydrogen to form H2S. The active sulfur atoms and hydrogen sulfide were two strong corrosive media, which could directly reacted with the substrate iron and the iron oxide layer. In normal conditions, the iron oxidation was a protective layer. According to the metal high temperature oxidation theory [], a temperature of 570 °C was a critical point. Above this value, the oxide layer was consisted of FeO, Fe3O4 and Fe2O3 with a layered structure. Under this value, the oxide layer was only consisted of Fe3O4 and Fe2O3. Considering that the boiler main stream was subcritical, the water wall temperature must be lower than 570 °C. Hence, the oxide layer was composed of Fe3O4 and Fe2O3. When the oxide layer was converted into ferrous sulfide, the expansibility differs hugely between the iron oxide and ferrous sulfide layer. When the boiler undergone rapid increase or decrease in load, the water wall temperature varied considerably. With the aid of the thermal stress action, the ferrous sulfide layer had the tendency to fall from the substrate. Furthermore, the high temperature coal particles kept on scouring and deposited on the water wall. When the particles’ weight accumulated to some extent, the corrosion layer, along with the coal particles, fell from the iron substrate. Then, the fresh iron substrate was exposed to the high temperature flue gas and the corrosion circle was restarted. The tubes were thinned after long period operation.
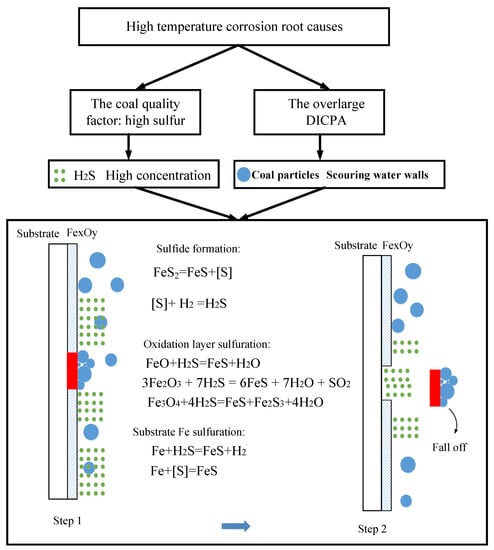
Figure 11.
Water wall H2S corrosion mechanism schematic.
3.5. Practical Significance: High Temperature Corrosion Prevention
As for the lean coal-fired boiler, the water wall high temperature corrosion phenomenon is more severe than that in a bituminous coal-fired boiler. Hence, measures must be taken to relieve the corrosion rate. The most important thing is to reduce the sulfur content in coal. However, this is not feasible for the power plants due to the cost. The larger sulfur content in the coal usually corresponds to a cheaper price. Hence, not all plants can afford the low sulfur coal. In addition, the easiest thing for the field operator to do is adjusting the operation parameters, such as primary air velocity, secondary air velocity, coal fineness, air temperature, etc., to supply more air to the main combustion area to weaken the reducing ambience concentration. However, this would cause the NOx increase to some extent. Hence, the key for operation adjustment is to keep a balance between the NOx control and the corrosion rate control. According to the results in Figure 6b, if the CO concentration can be controlled under 2.5%, the high temperature corrosion would largely be relieved. However, considering the ultra-low NOx requirement, in some of the boilers, especially lean-coal fired and anthracite fired boilers, CO lower than 2.5% is hard to achieve. If adopting the H2S 100 ppm as a criterion [], the CO concentration should be controlled under 4.2%. Likewise, H2 is also in a category of reducing ambience gas. From the perspective of controlling H2, the H2 adjacent to the water wall should be controlled at under 2%. In this way, the water wall tubes’ replacement frequency would be reduced. In addition, decreasing the DICPA is also effective path to relieve the high temperature corrosion. However, the tangential circle diameter reconstruction is a huge project. It requires a plentiful maintenance period, which is also not an easy thing for the power plants. Finally, the coating technology is also an effective tube protective measure. The aforementioned discussion illustrates the existence of a coating layer prolongs the water wall tubes’ operation period. However, a factor to limit the large area coating is also the cost. To sum up, the feasible and economical measure is to adjust the operation parameter. Hence, it is necessary to install an online ambience system to monitor the H2S, CO, H2, etc., reducing the gases adjacent to the water wall.
4. Conclusions
A typical 300 MW level boiler water wall high temperature corrosion root cause was investigated and the reducing ambience was synchronously measured. The main conclusion was summarized as follows:
(1) The corrosion was typical H2S corrosion. Large amounts of sulfur and lead (Pb) could be found in the corrosion layer, with a thickness of 482 μm. The lead was from the sulfide PbS deposition when the high temperature flue gas condensed at the water wall tubes.
(2) The over-high sulfur content in the coal and the over-large diameter of imaginary circle of primary air (DICPA) were two root causes for the water wall high temperature corrosion. To relieve the high temperature corrosion, four measures were suggested: improve the coal qualities, decrease the DICPA, adjust the operation diameter and adopt coating technology.
(3) Reducing H2 and CO gases presents an exponential relationship with H2S. For the operation adjustment, H2 and H2S, CO and H2S correlation, two fitting formulas were listed:
where [H2], [CO] represents concentration, the CO unit is %, and the H2S unit is ppm.
(4) It is strongly suggested to install the H2S online measuring device on the water wall tubes. Then, future research should focus on the correlation between the water wall tube corrosion rate and the online H2S concentration. The boiler operator can adjust the operating parameters to optimize the furnace combustion based on the online corrosion rate or the online H2S concentration.
Author Contributions
Conceptualization, X.X; data curation, F.C. and L.L.; writing—original draft preparation, X.X.; supervision, H.T.; funding acquisition, X.X. All authors have read and agreed to the published version of the manuscript.
Funding
This research was supported by the National Natural Science Foundation of China (Grant No. 22008192).
Data Availability Statement
Data sharing not applicable.
Acknowledgments
Thanks to the Zhaoxiang Xie’s field support when we did the research work in the power plant.
Conflicts of Interest
The authors declare no conflict of interest.
References
- Wei, Y.M.; Chen, K.; Kang, J.N.; Chen, W.; Wang, X.Y.; Zhang, X. Policy and management of carbon peaking and carbon neutrality: A literature review. Engineering 2022, 14, 52–63. [Google Scholar] [CrossRef]
- Wei, H.; Lu, Y.; Yang, Y.; Zhang, C.; He, C.; Wu, Y.; Li, W.; Zhao, D. Research on influence of steam extraction parameters and operation load on operational flexibility of coal-fired power plant. Appl. Therm. Eng. 2021, 195, 117226. [Google Scholar] [CrossRef]
- Action Plan for Energy Conservation and Emission Reduction Upgrading and Transformation of Coal Fired Plants 2014–2020. National Development and Reform Commission, Ministry of Ecological Environment, National Energy Administration, China. EB/OL. Available online: http://www.gov.cn/gongbao/content/2015/content_2818468.htm (accessed on 30 December 2022).
- Sun, X.; Ning, Y.; Yang, J.; Zhao, Y.; Yang, Z.; Zhou, X. Study on high temperature corrosion mechanism of water wall tubes of 350 MW supercritical unit. Eng. Fail. Anal. 2021, 121, 105131. [Google Scholar] [CrossRef]
- Xu, L.; Huang, Y.; Zou, L.; Yue, J.; Wang, J.; Liu, C.; Liu, L.; Dong, L. Experimental research of mitigation strategy for high-temperature corrosion of waterwall fireside in a 630MWe tangentially fired utility boiler based on combustion adjustments. Fuel Process. Technol. 2019, 188, 1–15. [Google Scholar] [CrossRef]
- Cao, L.; Peng, R.; Deng, Z. Optimization study on high-temperature corrosion prevention of the water wall of a 1000 MW dual circle tangential boiler during operation. Energy Rep. 2021, 7, 915–925. [Google Scholar] [CrossRef]
- Zhao, Q.X.; Zhang, Z.X.; Cheng, D.N.; Wang, Y.; Deng, X. High temperature corrosion of water wall materials T23 and T24 in simulated furnace atmospheres. Chin. J. Chem. Eng. 2012, 20, 814–822. [Google Scholar] [CrossRef]
- Nimmervoll, M.; Mori, G.; Hönig, S.; Haubner, R. High-temperature corrosion of austenitic alloys in HCl and H2S containing atmospheres under reducing conditions. Corrosion 2022, 200, 110214. [Google Scholar] [CrossRef]
- Bai, L.; Peng, W.; Zhu, J.; Wu, X.; Shi, X.; Xiang, J.; Deng, X.; Wang, Y.; Sun, Z.; Yu, S. High temperature chloride corrosion behavior of AlFe2.5NiMoNbCr high-entropy alloy. Corros. Sci. 2022, 198, 110139. [Google Scholar] [CrossRef]
- Wei, C.; Wang, Z.; Chen, J. Sulfuration corrosion failure analysis of Inconel 600 alloy heater sleeve in high-temperature flue gas. Eng. Fail. Anal. 2022, 135, 106111. [Google Scholar] [CrossRef]
- Paz, M.D.; Phother-Simon, J.; Andersson, S.; Jonsson, T. High temperature corrosion memory in a waste fired boiler—Influence of sulfur. Waste Manag. 2021, 130, 30–37. [Google Scholar] [CrossRef]
- Yu, X.; Gong, B.; Gao, Q.; Zhao, Y.; Tian, C.; Zhang, J. Investigation of fireside corrosion at water-cooled wall from a coal-fired power plant in China. Appl. Therm. Eng. 2017, 127, 1164–1171. [Google Scholar] [CrossRef]
- Wang, Y.; Wang, X.; Wang, M.; Tan, H. Formation of Sulfide Deposits and High-Temperature Corrosion Behavior at Fireside in a Coal-Fired Boiler. Energy Fuels 2020, 34, 13849–13861. [Google Scholar] [CrossRef]
- Xiong, X.; Liu, X.; Tan, H.; Deng, S. Investigation on high temperature corrosion of water-cooled wall tubes at a 300 MW boiler. J. Energy Inst. 2020, 93, 377–386. [Google Scholar] [CrossRef]
- Bukowski, P.; Hardy, T.; Kordylewski, W. Evaluation of corrosion hazard in PF boilers applying the oxygen content in flue gases. Arch. Combust. 2009, 29, 11–18. [Google Scholar]
- Hardy, T.; Modlinski, N. Development of Prognostic Tool for High-temperature Corrosion Risk Assessment in Pulverised Coal Boilers Based on the Waterwalls Boundary Layer Monitoring System and CFD Simulations. Energy Procedia 2017, 105, 1833–1838. [Google Scholar] [CrossRef]
- Shirai, H.; Ikeda, M.; Aramaki, H. Characteristics of hydrogen sulfide formation in pulverized coal combustion. Fuel 2013, 114, 114–119. [Google Scholar] [CrossRef]
- Tsuji, H.; Tanno, K.; Nakajima, A.; Yamamoto, A.; Shirai, H. Hydrogen sulfide formation characteristics of pulverized coal combustion -Evaluation of blended combustion of two bituminous coals. Fuel 2015, 158, 523–529. [Google Scholar] [CrossRef]
- Che, D. Boilers: Theory, Design and Operation; Xi’an Jiaotong University Press: Xi’an, China, 2008. [Google Scholar]
- Ma, H.; Zhou, L.; Ma, S.; Bai, Y. Progress in mechanism of H2S formation during pulverized coal combustion. Therm. Power Gener. 2019, 48, 5. [Google Scholar]
- Lv, S.; Wang, B.; Zhao, J.; Ma, H. A Study on detailed mechanism of H2S formation during pulverized coal combustion. Acad. J. Xi’an Jiaotong Univ. 2020, 54, 68–75. [Google Scholar]
- Xu, T. Boiler Combustion Equipment; Xi’an Jiaotong University Press: Xi’an, China, 1990. [Google Scholar]
- Xu, W.; Tan, H.; Liu, Y.; Wei, B.; Hui, S. Research on determination of high temperature corrosion tendency of water walls and limiting concentration range of H2S near walls. Electr. Power 2018, 51, 113–119. [Google Scholar]
- Barrau, O.; Boher, C.; Vergne, C.; Rezai-Aria, F.; Gras, R. Investigations of friction and wear mechanisms of hot forging tool steels. Karlstad Univ. 2002, 1, 81–94. [Google Scholar]
- Ma, H.; Zhou, L.; Ma, S.; Yang, S.; Zhao, Y.; Zhang, W.; Chew, J.W. Impact of multi-hole-wall air coupling with air-staged technology on H2S evolution during pulverized coal combustion. Fuel Process. Technol. 2018, 179, 277–284. [Google Scholar] [CrossRef]
Disclaimer/Publisher’s Note: The statements, opinions and data contained in all publications are solely those of the individual author(s) and contributor(s) and not of MDPI and/or the editor(s). MDPI and/or the editor(s) disclaim responsibility for any injury to people or property resulting from any ideas, methods, instructions or products referred to in the content. |
© 2023 by the authors. Licensee MDPI, Basel, Switzerland. This article is an open access article distributed under the terms and conditions of the Creative Commons Attribution (CC BY) license (https://creativecommons.org/licenses/by/4.0/).