Article

Finite Element Modeling and Simulation of a Submerged Wave Energy Converter System for Application to Oceanic Islands in Tropical Atlantic

by
Nadège Bouchonneau
1,*,
Arnaud Coutrey
2,
Vivianne Marie Bruère
1,
Moacyr Araújo
3,4 and
Alex Costa da Silva
3
1
Mechanical Engineering Department, Universidade Federal de Pernambuco, Recife 50740-550, PE, Brazil
2
ENSTA Bretagne, 29200 Brest, France
3
Oceanography Department, Universidade Federal de Pernambuco, Recife 50740-550, PE, Brazil
4
Brazilian Research Network on Global Climate Change—Rede CLIMA, São José dos Campos 12227-010, SP, Brazil
*
Author to whom correspondence should be addressed.
Energies 2023, 16(4), 1711; https://doi.org/10.3390/en16041711
Submission received: 22 November 2022 / Revised: 25 January 2023 / Accepted: 26 January 2023 / Published: 8 February 2023
(This article belongs to the Special Issue Challenges of Renewable Energy in Developing Countries)

Abstract

:
The development of efficient and sustainable marine energy converter systems is a great challenge, especially in remote areas such as oceanic islands. This work proposes a numerical modeling methodology to assess the mechanical behavior of a wave energy converter (WEC) to be applied outside Fernando de Noronha Island (Pernambuco, Brazil). First, oceanographic data collected in situ were analyzed to determine different sea state scenarios in the region. The Airy theory and second-order Stokes’ theory were used to obtain the velocity profiles for the maximum and operational swells. These profiles were then implemented in a flow model developed in COMSOL Multiphysics software (Burlington, MA, USA) to calculate the wave distributions of pressure on the WEC structure. Finally, wave pressure distributions obtained from simulations were implemented in a static analysis of the system by the finite element method using SolidWorks (France). The results highlighted the most critical system inclination and the parts of the WEC structure more likely to be damaged under extreme swell conditions. The 0° inclination was the most critical situation, leading to the exceeding of the elastic limits of some parts of the WEC structure. The methodology developed in this work showed to be efficient to study and propose project improvement for the strength of the WEC system.

1. Introduction

With the decrease in resources, the increase in pollution, the acceleration of global warming and the constant energy demands, it becomes even more important to develop systems that produce clean energy [1,2]. One solution to this reduction of energy resources is indeed the recovery of renewable energies that are continuously provided by nature. They are the result of solar radiation, the heat of the Earth’s core or the gravitational interactions of the Sun and the Moon with the oceans. These almost infinite resources are, however, unstable and uncertain, also requiring a lot of work to master and benefit from them. It is essential to aim for the reasonable and effective exploration of each of these resources and to avoid their overconsumption. For that, the diversification of solutions is necessary and will enable the simultaneous response to economic and environmental issues related to the production of energy.
The use of sustainable renewable energy has been increasing in recent years, which is reflected in a projection of its prevalence in the global energy market between 2035 and 2050 [3,4]. Among them, the ocean is an endless renewable energy source for producing electricity used on the planet. Ocean resources have still been little explored; however, they can provide about 10% of the global energy production. Ocean energy is expected to make a large contribution with a total installed capacity ranging from 1 GW in 2013 to 178 GW by 2050 [5]. From a general point of view, the theory of assessment of the ocean energy power can reach 100,000 TWh/year (while the world electricity consumption is of 16,000 TWh/year) [6].
One of the resources that allows the greatest diversification of solutions is marine energy, more particularly the energy of sea waves. Estimates of the theoretically usable wave energy capacity on a worldwide scale are widely recorded to be between 2000 and 4000 TWh/year [7], and according to Qiao et al. [8], there are currently more than 1000 WEC prototypes spread around the world [9,10].
In Europe, basic research initiated in the 1980s is now the foundation for highly tangible projects. Europe’s Atlantic coasts have great potential, and energy recovery systems projects are multiplying. An early assessment of this was performed by Isaacs and Seymour [11] in the early 1970s, who estimated the global wave power potential to be in the order of 1–10 TW, which was the same order of magnitude of the world consumption of electrical energy then. More recently, the worldwide potential of wave power resources was estimated to be around 2 TW [12], of which 4.6% was predicted to be extractable by deploying a specific wave energy converter (WEC) [13]. Roughly ten different technology types are being pursued, including oscillating water column, oscillating bodies and overtopping devices [14].
Although the worldwide potential of wave power is around 29,500 TWh/yr [15], only a small fraction is currently efficiently extracted near ocean coastlines, islands or semi-enclosed basins. Such sites are defined as local “hotspots” [16,17], revealing the best balance between wave energy power and other relevant factors, such as distance from shore, water depth and investment costs. At present, there are multiple concepts and patents on the use of wave energy, as presented in [18,19,20,21]. More recently, several onshore and offshore projects have been developed, including the Islay plant (Scotland), the Pico Island plant (Portugal), the inertial sea wave energy converter (ISWEC) in Pantelleria, the WaveRoller in Peniche, the Minesto system in the Faroe Islands [22,23,24,25,26], among others.
While in Europe there is a large number of advanced projects, Brazil is an example of a country that can take great advantage of its vast maritime borders with such systems. The most present energy resource in Brazil is hydropower, followed by wind and solar generation [27]. On the one hand, the use of the abundance of rivers and basins distributed throughout the territory associated with the energy resulting from the decomposition of organic matter represents nearly 85% of the electrical energy produced in Brazil. On the other hand, the main issue for energy production is the great disparity of the systems and power plants in the Brazilian territory. The dispersion of population centers, especially in the northern and northeastern regions, also hinders the access to electricity. Therefore, the use of renewable energies can be a feasible solution for these isolated populations that rely on the use of generators as an alternative. Brazil has an extensive coastal zone with a wave energy density between 10 and 30 kW/m [28]. The country has 7367 km of coastline, corresponding to 32% of its perimeter, with densely populated cities near the coast. The use of renewable marine energy has then become an energy challenge for this country to benefit from this asset.
One of the most challenging projects in the state of Pernambuco (located in the northeastern region of Brazil) would be to install marine energy conversion systems offshore the island of Fernando de Noronha. This archipelago, located 545 km from the state’s capital Recife, has the status of a natural park and is registered in the United Nations Educational, Scientific and Cultural Organization (UNESCO) World Heritage List.
The island’s energy matrix is currently composed of generation through thermoelectric and solar energy, representing, respectively, 90% and 10% of the electricity generated in 2019 [29]. Moreover, in 2018, the energy consumption reached about 18,590 MWh, which represents an average consumption of 554,000 L of diesel per month, corresponding to a monthly cost of 3 million Brazilian real—BRL (around 585,000 USD) or 2 BRL (around 0.39 USD) per kWh generated, emitting 1,170,000 kg CO2 per month [29]. Many studies have been conducted regarding the feasibility of hybrid systems which can provide electrical energy and decrease the emission of greenhouse gases [30]. Some studies have presented the viability of hybrid energy scenarios for isolated areas [31,32,33]. In remote marine areas, the development of hybrid offshore renewable solutions that combine solar, wind and wave resources from a single marine site is attractive and should be continuously improved as new technological solutions emerge [34,35].
The development and installation of marine energy conversion systems to supply the needs of Fernando de Noronha Island would be a major achievement. In this work, an original study involving a coupling methodology using oceanographic data, mathematical theories and finite element (FE) modeling was applied to evaluate the possibility of installing a WEC system in the island. This would bring massive environmental benefits in terms of electric power generation, limiting the use of fossil fuels to produce energy in Fernando de Noronha. In this context, this paper proposes a preliminary methodology to model and simulate a wave energy converter (WEC) system adapted to the conditions of the study area, in order to give a first approach to wave loading in the system.
For this investigation, oceanographic data obtained during surveys were first analyzed to characterize the operational and extreme states of the sea in the study region. Afterwards, a WEC system was proposed regarding geometry and materials, and modeled in finite element software. The Airy theory and second-order Stokes’ theory were applied to calculate the velocity associated with the wave conditions and, thus, determine the velocity profiles that were applied to the WEC structure during each sea state. Those profiles were implemented in the numerical modeling for the performance of fluid flow simulations in order to assess the pressure map distribution on the WEC panel. Several panel inclinations were tested to determine the most critical position regarding the pressure distribution applied on the panel. Finally, the respective pressure distributions were implemented in an FE model to perform a static analysis of the complete WEC system and identify the parts of the structure that are subject to the greatest stresses, verifying whether the materials can withstand the sea states.
To carry out this work, several steps were followed: (1) the treatment of oceanographic data measured in the platform of Fernando de Noronha Island, highlighting the different types of swells; (2) the use of linear wave theories (Airy and second-order Stokes) to determine the velocity profiles of the different types of waves observed in the region; (3) the development of a numerical model of the submersed WEC system using COMSOL Multiphysics software to obtain the pressure distributions on the system due to the waves; (4) the development of a numerical model using SolidWorks software to perform a static mechanical study of the WEC system under extreme conditions.

2. Materials and Methods

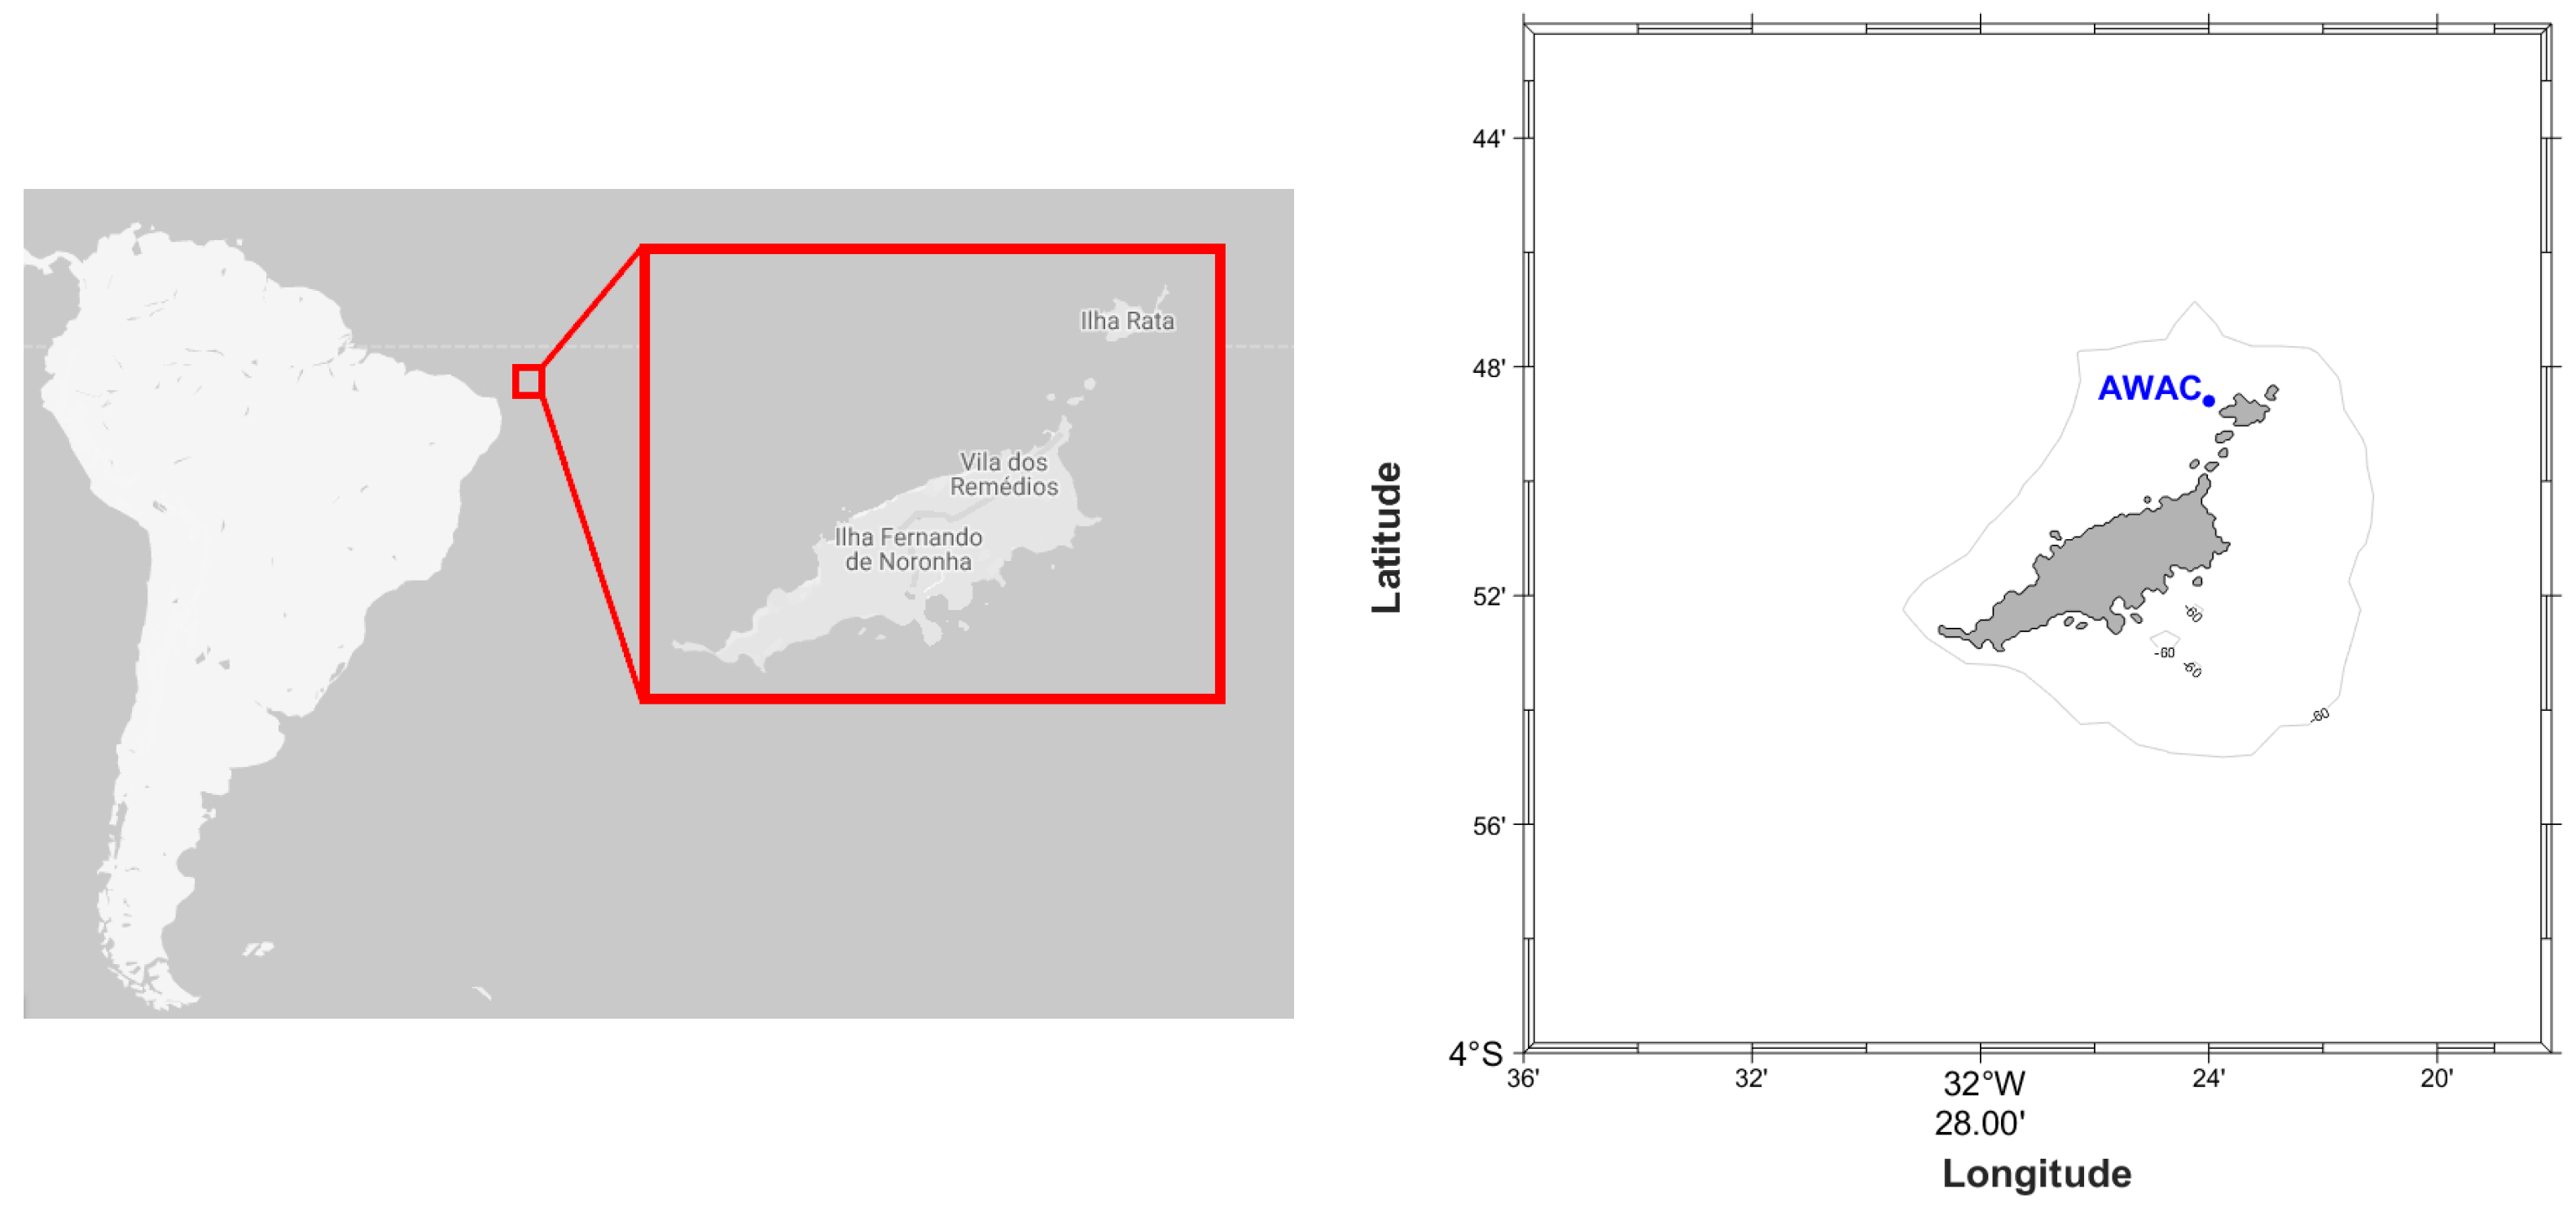
2.1. Oceanographic Data

The study area for a future deployment of an energy conversion plant using sea waves was the Fernando de Noronha archipelago, located 345 km from the closest point to the Brazilian coast. Oceanographic survey data were used for the identification and characterization of the operational swell, as well as extreme scenarios that may take place in the study area. The data were provided by the Oceanography Department at Universidade Federal de Pernambuco (UFPE, Brazil) and were obtained using an acoustic wave and current meter system (AWAC) with a transmission frequency of 600 kHz. Depths at the site are around 17 m for coordinates 03°49′ S and 32°24′ W (Figure 1). The site is in an area open to tourism and oceanographic surveys. The instrumentation was operated in stand-alone mode over one year (May 2013–June 2014) and the following were measured: (i) currents every 30 min; (ii) waves with 2 h bursts; and (iii) tidal elevation every 2 h with an absolute accuracy of 0.1% of full scale for the wave measuring equipment. In this study, the oceanographic data used hereafter were obtained during the whole time frame of the survey (1 year data).

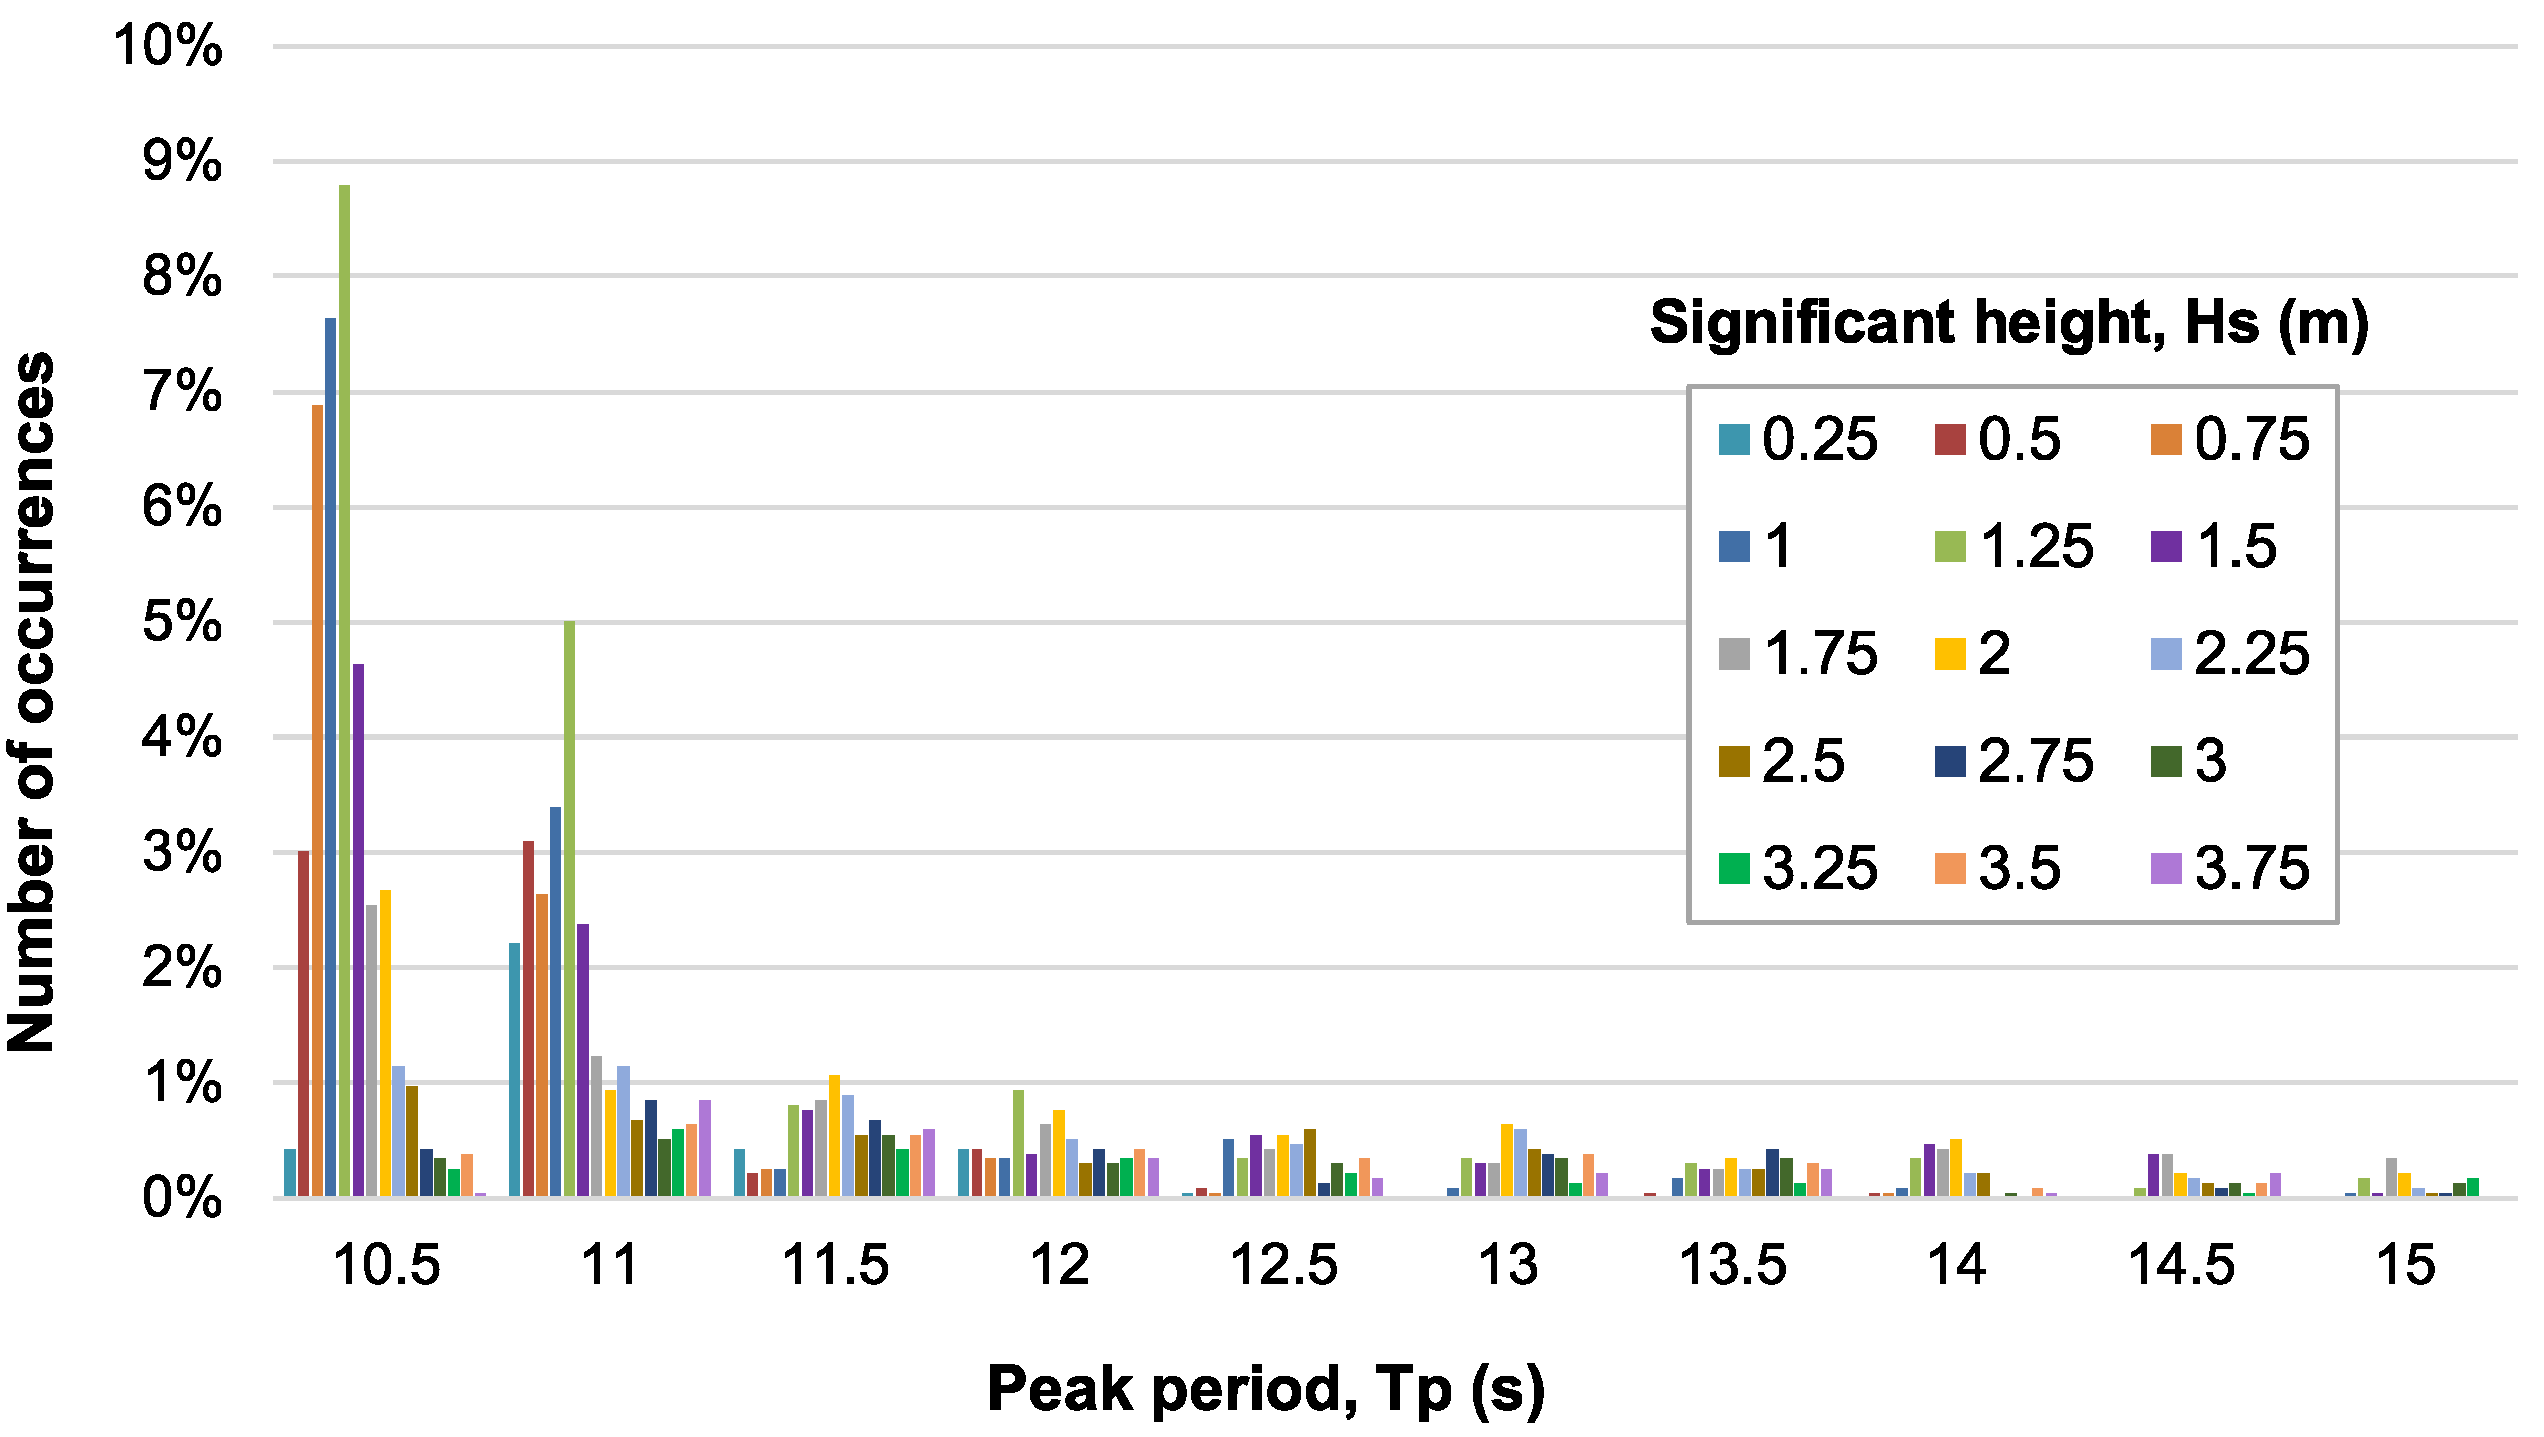
2.2. Characterization of the Operational State of the Sea

Swell is a complex phenomenon and its description can be difficult. The wave behavior for a reference site can be expressed by a distribution diagram. Each sea state is mainly represented by a significant wave height, Hs, and a peak period, Tp. These were the parameters used in this work to characterize the waves, since they allow simplifications to the swell characterization.
The wave occurrences (given in % during the one-year time frame) of each sea state at the reference site are presented in Figure 2. According to the figure, the swell sea waves most likely to occur in the study area have a significant height Hs = 1.25 m and a peak period Tp = 10.5 s. From an energy production perspective, this is the operational swell that must be considered to account for the potential power of the area.
To assess the potential power of the energy resource, the work of Ruellan [36] was taken as a reference. The significant wave heights (Hs) and dominant wave periods (Tp) were used to calculate the average wave power in W/m (Equation (1)), which allowed the diagram of the resource power to be obtained, as presented in Figure 3.
P W   = ρ g 2 64 π   H s 2 T p
where  ρ  = 1025 kg/m3 is the density of seawater;  g  is the acceleration of gravity.
Results show that the operational swell at Hs = 1.25 m and Tp = 10.5 s, which is most likely to occur in the study area, would generate around 8000 W/m. In addition, the strongest waves would potentially produce up to 100,000 W/m.

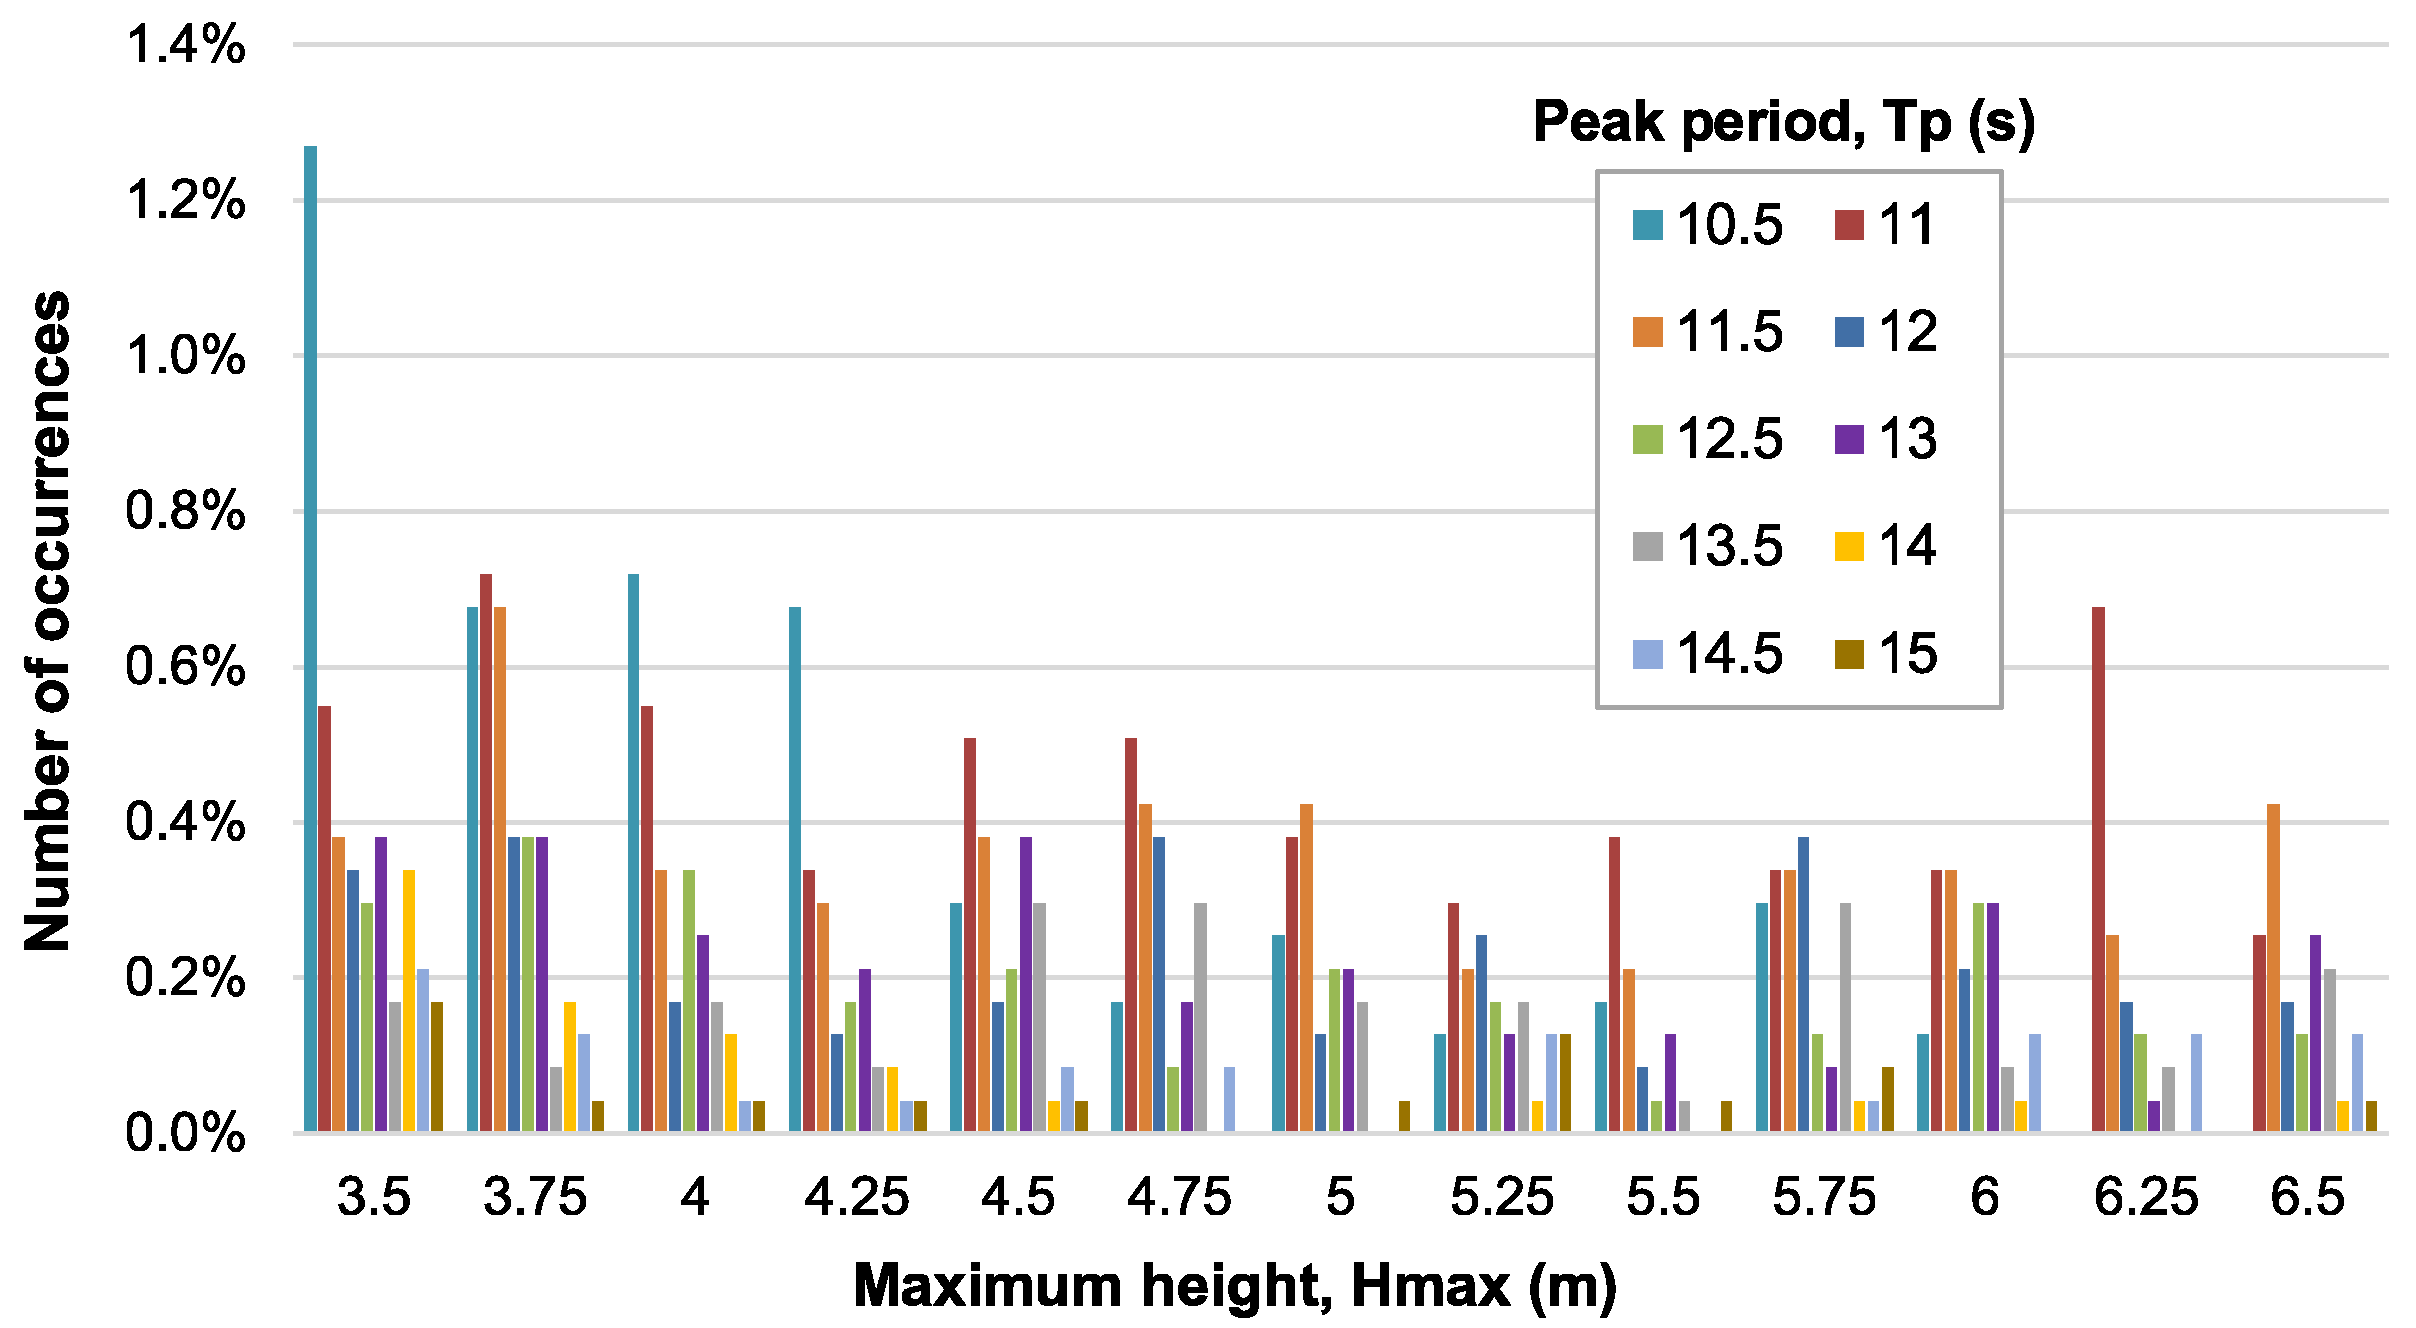
2.3. Characterization of the Extreme State of the Sea

For the simulation of the structure behavior at sea, it is equally relevant to consider the most extreme wave condition that may appear, particularly during storms. Figure 4 shows the occurrences (given in % during the one-year time frame) of maximum wave heights measured (Hmax), and Figure 5 takes a closer look on the occurrences for the higher maximum height range (between 3.5 m and 6.5 m).
According to Figure 5, the swells (the most probable maximum wave height is about 6 m with Tp ≥ 11 s) are likely to appear in the study area. The WEC structure must, therefore, be strong enough to withstand such waves. Linear wave models were, thus, used to calculate the velocity profiles of these waves as a function of depth, allowing the representation of the loading of these waves on the investigated structure.

2.4. WEC System Configurations

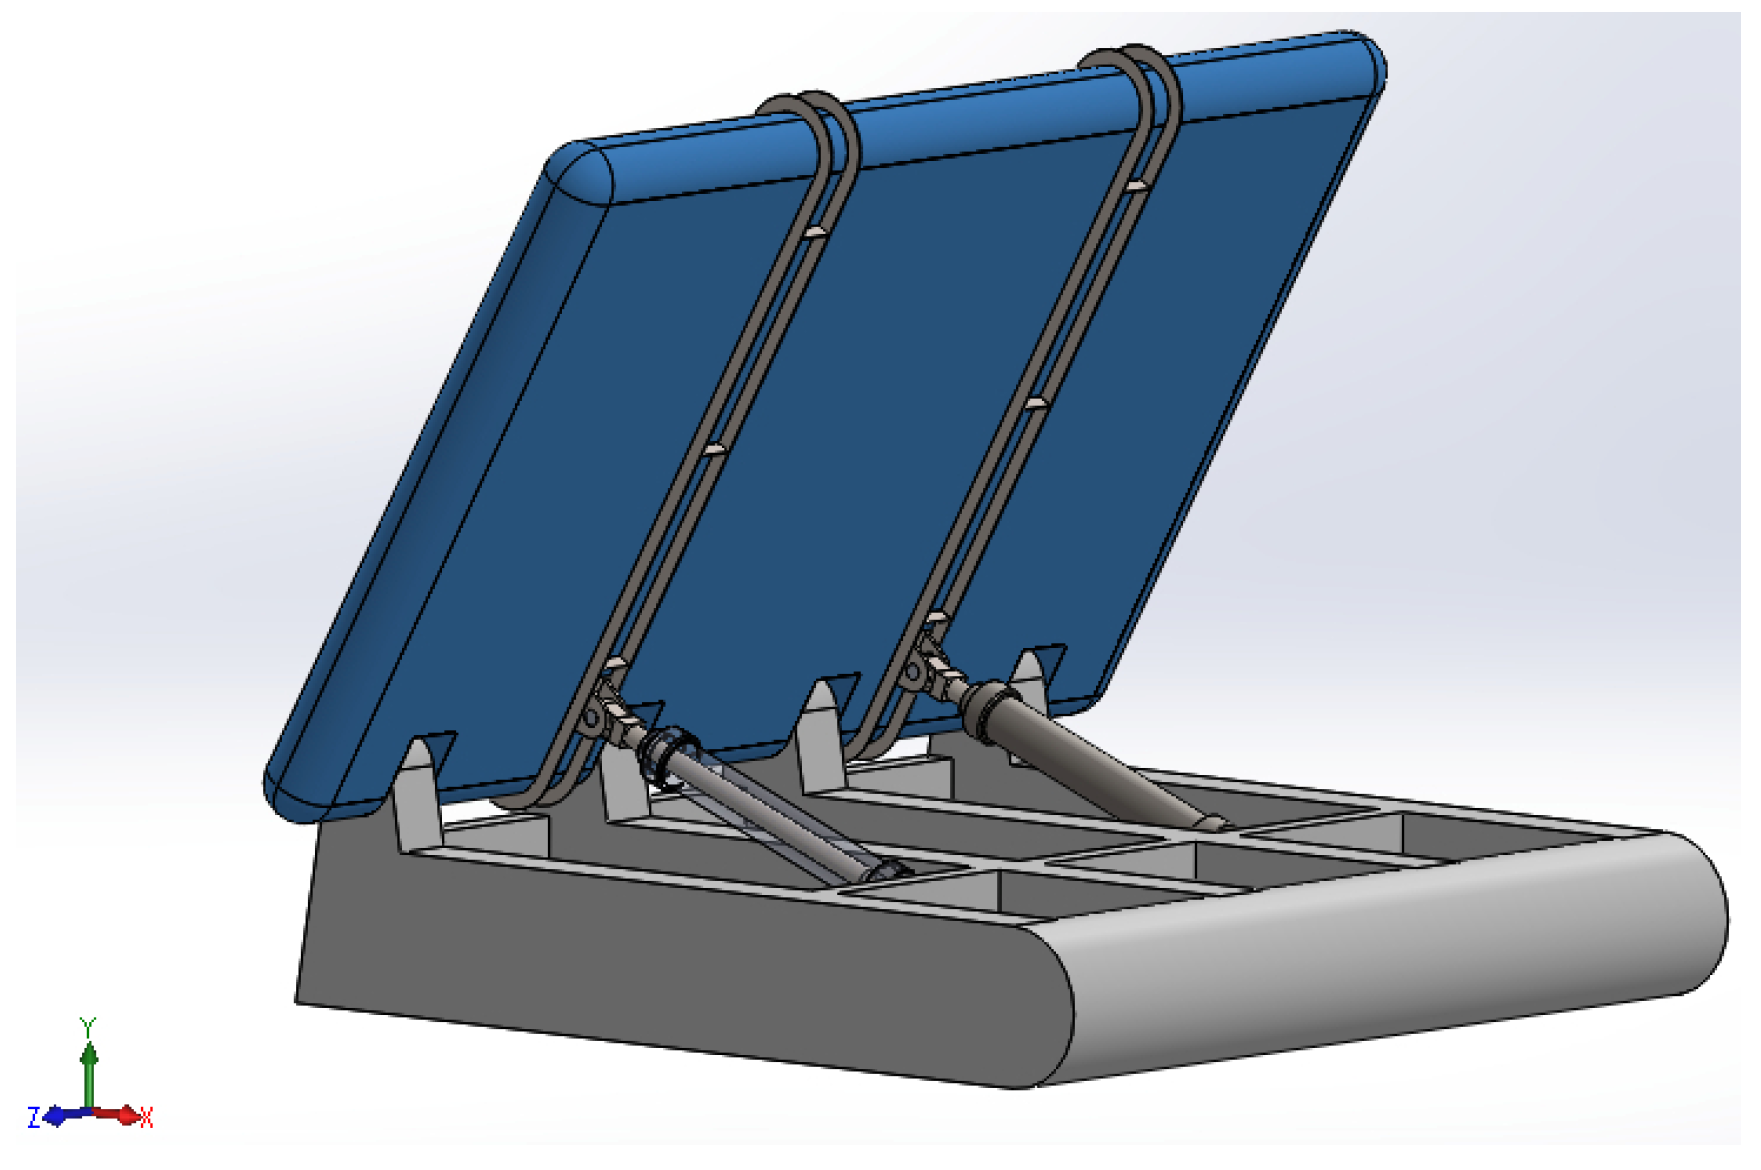
2.4.1. Architecture of the WEC

In order to propose a potential system to convert wave energy in the study area, the architecture of an oscillating panel was investigated. For this purpose, three sources of information were relied upon:
  • The existing systems previously studied and commercially available materials and components;
  • The literature concerning the conversion of marine energy since a great deal of research has been carried out on different systems;
  • A study commissioned by the Federal University of Pernambuco (UFPE, Brazil) for a wave energy system to be installed in the open sea region of Fernando de Noronha Island, which has no visual or environmental impacts.
The system analyzed in this work is composed of an oscillating panel (Figure 6), in which some dimensions were adapted to install the system at a sea water depth of 17 m. This system uses an oscillating panel driven by the movement of waves to produce electricity using cylinders and a high-pressure network supplying an electric generator.
The following components are part of the system:
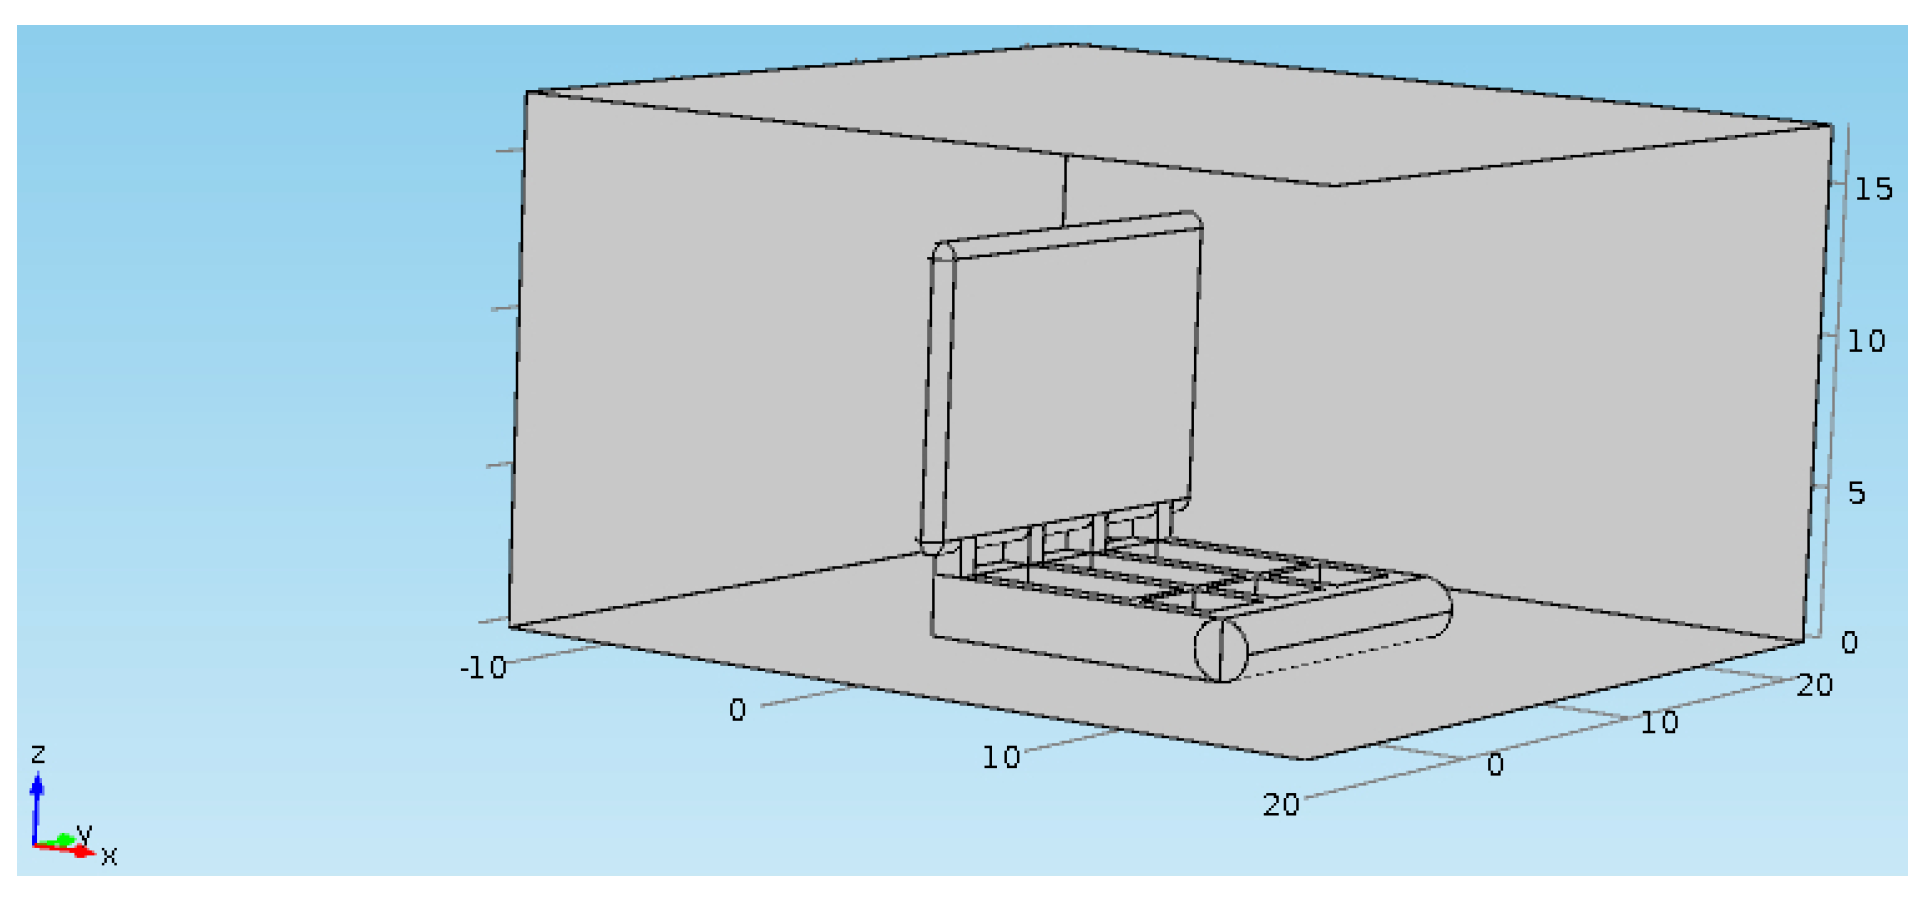
  • The panel: Attached to the base at the rotation axis, the panel is moved by the oscillation of the waves. It is 15 m wide and 10 m high. The distance between the top of the panel, that is fully submerged, and the surface of the water is 3 m. The rotation of the panel relative to the base is provided by a 0.5 m diameter shaft. The panel consists of a 10 mm thick high-density polyethylene (HDPE) shell, reinforced by a polyurethane foam to prevent the panel from crushing under water pressure.
  • Vertical reinforcements: Two frames (200 mm wide and 20 mm thick) of stainless steel AISI 316 are added to the panel to ensure its integrity, while offering suitable corrosion resistance. The vertical reinforcements have the purpose of withstanding these loadings that arise during the operation of the system.
  • The base: The base structure is composed of concrete and enables the system to be anchored to the ocean floor to ensure its stability. It is 11 m long, 12 m wide and 2 m high.
  • Hydraulic cylinders: Thanks to the oscillation of the panel, these allow the pumping of a fluid in a high-pressure circuit for the conversion into wave energy. In this study, the cylinders were chosen based on commercial information obtained in the market of components used for offshore applications.

2.4.2. Summary of Material Properties

The materials used in the different components of the WEC system are described in Table 1. The choice was based on the work of Beirão and Malça [30] concerning the design of a marine energy converter buoy.

2.4.3. Mass Balance

The weight of each component was calculated by using the volume of each component and the densities from Beirão and Malça [37]. According to the balance sheet presented in Table 2, the panel weighs about 10 tons while the base weighs nearly 290 tons. The volume of water displaced by the fully submerged panel is of approximately 150 m3. Based on Archimedes’ principle, since the tendency is to lift the panel to the surface, the calculated Archimedes thrust on the panel is approximately 1500 kN, providing a positive buoyancy to the panel. Thus, the base allows the anchoring of the system to the bottom by compensating for almost twice the pressure of Archimedes applied to the panel.

2.5. Numerical Model

2.5.1. Geometry of the Model

A FE model of the simplified WEC structure enclosed in the volume of an external fluid was developed in COMSOL Multiphysics software. A 30 m wide, 30 m long and 17 m high rectangular cuboid was modeled in order to represent the fluid around the WEC system. To model the system, the geometry was simplified and represented only by the panel and the base, with the dimensions shown in Table 3.
The front face of the panel is located 10 m behind the inlet face of the fluid and 7.5 m from the side faces of the cuboid. Since the height of the system is of 13 m, there are 4 m between the top of the panel and the top face of the cuboid (Figure 7).
The panel is movable and oscillates as a result of the action of the wave. However, the panel was considered static in the model and was blocked at specific angles of −45°, −30°, 0°, 30° and 45° (relative to the vertical axis). Such blocking position is essential to be analyzed since it can generate a critical situation for the system, for instance, in the case of a storm (blocking necessary as a safety measure) or the accidental blocking of a cylinder. Therefore, several simulations were performed by changing the inclination angle of the panel for the investigation of the impact of the panel inclination on the pressure distribution.

2.5.2. Mesh Properties

The meshes used for the modeling are detailed in Table 4 and presented in Figure 8. The system mesh was refined to increase the accuracy of the pressure calculation over the surface of the panel.
A convergence study was previously performed on the same system with another FE software, ANSYS (Canonsburg, PA, USA), and then compared to COMSOL Multiphysics simulations, in order to find the adequate meshes of the fluid and the solid WEC structure. For the same study configuration, 6 different mesh sizes were tested, and the pressure obtained on the panel was studied to verify the convergence of the results. The characteristics of this preliminary study are presented in Table 5.
The results highlight that the maximum pressure applied by the water on the panel increased by 16.6% between the coarsest and the finest mesh. On the other hand, the maximum pressure was the same for the 0.2 m and 0.15 m mesh while the computational time increased by 2 h. The performance of the 0.2 m mesh was, therefore, satisfactory for a much shorter computational time. Figure 9 shows the evolution of the pressure applied by the fluid on the panel as a function of x, with the convergence of the solutions. Figure 10 represents the pressure distribution on the panel.
The same model was run with ANSYS and COMSOL Multiphysics to compare the results with different input velocities (Table 6).
The results show that the pressures simulated by COMSOL Multiphysics were all lower than the pressures obtained with ANSYS. This slight difference can be explained by the difference in the mesh size between the two software. Indeed, with ANSYS it is possible to make very fine meshes but requiring quite long calculation times (4 h 30 min of calculation for ca. 16,000,000 elements). With COMSOL, it was difficult to create an extremely fine mesh because the solution did not converge beyond a certain mesh fineness. On the other hand, COMSOL has the advantage of being able to insert functions more easily than ANSYS and without an associated programming language, e.g., Python. This feature was very useful for continuing the task of implementing the velocity profiles calculated in the previous part with the wave data.

2.5.3. Flow and Fluid Modeling

Wave Theory

There are several theories for modeling the motion of water in oceans. They allow a relatively adequate modeling of the phenomenon and are widely used in intermediate water conditions for the study of offshore structures. In this work, the focus was mainly on the linear theory proposed by Airy and on the second-order theory of Stokes.

Boundaries and Sea Conditions

The fluid taken into account in the modeling was seawater with a density of 1025 kg/m3. The fluid flow was considered laminar and the inlet velocity was not constant over the entire entrance surface, since it varies with the water depth. Different velocity cases were tested to observe the consequences on the pressure applied by the flow on the panel. On the other surface, the outlet condition was a constant pressure of 1 Pa. The condition imposed on the upper side represents the velocity in the direction of flow on the surface. The velocity depends on the height z, thus the condition on the upper side is the velocity of the wave calculated at the height of 17 m. Similarly, the condition on the lower side represents the fact that the wave velocity does not vanish at the bottom of the sea (in the linear modeling of waves). Table 7 describes all boundary conditions applied to the model.
Two different swell scenarios (operational swell and maximum swell) were simulated to determine the resulting pressure applied on the panel for the different inclinations. The characteristics of the two swells are given in Table 8.

3. Results and Discussion

3.1. Velocity Calculation Associated to Wave Conditions

In this part of the work, the focus was to investigate the case of maximum waves (Hs around 6 m, Tp ≥ 11 s, wavelength = 129 m). Indeed, this swell is the most powerful observed in the area of Fernando de Noronha and the aim was to study the behavior of the structure in the most critical case.
The calculations were performed using Airy’s linear theory and second-order Stokes’ theory [38], using intermediate depth for the Airy model. The results obtained for the maximum horizontal velocities calculated with the second-order Stokes’ model were used. The wave velocity is actually a sinusoid; however, only its maximum value was considered in order to model the most relevant pressure applied by the wave on the panel. To determine the action of the underwater waves on our panel, a program was performed to calculate and model the horizontal velocity of those according to the depth.
The velocity profiles obtained from the first-order (Airy theory) and second-order (Stokes’ theory at order 2) linear wave models for the case of maximum swells and the case of operational swells are represented in Figure 11. The results confirm that the horizontal velocities are much higher for maximum swells than for operational swells. Moreover, the results clearly highlight the influence of the second-order Stokes’ model compared to the Airy linear wave model. While the difference between the first and the second order is not crucial for low velocities of the operational swell, this cannot be ignored for the maximum swell.

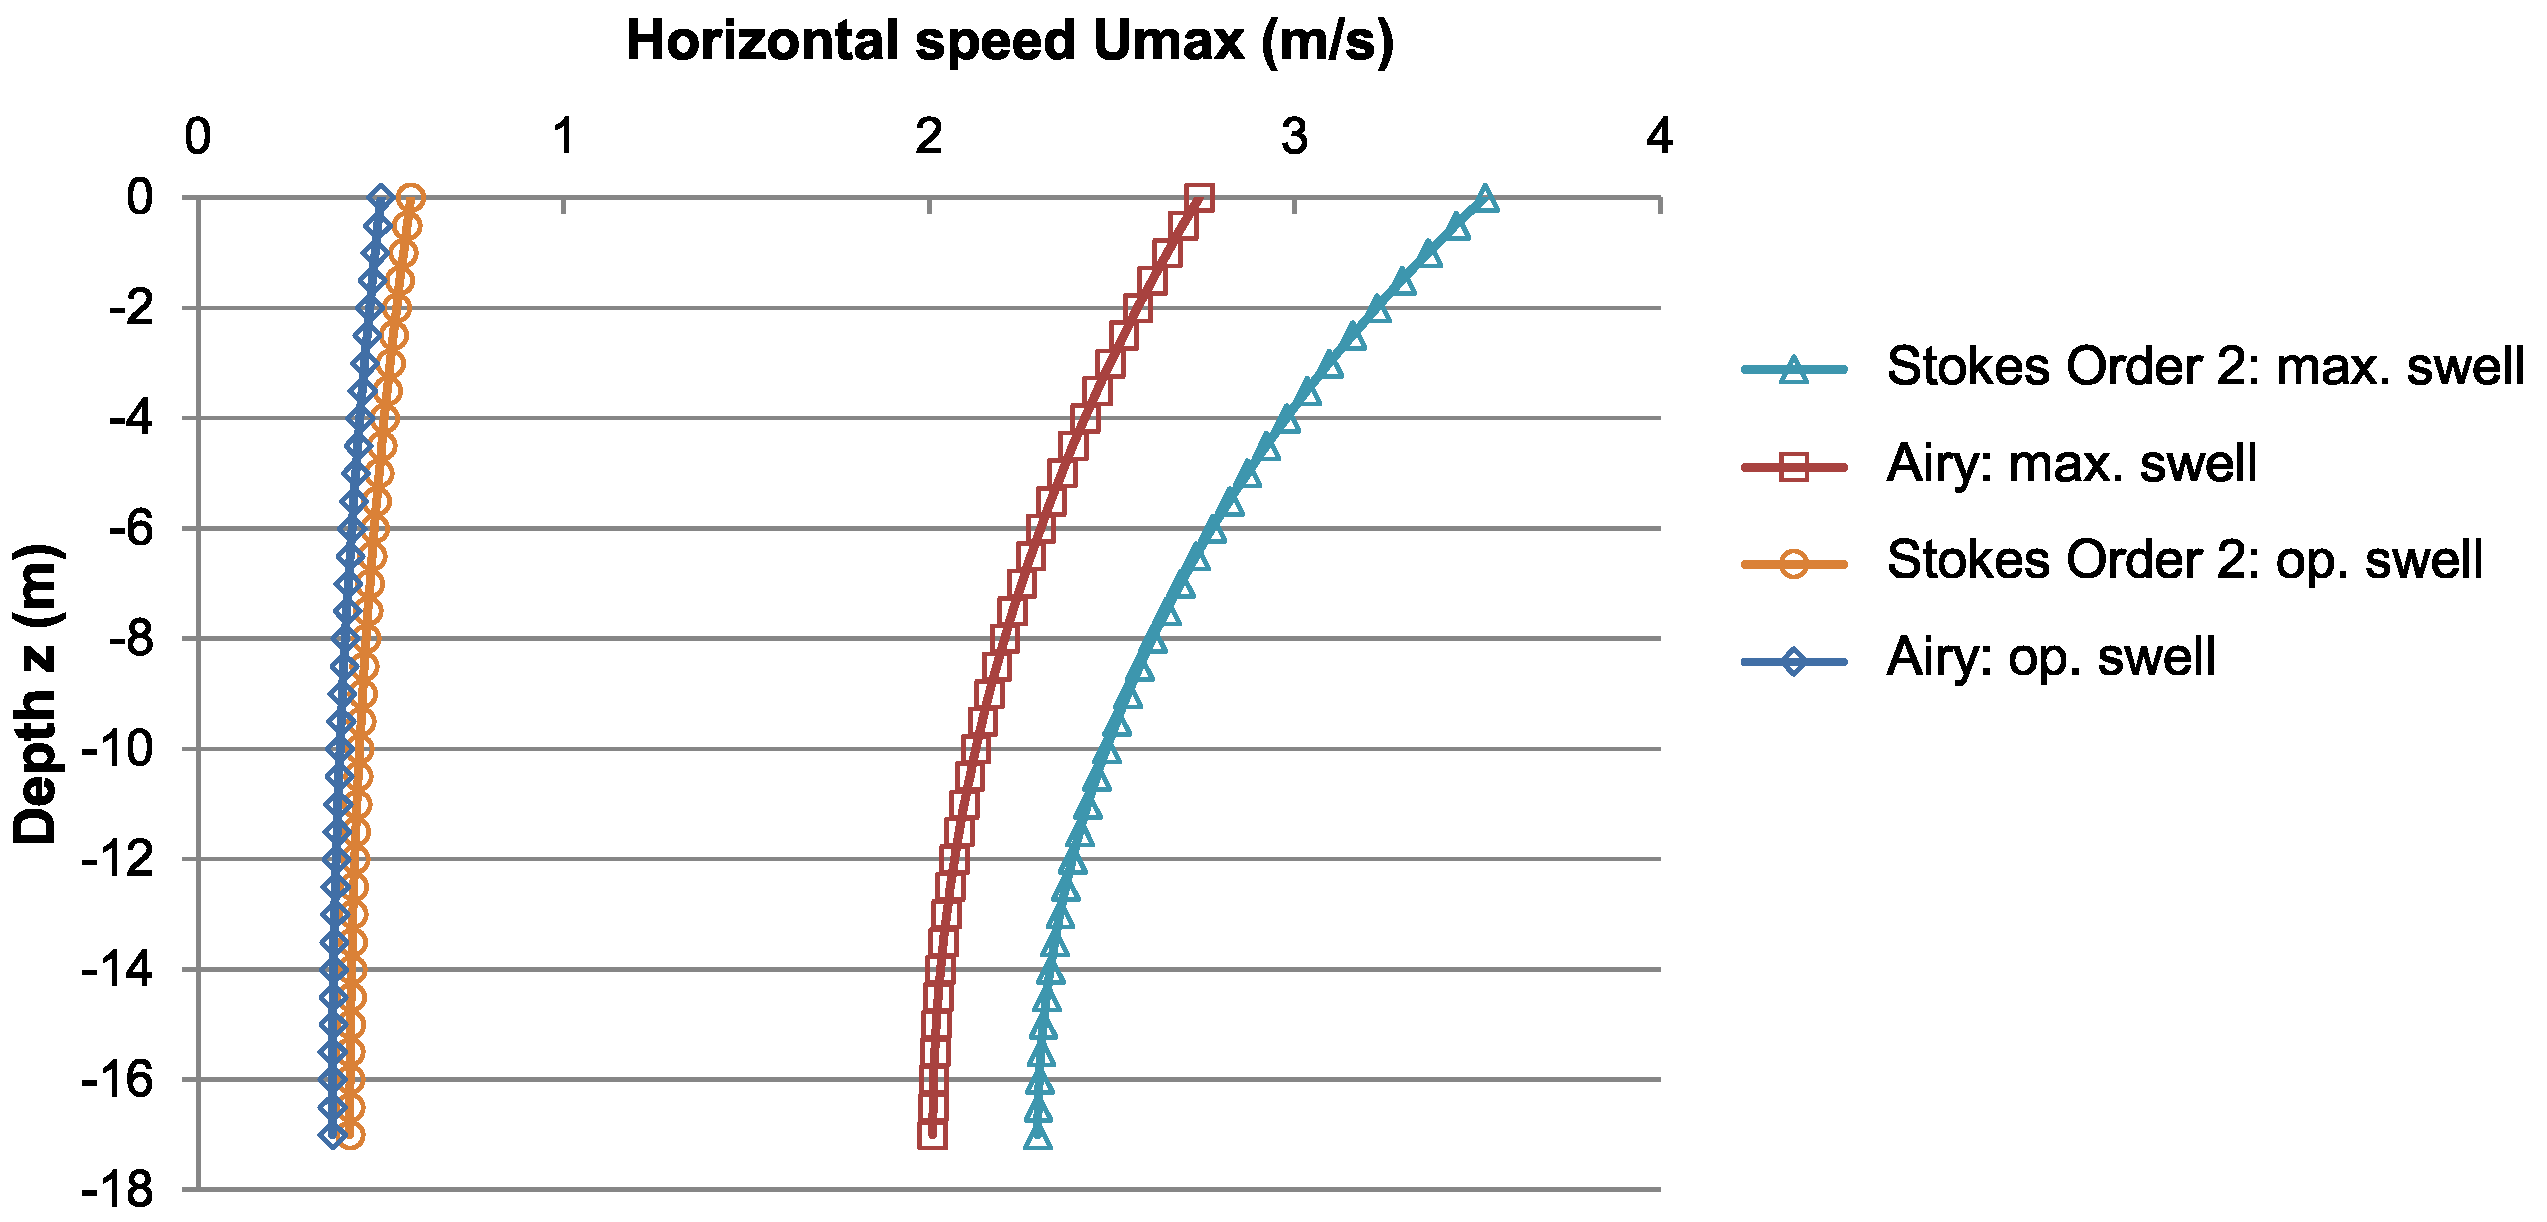
3.2. Velocity Profiles

From a basic program, it was possible to calculate the velocity profiles according to the depth and representative of each sea state considered in the study. These velocities were then implemented in COMSOL Multiphysics as a boundary load and simulation results allowed to determine the pressures applied by the wave on the panel. Figure 12 shows the velocity profile used as boundary load for the maximum swell case.

3.3. Determination of the Horizontal Velocity of Waves as a Function of Depth
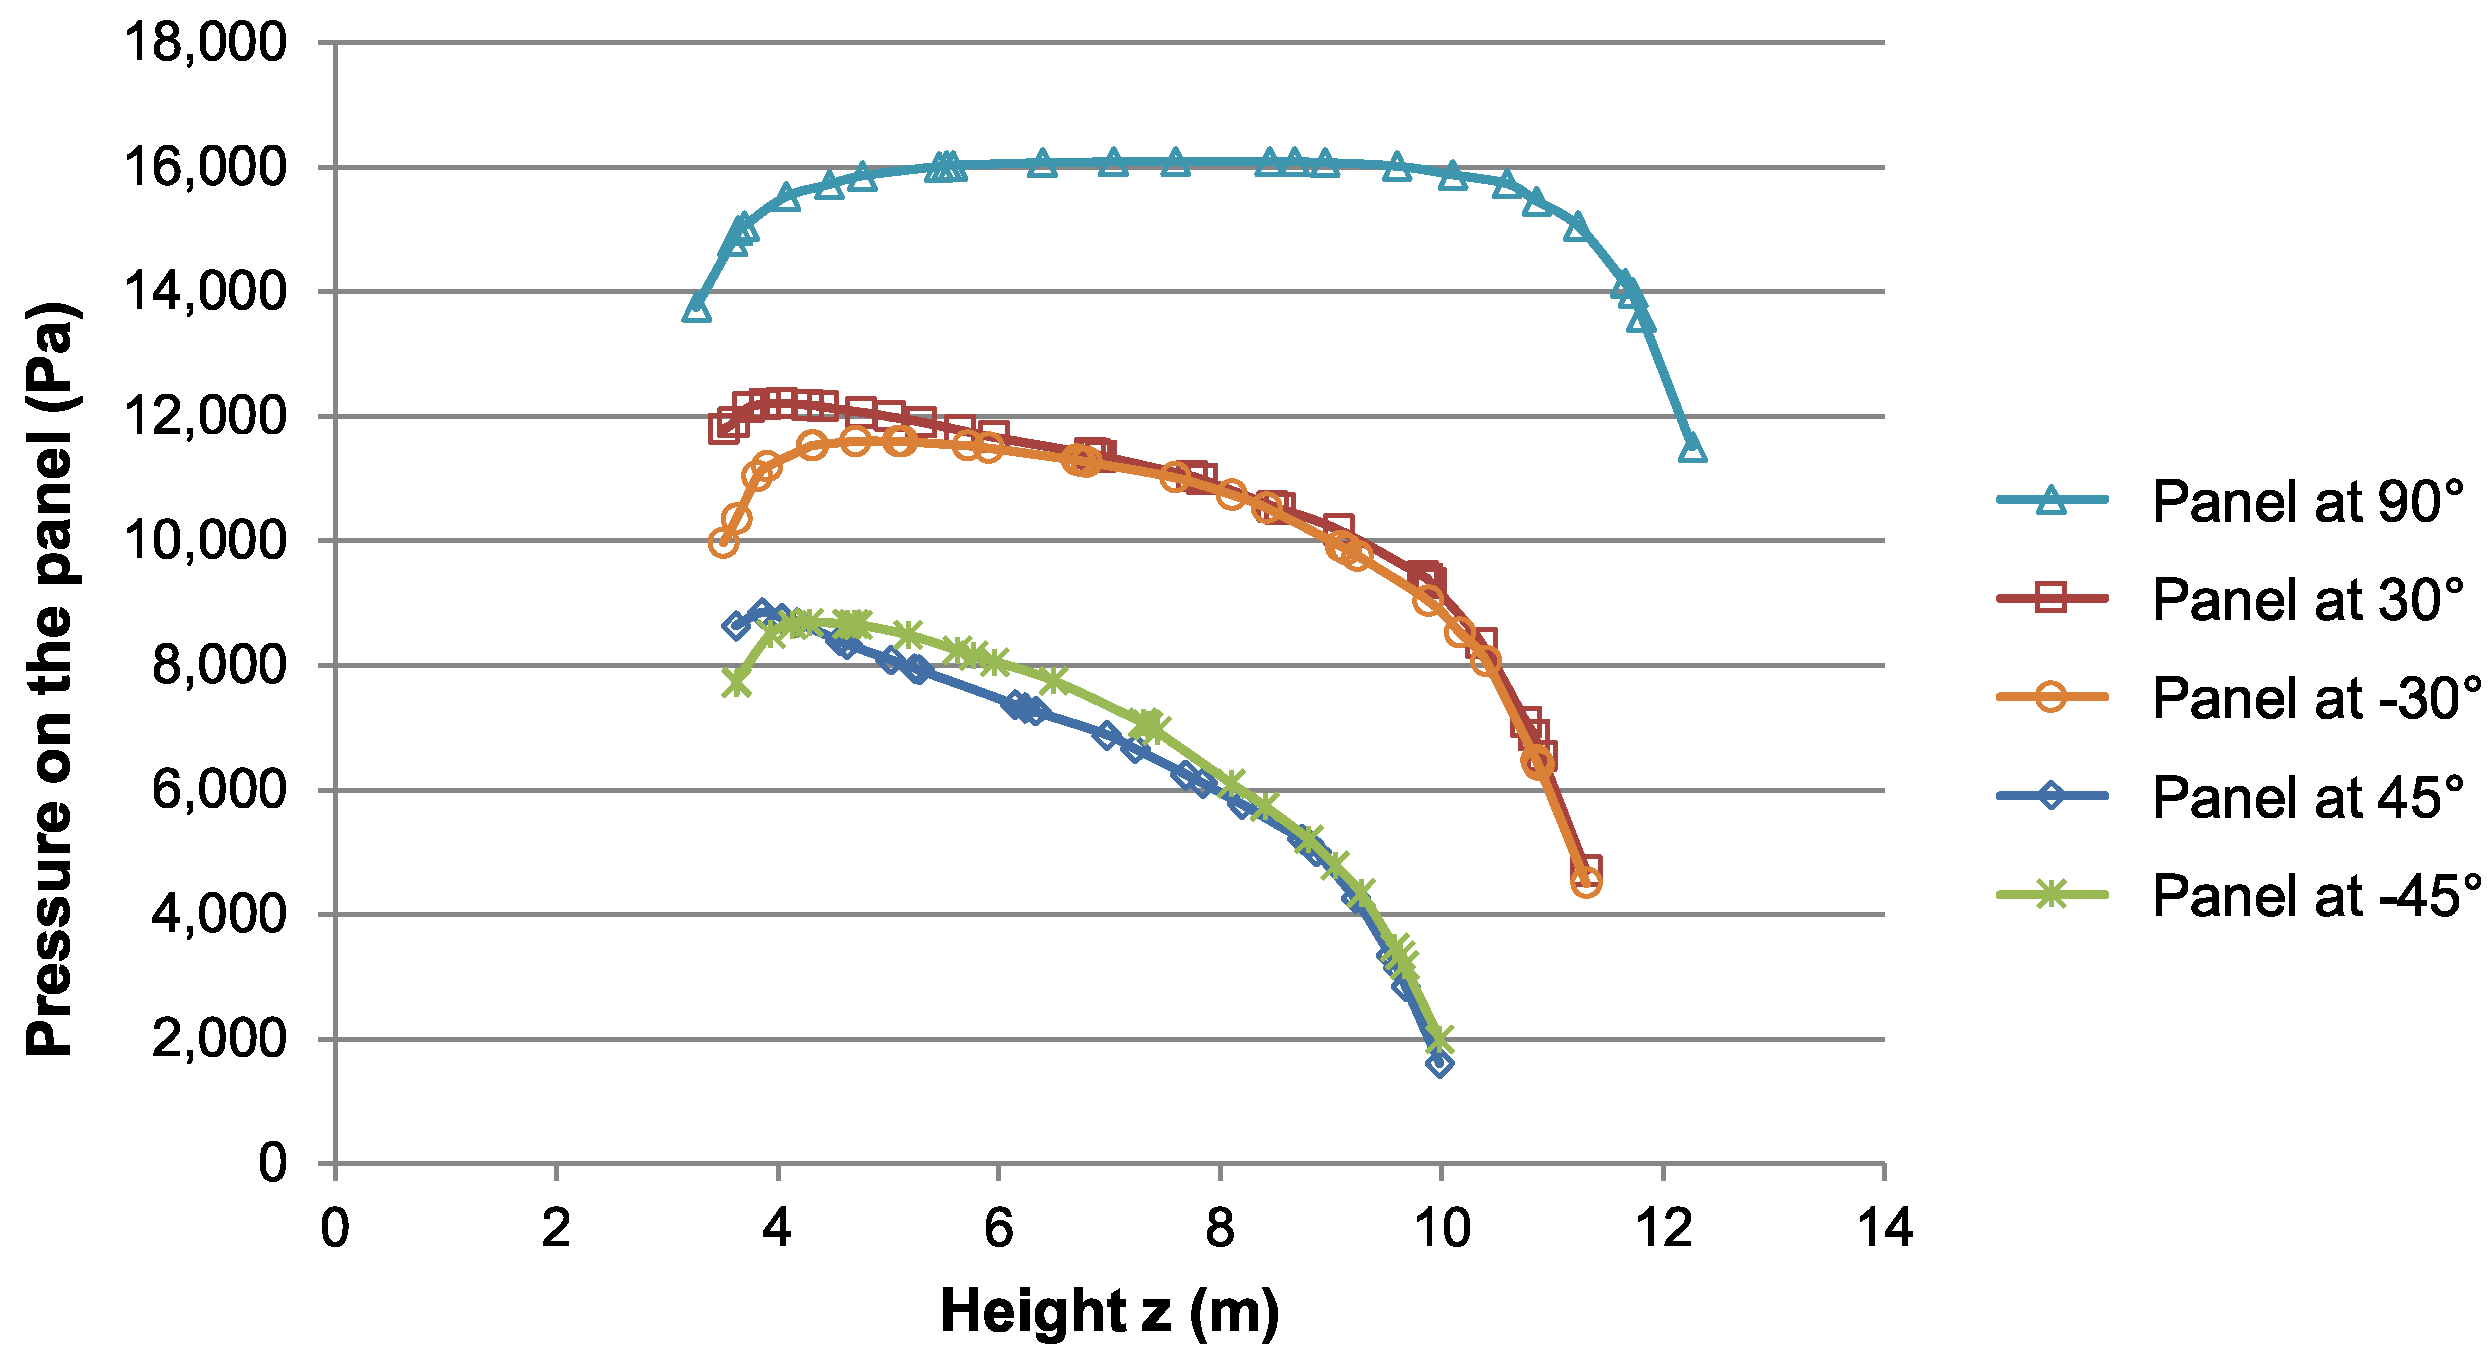
The action of the fluid for the five different angles of the panel and in the case of a maximum swell was modeled. For each of these inclinations, the pressure distributions on the panel were obtained. These pressure distributions were then implemented in SolidWorks to analyze the mechanical behavior of the structure in front of the wave action.

3.3.1. Panel at 0°

In Figure 13, the panel is at 0° (relative to the vertical axis) and the flow is perpendicular to the panel. The pressure is significant in the center of the panel and decreases at the edges. The maximum measured pressure value was 16,092 Pa.

3.3.2. Panel at 30°

For an inclination at 30° (relative to the vertical axis) as shown in Figure 14, the simulation results showed that the pressure distribution has weakened. The fluid flows on the panel and no longer applies as much pressure as in the previous case. Here, the maximum pressure recorded was 12,224 Pa.

3.3.3. Panel at 45°

The same trend was observed as for the 30° case (see Figure 15). The pressure distributions decreased even more when the panel was tilted at 45° (relative to the vertical axis). This can be particularly seen in the maximum pressure of 8884 Pa in the structure.
The simulation results presented in Figure 13, Figure 14 and Figure 15 underline that the maximum pressure observed on the panel is inversely proportional to the angle of inclination. The simulated pressures of the COMSOL Multiphysics flow model were implemented in SolidWorks. For this purpose, the pressure values in a vertical straight line in the middle of the panel were retrieved, as shown in Figure 16. Afterwards, the pressure value evolution was represented depending on the height, z, to obtain the curves in Figure 17.
Trendlines were applied to these curves, whose equations as a function of z were achieved in the form of polynomials of order 6. These polynomials are presented in Table 9 and were later integrated in SolidWorks to model the effects of the wave on the panel.
It is worth noting that for the simulation in SolidWorks, the pressure was considered to be dependent only on the vertical height, z. Therefore, no information about the evolution of pressure on the horizontal axis, y, was given. Nevertheless, it was observed that the pressures were lower on the edges of the panel. As a result, the simulated pressures in SolidWorks on the right and left edges of the panel were larger and the results regarding the behavior of our structure were slightly overestimated.

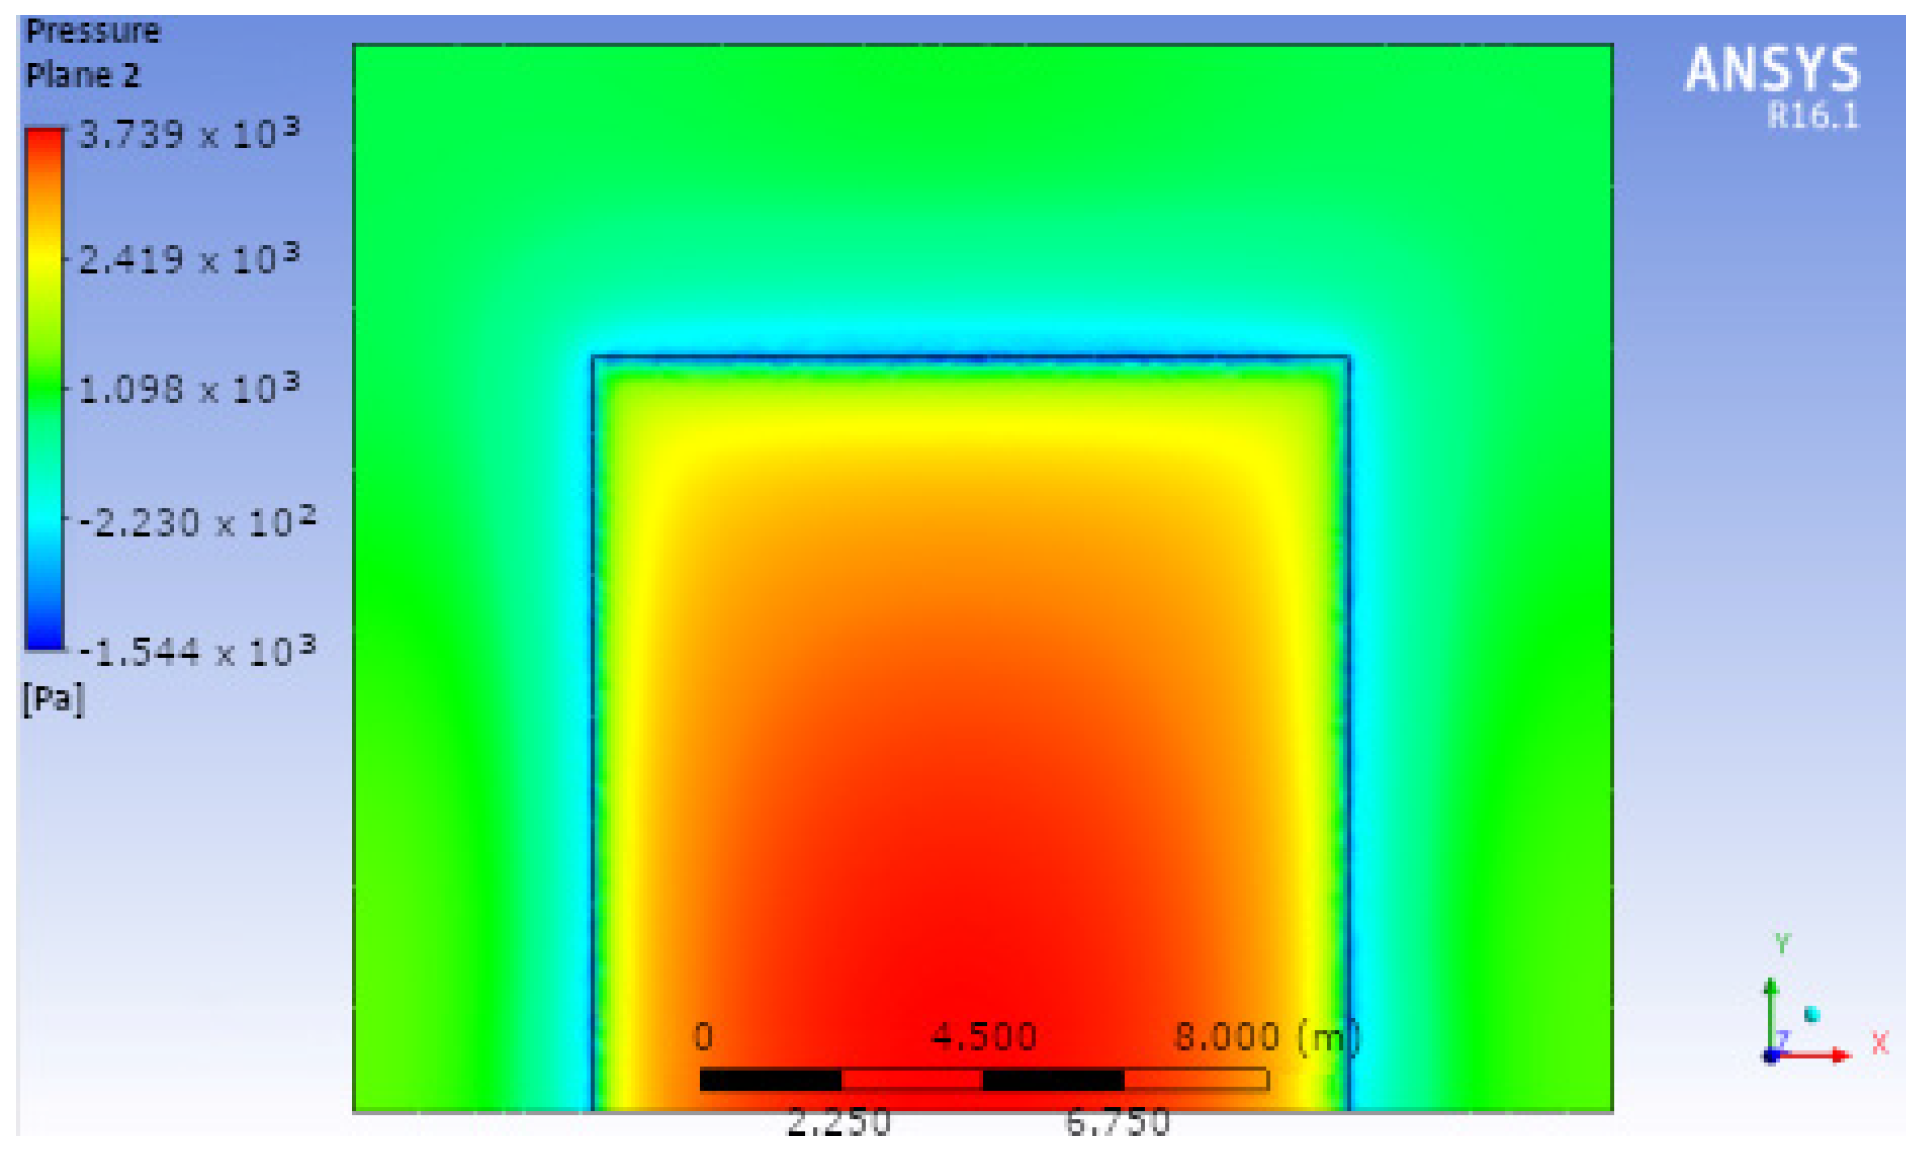
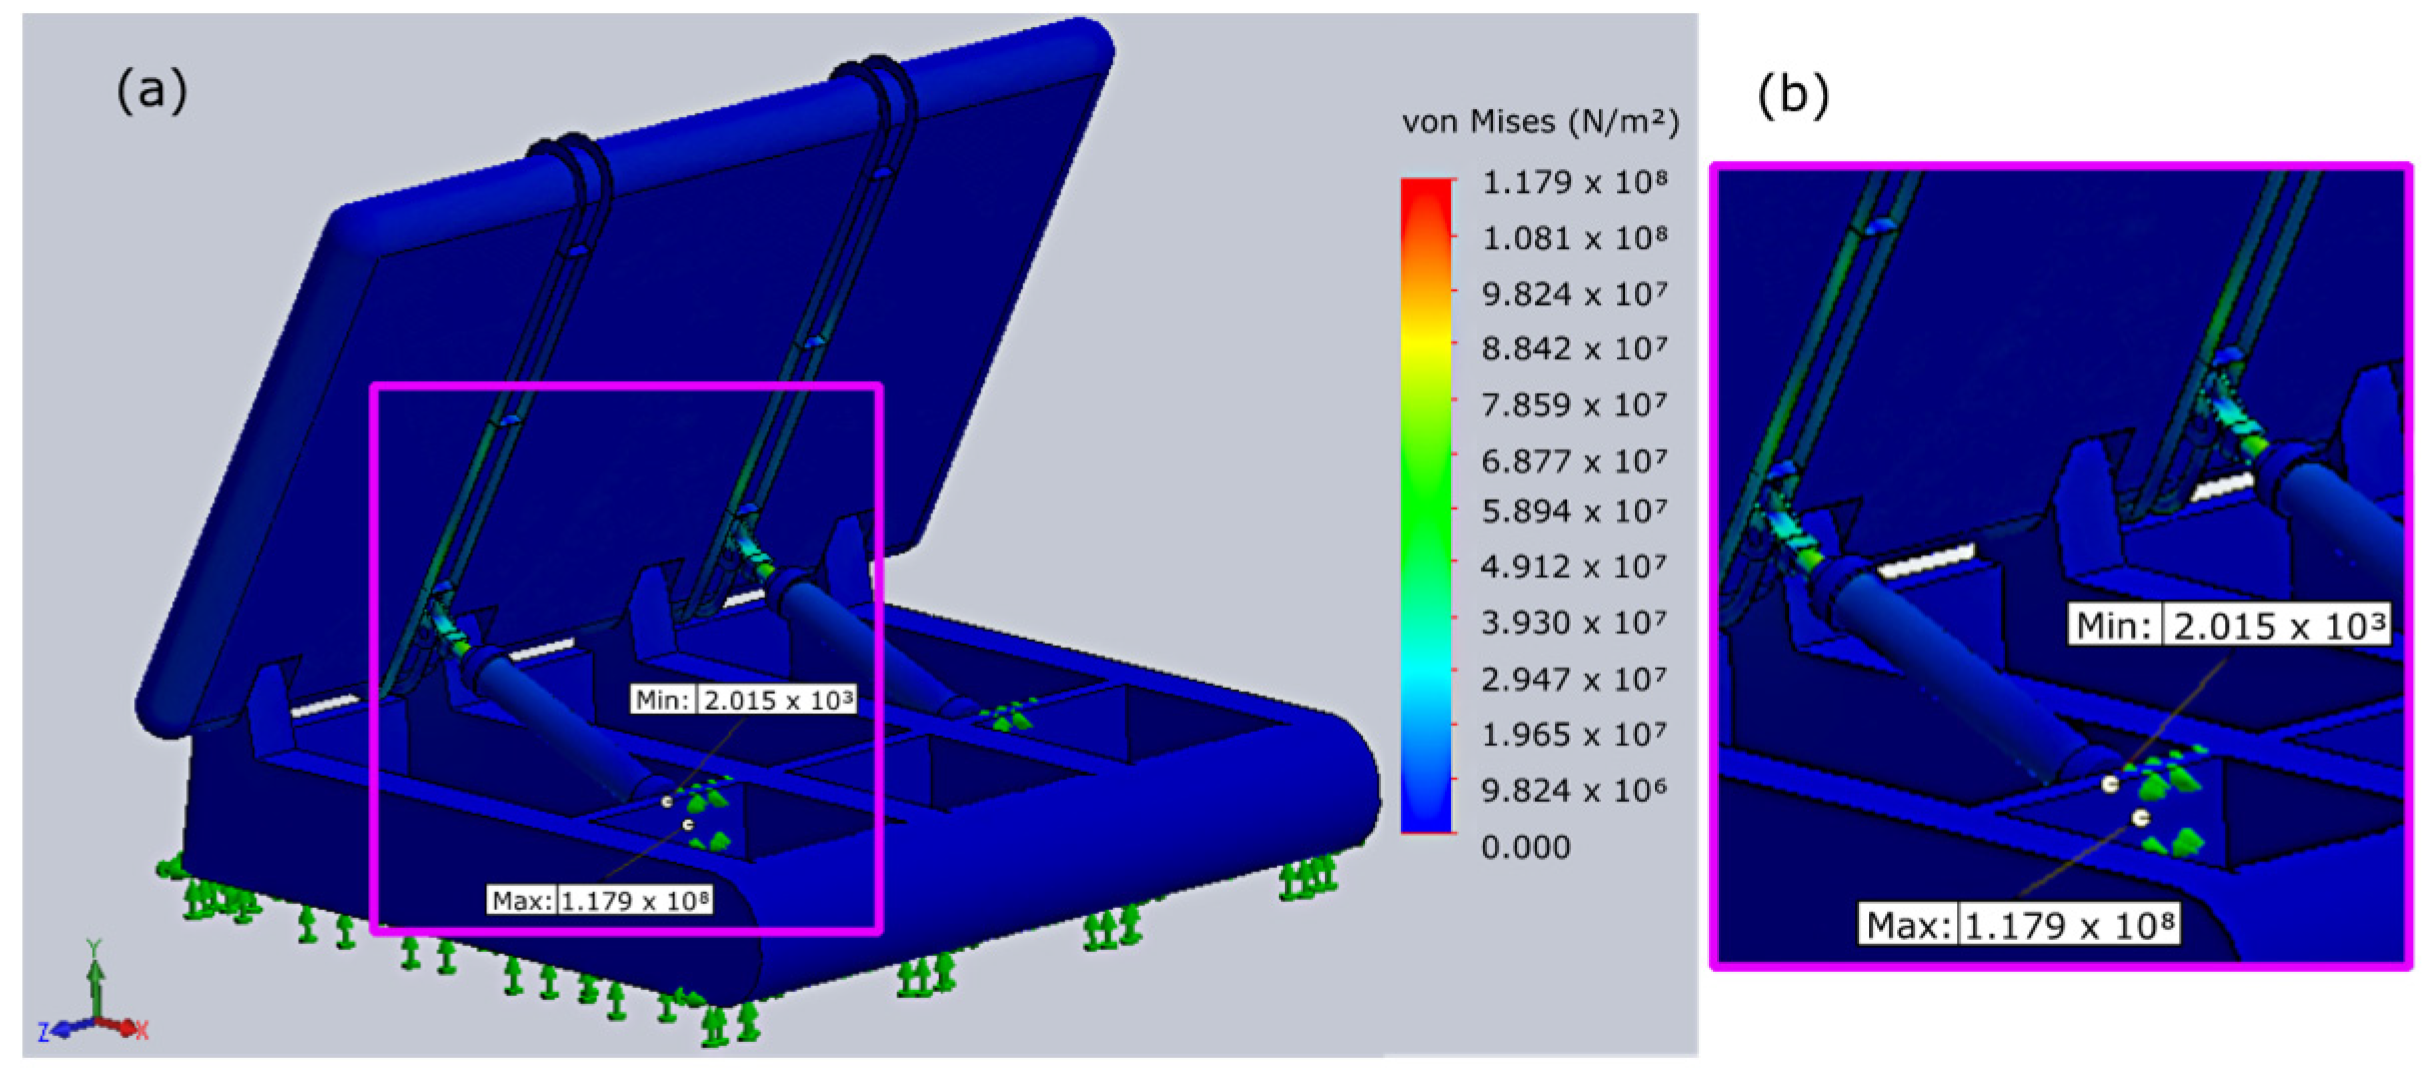
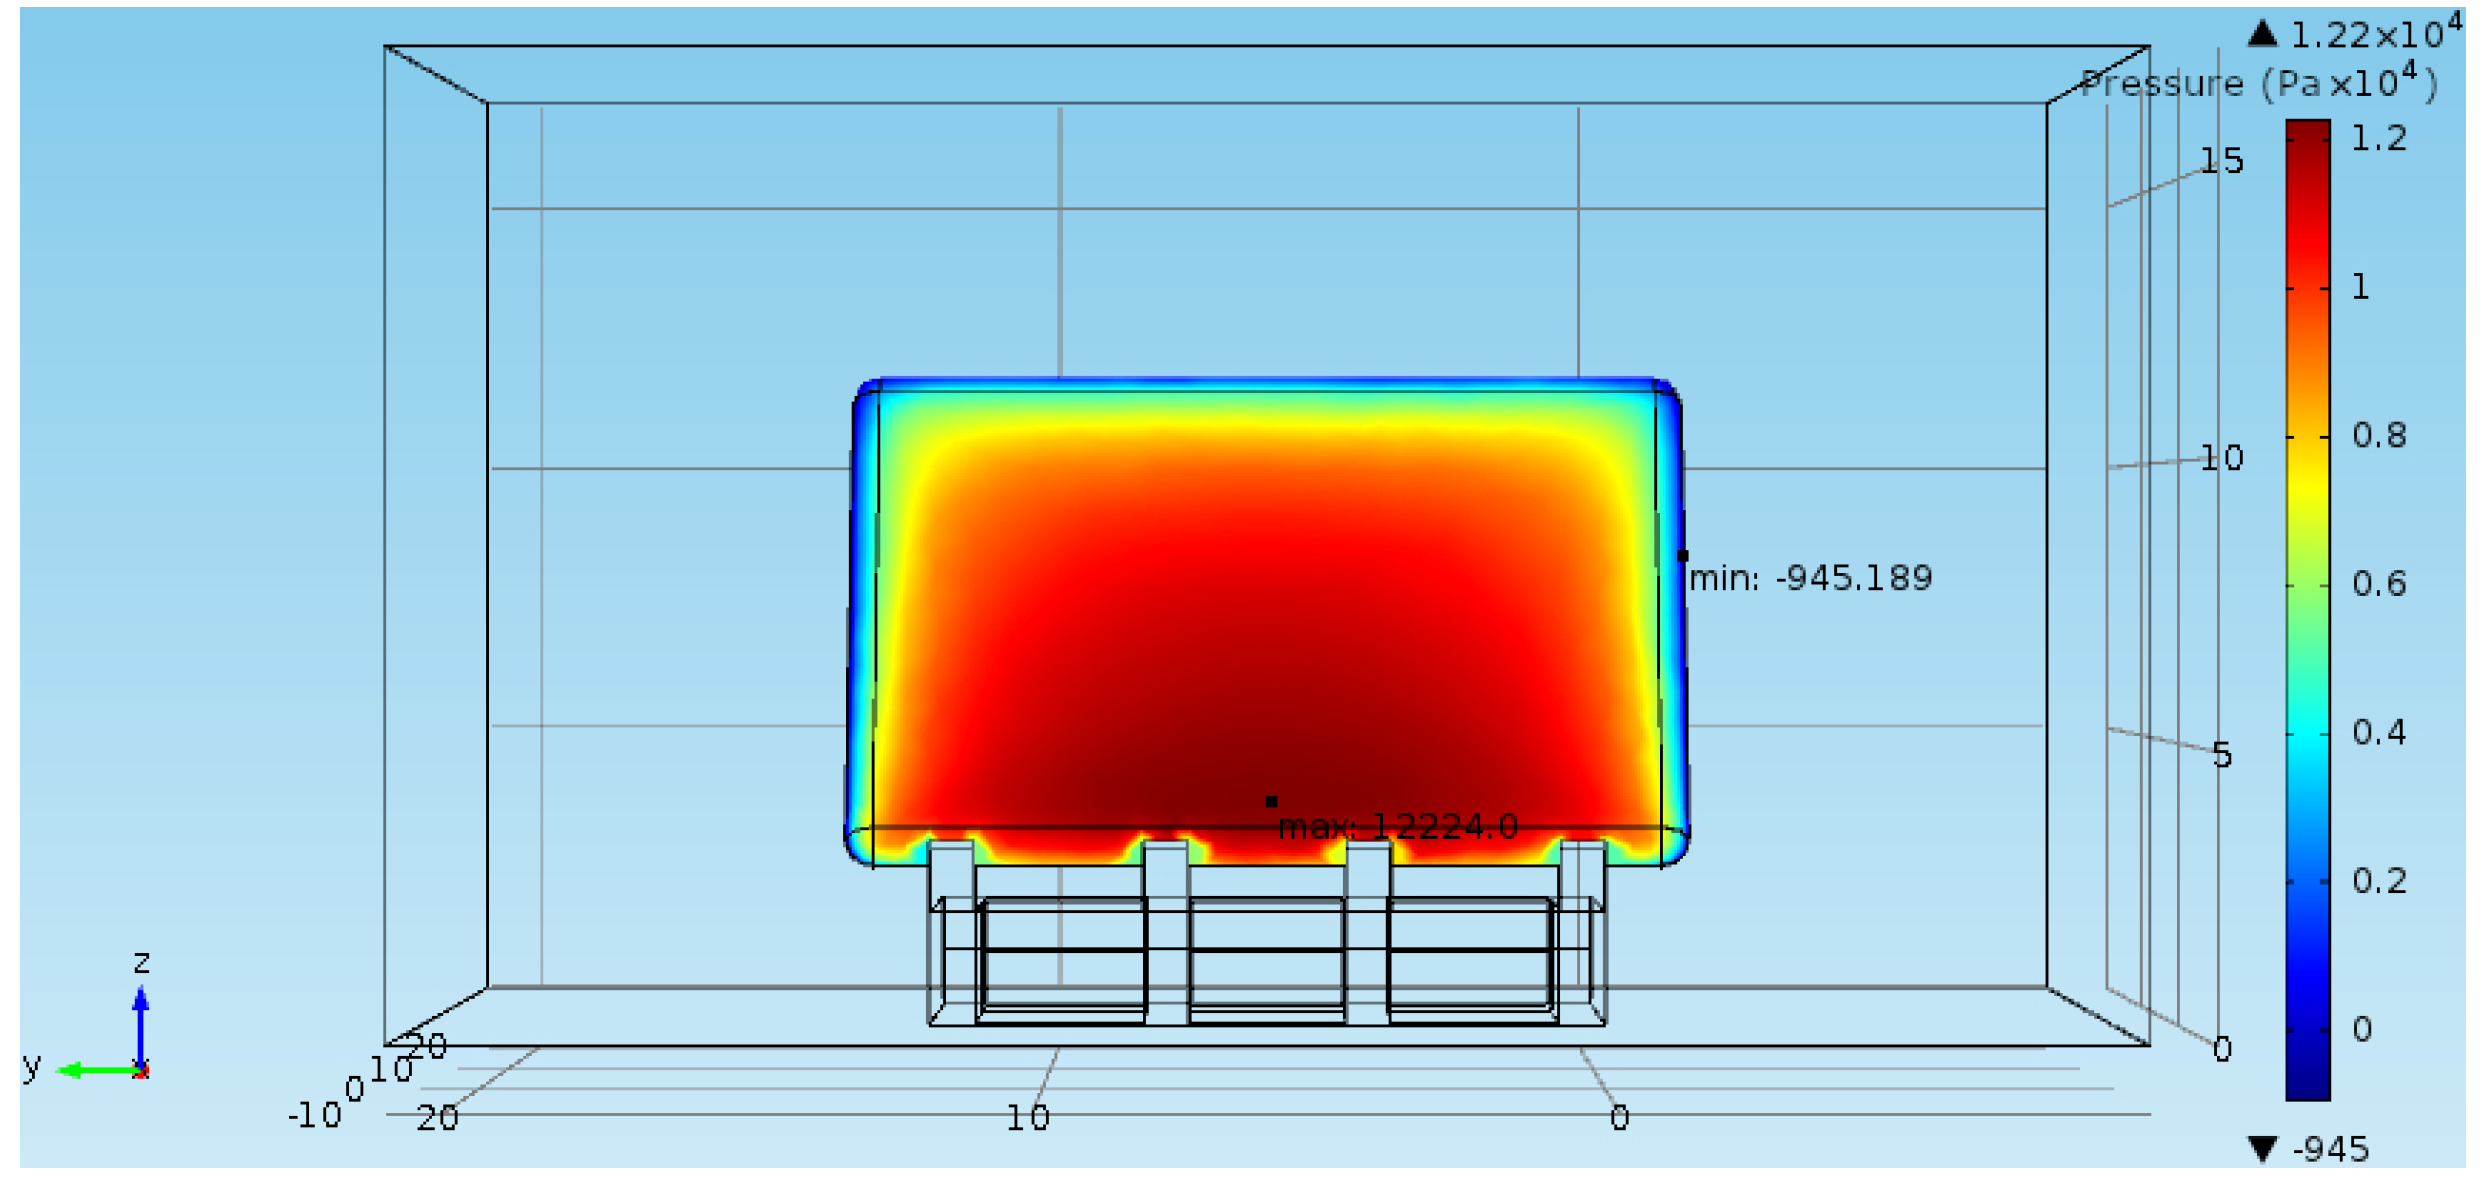
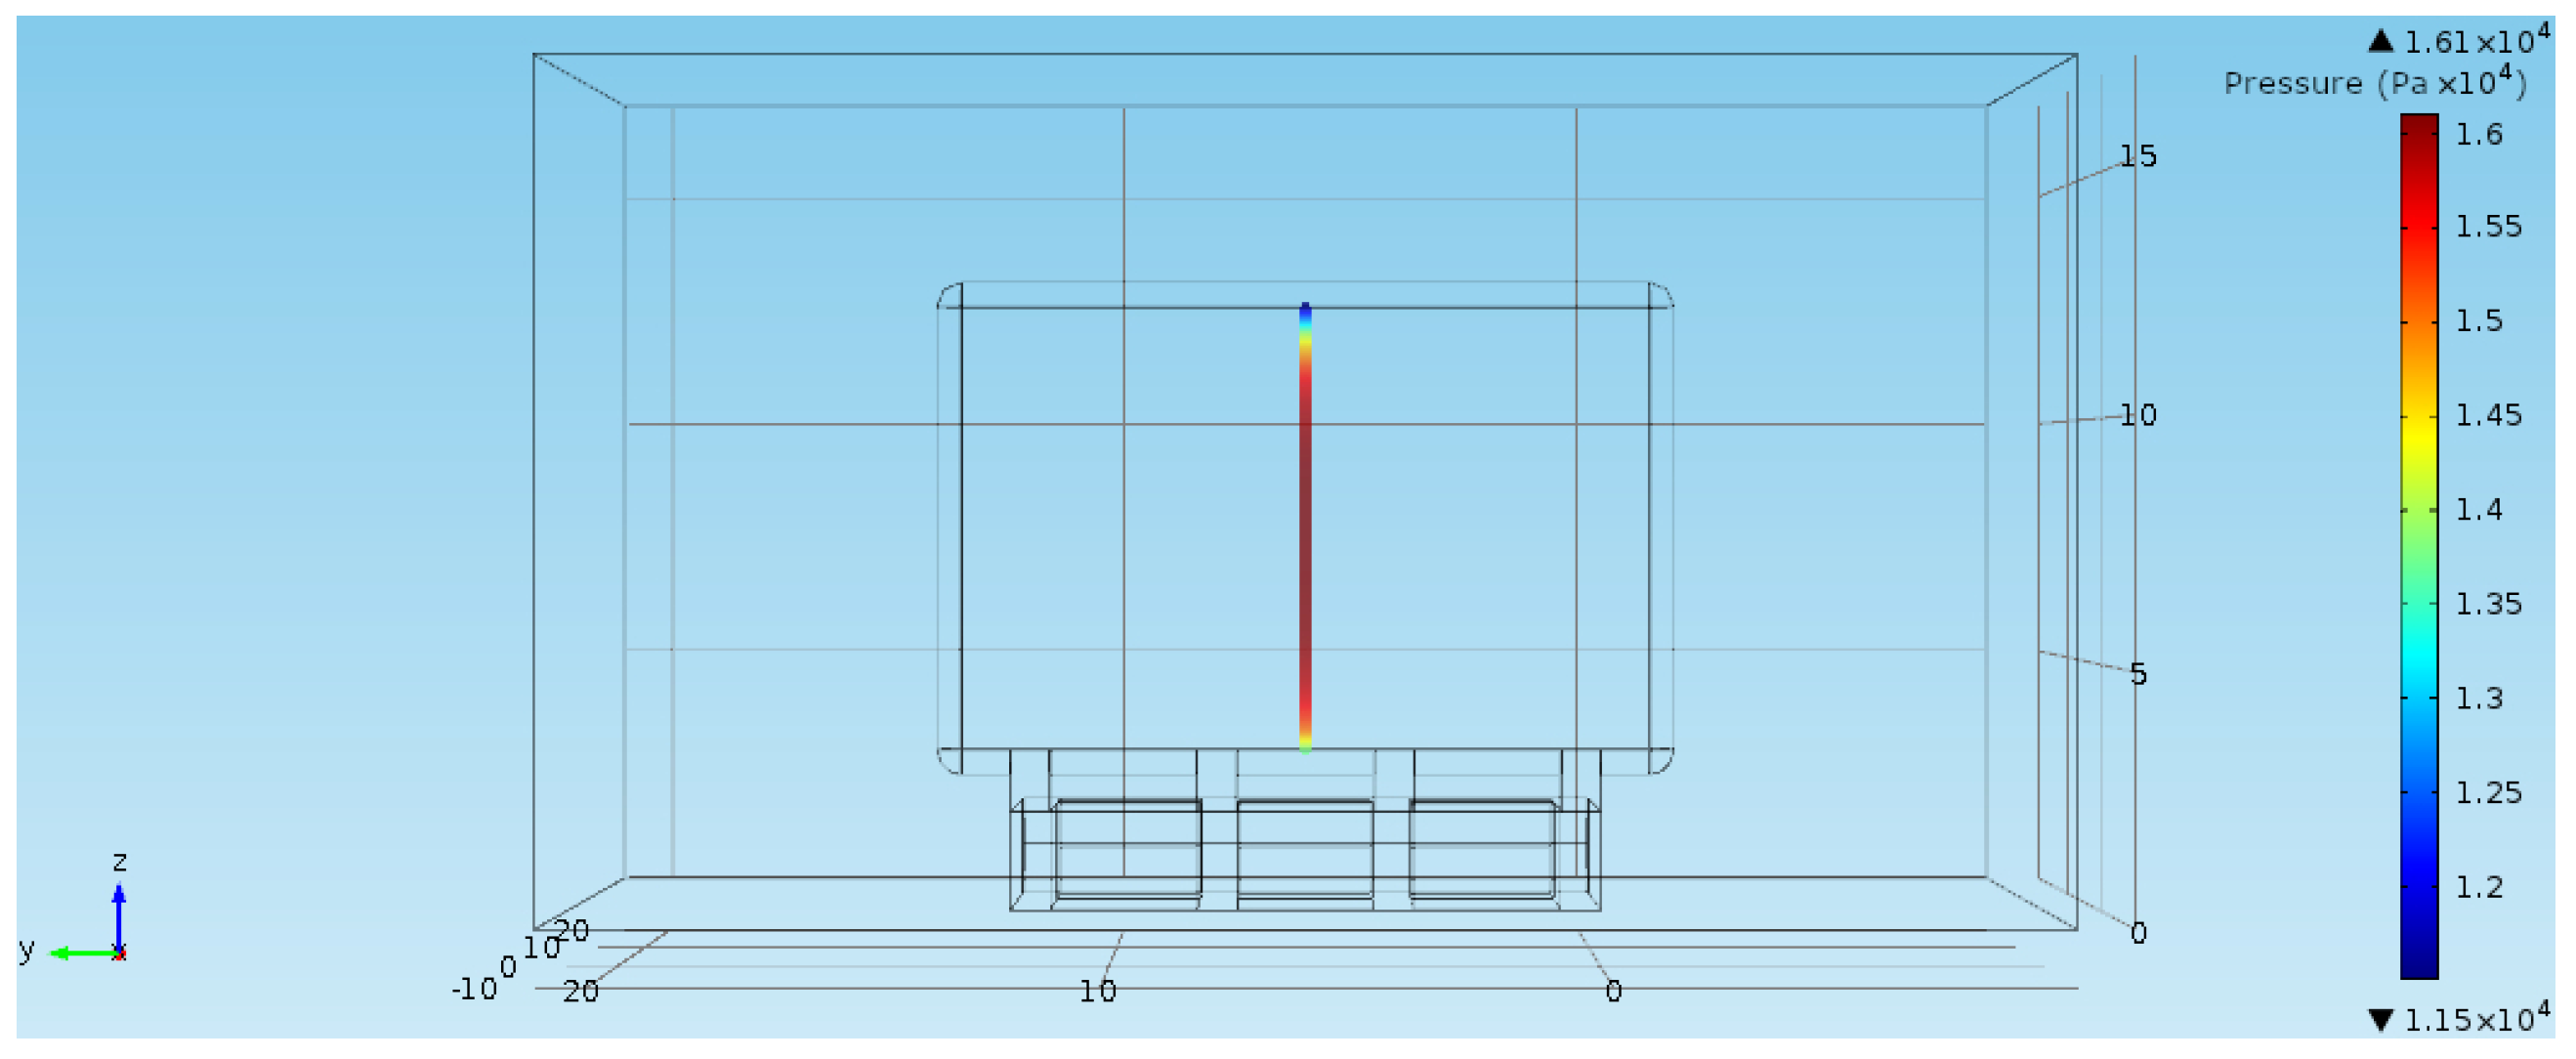
3.4. Preliminary Assessment of the Mechanical Behavior of the WEC System

Based on the pressure distribution applied on the panel extracted from COMSOL Multiphysics simulations, the static behavior of the WEC system was studied considering:
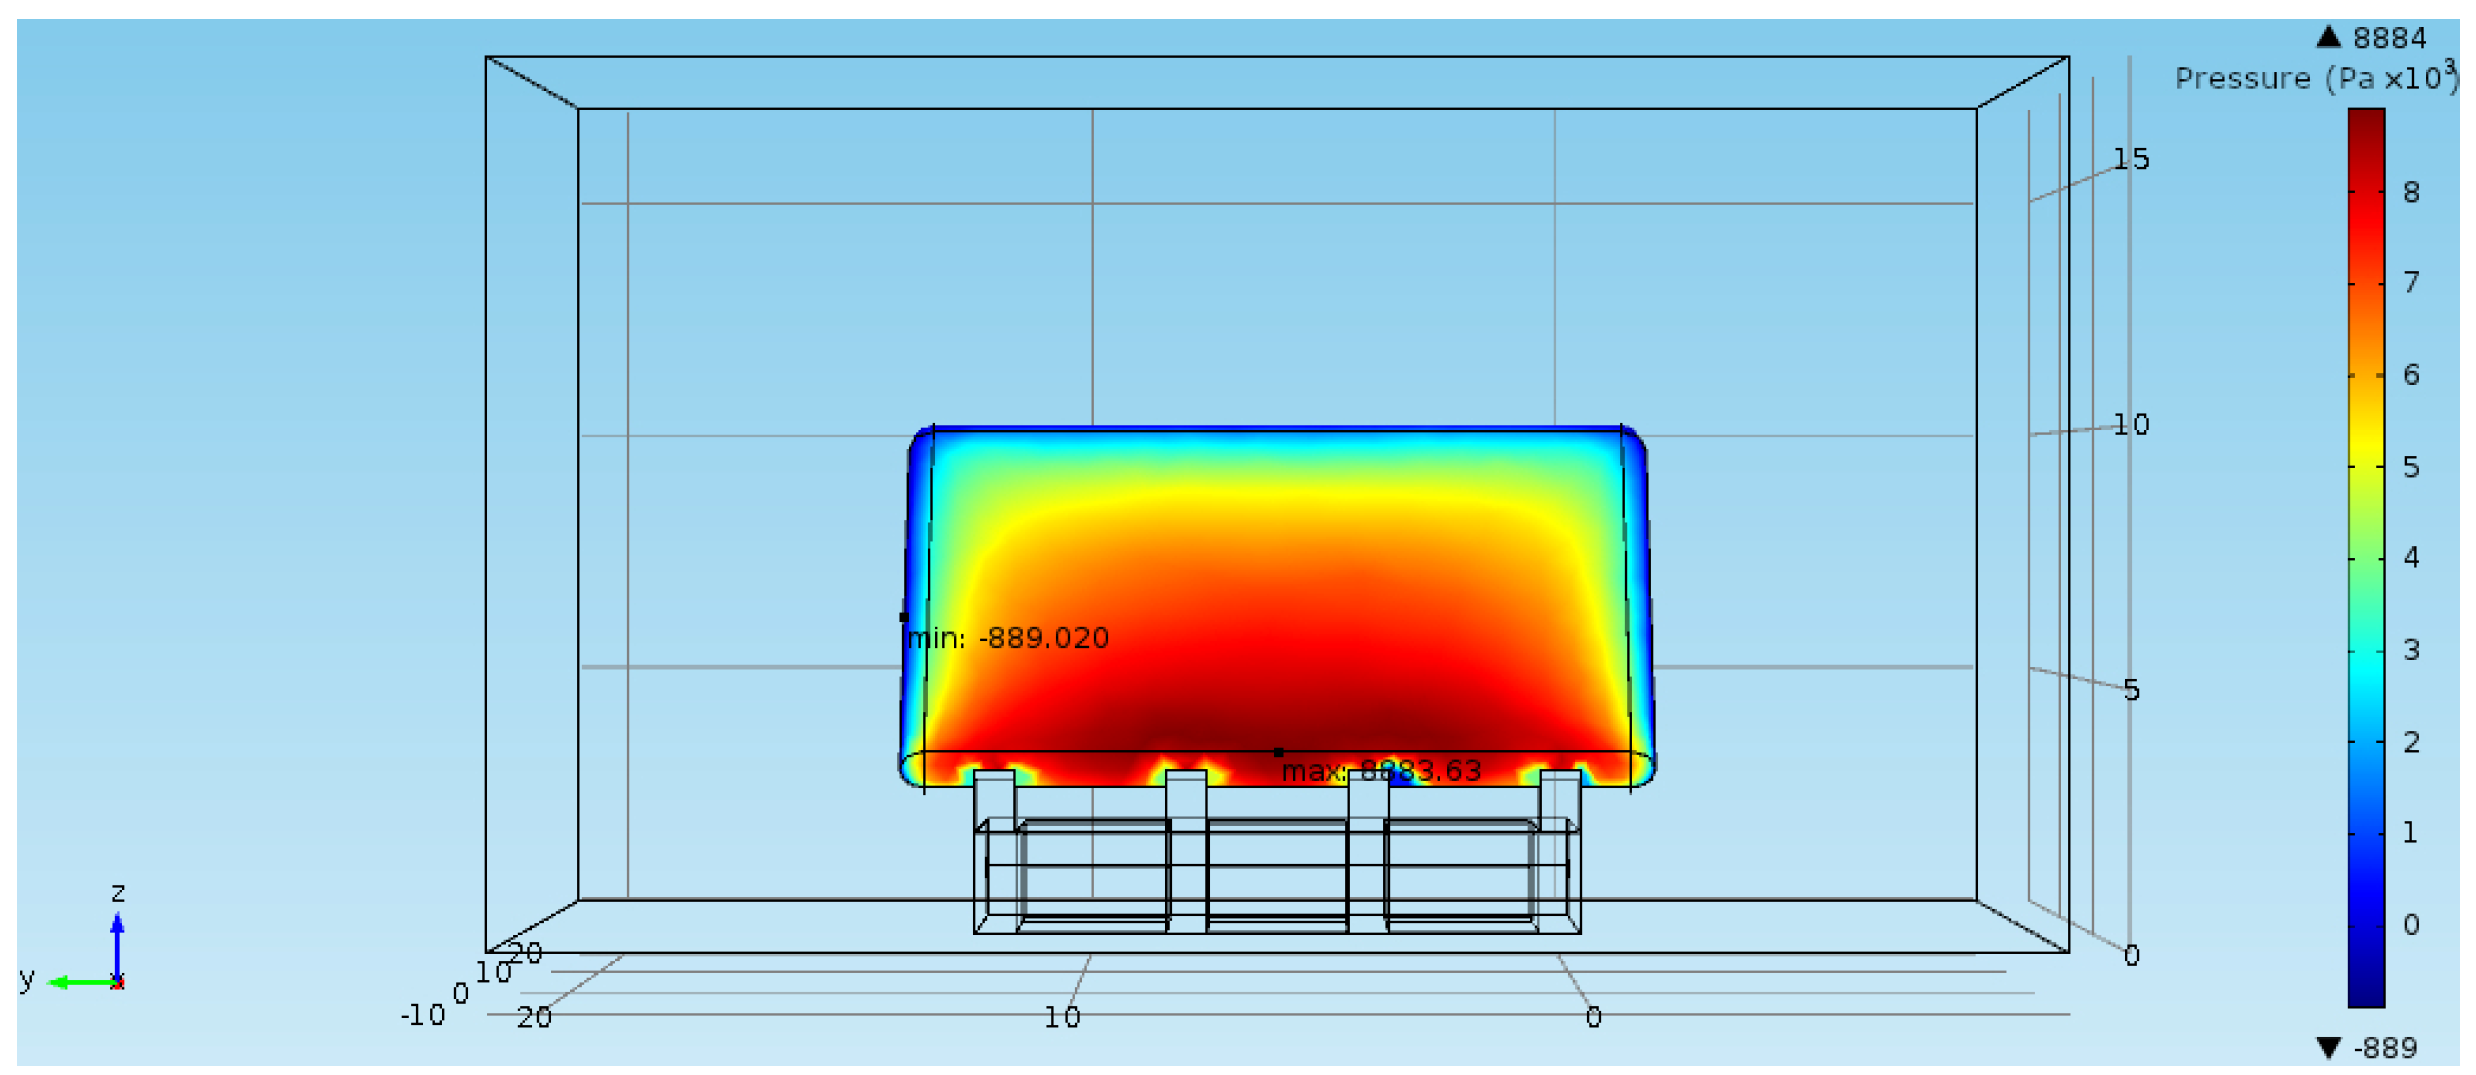
  • The pressure distribution on the panel due to the maximum swell scenario;
  • The hydrostatic pressure;
  • Gravity.
This static investigation was carried out with SolidWorks software for the five cases of inclination. Thus, it was possible to study the behavior of the structure facing the loading of the maximum swell and identify possible critical points of the structure.
An example of a simulation result is presented in Figure 18, showing the distribution of the von Mises stresses in the WEC system for the panel inclined at 30°.
Table 10 presents the maximum von Mises stress values obtained for each panel inclination, for both the HDPE panel and the reinforcements made of stainless steel.
The results show that the stress values obtained in the HDPE panel are higher near the reinforcements than on the rest of the panel. This is due to the fact that the panel is pressed against the reinforcement by the pressure of the wave. Simulation results also show that for the HDPE panel and steel reinforcements, the 0° inclination is the most critical situation of the panel, in which the elastic limits of both materials were exceeded. It would, therefore, be important to review the project of the panel and the structure of the reinforcement more locally in order to withstand the extreme conditions (maximum swell scenario). Moreover, due to the simplifications and assumptions for the analysis of the WEC system, it is worth mentioning that the results may show inaccuracy to some degree, which is an interesting point for future works.

4. Conclusions

The main objective of this work was to propose a numerical modeling methodology to assess the mechanical behavior of a WEC system to be applied offshore the Fernando de Noronha Island (Pernambuco, Brazil). In order to evaluate the different wave conditions under which the system would operate, oceanographic data collected in situ on the platform of Fernando de Noronha were analyzed. Different types of swells were highlighted: an operational swell (likely to be formed more frequently) for the energy potential of the area and a maximum swell (arising during storms) to verify the structure. Thereafter, linear wave theories (Airy and second-order Stokes) were used to determine the velocity profiles of the types of waves. The respective wave velocity profiles were calculated as a function of the depth as well as of their oscillation.
The next step consisted in performing flow simulations on the simplified WEC structure using COMSOL Multiphysics software, in order to obtain the pressure distributions due to the fluid on the panel. These simulations were carried out considering the different inclinations of the WEC system panel to subsequently determine the critical positions. At last, these pressure distributions were implemented to perform a static analysis of the system using a FE model in SolidWorks. In this way, the simulation of the behavior of the structure in the most critical case (maximum swell) and for different cases of inclination was achieved.
In a first approach, the maximum stress results were below the elastic limits of the materials for all inclinations, except for the panel blocked at 0° (in relation to the vertical axis). Indeed, this situation only appears in the event of a breakdown and during a strong swell as well as in very specific zones, requiring further studies for enhancements. A new architecture of the part in question may be considered to ensure the resistance of the whole system. This methodology may also be improved by using a spectral study of the oceanographic records to provide a more realistic model of the sea state. The simulation of the flow on the structure could also be refined in further investigations by taking turbulence into account. The ability of the wave energy converter to resist the extreme sea conditions requires the consideration not only of the structure of the device, but also of the load impact on the hydraulic system. Therefore, additional analyses of the structure including the remaining components, e.g., the hydraulic cylinders, may also be performed for accuracy improvements and results reliability, as well as for design optimizations. The in-depth study of the fundamental formula of marine energy conversion systems, applied to this system, would allow a dynamic model of the behavior of the structure at sea to be developed.
It is important to emphasize that wave energy conversion devices need to be designed in different types and sizes according to the different wave characteristics of the region. From a practical point of view, further work could investigate the optimal design size of the oscillating plate applicable to the target sea area to achieve the maximum wave energy utilization.
This study tends to motivate the development and installation of marine energy conversion systems, also contributing to future studies of hybrid systems that can provide electrical energy and decrease the emission of greenhouse gases on the island of Fernando de Noronha.

Author Contributions

Conceptualization, N.B. and A.C.d.S.; methodology, N.B. and A.C.d.S.; software, A.C.; validation, A.C.; formal analysis, N.B., A.C.d.S. and A.C.; investigation, A.C.; resources, N.B., A.C.d.S. and M.A.; data curation, A.C., N.B. and A.C.d.S.; writing—original draft preparation, N.B., A.C.d.S. and V.M.B.; writing—review and editing, N.B., A.C., A.C.d.S. and V.M.B.; visualization, N.B. and A.C.d.S.; supervision, N.B. and A.C.d.S.; project administration, N.B. and A.C.d.S.; funding acquisition, N.B., A.C.d.S. and M.A. All authors have read and agreed to the published version of the manuscript.

Funding

This research was funded by CAPES (BRAFITEC Program—Projects: NER 155/14 and AMINOV-MECA 253/19), FACEPE (APQ-1361-3.05/12) and CNPq (MCTI/CNPQ/Universal 14/2014—460973/2014-2).

Institutional Review Board Statement

Not applicable.

Data Availability Statement

Not applicable.

Acknowledgments

The authors would like to thank CAPES (BRAFITEC Program—Projects: NER 155/14 and AMINOV-MECA 253/19), FACEPE (APQ-1361-3.05/12) and CNPq (MCTI/CNPQ/Universal 14/2014—460973/2014-2) for the financial support. M.A. thanks the Brazilian Research Network on Global Climate Change—Rede CLIMA (FINEP-CNPq 437167/2016-0) Grant 01.13.0353-00 and the Brazilian National Institute of Science and Technology for Tropical Marine Environments—INCT AmbTropic (CNPq/FAPESB 565054/2010-4 and 8936/2011) for their support.

Conflicts of Interest

The authors declare no conflict of interest. The funders had no role in the design of the study; in the collection, analyses, or interpretation of data; in the writing of the manuscript; or in the decision to publish the results.

References

  1. Baruch-Mordo, S.; Kiesecker, J.M.; Kennedy, C.M.; Oakleaf, J.R.; Opperman, J.J. From Paris to practice: Sustainable imple-mentation of renewable energy goals. Environ. Res. Lett. 2019, 14, 024013. [Google Scholar] [CrossRef]
  2. Mele, M.; Gurrieri, A.R.; Morelli, G.; Magazzino, C. Nature and climate change effects on economic growth: An LSTM experiment on renewable energy resources. Environ. Sci. Pollut. Res. 2021, 28, 41127–41134. [Google Scholar] [CrossRef] [PubMed]
  3. Gielen, D.; Gorini, R.; Wagner, N.; Leme, R.; Gutierrez, L.; Prakash, G.; Asmelash, E.; Janeiro, L.; Gallina, G.; Vale, G.; et al. Global Energy Transformation: A roadmap to 2050; International Renewable Energy Agency: Abu Dhabi, United Arab Emirates, 2018. [Google Scholar]
  4. Sandu, M.; Gribincea, A. Trends on the global energy Market. J. Res. Trade Manag. Econ. Dev. 2019, 11, 119–129. [Google Scholar]
  5. Jin, S.; Greaves, D. Wave energy in the UK: Status review and future perspectives. Renew. Sustain. Energy Rev. 2021, 143, 110932. [Google Scholar] [CrossRef]
  6. Nguyen, P.Q.P.; Dong, V.H. Ocean Energy—A Clean Energy Source. Eur. J. Eng. Technol. Res. 2019, 4, 5–11. [Google Scholar] [CrossRef]
  7. International Renewable Energy Agency (IRENA). Renewable Power Generation Costs in 2014. Available online: http://www.irena.org/ (accessed on 1 September 2022).
  8. Qiao, D.; Haider, R.; Yan, J.; Ning, D.; Li, B. Review of Wave Energy Converter and Design of Mooring System. Sustainability 2020, 12, 8251. [Google Scholar] [CrossRef]
  9. Pelc, R.; Fujita, R.M. Renewable energy from the ocean. Mar. Policy 2002, 26, 471–479. [Google Scholar] [CrossRef]
  10. Czech, B.; Bauer, P. Wave Energy Converter Concepts: Design Challenges and Classification. IEEE Ind. Electron. Mag. 2012, 6, 4–16. [Google Scholar] [CrossRef]
  11. Isaacs, J.; Seymour, R. The ocean as a power resource. Int. J. Environ. Stud. 1973, 4, 201–205. [Google Scholar] [CrossRef]
  12. Gunn, K.; Stock-Williams, C. Quantifying the global wave power resource. Renew. Energy 2012, 44, 296–304. [Google Scholar] [CrossRef]
  13. Izadparast, A.H.; Niedzwecki, J.M. Estimating the potential of ocean wave power resources. Ocean Eng. 2011, 38, 177–185. [Google Scholar] [CrossRef]
  14. Ramezanzadeh, S.; Ozbulut, M.; Yildiz, M. A Numerical Investigation of the Energy Efficiency Enhancement of Oscillating Water Column Wave Energy Converter Systems. Energies 2022, 15, 8276. [Google Scholar] [CrossRef]
  15. Mørk, G.; Barstow, S.; Kabuth, A.; Pontes, M.T. Assessing the global wave energy potential. In Proceedings of the 29th International Conference on Ocean, Offshore Mechanics and Arctic Engineering (OMAE), Shanghai, China, 6–11 June 2010. [Google Scholar]
  16. Rusu, E. Evaluation of the Wave Energy Conversion Efficiency in Various Coastal Environments. Energies 2014, 7, 4002–4018. [Google Scholar] [CrossRef]
  17. Rusu, E.; Onea, F. Estimation of the wave energy conversion efficiency in the Atlantic Ocean close to the European islands. Renew. Energy 2016, 85, 687–703. [Google Scholar] [CrossRef]
  18. Shadman, M.; Silva, C.; Faller, D.; Wu, Z.; de Freitas Assad, L.P.; Landau, L.; Levi, C.; Estefen, S.F. Ocean Renewable Energy Potential, Technology, and Deployments: A Case Study of Brazil. Energies 2019, 12, 3658. [Google Scholar] [CrossRef]
  19. Prasad, K.A.; Chand, A.A.; Kumar, N.M.; Narayan, S.; Mamun, K.A. A Critical Review of Power Take-Off Wave Energy Technology Leading to the Conceptual Design of a Novel Wave-Plus-Photon Energy Harvester for Island/Coastal Communities’ Energy Needs. Sustainability 2022, 14, 2354. [Google Scholar] [CrossRef]
  20. Wu, J.; Qin, L.; Chen, N.; Qian, C.; Zheng, S. Investigation on a spring-integrated mechanical power take-off system for wave energy conversion purpose. Energy 2022, 245, 123318. [Google Scholar] [CrossRef]
  21. Stansby, P.; Moreno, E.C.; Draycott, S.; Stallard, T. Total wave power absorption by a multi-float wave energy converter and a semi-submersible wind platform with a fast far field model for arrays. J. Ocean Eng. Mar. Energy 2021, 8, 43–63. [Google Scholar] [CrossRef]
  22. Rusu, E.; Onea, F. A review of the technologies for wave energy extraction. Clean Energy 2018, 2, 10–19. [Google Scholar] [CrossRef]
  23. Cornett, A.M. A Global Wave Energy Resource Assessment. In Proceedings of the Eighteenth International Offshore and Polar Engineering Conference, Vancouver, Canada, 6–11 July 2008. [Google Scholar]
  24. Cagninei, A.; Raffero, M.; Bracco, G.; Giorcelli, E.; Mattiazzo, G.; Poggi, D. Productivity analysis of the full scale inertial sea wave energy converter prototype: A test case in Pantelleria Island. J. Renew. Sustain. Energy 2015, 7, 061703. [Google Scholar] [CrossRef]
  25. Waveroller the Tidal Wave of Dcns. Available online: https://www.econology.info/forums/energies-renewable/waveroller-thetidal-wave-of-dcns-t11924.html (accessed on 1 September 2022).
  26. Edlund, M. Introduction to Minesto. In Proceedings of the North Sea Climate Conference, Marstrand, Sweden, 26 June 2019. [Google Scholar]
  27. U.S. Energy Information Administration (EIA). Based on EIA’s International Energy Statistics and Data from the International Energy Agency. 2021. Available online: https://www.eia.gov/todayinenergy/detail.php?id=49436 (accessed on 10 January 2023).
  28. Arinaga, R.A.; Cheung, K.F. Atlas of global wave energy from 10 years of reanalysis and hindcast data. Renew. Energy 2012, 39, 49–64. [Google Scholar] [CrossRef]
  29. WWF-BRASIL. Geração de Energia em Fernando de Noronha. Alternativas para a Diminuição de Emissões de CO2 No Trans-Porte e Eletricidade. 2021. Available online: https://wwfbr.awsassets.panda.org/downloads/geracao_de_energia_fernando_de_noronha_versao_web_1.pdf (accessed on 20 January 2023).
  30. Kabeyi, M.J.B.; Olanrewaju, O.A. Sustainable Energy Transition for Renewable and Low Carbon Grid Electricity Generation and Supply. Front. Energy Res. 2022, 9, 743114. [Google Scholar] [CrossRef]
  31. Tiago, T.S.; Luciana, M. Optimization of Energy Hybrid System for an Isolated Community in Brazil. Int. J. Renew. Energy Res. 2016, 6, 1476–1481. [Google Scholar]
  32. Silveira, E.F.; de Oliveira, T.F.; Junior, A.C.P.B. Hybrid energy scenarios for Fernando de Noronha archipelago. Energy Procedia 2015, 75, 2833–3838. [Google Scholar]
  33. Lassalle, J.M.; Martínez, D.F. Optimisation of hybrid renewable energy systems on islands: A review. Isl. Stud. J. 2022, 17, 221–242. [Google Scholar] [CrossRef]
  34. Onea, F.; Rusu, E. An Evaluation of Marine Renewable Energy Resources Complementarity in the Portuguese Nearshore. J. Mar. Sci. Eng. 2022, 10, 1901. [Google Scholar] [CrossRef]
  35. Roy, A.; Auger, F.; Dupriez-Robin, F.; Bourguet, S.; Tran, Q.T. Electrical Power Supply of Remote Maritime Areas: A Review of Hybrid Systems Based on Marine Renewable Energies. Energies 2018, 11, 1904. [Google Scholar] [CrossRef]
  36. Ruellan, M. Méthodologie de Dimensionnement D’un Système de Recuperation de L’énergie des Vagues. École Normale Supéri-Eure de Cachan. Ph.D. Thesis, École Normale Supérieure de Cachan-ENS Cachan, Gif-sur-Yvette, France, 2007. [Google Scholar]
  37. Beirão, P.J.B.F.N.; Malça, C.M.D.S.P. Design and analysis of buoy geometries for a wave energy converter. Int. J. Energy Environ. Eng. 2014, 5, 91. [Google Scholar] [CrossRef]
  38. Susbielles, G.; Bratu, C.; Cavanié, M. Vagues et Ouvrages Pétroliers en Mer; Éditions TECHNIP: Paris, France, 1981. [Google Scholar]
Figure 1. Study area, i.e., Fernando de Noronha Island, Brazil (adapted from https://mapstyle.withgoogle.com/ (accessed on 26 December 2022) on the left) and coordinates of the oceanographic survey (on the right).
Energies 16 01711 g001
Figure 2. Diagram of the occurrence of waves (in % during the one-year time frame) according to their height (Hs) and period (Tp).
Energies 16 01711 g002
Figure 3. Diagram of wave power (W/m) versus wave height (Hs), and peak period (Tp).
Energies 16 01711 g003
Figure 4. Diagram of the occurrence of waves (in % during the one-year time frame) according to their maximum height (Hmax) relative to peak periods (Tp).
Energies 16 01711 g004
Figure 5. Higher range of maximum wave heights (Hmax) occurrence (in % during the one-year time frame) relative to peak periods (Tp).
Energies 16 01711 g005
Figure 6. Computer-aided design (CAD) model of the WEC performed in SolidWorks.
Energies 16 01711 g006
Figure 7. Physical model of the WEC enclosed in a fluid developed in COMSOL Multiphysics.
Energies 16 01711 g007
Figure 8. Mesh distribution in the physical model.
Energies 16 01711 g008
Figure 9. Evolution of the water pressure on the panel as a function of x for different mesh sizes.
Energies 16 01711 g009
Figure 10. Representation of the pressure applied by the fluid on the panel (mesh size 0.2 m).
Energies 16 01711 g010
Figure 11. Horizontal velocity profile Umax vs. depth for the two types of swells.
Energies 16 01711 g011
Figure 12. Representation of the velocity (m/s) profile of the maximum swell case on a 30° inclined panel.
Energies 16 01711 g012
Figure 13. Pressure (Pa) distribution on a 0° panel.
Energies 16 01711 g013
Figure 14. Pressure (Pa) distribution on a panel inclined by 30°.
Energies 16 01711 g014
Figure 15. Pressure (Pa) distribution on a 45° inclined panel.
Energies 16 01711 g015
Figure 16. Representation of the pressure (Pa) extraction line (0° panel).
Energies 16 01711 g016
Figure 17. Pressure distribution on the panel vs. the height z.
Energies 16 01711 g017
Figure 18. Von Mises stress (N/m2) distribution in the WEC system (30° panel): (a) general overview; (b) zoomed in at the center (purple box).
Energies 16 01711 g018
Table 1. Materials properties of the different components of the WEC system [30].
ComponentMaterialsYoung’s Modulus (MPa)Poisson’s
Coefficient
Yield Strength (MPa)Density (kg/m3)
Hydraulic cylinders and vertical reinforcementsStainless steel AISI 316193,0000.272008000
Panel shellHigh-density polyethylene18600.4630950
Internal part of the panelPolyurethane foam24100.394045
BaseConcrete25,0000.3330002400
Table 2. Mass balance of the WEC system.
ComponentsMaterialsVolume (m3)Weight (kg)
Panel (shell)HDPE3.473299
Panel (foam)Polyurethane foam119.245366
ReinforcementsStainless steel AISI 3160.191489
BaseConcrete124.58286,544
Table 3. Dimensions of the simplified geometry modeled in COMSOL Multiphysics.
Geometry of Each PartLength x (m)Height z (m)Width y (m)
Fluid301730
Panel15101
Base12211
Table 4. Mesh characteristics used in the numerical model.
Mesh
Characteristics
Maximum
Size (m)
Minimum
Size (m)
Fine Area
Resolution (m)
Total Number
of Elements
Mesh 1: “Fluid”2.8010.30109,415
Mesh 2: “System”1.650.120.70
Table 5. Results of the mesh convergence study for fluid inlet velocity of 1 m/s and hexagonal elements.
Mesh
Size
Number of NodesNumber of
Elements
Computational TimeMaximum Pressure
on the Panel (Pa)
Auto652631,9324 min3.206
0.50 m82,879459,43710 min3.526
0.30 m366,6922,095,03940 min3.635
0.25 m628,3123,616,18954 min3.635
0.20 m1,217,5907,057,7182 h 30 min3.739
0.15 m2,861,03016,705,9944 h 30 min3.739
Table 6. Comparison between ANSYS and COMSOL Multiphysics results.
Inlet Velocity (m/s)Maximum Pressure on the Panel (Pa)
ANSYSCOMSOL
0.5928912
1.036963581
1.583558057
2.014,79014,423
3.033,42333,055
Number of elements7,057,71830,919
Table 7. Summary of the boundary conditions applied to the model.
Boundary ConditionsTypeValues
Entrance sideVelocity U = f(z)U = f(z)
Exit sidePressure1 Pa
Lateral sideSymmetries-
Upper sideConstant speed in the direction of flowUmax = f(17)
Lower sideSliding wall-
SystemSliding wall-
Table 8. Characteristics of the two wave scenarios.
ParametersMaximum SwellOperational Swell
Wave height, H (m)61.25
Peak period, Tp (s)≥1110.5
Wavelength, L (m)129129
Table 9. Polynomials and respective correlation coefficient obtained for each panel inclination.
Panel InclinationEquation of the Trend CurveCorrelation Coefficient
−45°P(z) = −3.1481z6 + 129.93z5 − 2207.3z4 + 19,730z3 − 97,880z2 + 255,221z − 264,0860.9998
−30°P(z) = −1.1388z6 + 51.306z5 − 952.77z4 + 9301.7z3 − 50,284z2 + 142,466z − 153,3610.9989
P(z) = −0.6235z6 + 28.484z5 − 535.27z4 + 5287.1z3 − 28,933z2 + 83,228z − 82,4850.9987
30°P(z) = −0.5815z6 + 24.932z5 − 444.82z4 + 4205.3z3 − 22,141z2 + 61,056z − 56,2160.9993
45°P(z) = −1.6868z6 + 67.455z5 − 1117.4z4 + 9775.6z3 − 47,489z2 + 120,496z − 115,1690.9995
Table 10. Maximum von Mises stress (in MPa) obtained for each panel inclination.
Panel InclinationHDPE PanelSteel Reinforcements
(Value—Location)
−45°23154—Cylinder body
−30°11113—Reinforcements
76316—Reinforcements
30°24118—Cylinder body/base connection
45°2782—Reinforcements
Disclaimer/Publisher’s Note: The statements, opinions and data contained in all publications are solely those of the individual author(s) and contributor(s) and not of MDPI and/or the editor(s). MDPI and/or the editor(s) disclaim responsibility for any injury to people or property resulting from any ideas, methods, instructions or products referred to in the content.

