1. Introduction
Wind farm equipment manufactured by a WF, such as wind turbines and block transformers, is a complex technical facility that runs continuously. If the WF equipment is not being used, it remains in a state of operational readiness for use. Achieving a high level of technical condition for these devices’ performance necessitates the use of a specific operating strategy. The renewal strategy (maintenance of fitness) of WF equipment is designed to minimize the cost of implementing the process of repair or renewal of operational characteristics with the greatest possible efficiency. Reducing the cost of the repair process is directly related to shortening the amount of time required to refresh these devices. The issue of minimizing the cost of the process of renewing operating characteristics is frequently discussed in the literature. Developing a sensible and cost-effective program for the servicing of wind farm equipment is a challenging and expensive endeavor.
WF owners seek new solutions to support the process of effectively managing their operations. One such approach facilitates the organization of the procedure for managing the operation of WF equipment. The author team created its SERV expert program to help organize the process of renewing the operating characteristics of WF machinery integrated into the planned material flow system. The SERV system is an advanced artificially intelligent and expertly programmed computer system. Based on diagnostic data for wind farm equipment, the SERV system provides support for organizing the renewal process of WF equipment and determines the structure of the refusal system for the equipment. The SERV system significantly shortens the time required to replace WF equipment. The strategy for organizing the WF equipment renewal process is that only those functional elements of the WF system that require it are renewed, and only to a limited extent.
According to the publications [
1,
2,
3,
4,
5,
6,
7,
8], like statistical quality control, reliability theory is an area of research grounded in probability and statistics; its subfields include reliability mathematics and reliability engineering. The challenge of a simulation assessment of the operational reliability of WF (wind farm) equipment is presented in the article. The use of mean time between failures (MTBF) distinguishes this article from others. Studying the operation of complicated technical objects, such as the WF (wind farm) and wind turbines (WTG) and electrical subsystems (main power point), presents a substantial cognitive challenge. People who own or use WFs are particularly affected by this problem. Organizational and technical renewal actions in the WF equipment maintenance system need to be addressed. To maximize the benefits of these investments, however, a systematic approach to WF renewal is required. Research of this nature leads to the creation of effective methods and guidelines for managing PE facilities. None of the aforementioned problems have been presented in the literature in such a holistic approach using mean time between failures (MTBF) figures and “reliability management.” The subject of this article is “reliability mathematics,” which is a tool and language for describing reliability. “Reliability engineering” is a rigorous procedure for ensuring that products are built with durability in mind during every stage of the manufacturing process; for example, DNVGL is the world’s largest classification society and a registrar with an internationally accredited classification society. DNVGL-ST-0145 reliability for offshore substations can be defined as follows [
9,
10].
According to the literature [
11,
12,
13,
14,
15,
16,
17,
18,
19,
20,
21,
22,
23,
24,
25,
26,
27,
28], a power distribution system is made up of numerous pieces of electrical equipment, and any one of them failing can result in power outages. If a system is made up of several interconnected pieces, the failure of any one of them will lead to the collapse of the entire system as a consequence [
29]. The two most common ways that reliability is described are the frequency of system outages and the anticipated length of outages per year, or the number of hours of outages per year under normal operation. Overall system reliability indices are calculated for each node in the system using commercial reliability software by collecting data on component failures, downtime rates, and both instantaneous and continuous system downtime. This enables researchers to determine how susceptible these indices are to changes.
One method for evaluating the dependability of technical objects is to measure time parameters on a real-world operating process. Weibull’s distribution, which includes a cumulative distribution function and a probability density function, is used to characterize the fluctuation in the amount of time needed to repair damage [
30,
31]. On the other hand, the literature’s total distribution of the wind speed disparity between two wind turbines [
32,
33] increases very quickly to 1; if both turbines are functioning properly, this would imply that there is very little variation in wind speed between the two turbines. If a single turbine is impacted, the cumulative Weibull distribution resembles a diagonal or linear curve.
A paper [
34] describes failure modes and effects analysis (FMEA), a quantitative way for evaluating reliability that is useful for quantitative evaluation of reliability design [
35]. When a distribution system causes a load point to shut down, the FMEA technique is used to determine the components of the distribution system’s reliability parameters and system architecture. The FMEA method calculates dependableness of the system indicators based on an annual dependability index (λ), based on the reliability parameters of distribution system components and system architecture, the mean time to repair (MTTR), and the mean time between failures (MTBF). The system reliability index is calculated to aid in decision-making.
The articles by Nakagawa, Pokoradi, and others [
36,
37,
38,
39,
40,
41] discuss the difficulties in modeling the procedure of operating technical facilities. This research provides a mathematical strategy for simulating this process. In this study, we investigate the subject of how to determine the efficiency of a maintenance operation that is so well organized. This objective is served by the simulation test software that is included in the paper. The program of research consists of establishing indicators for the qualitative evaluation of the object regeneration in the process of operation, as well as determining test input data that provide the size of the operation time of the technical object, which is the duration of the regeneration (repairs) and use of the object. As an illustration to support the findings of the research, simulation tests on the effects of the operation process with the reclamation of a technical object in an intelligent system with an artificial neural network were utilized as a supporting example.
Reliability is discussed in a study by Dyduch, Epstein, et al., and Siergiejczyk et al., and operational analysis is required [
42,
43,
44]. In their courses, they discuss the operational and reliability analyses of difficult technical and non-technical objects. Examples include transportation telematics electricity grids (PSS in TTD). The text of the article describes the approaches used in power supply systems, including PSS in TTD from the main and secondary ones. The bulletin lists and describes several solutions used in energy systems. This enables the identification of connections that characterize the security risk posed by another system in its fully functional condition. A qualitative assessment of PSS in TTD, a quality measure for supply continuity, was carried out. This indicator enables the quality of supply continuity to demonstrate how it is dependent on a variety of quality metrics in addition to reliability. The CQoPS is calculated for both the primary power and the backup power by using three observations, each of which contributes to the overall quality of the data. Additional public utility facilities can apply the presented considerations to the PSS’s quality, reliability, and operational modeling (including those included in the key infrastructure).
In the majority of publications [
45,
46,
47,
48,
49,
50,
51,
52,
53], researchers utilize research methods based on the Kolmogorov–Chapman equation to address issues of dependability and work quality of sophisticated technical objects and systems. The availability coefficient (Kg (t)) is used as a qualitative measure of the operational process in these studies. Another useful strategy for this evaluation would be to transform the calculated value of the availability function or coefficient Kg (t) into a percentage chance that the thing being tested is in a usable or functional state after the test was performed. Author-created new functions are used to analyze dependability and systemic problems. One that is both unique and technically complex is this (FC (t)): an assessment of the object operation process’s quality (Fch (t)): the absorbing capacity of the exploiting procedure is the innovation of our article and the topic presented in it. These two numbers are only used in this document to assess the dependability of technical infrastructure and systems.
The following approach will be used in addressing the concerns voiced in the aforementioned article: The prospective reliability quantities of WF (wind farm) equipment will be shown in the second portion of this article. On the basis of these quantities, the quality of the process of renewing operating characteristics can be evaluated. Part three of this article will address the issues associated with modeling the operation and upkeep of wind farm machinery using Kolmogorov–Chapman equations. The main research section is in the fourth section of the article. In the fourth section, we will discuss the results of our analysis of the mean time between failures (MTBF) size to assess the reliability of the wind farm’s replacement equipment.
I-Hua Chung addressed similar issues in an article titled: Exploring the influence of the parameters’ link between reliability and maintainability for evaluating the conceptual design of offshore wind farm engineering, published in Energies 2022, 15, x.
https://doi.org/10.3390/en15155610 [
54].
This article evaluates the reliability of an engineering system during the design phase. Engineers conduct reliability assessments of a subsystem, core system, or entire system utilizing empirical values or performance factor data from various equipment providers to meet the owner’s requirements for wind farm reliability during commissioning and the warranty period. In general, a wind farm’s commissioning dependability can meet standards. During the longer war-warranty period, equipment failures, system malfunctions, and other unforeseeable occurrences are inevitable. In addition to the immediate loss of energy sales, it is difficult to assess the loss of the wind farm’s brand due to its lower reliability. On the other side, offshore wind farms require more dependability yet have lower maintenance expenses than onshore wind farms. To boost the maintenance rate further, the wind farm project team should conduct more on-site maintenance scenarios for varying wind farm conditions.
2. Reliability of a Technical Object after Regeneration in an Artificial Neural Network-Based Maintenance System
Technical equipment satisfies its intended purpose (carries out its necessary operation) as well as a “new” object would once it is put to use after regeneration (restoring its operating qualities) in an artificial neural network-based upkeep and diagnostics system. To meet these objectives, a maintenance system’s framework must be created with an appropriate (logical) manner. The author’s publications [
55,
56,
57,
58,
59] present, among other things, the theoretical underpinnings and applications used to construct the best possible maintenance structures for technical objects known as “continuous operation objects.” The operational and dependability characteristics of those technological objects formed in maintenance systems and that work under unique circumstances, such as a finite amount of time for the execution of preventative operations, etc., necessitate constant recognition to be maximized. Durability is a characteristic that describes how well most technical objects perform their functions.
A technological object’s capacity to be employed continuously during operation is referred to as its durability (τ) in definition 1. The rate of aging and wear has a direct impact on an object’s durability [
60,
61,
62,
63,
64,
65]. The parameters of the environment in which these technical things are found during their operation determine the speed of these processes, which frequently occur in technological objects (use). The durability dimension as a measure that describes the operational attributes of an object is the time between when it was first used and when it ceased to fulfill the function for which it was designed (the tasks assigned to it). A random variable that can take any value this time (τ) accepts values between (0, ∞). The strength of an object’s structural (or functional) components determines how long it will last. The durability of the regenerated item is not lower than the durability of a “new” object that has only been used once when trivalent logic is utilized in the diagnostic procedure and the item is found in a situation of incomplete use. A similar quality is the longevity of items in the same class or category. It is accepted that the durability of items belonging to the same population is described by the same distribution of the random variable (class of objects). The way the random variable is distributed (τ) completely identifies an object’s operating characteristics, including its durability and reliability.
2.1. Function of Reliability
Reliability is the likelihood of carrying out a set task in a predetermined amount of time under predetermined circumstances. The reliability (durability) function of an object in a maintenance system is the fundamental characteristic to define the operational and reliability attributes of a technical object after regeneration in a maintenance system built using input from an artificial neural network (
R(
t)); it was provided in the manner outlined below:
where:
R(
t)—in a maintenance system, the reliability (durability) function of an object after regeneration,
t—the duration of an object’s operation,
τ—a technical object’s durability is considered to be good when there is a sufficient amount of time between the emergence of a fault and the state of incomplete operation.
2.2. Unreliability Function
Second Definition: How well anything that has been regenerated in a maintenance system performs its reliability (durability) functions. (R(t)) durability and other reliability-related characteristics can be specified using data from an artificial neural network. This is the likelihood that a technological item’s operational (reliability) quality may fail (FC(t)) developed over the course of time (τ) will exceed a second in size if not exceed it (t). In a maintenance system, one unit represents the likelihood that a “new” or fully regenerated object would be used. If a technical object is able to fully and perfectly fulfill its intended purpose, we say that it is operating at its maximum potential.
The function of an object’s unreliability (unfitness) in a maintenance system, which is represented with the following dependence, is another quantity that may be used to describe the operational and reliability characteristics of a technical object after regeneration:
where:
F(
t)—the function of an object in a maintenance system that does not regenerate, also known as unreliability, after preventative operations have been conducted on the object.
Thirdly, the maintenance system’s evaluation of an object’s unreliability (lack of durability) following the implementation of preventive measures (
F(
t)) uses an uncertainty formula based on information from a synthetic neural network. This is the likelihood that a technical object’s operational (reliability) quality is in keeping with the terminology of the time (
τ), less than a second from now (
t). Additionally, it is possibly shown (proven) that it is a function where (
F(
t)) is the random variable’s distribution function (
τ), which may also be expressed as the dependence shown below:
If the density function indicates that an object is usable,
f(
τ) is meant to describe the object’s functional qualities; then, the quantity of the unsuitability function can be expressed as follows:
2.3. Function of Reliability
Reliability is the degree to which a specific task will be completed successfully and on schedule under specified conditions. The function of trustworthiness can be written as:
Incorporating into from 0 to
t gives:
Since
R(
t)
= 1 at
t = 0, can be expressed as follows:
A new form of the reliability function can be expressed by:
then the failures dense probability function
f(
t) can be expressed as:
Dependence (9), the exponential distribution, is the most fundamental mathematical model of dependability. The most popular function in reliability engineering is the reliability function, which measures the likelihood that a project will continue operating normally for a specified time period.
The functions of damage density and damage intensity are of fundamental importance for many research topics, as they indicate the regional peculiarities of the object’s use over time (t) of its “new” status. They are temporal intervals in which the likelihood of an object’s unfitness and fitness are <0, t>.
2.4. Failure Density Function and Failure Intensity Function
Damage density and damage intensity are two examples of quantitative measures of an object’s operational features that, when they undergo changes, might be of interest to researchers studying a variety of topics. <
t,
t + Δ
t> and agree with the following form:
and
The function measuring the destruction density f(t) in time (t) expresses a radical shift in the object’s durability (reliability) in its new form. R(t) object within time period (Δt) is equivalent to the duration of this interval. In the meanwhile, quantity also matters λ(t) in time (t), representing a modification in the durability function that is relative R(t) proportional to interval units of the object (Δt). It is reasonable to associate durability (reliability) with the availability function for a sizable class of technological objects, particularly over a longer period of examination, say, during the duration of the object’s operation regarded as the time of its “life”.
3. Model with Three Functioning States for Wind Farm Gadgets
Each process in a complicated technical object is made up of an element that is both a subset of the service condition and an element that is both a subset of the service state. It is difficult to articulate the relationship between the operating procedure of the thing under inquiry that emphasizes the transitions between the stages. Data for simulation tests must be determined after a thorough investigation and knowledge of how the machinery in a wind farm actually works. Developing a model of the facility’s operational process structure in the form selected is the most challenging aspect of any facility’s operation (analytical or graphic). You can produce specific dependability values that describe this model by evaluating the built facility operation process and determining how the different operating states relate to each other.
In the work [
1], it was demonstrated that a three-state model effectively depicts the real-world operating of wind farm machinery. So, for the WF research that was not waterproof, a three-state model was used to explain how it worked.
An examination of the methods employed to alter the object’s state reveals that it is capable of existing in the following configurations, as predicted by the model depicted in
Figure 1:
S0—using the technical tool;
S1—planned maintenance–NP preventative maintenance;
S01—unplanned upkeep: S0 with intensity μ in the fit condition.
In model A, the relationships between states imply:
λ—assessment of the severity of the system’s state transition S0 to state S1;
μ—only interpretations of the system’s intensity of transition from state S1 to state S0 and from state S01 to state S0;
λ1—degree of transitional ferocity from S0 to state S01;
μ1—a calculation of how much the system has changed from S01 to S0.
In the writings of many authors, the prophylaxis (servicing) model is the common name for the three-state model of operation. This assertion could be true only if the operating process model developed is applicable to a technical item for which diagnostics are performed in tandem with the opportunity for state evaluation. So, this is particularly the case of a three-valued state evaluation when the presence of a technical facility is weighted heavily [
5,
6,
7,
8] and includes a collection of wind farm equipment, including SERV advice systems and a neural network to help make decisions about operating safely. Model A is a representation of a working procedure. The Intelligent SERV advisory systems in the WF system aid in deciding whether or not to use it safely (
Figure 1).
The state transition in accordance with this idea is as follows: Early on, the thing is put to use and begins to be used or prepared for use (on-call). When using a prediction with high dependability, it is feasible to pinpoint the precise moment when the technical facility will be undergoing planned repairs. The planned repairing of the object is, therefore, planned for known times Δt. As a result, this is one of a number of service states in which the object can be found at the time of action (t1 = t0 + Θ). The state of the object changes S0 to state S1 with vigor, where λ = 1/Θ [1/h]. During TNP, the predicted repair is finished in the S1 condition. The item with intensity where μ = 1/TNP [1/h] switches to state S0: use after the intended repair is finished. The technological object being used in state S0 risks being harmed. After that, the technical object enters state S01 with regard to damage intensity λ1. When an object’s failure in the unplanned repair state S01 occurs when TNA, the object moves caused by the high volume of impromptu maintenance μ1 state the context of use S0.
To evaluate the viability of wind farm devices being present in particular states, the model of their operation depicted in
Figure 1 consists of the following equations:
Relationship (12) can be represented in matrix notation as follows:
The following relationships were established by modifying Equation (13):
The correctness of the equation is a given:
The following is the meaning of the symbols in the equations above:
- −
λ—a description of the system’s state change from S0 to state S1 intensity;
- −
μ—only inferences about the system’s state-to-state transition intensity S1 to state S0 and from state S01 to state S0;
- −
λ1—assessment of the strength of the system’s transition from state S0 to state S01;
- −
μ1—transformation from one state to another in the system, e.g., from S01 to state S0’s intensity;
- −
P0(t)—the probability of the system continuing to function S0;
- −
P1(t)—the possibility of the system remaining in S1;
- −
P01(t)—the possibility of the system remaining in S01.
With the use of expression, it is possible to determine the likelihood that a wind farm system will continue to function. Its numerical value is the same as the readiness indexes. If simulating the operational process means figuring out how likely it is that a wind farm system will stay in any of the states S0, S1, or S01, then the following values must be figured out:
- −
There is the possibility that the system will continue to function as it does right now S0;
- −
There is the possibility that the system will continue to function as it does right now S1;
- −
There is the possibility that the system will continue to function as it does right now S01.
4. Reliability Testing of Wind Farm Devices Based on the Mean Time between Failures (MTBF)
4.1. Reliability Testing of Wind Farm Devices
It was possible to quickly determine state indicators for the UFW system under study and their values in response to changes in a number of operational and reliability measurements. The degree of repairs and damage to the installations as reported in
Table 1 was considered for the analysis. The factors that were considered when establishing the values were:
In Equations (14)–(18), the following probabilities are calculated using the reverse Laplace transform, data from
Table 1, and the likelihood that the tested system will remain in each of its many operating states for an exponential distribution:
4.2. Testing the Dependability of Components Used in Wind Farms Based on the Mean Time between Breakdowns (MTBF)
The average amount of time without a failure during use or testing is referred to as the average time between failures (MTBF). The MTBF value could be an unmeasured quantity or a measured quantity. The reference value is then theoretical in nature and was calculated by engineers during the product design phase. DNVGL-ST-0145 provides a description of MTBF.
Only products that can be repaired when a problem arises are included in the concept of average product life. The typical length of time a product is in use (θ), which is represented by the formula, is comparable to the meaning of
MTBF.
where:
f(t): Probability density function showing the amount of time remaining before it fails.
T: Duration of operation of the product in its entirety.
r: Total number of time-based failures.
t: Time interval during which the malfunction occurred.
MTBF: An estimation of the typical amount of time that passes between product failures.
5. Discussion
Reliability and mean time between failure (MTBF) are the topics that are covered in the research that is presented in this article about the WF system’s reliability quantities. Both study quantities affect both the reliability of technical objects and their readiness (availability). High readiness and high reliability are close to each other in meaning but should not be equated. Reliability is the magnitude of reliability, which determines the ability of technical objects (systems or components) to perform their desired functions under given conditions for a specified period. In other words, it refers to the likelihood that a system or component will successfully finish the allotted work within the allotted amount of time without experiencing any setbacks. Readiness is a reliability quantity that determines the readiness of technical objects (systems or components) for their use when it is required at a given specified time.
An analysis of the literature shows that the basic quantity used in most of the results of the study of the operation process of complex technical objects presented in them is reliability. Very often in the literature, reliability is directly equated with probability. The difference between these quantities is explained in the definitions provided in Chapter 2 of the article. The reliability function of complex technical objects most realistically reflects the ability of WF system to perform its functions after a sufficiently long time of its use in the operation process.
The novelty of this article about other works is the adoption of MTBF to study the reliability of WFs over a period, called the WF duty cycle by the authors’ team, where: “1 Duty Cycle equals 1 year of WF equipment operation.” Thus, 1 year of operation of WF equipment is equal to 8000 [h]. According to the study of the acquired WF dependability findings presented in
Figure 2, for the WF use duration equal to (½ duty cycle = 4000 [h]) the reliability of the WF system is (Ro(t) = 0.81764).
It can also be concluded that for reliability equal to (Ro(t) = 0.81764), the realization of tasks required by the WF system is 80%. On the other hand, for a WF lifetime equal to (1 WF duty cycle = 8000 [h]), the reliability of the WF system is (Ro(t) = 0.677864). It can be concluded that the value of reliability (Ro(t) = 0.677864) describing the utility properties of the WF in the form of electricity production is satisfactory (at the level of 67%). These quantities differ significantly from the amount of electricity production by the WF system, which has maximum reliability such as a new WF system just put into operation. The WF user, having the determined reliability value of the WF system for a certain time of its use, can take appropriate measures to increase the utility properties, i.e., to increase the reliability of the WF. Maintaining the technical condition of WF equipment at any time of its operation at a good level of its reliability necessitates the application of a specific operational plan.
The issues that arise when testing and assessing the dependability of the machinery used in wind farms are one of the new themes that have been presented as research in published works. Similar topics were addressed by I-Hua Chung in an article titled Exploring the influence of the parametersʹ relationship between reliability and maintainability for assessing the conceptual design of offshore wind farm engineering,
Energies 2022, 15, x.
https://doi.org/10.3390/en15155610 [
54].
In this article, the reliability of an engineering system is evaluated throughout the early stages of the design process. To meet the owner’s requirements for wind farm reliability during commissioning and during the warranty period, engineers conduct reliability assessments of a subsystem, core system, or the entire system using empirical values or performance factor data from various equipment suppliers. These assessments are conducted to meet the owner’s requirements for wind farm reliability. In most cases, the level of dependability that a wind farm exhibits during commissioning can correspond to the standards. However, during the longer warranty period, equipment failures, system malfunctions, or other unforeseen circumstances are inevitable. It is impossible to put a price on the loss of the wind farm brand as a result of the decreased reliability of the wind farm, and this comes on top of the immediate loss of revenue from sales of power. Off-shore wind farms, on the other hand, have a greater reliability need, but their maintenance costs are significantly cheaper when compared to onshore wind farms. As a result of this, the team working on the wind farm project ought to carry out a greater number of on-site maintenance scenarios for a variety of wind farm environments in order to further increase the maintenance rate.
The special novelty of our article is reliability research in the form of average time between failures, average time between repairs, and average time of failure-free operation. Thus, the subjects of our article are part of this new research topic. The study of the reliability quantities of the WF system presented in the article concerns reliability and MTBF. Both study quantities affect both the reliability of technical facilities and their readiness (availability). The first quantity used in the study, reliability, is taken as the basic research quantity. This is because reliability directly determines the ability (probability) of using technical objects (systems or components) to perform their desired functions under given conditions for a specified period of time. In other words, it is the likelihood that a given system or component will accomplish its goal within the allotted amount of time and without experiencing any setbacks.
The second reliability quantity of a WF system to be studied is the MTBF (mean time between failures). The MTBF magnitude can be considered the primary measure of WF system reliability and is expressed in hours. In the literature, it is presented that the higher the MTBF value, the higher the reliability of the technical system. A popular but incorrect assumption used in publications regarding MTBF is to put an equal sign between this quantity and the so-called “service life (time)”—the estimated number of hours of operation after which system failure occurs. It is not uncommon, however, to state that the MTBF factor with a value of a large number of hours gives the information that the system can operate without interruption, which is not quite true.
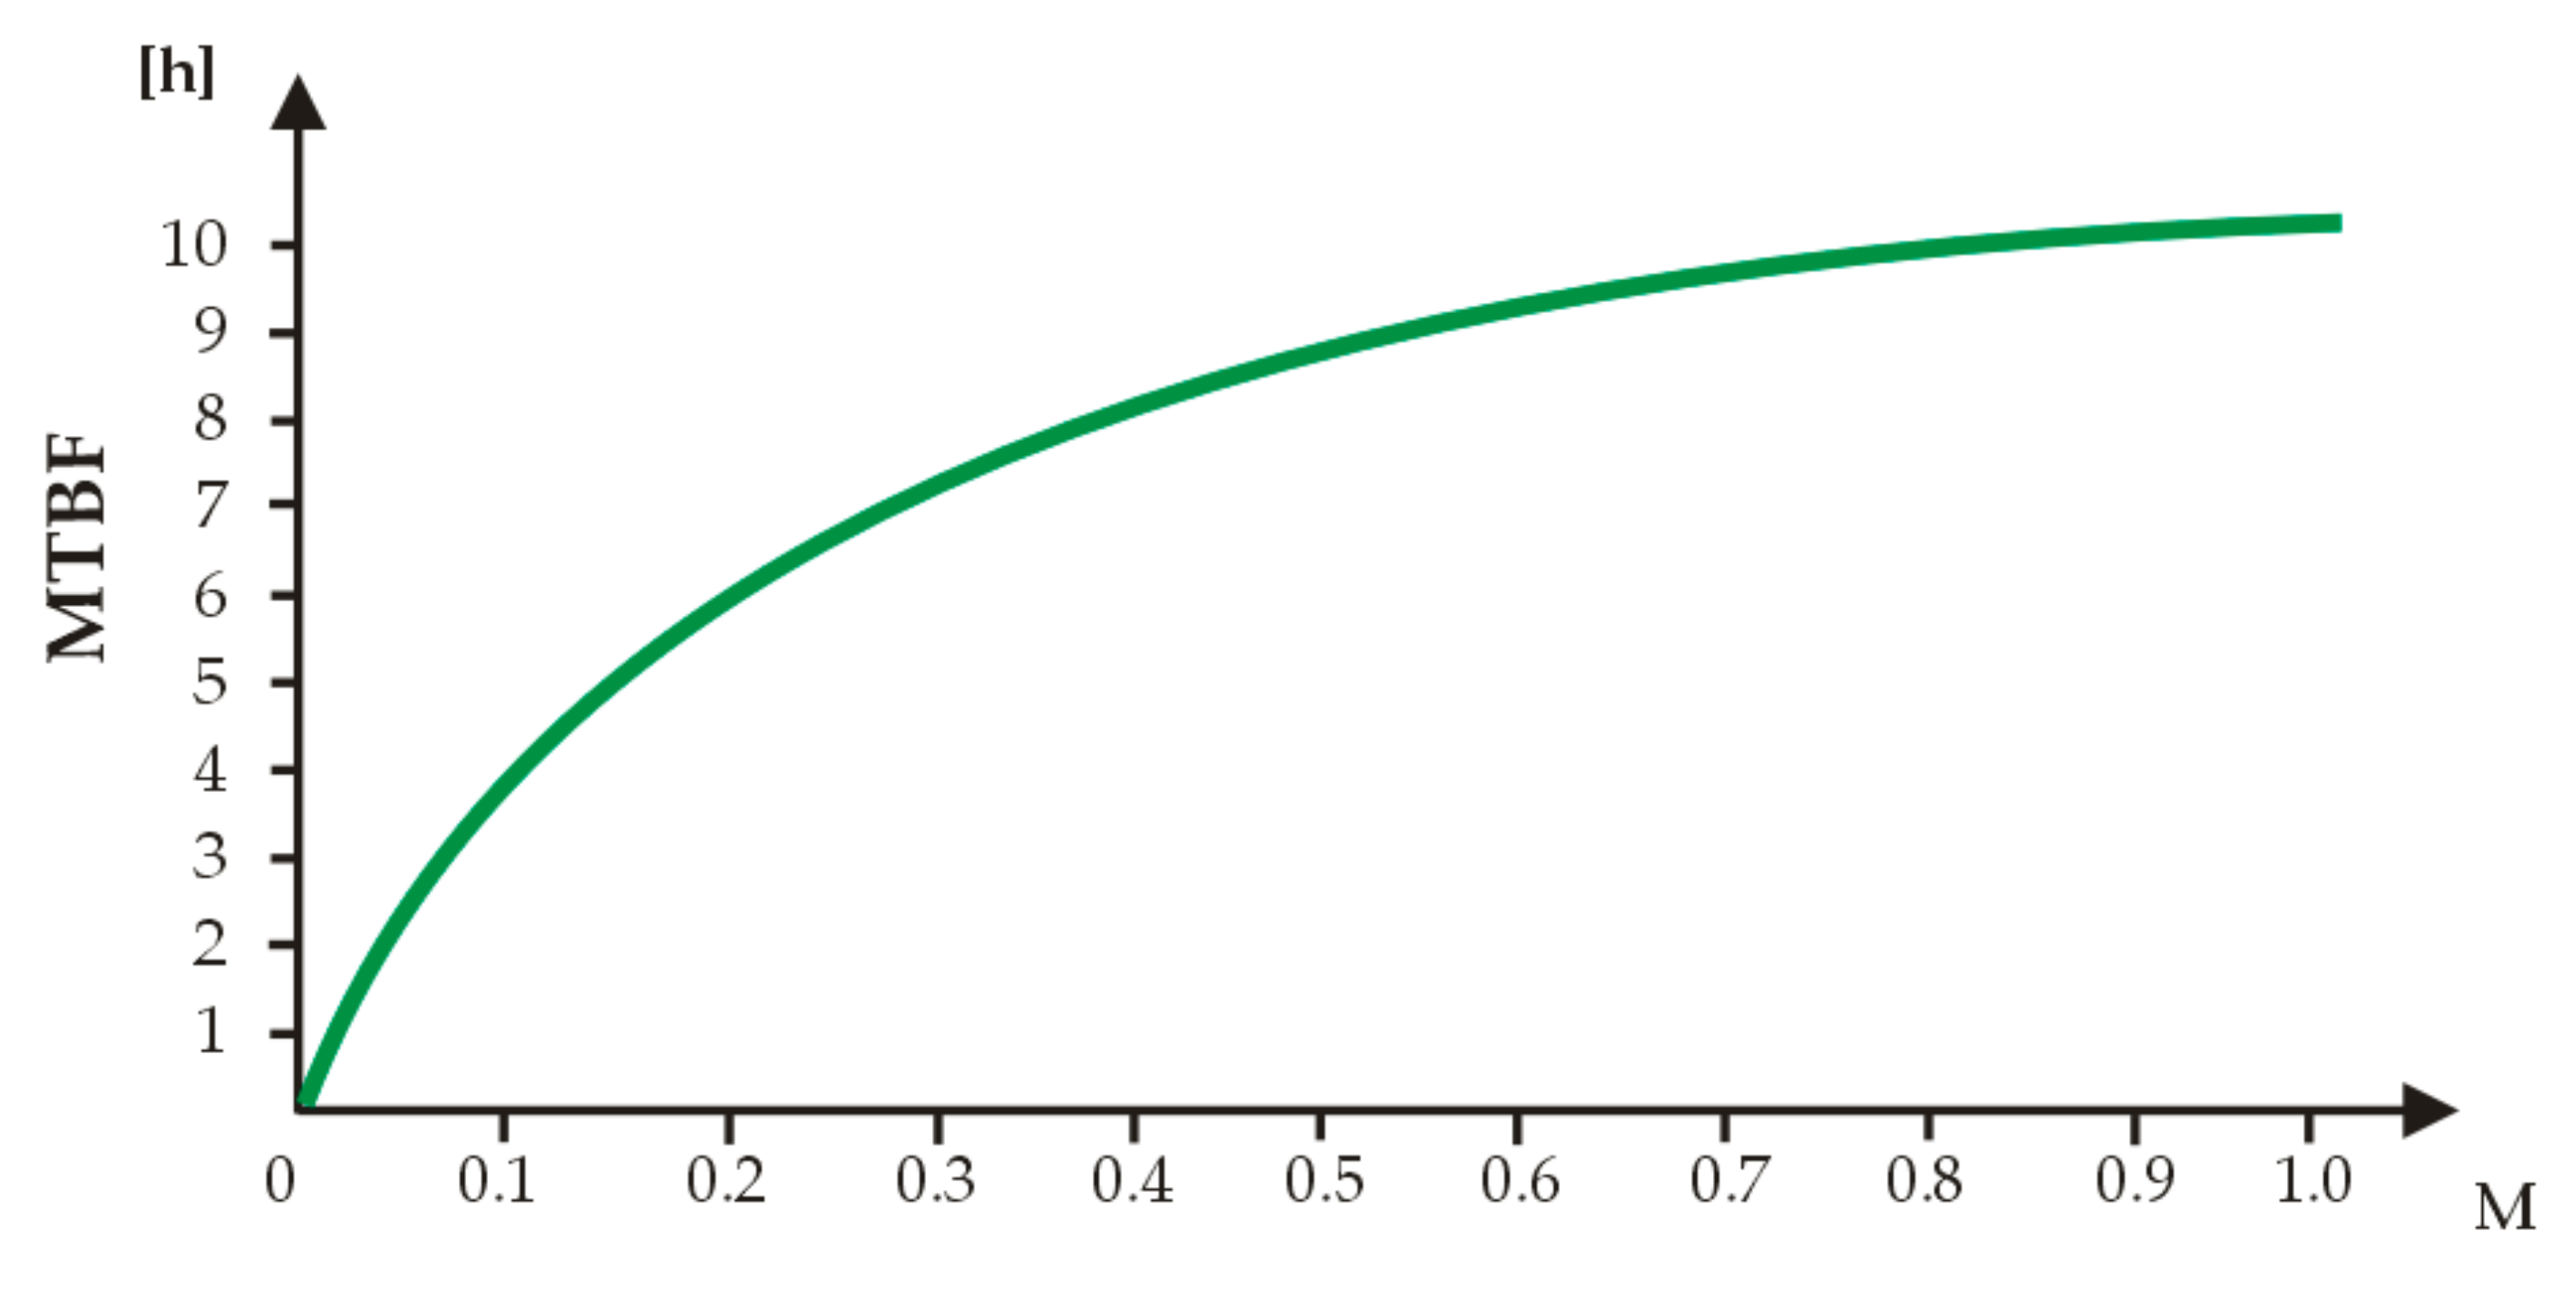
Also new to this article, compared to other works, is a reliability study of the WF system using MTBF. The study of the magnitude of MTBF was made as a function of changes in the magnitude of maintainability (maintainability) of the WF system. The study was carried out up to changes in magnitude (M) with an interval of <0, 1>. WF system maintainability is a quantity that is represented in terms of the ratio of expenditures incurred in repairing or renewing the operating characteristics of WF equipment to the amount of all expenses related to using WF equipment. Maintainability of the WF system is a quantity that very realistically represents any technical, organizational, application of the SERV system, training of service personnel, availability of spare parts, and others.
In
Figure 3, a graphic representation of the reliability research findings for the WF system is presented in the form of MTBF. According to
Figure 3’s study of the dependability data, as the value of (M) increases, the values of MTBF increase proportionally. The graph in
Figure 3 shows that for a value of (1/2M), the value of MTBF is equal to 7549 [h]. Contrarily, for the amount of (1M), the MTBF value determined in the study is equal to 10.00 [h].
The conducted reliability studies of the WF system indicate that both studied quantities, reliability (Ro(t)) and MTBF values, contain significant information for controlling the process of increasing the efficiency of WF system use at any time. The findings of the study reveal that the methods that minimize the cost of implementing the process of repairing or renewing operating characteristics are the most appropriate ones for renewing WF equipment. This is because these strategies make the most efficient use of resources. Keeping WFs in continuous serviceability or operational readiness requires a continuous reduction in repair costs. The cost of repairing PEs is directly related to the decreasing duration of the process of renewing these devices. According to the findings of this research, utilizing the SERV system resulted in a significant cutback in the amount of time required for the process of renewing WF equipment. The strategy for organizing the process of renewing WF equipment is that only those components of the WF system that require it are renewed, and renewals are limited.
In the first stage, the SERV program identifies functional elements of the WF and other WF equipment for renovation due to their technical condition. In the next stage, the SERV program for selected WF elements and other WF equipment, depending on their technical condition, selects specific sets (sets) of technological (renovation) activities. At the next stage, the SERV system for the selected j-th WPP elements subject to renewal selects the appropriate sets of technological (renewal) activities and the appropriate sets of technological means and materials. The WPP and other pieces of wind farm equipment in the service system can have their costs and turnaround times optimized by using the SERV system. As a result, there is a problem with determining and evaluating the level of quality of the process of operating the WPP wind farm equipment that has been renewed based on the SERV system. The group of authors set out to find a solution to the challenge of determining and assessing the reliability of the equipment used in WFs (wind farms) by making use of a reliability metric that took the shape of a mean time between failures (MTBF).
6. Conclusions
Due to its continuous operation, wind power (both onshore and offshore) is now accustomed to requiring regular, effective reliability testing of WF equipment. Publications are seeking a more cost-effective model for WF renewal and repair as the everyday responsibilities of operating and maintaining WFs becomes more expensive and technologically sophisticated.
The authors of the article provided a reliability analysis of the WF system. The reliability function and MTBF were chosen for the reliability study. The reliability and readiness of technological products are both considerably influenced by the two analyzed qualities (availability). The ability of the WF system to fulfill its functions after a sufficiently extended length of use in the operation process is reflected by the reliability function of complex technological objects, which is the most actually applied dependability quantity. The MTBF, in contrast, contains reliability data over a shorter operational period.
The reliability study of the WF system utilizing MTBF that was adopted makes this article unique when compared to other studies, in that this study looked at how the maintainability (M) of the WF system changed the MTBF magnitude. The study covered changes in magnitude (M) between the ranges of 0 and 1. The magnitude (M), which was chosen for the study, very realistically depicts a direct relationship with all technical and organizational factors (such as the implementation of the SERV system), training of service employees, availability of spare parts, and other factors that facilitate WF renewal.
As determined by the WF system’s dependability analysis, the most effective methods for updating wind farm machinery are those that lessen the financial burden of fixing or replacing faulty operational features. Continuous repair cost reduction is necessary to keep WFs operationally ready, or in continuous serviceability. According to the research, [
49], the time it takes to renew PEs is directly correlated with how much it costs to repair them. According to the conclusions of this study, the SERV system has the potential to considerably cut down the amount of time necessary to replace WF equipment.
Future studies by the authors in this field will focus on figuring out how reliable wind power systems are depending on their current operating conditions (damage times, repair times, and others). On the foundation of this work, future research will examine how artificial intelligence (such as the SERV system) might support and anticipate preventive approaches. Future study is anticipated to facilitate effective restoration organization by reducing the frequency of maintenance, early replacement of damaged parts at ideal times, and operating and renewal costs.
The conducted reliability studies of the WF system indicate that both studied quantities, reliability (Ro(t)) and MTBF values, contain significant information for controlling the process of increasing the efficiency of WF system use at any time. According to the findings of the study, the strategies that reduce the cost of implementing the process of repairing or renewing operating characteristics are the most optimal ones for renewing WF equipment. This is because these strategies ensure the greatest return on investment. Keeping WFs in continuous serviceability or operational readiness requires a continuous reduction in repair costs. The cost of repairing PEs is directly related to the decreasing duration of the process of renewing these devices. The findings that were acquired from this work point to the fact that the SERV system successfully cuts down on the duration of the process of renewing the WF equipment. The strategy for organizing the process of renewing WF equipment is that only those components of the WF system that require it are renewed, and renewals are limited.
Symbols and Acronyms
| F(t) | The cumulative distribution function of the time to failure |
| f(t) | The probability density function of the time to failure |
| λ(t) | Instantaneous failure rate function |
| R(t) | Reliability function |
| MTBF | Mean time between failure |
| MTTF | Mean time to failure |
| MTTR | Mean time to repair |
| M(τ) | Maintainability function |
| Kg(t) or Kg | the average value of availability function or factor Kg, |
| Fc | the quality function of the object’s operation process |
| Fch | function of the object operation process |
| λ | damage intensity |
| t | the time of operation process |
| μ | repair intensity |
| λ1 | intensity of type I inspections |
| μ1 | type I operational maintenance intensity |
| λ2 | intensity of type II inspections |
| μ2 | type II operational maintenance intensity |
| P0 | probability of the system being in state S0 |
| P1 | probability of the system being in state S1 |
| P01 | probability of the system being in state S01 |
| P10 | probability of the system being in state S10 |
| SERV | an intelligent expert system supporting the renovation of technical objects |


 ,
, 


