Abstract
After the economic shock caused by COVID-19, with relevant effects on both the supply and demand for energy assets, there was greater interest in understanding the relationships between key energy prices. In order to contribute to a deeper understanding of energy price relationships, this paper analyzes the dynamics between the weekly spot prices of oil, natural gas and benchmark ethanol in the US markets. The analysis period started on 23 June 2006 and ended on 10 June 2022. This study used the DMCA cross-correlation coefficient in a dynamic way, using sliding windows. Among the main results, it was found that: (i) in the post-pandemic period, oil and natural gas were not correlated, in both short- and long-term timescales; and (ii) ethanol was negatively associated with natural gas in the most recent post-pandemic period, especially in short-term scales. The results of the present study are potentially relevant for both market and public agents regarding investment diversification strategies and can aid public policies due to the understanding of the interrelationship between energy prices.
1. Introduction
The behavior of energy prices is influenced by crises that occur directly in the energy sector itself [1] and by crises in other sectors [2,3], which makes the energy market unstable [4]. Recently, both the health crisis due to the COVID-19 pandemic and the geopolitical crisis due to the war between Russia and Ukraine have strongly impacted the behavior of energy prices worldwide.
At the beginning of the COVID-19 pandemic, the energy sector faced an instant economic standstill with the sanitary restriction measures imposed to contain the COVID-19 virus. One of the implications of this event was an abrupt reduction in energy consumption [5,6,7]. The reduction in energy demand caused a drop in prices and forced a decrease in production [8]. During this period, there was tension between the major oil producers of Saudi Arabia and Russia [9]. With prices falling, Saudi Arabia proposed that oil-producing countries should reduce production to help control prices. However, Russia did not agree, causing friction between the two countries and further impacting the sector’s economy.
With the resumption of post-pandemic economic activity in 2021, the energy supply was unable to keep up with demand, leading to higher prices and instability in the market as a whole. There is clear evidence of the link between economic activity and energy consumption [9].
The energy crisis after the outbreak of the pandemic worsened with the war between Russia and Ukraine, declared in early 2022. With the conflict, Russia interrupted the supply of energy to European countries. This factor not only caused an energy crisis in the continent, but also instability in the international energy market, given that threats and geopolitical acts generate different effects on the volatility of energy prices [10].
In the energy market, sources include oil and natural gas, which are considered to be the main commodities in the sector [4,11] in addition to other products such as biofuels. Although these products have their own characteristics, the price behavior may correlate, depending on their possible use as substitutes, at least partially or imperfectly.
According to [8], the natural gas market is not as globally integrated as the oil market. This causes natural gas prices to be diversified in different regions, which consequently makes the delivery of natural gas varied in different locations [8].
Regarding the prices of biofuels, these are related to the prices of conventional energy, especially since 2005 when the United States created the Federal Energy Policy Act. This policy requires the addition of a certain amount of ethanol to gasoline, aiming to increase the use of low-carbon fuels [12]. It is worth mentioning that biofuels are derived from crops such as corn, soybeans and sugarcane, which use energy-intensive inputs such as fuels and fertilizers, products derived from petroleum and natural gas [13,14,15,16]. There are also ongoing developments to deepen the production of biofuels from other raw materials such as 2G ethanol [17,18]. However, the supply of US ethanol is currently basically ethanol 1G via corn starch (93.8%) compared with a lower value from cellulosic biomass (3.9%) [19]. These characteristics indicate the possibility of linking prices of non-renewable energy with renewable energy.
In this context, it is necessary to deepen the understanding of the degree of the relationship between key energy prices, especially after significant economic shocks such as the pandemic crisis. To improve the understanding of the energy market in times of price instabilities, the present study analyzed the cross-correlations between ethanol, natural gas and oil, using the detrended moving average cross-correlation analysis (DMCA) proposed by [20], between 2006 and 2022.
It is important to note that in this period, energy prices greatly varied, mainly due to the 2008 energy crisis and, more recently, due to the rise in energy prices resulting from the COVID-19 crisis and the conflict in Eastern Europe between Russia and Ukraine. In the final period of the sample, between February and June 2022, this study combined the effects of the COVID-19 crisis and the war between Russia and Ukraine.
In the analysis, this paper focused on the behavior of energy prices, given that these are the indicators of the structural conditions of the supply and demand for energy. Therefore, the modelling of factors specifically related to both supply and demand curves was beyond the scope of this work.
The main contributions of the present study are twofold: first, a sample extension; and second, a new methodological approach used in the analysis. It considered a broad sample that included the post-pandemic period because few studies have considered the interaction among ethanol, natural gas and oil after the outbreak of the COVID-19 crisis. Regarding the methodology, the DMCA is a robust approach, with successful applications in economics and finance; this was combined with the use of sliding windows to understand the dynamic evolution of the correlations over time in several timescales of analysis.
Analyzing the prices of such energy commodities is important for energy investors, producers and consumers [4]. In addition, a better understanding of price behavior helps the elaboration of public policies in the energy market [11,13] because energy is a vital resource for the development of economies and society [10].
2. Literature Review
The COVID-19 pandemic strongly impacted the energy sector in addition to the dramatic consequences for health [21], causing more than 6.7 million deaths prior to January 2023 [22]. Energy prices went through two distinct behaviors between pre- and post-COVID-19, from falling prices to vertiginous increases. In this context, the impact of COVID-19 exceeded the 2008 global financial crisis on energy price volatility [23].
Shortly after the start of the pandemic, when it was declared a public health emergency of international concern in January 2020, there was a great impact on the demand for energy. COVID-19 generated great uncertainties regarding the spread of the disease and economic activity [24]. This culminated in a reduction in energy consumption and its price [25,26,27]. Compared with other global financial crises, COVID-19 led to a greater connection between oil prices and economic activity [28].
A few studies have linked the number of COVID-19 cases to energy prices. Dmytrów et al. [29] showed that energy commodities such as natural gas and ethanol presented prices strongly associated with the number of cases of COVID-19. Christopoulos et al. [30] showed that the number of deaths from the disease was positively correlated with the volatility of oil prices in different areas of the world (this relationship was not observed only in Asia).
Additionally, in order to prevent price reductions due to low demand, a few OPEC (Organization of Petroleum Exporting Countries) members and partners proposed a reduction in oil production [26]. This proposal was initially rejected by Russia because a significant part of the country’s income comes from the sale of oil. This resulted in geopolitical instability and a trade war. In a retaliation to Russia, Saudi Arabia went against its initial proposal and increased production [25]. According to [24], the effect of COVID-19 presented a greater geopolitical risk than economic uncertainty in the United States.
Such events caused a sharp drop in energy prices, with WTI crude oil future prices, for example, even reaching negative values in April 2020. According to [31], during the pandemic, oil-exporting countries were the main transmitters of shocks whereas importing countries were the receivers, implying that oil supply industries suffered more than user industries [21].
Aiming to control energy prices, an agreement was approved in April 2020 between producing countries, including Russia and Saudi Arabia, to restrict oil production. In the US, federal actions could not prevent the impact of COVID-19 on the energy sector [32]. In that period, the concern of investors in the energy market around the world was at an extreme level, given the market uncertainty [32,33]. According to [31], the connectivity between energy markets in different countries during the COVID-19 period was greater than in the previous period.
With the resumption of economic activity due to the development of vaccines and the relaxation of sanitary restrictions, energy demand began to recover in 2021 [34]. The supply, which had suffered a decrease, could not keep up with the demand, which led to a significant increase in prices to balance the market [34].
The energy market comprises different types of energy sources. According to [35], in 2021, the total energy consumption in the United States was 97.9 quadrillion Btu; the most consumed sources were oil, natural gas and renewable energy, representing 36%, 32% and 12%, respectively.
Consequently, several studies have attempted to understand the price behavior of different energy sources. Among the studies considering the most recent global crises are [2,3,4,7,8,9,10,11,12,13,16,36,37].
Lee and Yoon [2] analyzed the dynamic spillover between EU carbon emission prices, biofuels and Brent oil between 2009 and 2020, using the vector autoregressive-generalized autoregressive conditional heteroscedasticity (VAR-GARCH) model with the BEKK specification from Baba, Engle, Kraft and Krone. A strong and persistent change was found in the price volatilities of the three assets during these years. One justification for this behavior is related to the crises occurring during this time such as the 2008 financial crisis and the COVID-19 crisis, which caused an imbalance in world supply and demand.
Naeem et al. [36] investigated the connectivity of oil, electricity, carbon, clean energy, natural gas and coal markets during the period between 2006 and 2019 using the methodology of Diebold–Yilmaz and Baruník and Křehlík. There was a strong connectivity in prices during the 2007–2008 global financial crisis and the shale oil revolution. The interconnection between different energy products during crises is due to the greater caution of investors when subject to economic uncertainties.
Thanh and Linh [9] explored the origin of energy market volatility with respect to crude oil, gold and silver markets in the period 2018 to 2021 using the time-varying parameter vector autoregression (TVP-VAR) model. One of the results suggested that oil and gold markets are net transmitters of volatility in the energy market; their influences stood out during the COVID-19 pandemic.
Corbet, Goodell and Günay [7] studied the spillover of volatility and co-movement between corporations linked to the energy sector from May 2019 to May 2020, with a special focus on April 2020, when West Texas Intermediate (WTI) oil future prices showed a negative level. Using the Diebold–Yilmaz spillover method and the DCC-FIGARCH model, they found a positive spillover in the direction of WTI oil prices to renewable energy and coal prices, considering the period of falling energy prices caused by the COVID-19 pandemic. According to the authors, the drop was mainly related to the sharp reduction in global demand in the face of changes in the supply curve.
Similar results were found by Mensi, Rehman and Vo [8], who studied the dynamic co-movements and price volatility spillovers between WTI crude oil, Brent oil, gasoline, diesel, heating oil and natural gas markets between 1997 and 2021. Using the Diebold–Yilmaz spillover index and wavelet methods, they found that markets co-move in different time horizons. In addition, they found that volatility spillovers were accentuated in the period of the financial crisis and the COVID-19 outbreak, as found by [2,7]. Another result verified by [8] was the greater participation of the price of WTI crude oil in the spillover of volatility to other markets, with other markets being receivers. The exception was natural gas, which was weakly dependent on other markets.
Khan et al. [38] analyzed the effect of COVID-19 on the prices of the same products analyzed by Mensi, Rehman and Vo [8]. Using quantile modelling and a dataset from January 2020 to May 2021, the authors found a negative effect of the disease in all quantiles. The negative effect between the middle and upper quantiles indicated that the greater the disease-related focus, the faster energy prices decline. Additionally, oil prices showed a greater impact of the disease when compared with natural gas and heating oil prices.
Gong, Ling and Wang [4] analyzed the dynamic spillover of energy commodity price volatility—more specifically, crude oil, gasoline, heating oil and natural gas prices—using the time-varying parameter VAR model (TVP-VAR-SV model) combined with a framework of generalized variance decomposition between 2005 and 2019. Among their results, they identified that the spillover index of oil and natural gas price volatility in the future market varies over time, with the spillover effect of the volatility between pairs of energy markets being bidirectional and dynamic with asymmetric effects. Furthermore, they found that the crude oil and heating oil markets are net transmitters of volatility risk whereas the gasoline and natural gas future markets are net receivers.
Lovcha and Perez-Laborda [11] studied the connectivity of the volatility between oil and natural gas prices between 1994 and 2018 using the variance decomposition of the components of the VAR model in different frequency bands. Similar to the results of [4], they found variations in volatility spillovers over time. However, [11] found that during most of the sample period, the natural gas market was the central transmitter, driven by the natural gas crisis in the United States in 2000. Furthermore, they identified that connectivity between these two markets occurs more strongly when the volatility shock is caused by oil. The authors observed that by using low-frequency data, there was connectivity between oil and natural gas prices because volatility is transmitted in the long-term.
Tiwari et al. [16] analyzed the conditional volatility spillover between energy, biofuels and agricultural commodities markets between 2012 and 2021 using the rolling window-based Quantile VAR (QVAR) model. These markets were found to be more interconnected in times of price increases. Another relevant result was the greater dominance of the price of crude oil over the prices of gasoline, natural gas and ethanol, as found by [11].
Qin et al. [10] analyzed the effects of geopolitical risks on the returns and volatility of prices for WTI crude oil, natural gas and heating oil through the quantile regression model in the period between 1990 and 2018. One result was that geopolitical risks have asymmetric effects on the volatility of these energy commodities. In the different quantiles, a positive effect was found on the volatility of the price of crude oil whereas the effects on the volatility of natural gas and heating oil were negative in most quantiles, but these were not significant.
Serletis and Xu [12] analyzed the average spillovers and volatility between the crude oil market and raw materials for the production of biofuels such as corn, soybeans and sugar using the vector error correction (VEC)-GARCH-in-mean model between 1986 and 2016. The results indicated that the four markets are strongly interconnected. A potentially important factor underlying this result is the biofuel policy known as the Renewable Fuel Standard (RFS) established in 2005 in the United States, which establishes the addition of a certain amount of biofuel to gasoline and diesel via mandated policies.
The repercussion of this policy was also identified by [38] when analyzing volatility spillovers between non-renewable energy, agriculture and biofuel commodities between 2012 and 2016 using the VAR model. Among the results, they found an overflow of volatility between the non-renewable energy and biofuel markets. Between 2014 and 2015, gasoline was found to be the only energy commodity connected to ethanol.
Chiou-Wei, Chen and Zhu [13] studied the relationship between oil, natural gas, soy, corn and ethanol prices between 2005 and 2017 using the dynamic conditional correlation (DCC) multivariate GARCH model methodology. One result was the presence of a long-term equilibrium relationship between the price of oil, corn, soybeans and ethanol; only the price of natural gas was not related to the group of commodities analyzed. With regard to volatility, the five commodities showed statistically significant correlations. Among the relationships studied, only those involving the natural gas market showed less of a connection to other markets, as found by [8].
A lower connectivity of natural gas with other commodities was also observed by [39] when analyzing the volatility between stocks and important commodities such as oil, gold, silver and natural gas between 2019 and 2020 using the MCS-GARCH model and the Diebold–Yilmaz spillover method. COVID-19 was found to heighten volatility spillover across markets. In addition, natural gas was found to be a good option for investor protection in periods of high investment risk, as occurred during the COVID-19 outbreak.
Mensi et al. [9] analyzed the co-movements between Brent crude oil, natural gas and BRICS equity markets from 1999 to 2018 using wavelet methods and the Conditional Value at Risk. Regarding the results involving crude oil and natural gas, they found a strong dissociation between these two markets after 2007.
Therefore, empirical evidence points to mixed results regarding the relationship between key energy commodities such as oil, natural gas and ethanol. It is important to study these relationships in more detail from a sample that includes more recent data after the outbreak of the COVID-19 pandemic using new robust estimation methods.
The next section details the empirical strategy of this article based on the DMCA estimator developed by [20], which was dynamically analyzed through sliding windows similar to Zebende’s DCCA (2011) coefficient [40], with a sliding windows approach [41] used in recent investigations, including finance and economics [41,42,43,44,45].
3. Methodology and Data
3.1. Methodology
The development of the DMCA coefficient [20] was based on the same central concept as DCCA [40] detailed in [20,46,47].
There are two series, and , on which two integrated series and are built for , where is the length of both series. From these integrated series, fluctuation functions are built, given by:
where ⌊ ⌋ is the floor operator, refers to the length of the moving average window and is the style of moving average, which can take different values such as (forward moving average), (centered moving average) or (backward moving average). This study used the centered moving average because, according to [20,47], this approach performs better than other options. The expressions and correspond with moving averages with a window length of .
In turn, the bivariate fluctuation function is a covariance function defined as:
Thus, it is possible to construct the DMCA coefficient in a similar manner to the DCCA coefficient of Zebende [40], as follows:
which also has the desired properties of ; namely, .
In the present analysis, the coefficient was calculated from sliding windows, which dynamically analyzed the correlation over time in windows of 250 observations, as illustrated in Figure 1.

Figure 1.
Example of the sliding window procedure (adapted from [43]).
In order to delimit the confidence interval of , the estimates prepared by [46] were used, considering a sample of 250 observations in different timescales, as shown in Table 1.

Table 1.
Critical values of the test considering 250 observations at different timescales with a 95% confidence level, according to [46].
The DMCA coefficient and the DCCA have advantages over traditional correlation techniques such as the Pearson correlation coefficient as they are able to detect non-linear correlations. They can even be used in the presence of non-stationary variables [20]. Regarding statistical robustness, as well as the DCCA coefficient, the DMCA coefficient is unbiased even in the presence of strong non-stationary series. However, DMCA has an advantage over DCCA once it is less computationally time-consuming because it uses a moving average to detrend the original time series when compared with a polynomial estimation, an advantage mainly in long time series [20]. Among the recent successful applications of this coefficient, it is possible to highlight the work of [46], with simulated and empirical data based on the indices of developed and emerging market equities, or the study by [47], which focused on the cryptocurrency market.
3.2. Data
In the present study, three key energy prices in the US market—namely, WTI oil, Henry Hub natural gas and New York US ethanol—were considered. WTI crude oil and Henry Hub natural gas prices were obtained from the US Energy Information Administration (EIA) and US ethanol prices were sourced from the Thomson Reuters datastream. All prices refer to the spot market.
The analysis period started on 23 June 2006 and ran until 10 June 2022, making a total of 834 observations. Figure 2 shows the evolution of weekly oil, natural gas and ethanol prices in the US market. It appeared that all prices showed sudden changes at certain times such as oil in April 2020, natural gas in February 2021 and ethanol, with rising shocks in the post-pandemic period after relative stability between 2015 and 2019.
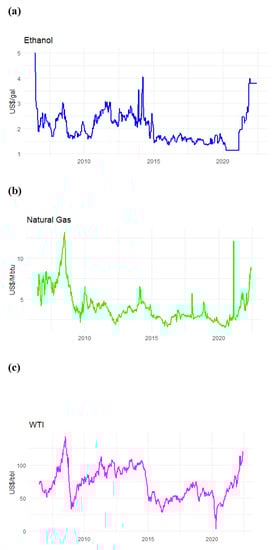
Figure 2.
Behavior of weekly ethanol (a), natural gas (b,c) WTI oil prices during the period between 23 June 2006 and 10 June 2022.
An analysis of the descriptive statistics, as well as for the DMCA, was carried out from the return () of the price series in the period (t), given by the difference of the logarithms of prices () in the period (t) versus the immediate previous period (t − 1); namely, .
4. Results and Discussion
First, the descriptive statistics of the series were analyzed, as shown in Table 2. The means were very close to zero, which indicated that the series did not tend to exhibit a persistent growth or decreasing trend. Regarding the extreme values of maximums (and minimums), it could be observed that the oil and natural gas prices presented estimates of greater (or smaller) magnitude than ethanol, which indicated that ethanol tended to present less stress, both in terms of moments of appreciation and the devaluation of prices.
Table 2.
Descriptive statistics for ethanol, oil and natural gas returns.
Regarding asymmetry, oil and natural gas showed positive values, which indicated that positive returns were more frequent than negative ones; this was the opposite of what occurred with ethanol, with negative asymmetry, which indicated that negative returns were more frequent than positives ones. Finally, the three series showed high kurtosis values—particularly oil, followed by natural gas—indicating the presence of heavy tails in all analyzed energy prices.
After analyzing the descriptive statistics of the series, the possible correlations between the energy assets were verified through the DMCA coefficient. As the correlation tended toward + 1, the two assets responded very similarly to shocks or market dynamics, which reduced the benefits of diversification. On the other hand, when the correlation was close to −1, hedging benefits increased.
The results of several timescales at 4, 8, 16, 32 and 62 weeks were analyzed (Figure 3, Figure 4, Figure 5, Figure 6 and Figure 7). Regarding the 4 week scale, it was found that the correlation between oil and ethanol was positive in almost all periods, with the exception of a short period of non-significance in the second half of 2014 until the beginning of 2020, after the first cases of COVID-19 in the US. From then on, the correlation became non-significant until the end of the sample period. Regarding the possible association between oil and natural gas, the strong correlation was found to change in the period after 2015; that is, from being positively related until that date, it became insignificant in the subsequent period. In relation to ethanol and natural gas, the dynamics of the relationship changed greatly in early 2021, from non-significant to a significant negative correlation.
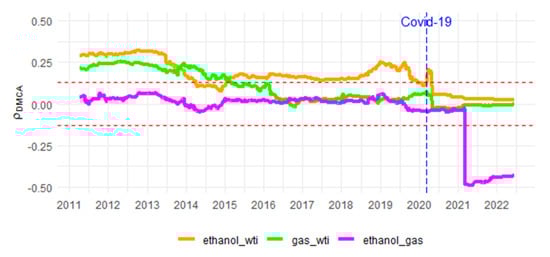
Figure 3.
Evolution of among ethanol, oil and natural gas, with timescales of 4 weeks and window size w = 250. Dashed lines represent critical values for statistical significance (95%) representing the lower and upper limits of the confidence interval, according to [46]. The vertical dashed line refers to the moment of the COVID-19 outbreak.
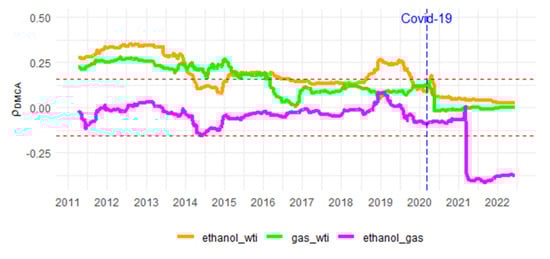
Figure 4.
Evolution of among ethanol, oil and natural gas, with timescales of 8 weeks and window size w = 250. Dashed lines represent critical values used to analyse the statistical significance of the correlation (with a 95% confidence level) representing the lower and upper limits of the confidence interval, according to [46]. The vertical dashed line refers to the moment of the COVID-19 outbreak.
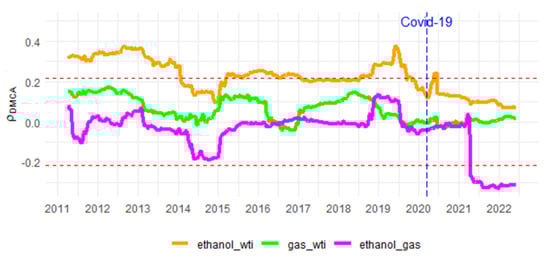
Figure 5.
Evolution of among ethanol, oil and natural gas, with timescales of 16 weeks and window size w = 250. Dashed lines represent critical values used to analyse the statistical significance of the correlation (with a 95% confidence level) representing the lower and upper limits of the confidence interval, according to [46]. The vertical dashed line refers to the moment of the COVID-19 outbreak.
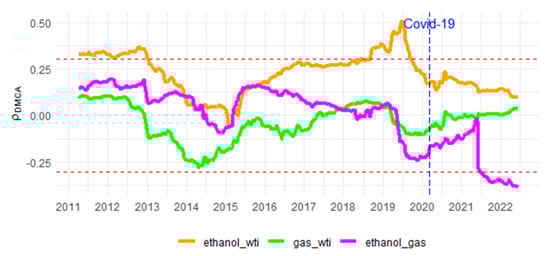
Figure 6.
Evolution of among ethanol, oil and natural gas, with timescales of 32 weeks and window size w = 250. Dashed lines represent critical values used to analyze the statistical significance of the correlation (with a 95% confidence level) representing the lower and upper limits of the confidence interval, according to [46]. The vertical dashed line refers to the moment of the COVID-19 outbreak.
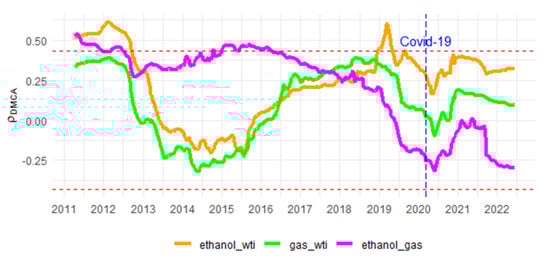
Figure 7.
Evolution of among ethanol, oil and natural gas, with timescales of 62 weeks and window size w = 250. Dashed lines represent critical values used to analyse the statistical significance of the correlation (with a 95% confidence level) representing the lower and upper limits of the confidence interval, according to [46]. The vertical dashed line refers to the moment of the COVID-19 outbreak.
It is worth noting that the dynamics of the natural gas correlations in relation to both ethanol and oil were similar in the 8, 16 and 32 week scales in relation to the shorter scale previously presented of 4 weeks. The main difference resides in the longer scale of 62 weeks, where the correlation between ethanol and natural gas became statistically non-significant. With regard to the correlation between ethanol and oil, in the 8 and 16 week scales, the dynamics were similar to the 4 week scale at 2 moments: at the beginning of the window until the first months of 2014, with a positive association; and after the threshold of 2020, with a non-significant relationship. The difference lies in the fact that, unlike what happened in the shorter scale, the character of the correlation alternated between not significant and significant in both scales over the period between 2014 and 2019. Finally, in the longer scales of 32 and 64 weeks, the correlations were not significant in the post-early-2013 period, with the exception of the period between late 2018 and 2019 on the 32 week scale as well as a short time horizon located in the first months of 2019 on the longer 62 week scale.
The drop in oil prices in 2012 was related to the lack of coordination in the supply composition of the main oil-producing countries and the lack of strength in the economy following the drop in aggregate demand caused by the great economic crisis and financial year of 2008. Furthermore, since 2014, there has been an oversupply in the market and the restructuring of global markets resulting from increased production in non-OPEC countries, centered on the US with the shale revolution. In 2020, part of the global economy again suffered from a recession, with the spread of the COVID-19 pandemic hitting the demand for fuel [2].
It is important to point out that the main results were consistent with the previous literature. The results of the non-correlation between oil and ethanol prices during the second half of 2014 shown in the shorter scales were also found by [37]. These authors found a low transmission of volatility spillover between energy prices (oil, gasoline and natural gas) as well as ethanol and agricultural commodities. The non-correlation was justified by the drop in oil prices in 2014, reducing the substitution effect between conventional fuels (oil-based) and biofuels [37]. Despite this, the rise in post-pandemic prices also showed no correlation between oil and ethanol prices.
The results involving oil and natural gas prices, however, indicated that there was a correlation until 2015. This result was similar to that found by [11], who emphasized that the shale revolution caused the connection between prices to decrease. Mensi, Rehman and Vo [8] also found a low correlation between the two products. Furthermore, [8,9,10,11,13] suggested that natural gas is one of the energy assets offering the most short-term diversification benefits.
Finally, the association between natural gas prices and ethanol is still incipient in the literature; the results during the pre-pandemic period were in line with those of [44] in the context of Brazilian ethanol, who found that American natural gas and Brazilian ethanol prices were unassociated both in the short- and long-term. A similar result was obtained by [13], who found that natural gas had a lower price ratio than the prices of other energy commodities, including oil and ethanol. In the most recent post-pandemic period, however, the results showed that ethanol and natural gas prices had negative correlations in all timescales except the longest timescale of 62 weeks.
5. Conclusions
With concerns about global warming, a deeper understanding of the dynamics of renewable and non-renewable assets is of crucial importance. The degree of association of such key assets in the composition of the energy matrix is relevant for several economic agents, both in the public sector for the formulation of public policies such as the process of decarbonizing the economy and for agents in the private sector in the diversification of investments in the composition of their portfolios.
In the present work, the degree of correlation between the energy assets of reference in the US markets—namely, WTI oil, Henry Hub natural gas and New York ethanol—was analyzed using the data of weekly log price returns between 23 June 2006 and 10 June 2022. Based on Kristoufek’s DMCA coefficient [20] together with sliding windows, the objective was to dynamically analyze the possible interrelationships over time.
Among the main results, it was found that in the most recent post-pandemic period, oil and natural gas had no correlation, either in short-term scales of 4, 8 and 16 weeks or in long-term scales of 32 and 62 weeks. Therefore, they formed a portfolio that tended to mitigate investment risks. On the other hand, also considering the most recent post-pandemic period, ethanol showed a significant negative correlation with natural gas in scales less than or equal to 32 weeks and was more pronounced in the short-term scales.
As a public policy, in addition to its performance as an alternative in portfolio investments, strengthening investments in the ethanol production chain is suggested in order to reinforce its position as an energy alternative. It is also more environmentally friendly.
Despite the contributions of this paper, it is important to identify possible limitations that could lead to future research aiming to continue to fill the existing gap in the literature. The effects of the war between Russia and Ukraine are still not fully known, given that structural changes in supply and demand tend to have a lag that could last many months or years after the start of the conflict (and which is ongoing). Another point concerns the methodological aspect of the present analysis. Although DMCA is a robust estimator, it is limited to a bivariate analysis, making a joint analysis of three or more variables unfeasible.
As a research agenda to deal with future prospects, new studies addressing the current dynamics of these markets in light of the global geopolitical crisis following the post-pandemic economic recovery are suggested with regard to the behavior of large oil and natural gas producers, particularly the belligerent issue between Russia and Ukraine and its effects as well as the potential reflection on the ethanol market. In methodological terms, it is also suggested that recently developed econophysics models are incorporated that allow an analysis with more than two variables together, such as the approach recently proposed by [48]. Another point would be to incorporate cost and demand structures in structural VAR-style modelling.
Author Contributions
Conceptualization, D.Q., C.O., I.U.H., P.F. and M.O.; methodology, D.Q., C.O., I.U.H., P.F. and M.O.; formal analysis, D.Q., C.O., I.U.H., P.F. and M.O.; writing—original draft preparation, D.Q., C.O., I.U.H., P.F. and M.O.; writing—review and editing, D.Q., C.O., I.U.H., P.F. and M.O. All authors have read and agreed to the published version of the manuscript.
Funding
Paulo Ferreira is pleased to acknowledge financial support from Fundação para a Ciência e a Tecnologia (grant UIDB/05064/2020).
Data Availability Statement
The data presented in this study are available on request from the corresponding author.
Conflicts of Interest
The authors declare no conflict of interest.
References
- Ferreira, P.; Almeida, D.; Dionísio, A.; Bouri, E.; Quintino, D. Energy markets—Who are the influencers? Energy 2022, 239, 121962. [Google Scholar] [CrossRef]
- Lee, Y.; Yoon, S.-M. Dynamic Spillover and Hedging among Carbon, Biofuel and Oil. Energies 2020, 13, 4382. [Google Scholar] [CrossRef]
- Benlagha, N.; Karim, S.; Naeem, M.A.; Lucey, B.M.; Vigne, S.A. Risk connectedness between energy and stock markets: Evidence from oil importing and exporting countries. Energy Econ. 2022, 115, 106348. [Google Scholar] [CrossRef]
- Gong, X.; Liu, Y.; Wang, X. Dynamic volatility spillovers across oil and natural gas futures markets based on a time-varying spillover method. Int. Rev. Financ. Anal. 2021, 76, 101790. [Google Scholar] [CrossRef]
- Cao, Y.; Cheng, S. Impact of COVID-19 outbreak on multi-scale asymmetric spillovers between food and oil prices. Resour. Policy 2021, 74, 102364. [Google Scholar] [CrossRef]
- Chen, Z.; Yan, B.; Kang, H. Dynamic correlation between crude oil and agricultural futures markets. Rev. Dev. Econ. 2022, 26, 1798–1849. [Google Scholar] [CrossRef]
- Corbet, S.; Goodell, J.W.; Günay, S. Co-movements and spillovers of oil and renewable firms under extreme conditions: New evidence from negative WTI prices during COVID-19. Energy Econ. 2020, 92, 104978. [Google Scholar] [CrossRef]
- Mensi, W.; Rehman, M.U.; Vo, X.V. Dynamic frequency relationships and volatility spillovers in natural gas, crude oil, gas oil, gasoline, and heating oil markets: Implications for portfolio management. Resour. Policy 2021, 73, 102172. [Google Scholar] [CrossRef]
- Mensi, W.; Rehman, M.U.; Maitra, D.; Al-Yahyaee, K.H.; Vo, X.V. Oil, natural gas and BRICS stock markets: Evidence of systemic risks and co-movements in the time-frequency domain. Resour. Policy 2021, 72, 102062. [Google Scholar] [CrossRef]
- Qin, Y.; Hong, K.; Chen, J.; Zhang, Z. Asymmetric effects of geopolitical risks on energy returns and volatility under different market conditions. Energy Econ. 2020, 90, 104851. [Google Scholar] [CrossRef]
- Lovcha, Y.; Perez-Laborda, A. Dynamic frequency connectedness between oil and natural gas volatilities. Econ. Model. 2020, 84, 181–189. [Google Scholar] [CrossRef]
- Serletis, A.; Xu, L. The ethanol mandate and crude oil and biofuel agricultural commodity price dynamics. J. Commod. Mark. 2019, 15, 100068. [Google Scholar] [CrossRef]
- Chiou-Wei, S.-Z.; Chen, S.-H.; Zhu, Z. Energy and Agricultural Commodity Markets Interaction: An Analysis of Crude Oil, Natural Gas, Corn, Soybean, and Ethanol Prices. Energy J. 2019, 40, 265–296. [Google Scholar] [CrossRef]
- Zhu, B.; Lin, R.; Deng, Y.; Chen, P.; Chevallier, J. Intersectoral systemic risk spillovers between energy and agriculture under the financial and COVID-19 crises. Econ. Model. 2021, 105, 105651. [Google Scholar] [CrossRef]
- Vatsa, P.; Miljkovic, D. Energy and crop price cycles before and after the global financial crisis: A new approach. J. Agric. Econ. 2022, 73, 220–233. [Google Scholar] [CrossRef]
- Tiwari, A.K.; Abakah, E.J.A.; Adewuyi, A.O.; Lee, C.-C. Quantile risk spillovers between energy and agricultural commodity markets: Evidence from pre and during COVID-19 outbreak. Energy Econ. 2022, 113, 106235. [Google Scholar] [CrossRef]
- Agrawal, R.; Verma, A.; Verma, S.; Varma, A. Industrial Methanogenesis: Biomethane Production from Organic Wastes for Energy Supplementation. In Recent Developments in Microbial Technologies; Springer: Berlin/Heidelberg, Germany, 2020; pp. 99–115. [Google Scholar] [CrossRef]
- Agrawal, R.; Bhadana, B.; Singh Chauhan, P.; Adsul, M.; Kumar, R.; Gupta, R.P.; Satlewal, A. Understanding the effects of low enzyme dosage and high solid loading on the enzyme inhibition and strategies to improve hydrolysis yields of pilot scale pretreated rice straw. Fuel 2022, 327, 125114. [Google Scholar] [CrossRef]
- RFA, Ethanol Industry Outlook. Renewable Fuels Association; RFA: Washington, DC, USA, 2022; Available online: https://ethanolrfa.org/library/rfa-publications (accessed on 15 February 2023).
- Kristoufek, L. Detrending moving-average cross-correlation coefficient: Measuring cross-correlations between non-stationary series. Phys. A Stat. Mech. Appl. 2014, 406, 169–175. [Google Scholar] [CrossRef]
- Akhtaruzzaman, M.; Boubaker, S.; Chiah, M.; Zhong, A. COVID−19 and oil price risk exposure. Financ. Res. Lett. 2021, 42, 101882. [Google Scholar] [CrossRef]
- Our World in Data. Coronavirus (COVID-19) Deaths. Available online: https://ourworldindata.org/covid-deaths#confirmed-deaths (accessed on 31 January 2023).
- Zhang, W.; Hamori, S. Crude oil market and stock markets during the COVID-19 pandemic: Evidence from the US, Japan, and Germany. Int. Rev. Financ. Anal. 2021, 74, 101702. [Google Scholar] [CrossRef]
- Sharif, A.; Aloui, C.; Yarovaya, L. COVID-19 pandemic, oil prices, stock market, geopolitical risk and policy uncertainty nexus in the US economy: Fresh evidence from the wavelet-based approach. Int. Rev. Financ. Anal. 2020, 70, 101496. [Google Scholar] [CrossRef]
- Bashir, M.F.; Sadiq, M.; Talbi, B.; Shahzad, L.; Adnan Bashir, M. An outlook on the development of renewable energy, policy measures to reshape the current energy mix, and how to achieve sustainable economic growth in the post COVID-19 era. Environ. Sci. Pollut. Res. 2022, 29, 43636–43647. [Google Scholar] [CrossRef]
- Bourghelle, D.; Jawadi, F.; Rozin, P. Oil price volatility in the context of Covid-19. Int. Econ. 2021, 167, 39–49. [Google Scholar] [CrossRef]
- Corbet, S.; Hou, Y.G.; Hu, Y.; Oxley, L. An analysis of investor behaviour and information flows surrounding the negative WTI oil price futures event. Energy Econ. 2021, 104, 105589. [Google Scholar] [CrossRef]
- Yu, Y.; Guo, S.; Chang, X. Oil prices volatility and economic performance during COVID-19 and financial crises of 2007–2008. Resour. Policy 2022, 75, 102531. [Google Scholar] [CrossRef]
- Dmytrów, K.; Landmesser, J.; Bieszk-Stolorz, B. The Connections between COVID-19 and the Energy Commodities Prices: Evidence through the Dynamic Time Warping Method. Energies 2021, 14, 4024. [Google Scholar] [CrossRef]
- Christopoulos, A.G.; Kalantonis, P.; Katsampoxakis, I.; Vergos, K. COVID-19 and the Energy Price Volatility. Energies 2021, 14, 6496. [Google Scholar] [CrossRef]
- Akyildirim, E.; Cepni, O.; Molnár, P.; Uddin, G.S. Connectedness of energy markets around the world during the COVID-19 pandemic. Energy Econ. 2022, 109, 105900. [Google Scholar] [CrossRef]
- Shaikh, I. Impact of COVID-19 pandemic on the energy markets. Econ. Chang. Restruct. 2022, 55, 433–484. [Google Scholar] [CrossRef]
- Szczygielski, J.J.; Brzeszczyński, J.; Charteris, A.; Bwanya, P.R. The COVID-19 storm and the energy sector: The impact and role of uncertainty. Energy Econ. 2021, 109, 105258. [Google Scholar] [CrossRef]
- Kuik, F.; Adolfsen, J.F.; Lis, E.M.; Meyler, A. Energy price developments in and out of the COVID-19 pandemic–from commodity prices to consumer prices. Econ. Bull. Artic. 2022, 4. Available online: https://www.ecb.europa.eu/pub/economic-bulletin/articles/2022/html/ecb.ebart202204_01~7b32d31b29.en.html (accessed on 31 January 2023).
- Energy Information Administration (EIA). U.S. Total Energy Statistics. Available online: https://www.eia.gov/energyexplained/us-energy-facts/data-and-statistics.php (accessed on 31 January 2023).
- Khan, K.; Su, C.-W.; Zhu, M.N. Examining the behaviour of energy prices to COVID-19 uncertainty: A quantile on quantile approach. Energy 2022, 239, 122430. [Google Scholar] [CrossRef]
- Naeem, M.A.; Peng, Z.; Suleman, M.T.; Nepal, R.; Shahzad, S.J.H. Time and frequency connectedness among oil shocks, electricity and clean energy markets. Energy Econ. 2020, 91, 104914. [Google Scholar] [CrossRef]
- Barbaglia, L.; Croux, C.; Wilms, I. Volatility spillovers in commodity markets: A large t-vector autoregressive approach. Energy Econ. 2020, 85, 104555. [Google Scholar] [CrossRef]
- Farid, S.; Kayani, G.M.; Naeem, M.A.; Shahzad, S.J.H. Intraday volatility transmission among precious metals, energy and stocks during the COVID-19 pandemic. Resour. Policy 2021, 72, 102101. [Google Scholar] [CrossRef]
- Zebende, G.F. DCCA cross-correlation coefficient: Quantifying level of cross-correlation. Phys. A Stat. Mech. Appl. 2011, 390, 614–618. [Google Scholar] [CrossRef]
- Guedes, E.F.; Zebende, G.F. DCCA cross-correlation coefficient with sliding windows approach. Phys. A Stat. Mech. Appl. 2019, 527, 121286. [Google Scholar] [CrossRef]
- Tilfani, O.; Ferreira, P.; Dionisio, A.; El Boukfaoui, M.Y. EU Stock Markets vs. Germany, UK and US: Analysis of Dynamic Comovements Using Time-Varying DCCA Correlation Coefficients. J. Risk Financ. Manag. 2020, 13, 91. [Google Scholar] [CrossRef]
- Tilfani, O.; Ferreira, P.; El Boukfaoui, M.Y. Dynamic cross-correlation and dynamic contagion of stock markets: A sliding windows approach with the DCCA correlation coefficient. Empir. Econ. 2021, 60, 1127–1156. [Google Scholar] [CrossRef]
- Quintino, D.D.; Burnquist, H.L.; Ferreira, P.J.S. Carbon Emissions and Brazilian Ethanol Prices: Are They Correlated? An Econophysics Study. Sustainability 2021, 13, 12862. [Google Scholar] [CrossRef]
- Quintino, D.D.; Burnquist, H.L.; Ferreira, P. Relative Prices of Ethanol-Gasoline in the Major Brazilian Capitals: An Analysis to Support Public Policies. Energies 2022, 15, 4795. [Google Scholar] [CrossRef]
- Guedes, E.F. How Statistically Significant is the DMCA Coefficient? Fluct. Noise Lett. 2021, 21, 2250021. [Google Scholar] [CrossRef]
- Ferreira, P.; Kristoufek, L.; Pereira, E.J.d.A.L. DCCA and DMCA correlations of cryptocurrency markets. Phys. A Stat. Mech. Its Appl. 2020, 545, 123803. [Google Scholar] [CrossRef]
- Cao, G.; Xie, W. Detrended multiple moving average cross-correlation analysis and its application in the correlation measurement of stock market in Shanghai, Shenzhen, and Hong Kong. Phys. A Stat. Mech. Appl. 2022, 590, 126760. [Google Scholar] [CrossRef]
Disclaimer/Publisher’s Note: The statements, opinions and data contained in all publications are solely those of the individual author(s) and contributor(s) and not of MDPI and/or the editor(s). MDPI and/or the editor(s) disclaim responsibility for any injury to people or property resulting from any ideas, methods, instructions or products referred to in the content. |
© 2023 by the authors. Licensee MDPI, Basel, Switzerland. This article is an open access article distributed under the terms and conditions of the Creative Commons Attribution (CC BY) license (https://creativecommons.org/licenses/by/4.0/).