1. Introduction
In light of the growing demand for energy, the main challenges primarily include ensuring the availability of energy at prices that will not affect the development and competitiveness of the Polish economy in a negative manner. On the other hand, it is necessary to ensure the stability of electricity supplies, i.e., the energy security of the country with an increasing economic recession and growing ecological problems. These are the current energy crisis and price fluctuations on the oil and gas market in connection with the sanctions imposed on Russia that draw special attention of specialists and those in power to this sector.
Continuity of fuel and energy supply is an indispensable condition for the functioning and further development of society. We define this necessity as energy security, i.e., the ability of the economy to meet the expected demand of consumers for fuels and energy in a technically and economically substantiated manner, while maintaining the requirements of environmental protection. Hence, we not only expect that such a system will be resistant to exceptional and unpredictable events that may threaten its physical integrity, but also expect that such events, regardless of the economic grounds, will not lead to an unstoppable increase of prices.
Energy security is a relatively complex issue and depends on many technological, economic and political factors, to name the most important ones. This paper is intended to focus on the assessment of economic and financial factors. Many studies are being carried out to reduce electricity consumption in various areas of economic life through technological innovations [
1]. In this paper, it was decided to focus on a thorough assessment of economic and financial factors and to refer to political issues in a more general way.
As results from the report titled “Fuelling the Energy Crisis” [
2] show, the global energy sector has an expected year-on-year rate of return of 10%, which results from a 12-month dividend yield of 5% and a long-term dividend growth rate of 4.7% year-on-year, as well as a small expected expansion in valuation, which could make energy stocks a secular winner in the coming decade.
In this context arise a number of questions that constitute a wide field of research problems to be considered. First of all, there is the issue of energy companies ensuring energy security for all consumers. Moreover, the question arises whether Polish companies are able to adapt to the growing demand for electricity while meeting the growing environmental requirements imposed by the EU. Therefore, important questions are how the current energy crisis will affect the financial condition of energy companies in Poland and whether companies from the energy sector will benefit from this crisis. In addition, there is still the impact of the crisis on society, i.e., how the current crisis will affect the sense of security of consumers.
It is impossible to answer all these questions in one study, which is why the article focuses on a narrowed area of exploration including these questions: how the current energy crisis will affect the financial condition of companies from the energy sector and how it will affect the energy security of energy consumers in Poland. The article aims to assess the energy security of consumers from the perspective of the stability of energy prices and the financial condition of companies from the energy industry in Poland in the context of the global energy crisis.
2. Materials and Methods
Issues related to energy security have been explained on the basis of the Energy Law Act, explanations of the International Energy Agency and available literature in the discussed field. The analysis of the energy market in Poland has been carried out on the basis of data from the Energy Regulatory Office and reports of institutions operating in the energy sector. The companies for the analysis were selected on the basis of the criterion of share in energy production in Poland. In this article, the study has covered four large energy groups operating in the energy market in Poland: PGE SA, Tauron SA, GK Enea SA and Energa Grupa Orlen SA, which generate about 70% of energy in the country [
3]. The assessment of the financial condition of the companies has been carried out on the basis of the consolidated financial statements of the audited companies for the years 2020–2021. Selected financial ratios have been used for the analysis, the formula and interpretation of which have been presented in
Table 1.
In order to obtain a more complete picture of the companies’ financial situation, the dynamics of fixed and current assets, sales revenues and operating profit have been calculated and analyzed. Additionally, the dynamics of sales revenue and operating profit have been analyzed based on the consolidated financial statements for the first half of 2021 and the corresponding period of 2022 in order to obtain the most up-to-date data on the current situation of the described enterprises.
Discriminatory models have also been applied in the article in order to predict the bankruptcy of the surveyed companies. Discriminant analysis is divided into univariate and multivariate analysis. The first of the aforementioned analyses consists of the use of models examining the condition of the company on the basis of several selected indicators and, depending on their value, separately for each indicator, the enterprises are classified as those threatened or not threatened with bankruptcy. The second type of analysis, i.e., multivariate analysis, uses models consisting of several properly selected indicators, and unlike the univariate analysis, a company is included in the relevant group on the basis of the analysis of all indicators considered collectively [
7]. Research shows that discriminatory models are highly effective in predicting bankruptcy of enterprises. However, it cannot be said that there is a model with the highest efficiency. Therefore, when conducting this analysis, more than one model should be applied [
8]. In the literature related to discriminant analysis, there is a lot of criticism regarding the use of foreign models in the case of Polish enterprises, and this is caused, among others, by macroeconomic differences in such areas as interest rates, inflation level, tax system, economic situation, etc. [
9]. Despite the above reservations, the research results show that foreign models may also prove effective when applied to the conditions of the Polish economy [
8]. Taking these considerations into account, herein a multidimensional model (foreign and Polish) has been used for the discriminant analysis: the Altman EM-Score and the Gajdka and Stos model. Next to the discriminant models, D. Wędzki’s multi-discipline, non-collinear logit model (M5) has also been used for the analysis.
Table 2 contains the form of the models used along with the interpretation of the Z function.
The same nomenclature of the classification rules has been adopted in order to unify and transparently interpret the results of the study including the following: safe zone (enterprise in good financial condition), gray zone (area of uncertainty) and distress zone (threat of bankruptcy).
3. Results
3.1. Energy Security
Energy is the link between national security, economic prosperity and environmental issues. The United Nations Development Programme (UNDP) defines energy security as “the uninterrupted availability of energy in various forms, in sufficient quantities and at affordable prices, without unacceptable or irreversible impact on the economy and the environment” [
13].
According to the definition included in the Energy Law [
14], energy security should be understood as the condition of the economy that allows covering the current and prospective demand of consumers for fuels and energy in a technically and economically substantiated way, while maintaining the requirements of environmental protection. In other strategic documents, this notion has also been defined by adding a caveat to the statutory definition that this concept is also related to guaranteeing the security of raw material supplies, generation, transmission and distribution of energy, i.e., the full energy chain. The International Energy Agency (IEA) defines energy security as the uninterrupted availability of energy sources and their price affordability. The IEA emphasizes the multi-faceted nature of the concept, including long-term energy security, mainly related to investments in energy infrastructure in accordance with economic development and environmental needs, and short-term energy security focusing on the ability of the energy system to react quickly to sudden changes in the balance of energy supply and demand [
15].
Similarly, Sovacool and Rafey [
16] define energy security as a set of four dimensions: (a) availability, which includes diversification of fuel sources eligible for the stabilization of disruptions and reduction of dependence on energy imports; (b) affordability, which includes increasing the affordability of energy services and minimizing price volatility; (c) efficiency and development, which include increasing energy efficiency, influencing consumer attitudes and building energy infrastructure; and (d) sustainable development, which leads to the protection of environmental resources as well as societies and future generations.
Energy security is an element of the national security system, since reliable and permanent access to energy sources, affordable to the society, is an essential element of every modern economy. In general, energy security is a state of the economy that ensures that the current and future demand for fuels and energy is satisfied in a technically and economically justified manner, with minimal negative impact of the energy sector on the environment and living conditions of the society [
17].
When defining energy security in the economic aspect, particular attention should be paid to the issue of price. K. Żukrowska defines energy security as the availability of energy sources of various origin at any time, in accordance with the demand for energy from these sources, as well as in appropriate quantities securing the declared demand. An inherent element of energy security is the level of prices, which must be maintained to allow for normal energy consumption by end consumers [
18].
Polish society is characterized by a high level of consumption; the demand for energy has been increasing. In order to ensure that customers maintain the current level of production and in order to create conditions for further economic growth, energy should be easily available and affordable, and the system of its supply should be resistant to disruptions. Longer power outages can lead to significant financial losses and cause chaos in economic centers. They can also cause potential health damage and affect the wealth of society. Ecological aspects, sustainable development and environmental protection for present and future generations are also important here.
3.2. Energy Security: Economic and Financial Perspective
Energy security is multi-faceted and includes political, economic, and ecological conditions. Economic security can be understood as a state in which the economy of a given country has a supply of production factors, including energy sufficiency ensured for its functioning and development. Thus, the energy sector directly affects the efficiency and competitiveness of the state economy [
19].
The available literature deals mainly with internal and external factors affecting energy security. Internal factors include, among others, technological development, infrastructure and legal solutions. External factors, on the other hand, are the security of fuel and raw material supplies as well as international cooperation [
20].
The impact of the crisis on the energy sector has been noticed by the International Energy Agency (IEA). According to the IEA assessment, “the COVID-19 pandemic has caused more disruption to the energy sector than any event in history, leaving a mark that will be felt for many years to come.” [
21]
It is worth emphasizing that the literature review shows that there are no available studies containing an analysis of the financial condition of energy companies in the context of energy security. In the changing political and economic situation, the functioning of these enterprises and their continuation of operation are among the factors ensuring this security.
3.3. Energy Crisis of 2020–2022
From 2010 to 2019, Poland’s gross domestic product (GDP) increased by 38%, and the economic growth rate in 2019 was 4.7%, well above the European Union (EU) average of 1.5%. Economic growth in Poland contributed to a significant increase in energy demand. Between 2010 and 2019, total final consumption (TFC) increased from 70 million tonnes of oil equivalent (Mtoe) to 75 Mtoe, mainly due to increased energy demand in transport and industry. However, from 2010 to 2019, the energy intensity of the Polish economy (TFC per GDP) decreased from 79 tonnes of oil equivalent (toe) to 61 toe per million USD. The outbreak of the coronavirus pandemic had a large impact on the Polish economy and energy system. In 2019 and 2020, GDP fell by 2.7%, total energy supply (TES) fell from 103 Mtoe to 98 Mtoe and TFC dropped from 77.3 Mtoe to 75.8 Mtoe. The Polish economy began to recover from the consequences of the pandemic, and in 2021 GDP increased by 3.7%. However, the growing demand, greater use of fossil fuels and rising emissions in 2021 were not in line with the goals needed to support the energy transition and tackle climate change [
22].
The volume of gross domestic electricity production in 2021 was at a higher level compared to the previous year and amounted to 173,583 GWh (an increase of 14% compared to 2020). According to an official report [
20], in the analyzed period “gross domestic electricity consumption amounted to 174,402 GWh and increased by 5.4%. compared to 2020”. In 2021, the share of imports in the national balance of physical electricity flows was 8.0% of total revenue, and the share of exports amounted to 7.6% of electricity consumption. Compared to 2020, the share of imports decreased by 3.8%, while the share of exports increased by 3.4%. The structure of electricity production in 2021 changed slightly compared to 2020. The vast majority of generation is still based on conventional fuels, i.e., hard coal and brown coal [
23].
According to data presented by The Energy Regulatory Office in Poland, similarly to previous years, the PGE SA capital group had the largest share in the energy market in the electricity generation sub-sector. It amounted to 42.4%, while in 2020 it was 40.6%. In the audited period, this group also maintained its leading position in the market of sales to end customers. The market share indicator of the three largest entities, measured according to the energy supplied into the grid (including the amount of energy supplied by producers directly to end users), in 2021—after two years of decline—increased significantly and amounted to 67.1%. (an increase of 3.3% compared to 2020). A clear downward trend continued for the share indicator of the three largest generators in the installed capacity: a decrease by 3.8%. The three largest generators (integrated in capital groups: PGE Polska Grupa Energetyczna SA, ENEA SA and TAURON Polska Energia SA) had between them over half of the installed capacity and supplied over 2/3 of electricity production in the country. It is worth noting that in 2021, the number of entities that held at least 5% of share of installed capacity had changed when compared to the previous year. Another producer, PKN Orlen SA, joined this group. After its takeover of producers from the ENERGA SA capital group in 2020, it also became an entity of significance on the energy generation market [
24].
The next year, 2021, was another year of increasing electricity prices and distribution fees: in all tariff groups, prices reached the highest level in the analyzed period. As mentioned by The Energy Regulatory Office “the average energy price for the fourth quarter of 2021, compared to the price in the same period of the previous year, shows an increase of 6.62 percent, and distribution fees increased by 16.35 percent on average”. The collected data show that for household customers, the increase in prices amounted to an average of 6.47%; however, it should be remembered that over 60% of these customers benefit from the prices set in the tariffs approved by the President of the Energy Regulatory Office. The cost of the electricity supply increased by 10.38% on average, because the dynamics of the increase in distribution fees was also well above average (in the group of households, the increase was 15.92%, and the highest, 32.48%, was in the group B tariff). The price of energy, rates of distribution fees and the total cost of energy supply increased in all groups of consumers, and their value (in nominal terms) was at an unprecedented level [
25].
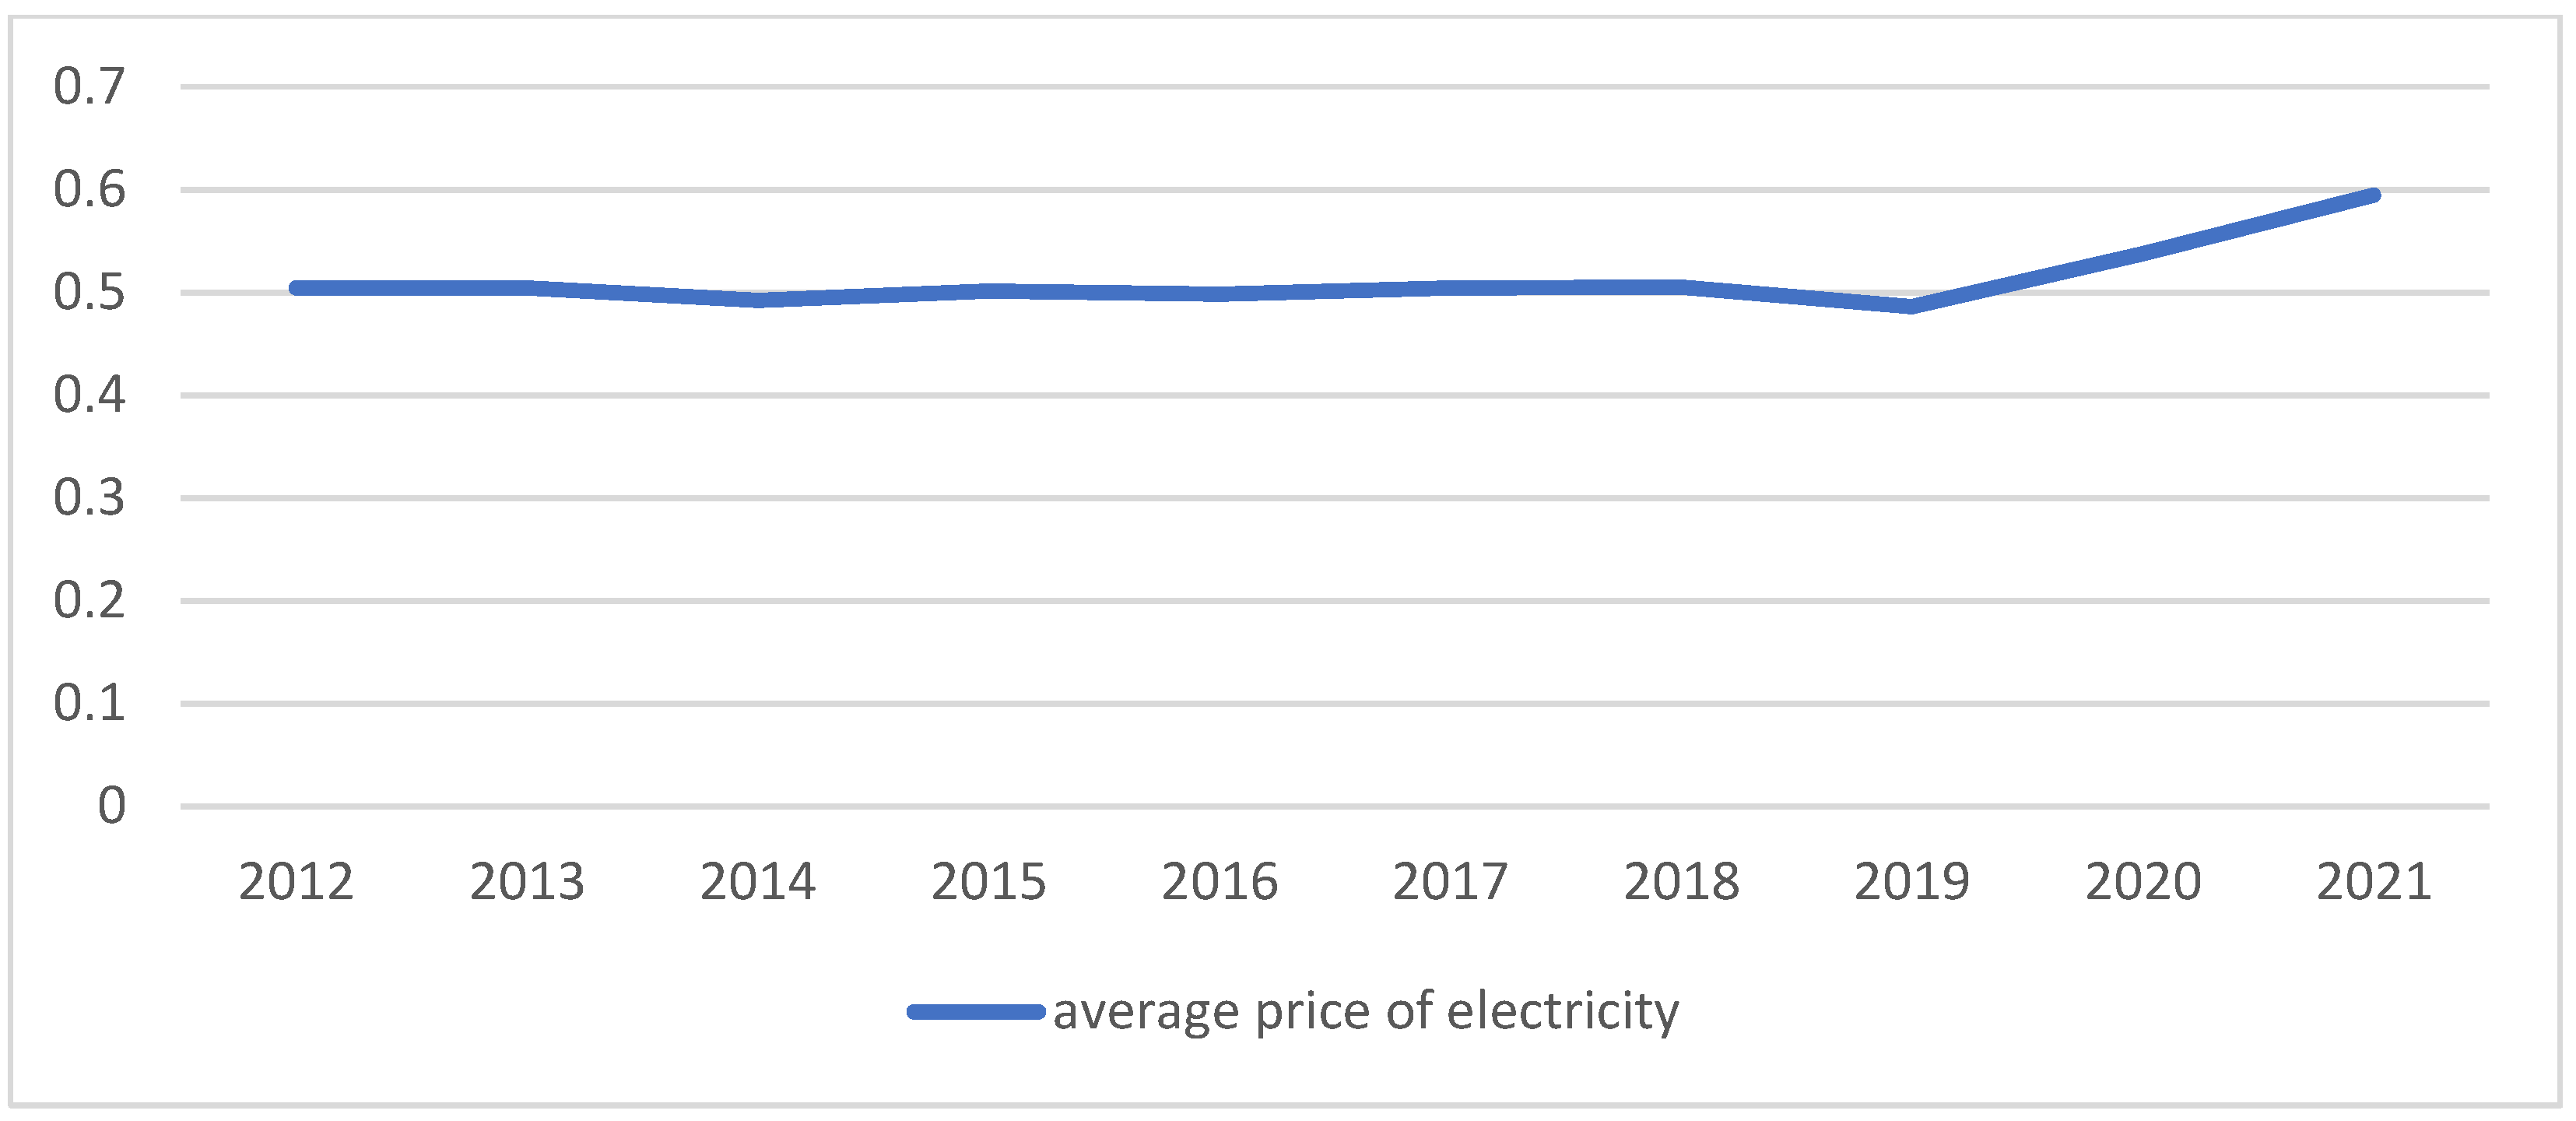
Figure 1 shows the evolution of average electricity prices for households in 2012–2021. From 2012 to 2019, the average price remained at a similar level. The increase in energy prices occurred in 2020 and reached the highest price in ten years of PLN 0.5947/kWh in 2021.
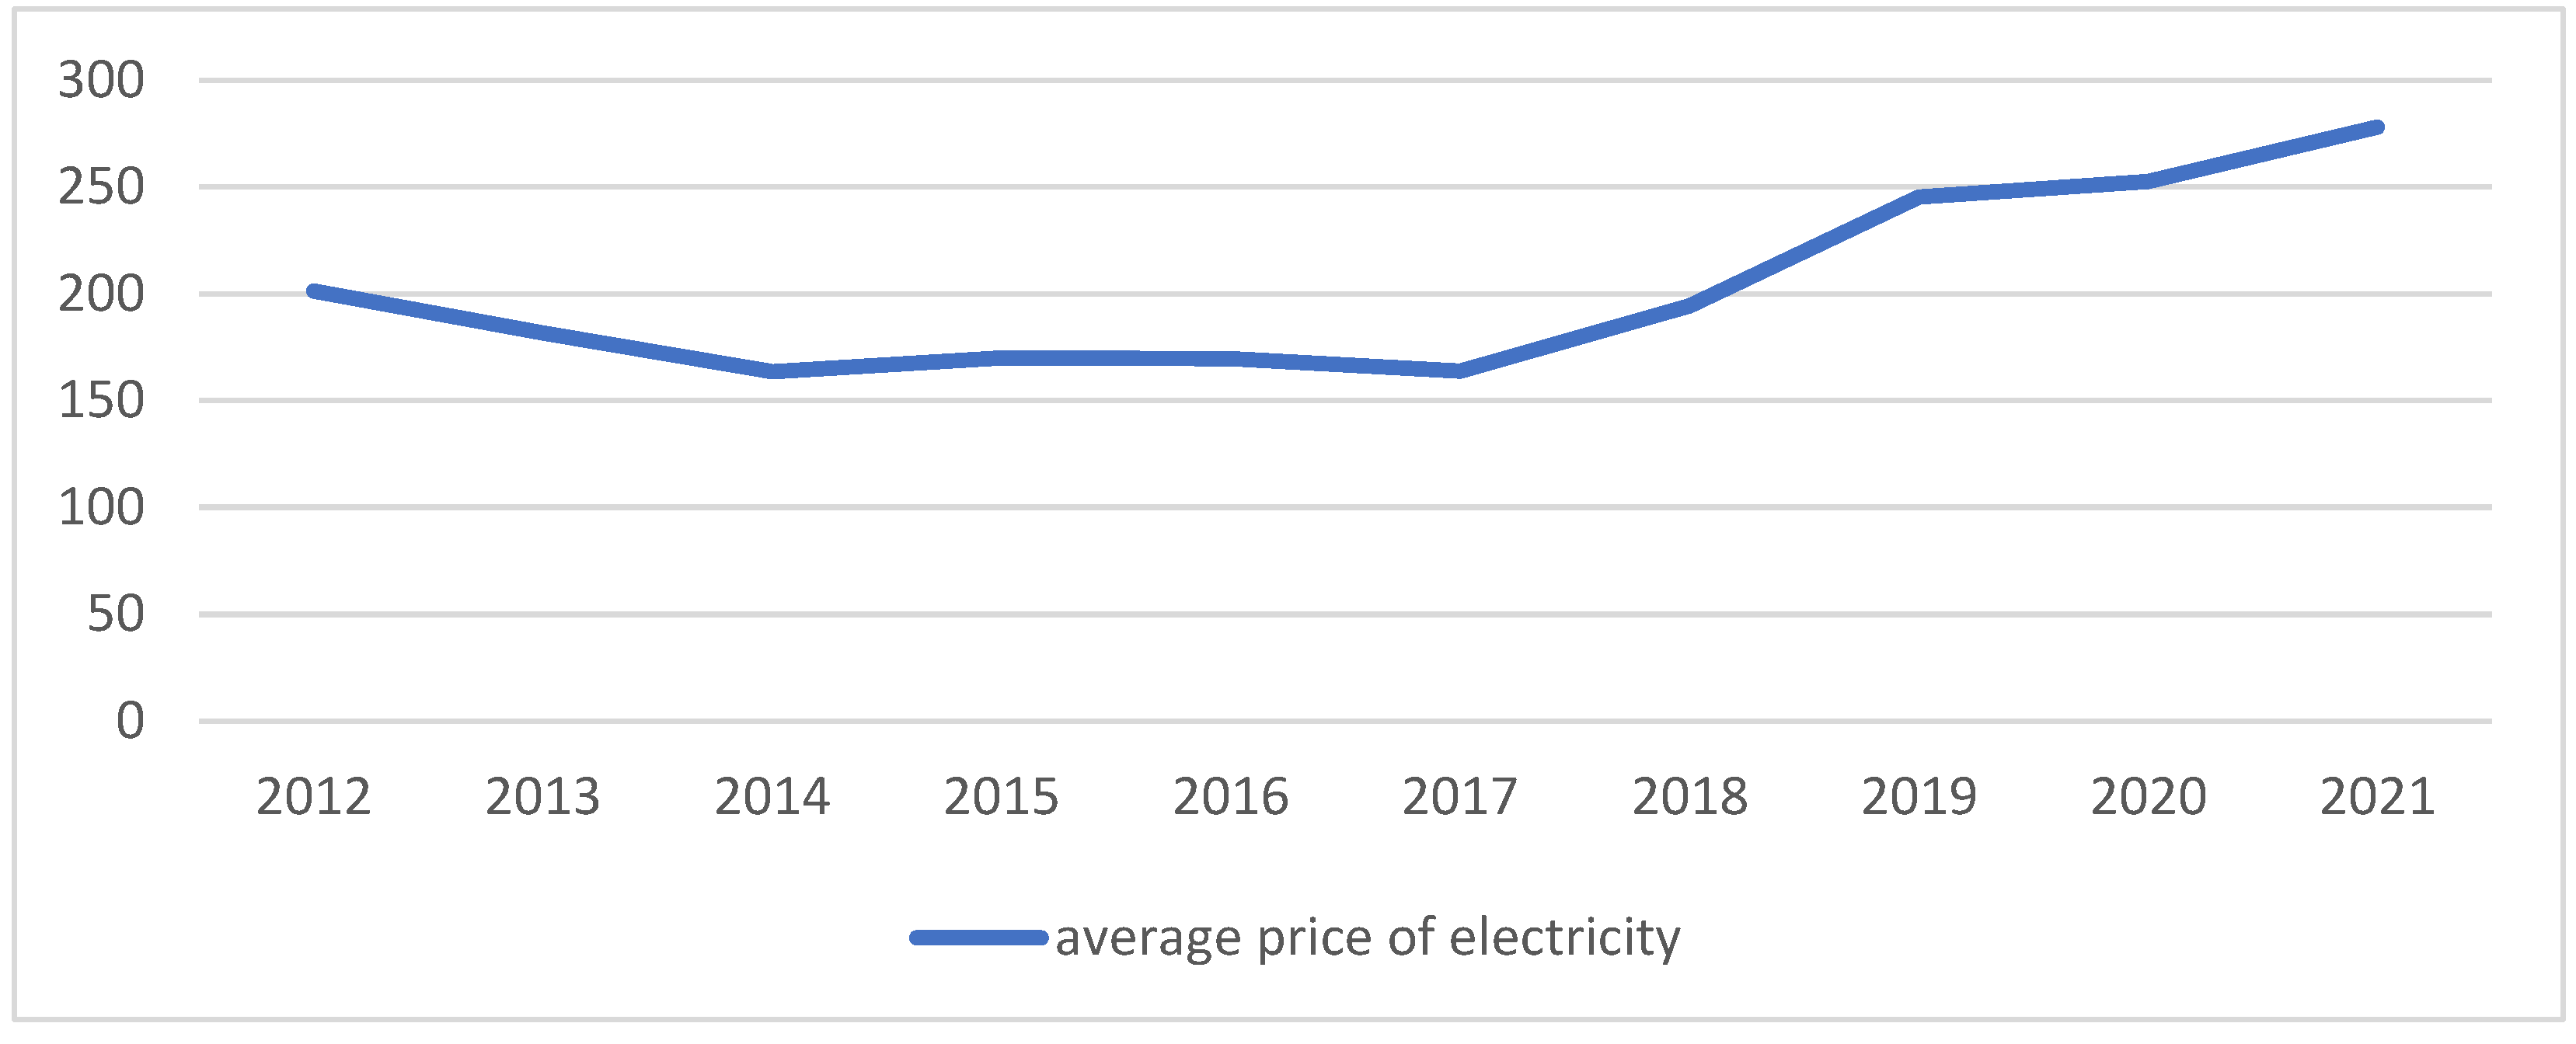
The evolution of electricity prices is illustrated by price indices published by the President of the Energy Regulatory Office that include average annual and quarterly electricity sales prices on the competitive market. The average selling price of electricity on the competitive market had been increasing significantly since 2018. In 2021, this price increased by 38.1% when compared to 2012.
Figure 2 shows the development of average electricity prices on the competitive market through a ten-year perspective since 2012.
There are many reasons for the energy crisis. From 2021, energy prices have been rising sharply in the EU and globally. Although to some extent, the economic recovery from the COVID-19 pandemic and the easing of transport restrictions have been expected to have this effect, energy prices are higher than expected. Many factors had contributed to the increase in prices from 2021. First of all, gas prices increased on global markets (by over 170% in 2021) and in the EU (by over 150% between July 2021 and July 2022). In addition, extreme climate conditions, including summer heat waves across Europe, have increased energy demand for cooling and have been increasing pressure on electricity generation. There has also been a higher demand for liquefied natural gas, which resulted in a sharp increase in its prices as well as higher gas consumption in Asia, resulting from the economic recovery in this region. The problem of rising energy prices has been further aggravated by Russia’s military aggression against Ukraine. In 2022, Russia decided to stop supplying gas to a number of EU countries. This has reduced the reliability of supplies and pushed gas prices to a record high level. High gas prices have contributed to a sharp rise in electricity prices throughout the European Union [
28].
3.4. Financial Condition of Companies in the Energy Sector
The
Table 3 presents the results of the analysis of the financial condition of the discussed companies, using selected financial ratios. The ratios have been calculated on the basis of the consolidated financial statements of energy companies from 2021 [
29,
30,
31,
32].
Dynamics of fixed assets and current assets, operating profit and sales revenues have been calculated to assess the financial standing of the enterprises (
Table 4) [
29,
30,
31,
32].
A comparison has also been made of the obtained sales revenues and operating profit for the first half of 2022 compared to the corresponding period of 2021 (
Table 5). Data from consolidated financial reports for the 1st half of 2022 have been used [
33,
34,
35,
36].
According to the conducted analysis, in 2020–2021, the surveyed enterprises were characterized by reduced financial liquidity, which was mainly due to the high level of short-term receivables. The total debt ratio was around 0.5, which indicated that the companies were not heavily in debt and there was a low credit risk. In 2020, three of the companies in question incurred an operating loss and a net loss, which translated into negative return on sales and return on assets. Only PGE SA recorded a positive financial result, but the ROS and ROA ratios were low: 0.32% and 0.18%, respectively. In 2021, this situation changed significantly. The sales revenues of all the analyzed companies increased, with the highest increase (by 73.7%) recorded by Enea SA Capital Group, and the lowest by Energa Grupa Orlen SA (increase by 13%). In 2021, all the investigated companies achieved an operating profit and a net profit.
In addition, in the first half of 2022, the companies recorded an operating profit, which increased in all the analyzed enterprises, compared to the corresponding period of 2021. Energa Grupa Orlen SA achieved the highest EBIT growth (71.3%), while Enea SA Capital Group, for which EBIT increased by 7.9%, achieved the lowest. In this period, the revenues from the sale of the following companies also increased: the Enea SA Capital Group (48.9%); Energa Grupa Orlen SA (42.7%); PGE SA (48.6%); and Tauron PE SA (52.7 %).
Based on the conducted analysis, it can be concluded that the financial condition of the companies improved in 2021. All enterprises recorded an operating profit, in contrast with an operating loss in 2020. PGE SA is an exception that also recorded an operating profit of PLN 1,408,000 in 2020. The return on assets and sales ratios also increased in 2021, of which the highest ROA (5.15%) and ROS (8.39%) were recorded by the Enea SA Capital Group. It is worth noting that there was an increase in sales revenues in 2021 compared to 2020 in all the discussed enterprises. The highest increase in sales revenues took place in the Enea SA Capital Group in 2021, where sales revenues, when compared to the previous year, increased by 73.7%; the lowest increase, by 13%, related to Energa SA. The upward trend in sales revenues continued also in the first half of 2022. Compared to the corresponding period of 2021, all the analyzed companies saw an increase in sales revenues from 42.7% (Energa SA) to 52.7% (Tauron SA).
The
Table 6 presents the results of the bankruptcy prediction analysis for the surveyed companies, based on data from the financial statements for 2021 [
29,
30,
31,
32].
Applying three selected models, the discriminant analysis shows that two of the analyzed companies (the Enea SA Capital Group and PGE SA) are not at risk of bankruptcy. The study shows that Energa Grupa Orlen SA and Tauron SA are in the danger zone in accordance with the Altman model, but the Z function value is close to the gray zone limit value (4.15). Wędzki’s logit model indicates an increased risk of bankruptcy for Energa and Tauron. However, it should be emphasized that the value of the Z function in both cases exceeds the classification value only slightly; in the case of Energa the value of the function is 0.59, while for Tauron it is 0.71 (at the limit value of 0.5). Taking into account the above considerations, it can be concluded that in all the surveyed companies, two out of three models indicated a low risk of bankruptcy of the surveyed enterprises. Only the Altman model indicated the increased risk of bankruptcy for Energa and Tauron.
3.5. The Assessment of Energy Security of Energy Consumers in Poland
The energy security assessment should be considered in two aspects:
- -
from the point of view of the stability of energy prices for consumers,
- -
financial condition of energy companies in Poland.
To protect consumers of electricity, the government proposed a solution called the Solidarity Shield. It assumes that energy prices in 2023 will be frozen at the level of 2022. The act on special solutions to protect electricity consumers in 2023 entered into force on October 18, 2022 [
37]. The energy price will be frozen at the 2022 level for the following limits:
- -
up to 2 MWh per year for all households,
- -
up to 2.6 MWh per year for households with people with disabilities,
- -
up to 3 MWh per year for households with a Big Family Card and farmers.
Government assistance was also provided to micro, small- and medium-sized enterprises and local government units, including such critical entities as schools and health care facilities. The adopted solutions for the protection of the above-mentioned groups of recipients assume that regardless of the increase in electricity prices on the wholesale market in 2023, in settlements with consumers, the maximum price of PLN 785/MWh will be applied [
38]. Moreover, the act on special solutions to protect electricity consumers in 2023, due to the situation in the electricity market, introduces an electricity benefit of PLN 1000 that will be granted to households that in 2021 consumed up to 5 MWh of electricity, a benefit of PLN 1500 for consumption above 5 MWh. Households that have invested in photovoltaic technology or have benefited from other forms of compensation related to the use of coal, pellets, oil, LPG and wood will not receive the electricity allowance [
37] (Article 27).
According to the financial analysis of energy companies in Poland, their financial condition in 2021 improved. In all the surveyed companies, sales revenues and operating profit increased in 2021. These increases were also maintained in the first half of 2022. It is worth adding that in 2020–2021, the companies had low financial liquidity; the current liquidity ratio in all surveyed companies was below the reference value (1.2–2.0). This is mainly due to the high level of short-term liabilities in relation to current assets. It should be emphasized that the sector average is generally lower than the recommended value and amounted to 1.06 (for Q4 in 2021). In addition, the bankruptcy prediction models used indicate a low risk of bankruptcy, so the continued operation of the analyzed companies is not at risk.
4. Discussion
Energy security of energy consumers means that they should be provided with supplies of this energy at a relatively constant level meeting their minimum existential needs, and the costs of the purchase of energy would not exceed the capabilities of an average consumer. In practice, this means that in order to effectively perform their tasks, key energy suppliers must survive on the market, i.e., maintain financial parameters at the appropriate level, while the energy price regulator, the Energy Regulatory Office in Poland, should ensure the purchasing power of the average citizen. In light of the conducted analyses, it has been shown that in Poland both conditions shall be met in the nearest future, and therefore the citizens should be deemed as those whose energy security has been secured. However, the situation in this area is quite dynamic, and the current energy crisis is not easy to predict. Therefore, the situation in this area should be constantly monitored, and the methodology presented in this article seems to be a good tool serving this purpose.
When analyzing the situation on the energy market in Poland, the authors noticed a research gap consisting in the fact that the existing studies do not analyze the issue of energy security in terms of the impact of the global crisis on the financial condition of energy companies. Of course, the financial condition is only one of many factors that should be taken into account when analyzing the energy security of recipients in a given country. Further research should also consider other factors of influence, such as the management method in the entire energy sector, legal regulations, energy infrastructure, diversification of energy sources and the forecast of energy demand by consumers vs. the possibilities of its generation by distributors.
5. Conclusions
Energy security is a key factor in economic and social development and meeting the basic needs of consumers. The current energy crisis is a major challenge for countries, energy companies and electricity consumers, which is why a number of measures are being taken to meet these challenges. The energy price regulator has taken adequate measures to address the current situation, contributing in the near future to the stabilization of the energy market.
The conducted research has shown that energy companies in Poland are financially stable, and their continuation of operation is not at risk. From the point of view of the stability of energy prices and the financial condition of companies in the energy sector in Poland, in the context of the global energy crisis, it can be stated that energy security is maintained. However, it should be emphasized that the research has been carried out under the current economic conditions, and due to the high dynamics, the situation may change in the short-term perspective.
The authors are aware that energy security is multi-faceted and includes a number of conditions. This article was aimed at assessing the financial condition of enterprises in the energy sector and linking this condition with energy security.


