Article

Performance Assessment of Coupled Concentrated Photovoltaic-Thermal and Vacuum Membrane Distillation (CPVT-VMD) System for Water Desalination

by
Juan Pablo Santana
1,
Carlos I. Rivera-Solorio
1,*,
Jia Wei Chew
2,
Yong Zen Tan
2,
Miguel Gijón-Rivera
3 and
Iván Acosta-Pazmiño
1
1
Tecnologico de Monterrey, Escuela de Ingeniería y Ciencias, Ave. Eugenio Garza Sada 2501, Monterrey 64849, NL, Mexico
2
School of Chemical and Biomedical Engineering, Nanyang Technological University, 62 Nanyang Drive, Singapore 637459, Singapore
3
Tecnologico de Monterrey, Escuela de Ingeniería y Ciencias, Vía Atlixcáyotl 5718, Reserva Territorial Atlixcáyotl, Puebla 72453, PUE, Mexico
*
Author to whom correspondence should be addressed.
Energies 2023, 16(3), 1541; https://doi.org/10.3390/en16031541
Submission received: 18 December 2022 / Revised: 16 January 2023 / Accepted: 24 January 2023 / Published: 3 February 2023
(This article belongs to the Special Issue Water Desalination Plants Driven by Hybrid Energy Conversion Systems)

Abstract

:
Numerical simulations were carried out to assess the technical and economic feasibility of a solar water desalination system that has a novel hybrid Concentrating Photovoltaic Thermal (CPVT) collector coupled with a Vacuum Membrane Distillation (VMD) process. A special characteristic of this CPVT is its triangular receiver with PV cells facing the reflecting surface. This type of receiver has the advantage of generating more electricity with less PV surface area and great potential to be used to hybridize conventional parabolic thermal collectors. TRNSYS was employed to analyze the annual performance of the CPVT-VMD system evaluating parameters such as solar fraction, specific permeate production and specific energy production for different coastal cities. In the dynamic simulations, local annual weather data and specific information about the characteristics and operating conditions of a real CPVT collector and a VMD module were considered. From the parametric analysis the optimal surface area of collectors and the input temperature of the VDM module were determined. A maximum specific permeate of 218.410 m 3/m2VMD for Acapulco, MX, and a minimum of 170.365 m 3/m2VMD for Singapore, SG, were achieved for the proposed CPVT-VMD system of four solar collectors with an operating set temperature of 55 °C. An economic profit was found after 7 years for Acapulco city, which showed great potential to use solar energy from hybrid CPVT collectors for a VMD process to provide freshwater in coastal cities.

1. Introduction

The United Nations World Water Development Report mentions that 3.7 billion people are currently affected by water scarcity and in 2050 this number could grow to 5.7 billion [1]. This problem is caused by various factors, such as increasing population, urbanization, poor water management, climate change, pollution, etc., and is soon to be one of the most important challenges of humanity for the following years. Due to the vast abundance of seawater, water desalination, whose goal is to provide drinkable water from saline water with the expense of energy to power the associated units [2], appears to be a viable solution to this problem and many countries have adopted this technique to satisfy their freshwater needs. By February 2020, the global desalination capacity for freshwater production was 114.9 million m3/day [3].
An exhaustive summary of the industrial water desalination plants around the world is presented by Ali et al. [4], classifying the plants according to their desalination method: Multi-Effect Distillation (MED), Reverse Osmosis (RO), Multi-Stage Flash (MSF), Electrodialysis (ED) or Membrane Distillation (MD). Despite the large-scale desalination industry being settled in just three desalination methods (RO, MED and MSF) [5], innovative techniques are being developed and pilot-tested in different research facilities every day. Lately, MD desalination has been foreseen as a promising alternative to conventional separation processes and has been intensively improved by different research groups globally [6,7,8]. In their review, Pangarkar et al. [9] compared the performance of the RO and MD desalination processes and concluded that, even though RO has been the preferred choice for new desalination plants due to many years of growth, MD is a better alternative for water desalination because of the lower operating temperature and pressure, the possibility of using solar heat, the higher product quality and better resistance to fouling.
Whether a long-used method or a newly born technique, any desalination process requires either electrical or thermal energy to function. Thus, great attention is being focused on renewable energy (RE) resources for their environmentally friendly nature in comparison with fossil fuels [4]. Evidently, most countries that could face water scarcity are located in the so-called Global Sun Belt (within ±35° latitude from the equator) [10], where the solar radiation is high, increasing the potential for the use of solar energy. For example, Mollahosseini et al. [11] analyzed the potential of Iran, a country in the Global Sun Belt, for RE-driven desalination. They concluded that by combining solar and wind energies, the country could produce up to 28 billion m3/year of freshwater.
The coexistence of solar resources with water shortages makes solar power an appropriate method to cover the energy requirements of any desalination process. Ali et al. [4] classified the already pilot-tested solar desalination technologies into direct or indirect solar desalination. The first includes methods such as solar stills or the Humidification–Dehumidification process (HDH). Alternatively, indirect solar desalination could be divided according to the type of energy generated from the sun: MSF, MED, Thermal Vapor Compression (TVC), MD and heat engine-driven RO and freezing methods obtain thermal energy from solar thermal collectors. Direct desalination produced by solar stills is one of the sustainable and economical technologies, but it has to improve its lower water productivity with advanced porous materials, nanoparticles or phase change materials [12]. On the other hand, indirect membrane distillation is one of the most effective methods characterized by its high productivity particularly used in industrial plants [13].
A solar collector is a device that transforms solar radiation energy into thermal energy by increasing the temperature of the Heat Transfer Fluid (HTF), the electrical energy produced by PV cells, or both in the case of hybrid PV/Thermal (PV-T) applications. Zhao et al. [14] built a solar flat-plate PV-T system coupled with a Direct Contact MD (DCMD) module for energy generation and water desalination. The authors found that the hybrid system had a 4.44 times greater energy performance (including power density and energy efficiency) in comparison with the sole PV module. Moreover, Ma et al. [15] reviewed the current status of solar-driven MD desalination and they identified that, alongside direct solar heating, the possible resolution to enhance solar energy utilization for higher water production is solar concentration, a hypothesis on which some authors have been working. Krnac et al. [16] used the waste heat from the cooling system of a Concentrating Photovoltaic (CPV) solar dish to heat the feed water for a DCMD system, which produced a permeate flux of 7.1 L/m2h. Elminshawy et al. [17] proposed a cogeneration and solar desalination system powered by an earth-cooled solar concentrator. In their study, they varied the circulating water flow in the Concentrating Photovoltaic-Thermal (CPVT) and the inlet temperature of the feed water to find the combination of both that maximized the permeate flux production and energy performance of the system. In the end, their system was able to produce 19.58 m3 of water at a cost of USD 22.48/m3, with a thermal efficiency of 83%. Chen et al. [18] compared the simulated performance of a solar MD system under the DCMD, Air Gap MD (AGMD) and Vacuum MD (VMD) configurations. The authors used an absorption plate to collect the solar energy and develop a two-stage design methodology to minimize the total annual cost using steady-state simulations and to maximize the permeate produced using a dynamic simulation. Their simulation showed that the costs per m3 of freshwater under optimal operation conditions for the AGMD, DCMD and VMD configurations were USD 2.71, USD 5.38 and USD 10.41, respectively.
Among solar collectors, the Parabolic Trough Collector (PTC) is one of the most commonly used to produce Concentrated Solar Power (CSP) because of its high-temperature range and reduced cost as compared to two-axis tracking collectors, such as parabolic disk collectors. Some of the main applications for PTCs are CSP plants, industrial process heat, space heating, domestic hot water, refrigeration, air-conditioning, pumping water, solar chemistry and desalination [19]. A clear example of the potential of PTCs is presented by Soomro and Kim [20] where the technical and economic evaluation of a 50-MWe PTC plant with DCMD for electricity and freshwater production was performed. The plant produced up to 13.5 GWh of energy at a levelized cost of energy of 0.193833 USD/kWh during summer and 14.33 m3 of freshwater per day at a cost of 0.64 USD/m
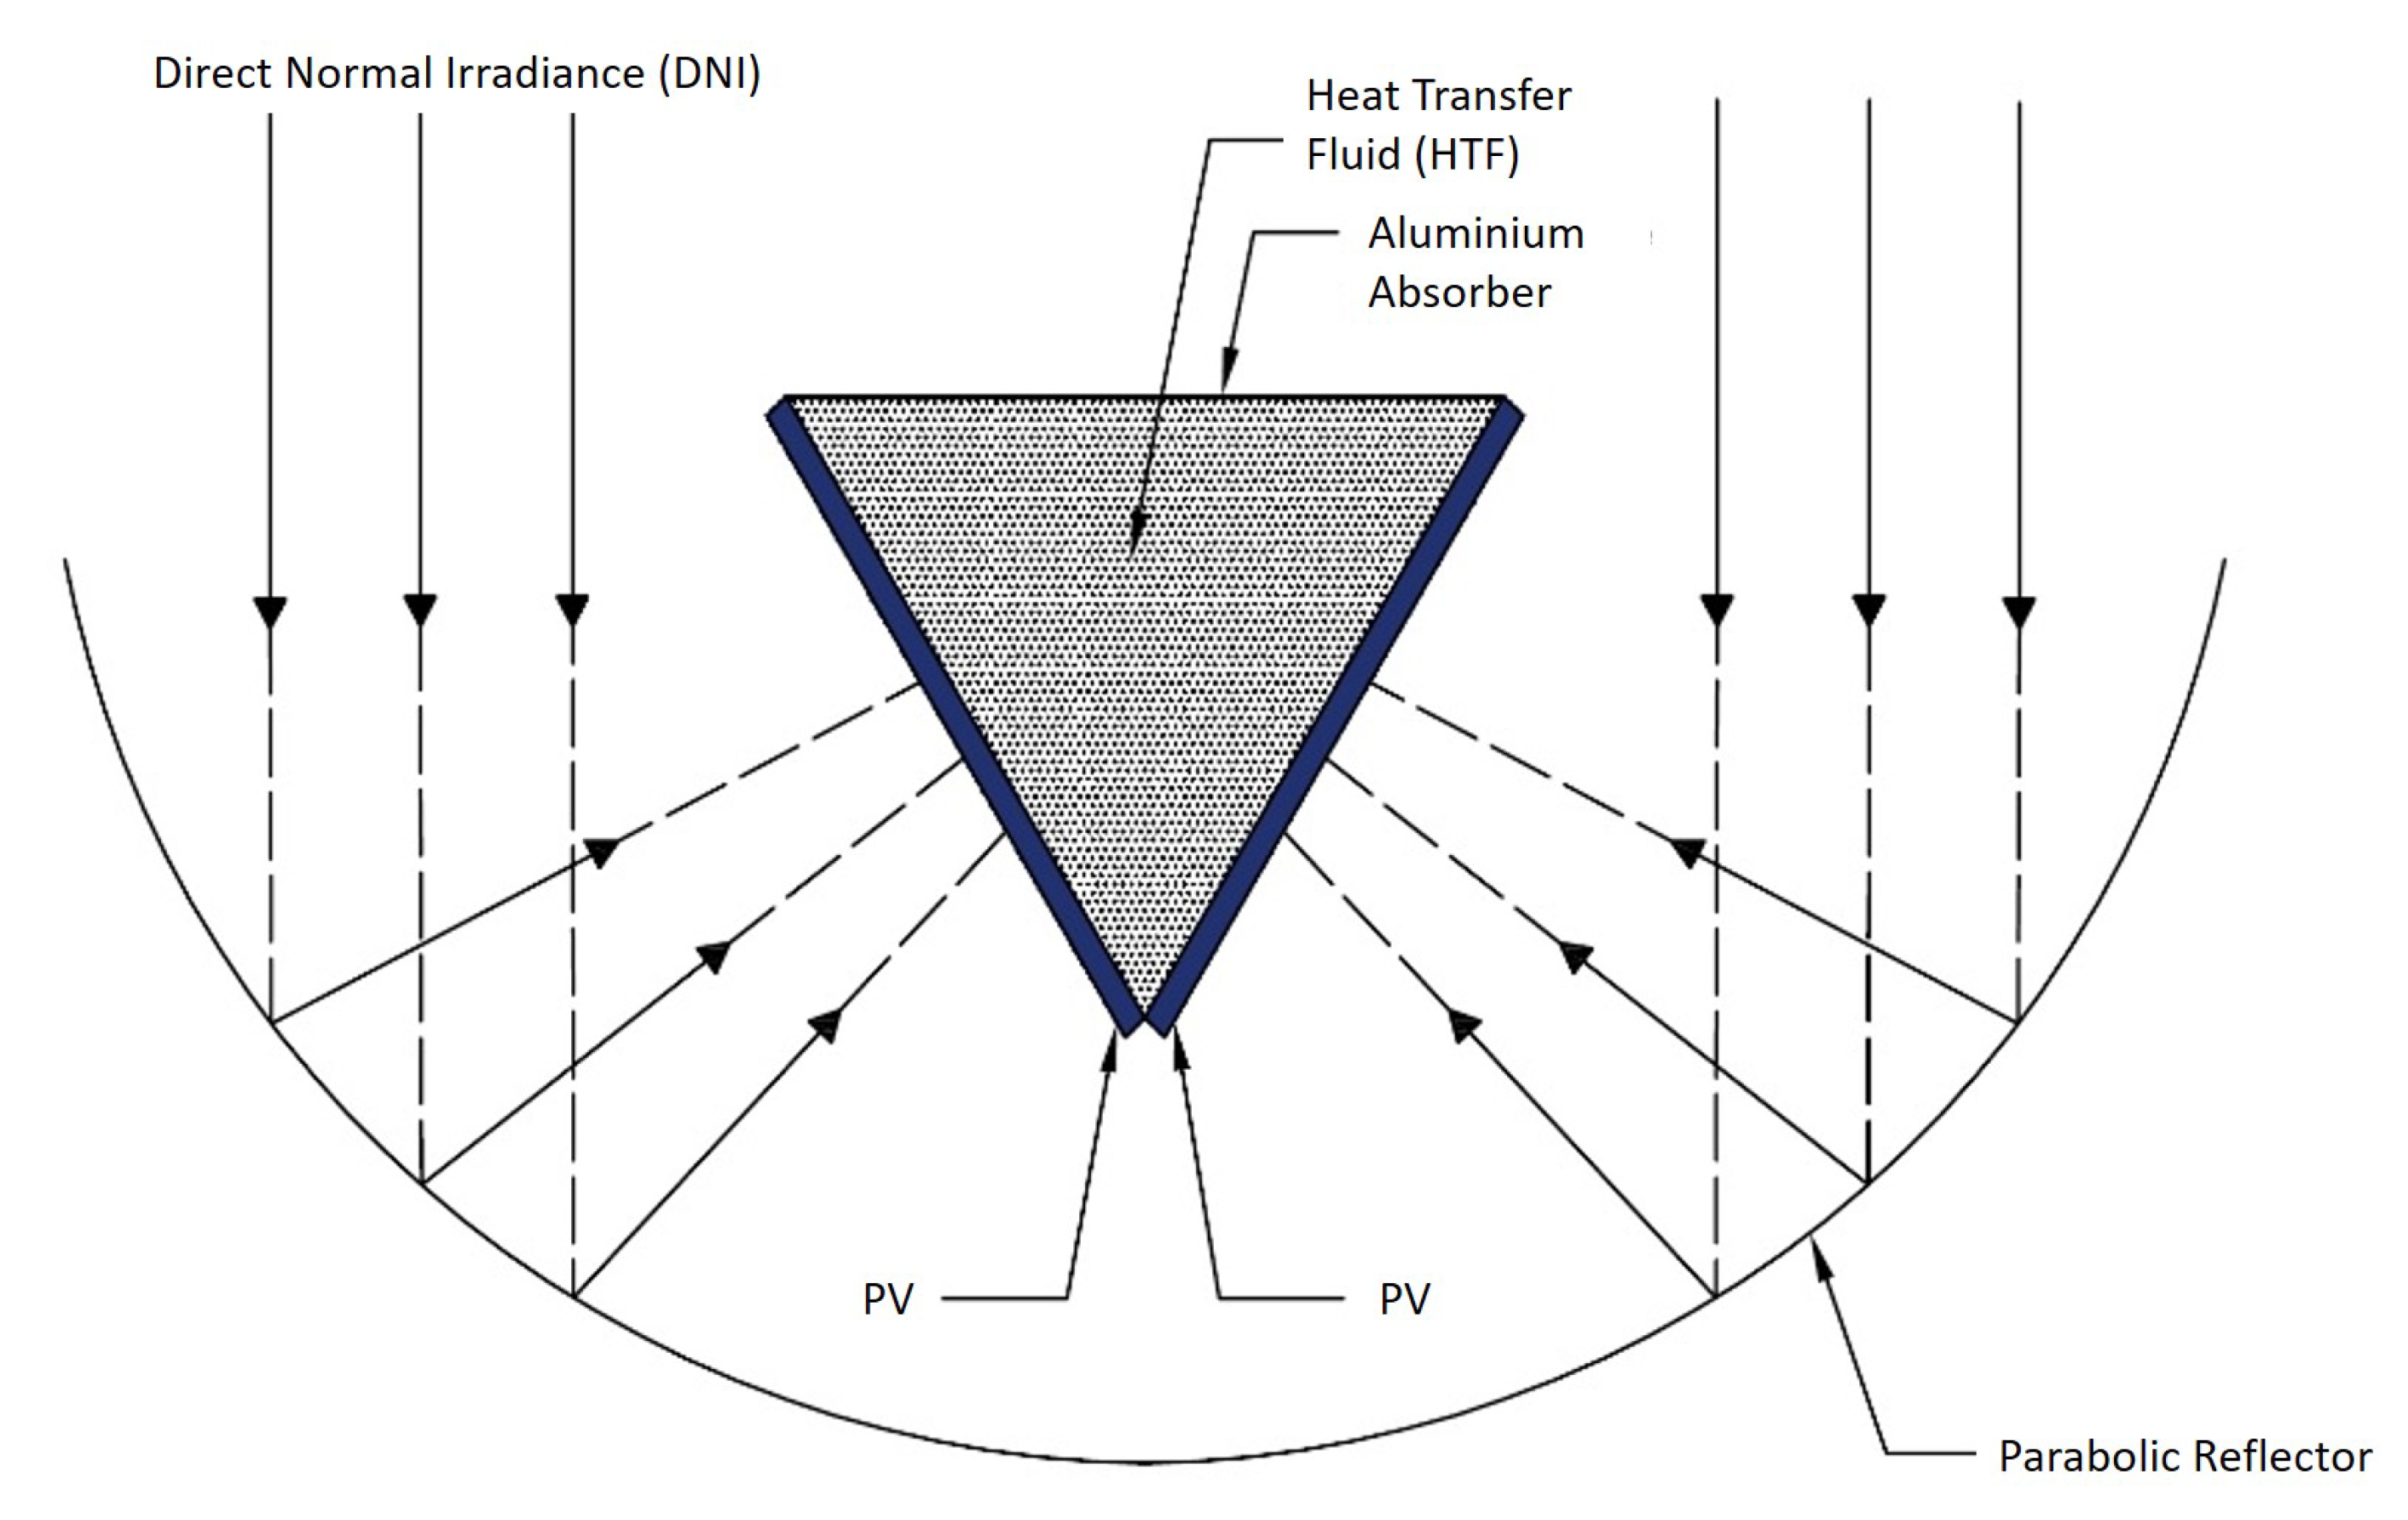
3. In recent years, an innovative CPVT system has been developed by Acosta-Pazmiño [21], wherein an array of PV Si mono-crystalline cells was placed in the focus line of a PTC. The system was fabricated, characterized and experimentally evaluated using international standards. Moreover, a sensibility analysis found that the design parameter with the largest effect on the collector’s thermal and electrical efficiencies is the conversion efficiency of the PV cells, while the operating condition with the most influence is the incidence angle. A detailed presentation of the operating parameters and conditions for the evaluation is available in [21].
A cogeneration plant involving CPVT-VMD technology was proposed and numerically evaluated by Chen et al. [22]. They used a Fresnel lens to concentrate the sunlight into multi-junction cells (MJC) and a vacuum multi-effect MD (V-MEMD) system for water desalination and evaluated the system under typical weather conditions of Makkah, Saudi Arabia. The electrical and thermal efficiencies of the system remain constant at 24% and 45%, respectively; the annual permeate production reached 42m3 of freshwater with a Specific Energy Consumption (SEC) of 205 kWh/m3. Liu et al. [23] numerically and experimentally analyzed a Vacuum Membrane Distillation seawater module coupled with a thermal/photovoltaic solar system. They reported the thermal and electrical performance of the system, as well as water harvesting. From the results, maximum thermal and electrical efficiencies of 56.2% and 15.9% were found, with a water yield of 0.579 L/m2h obtained for the membrane distillation module.
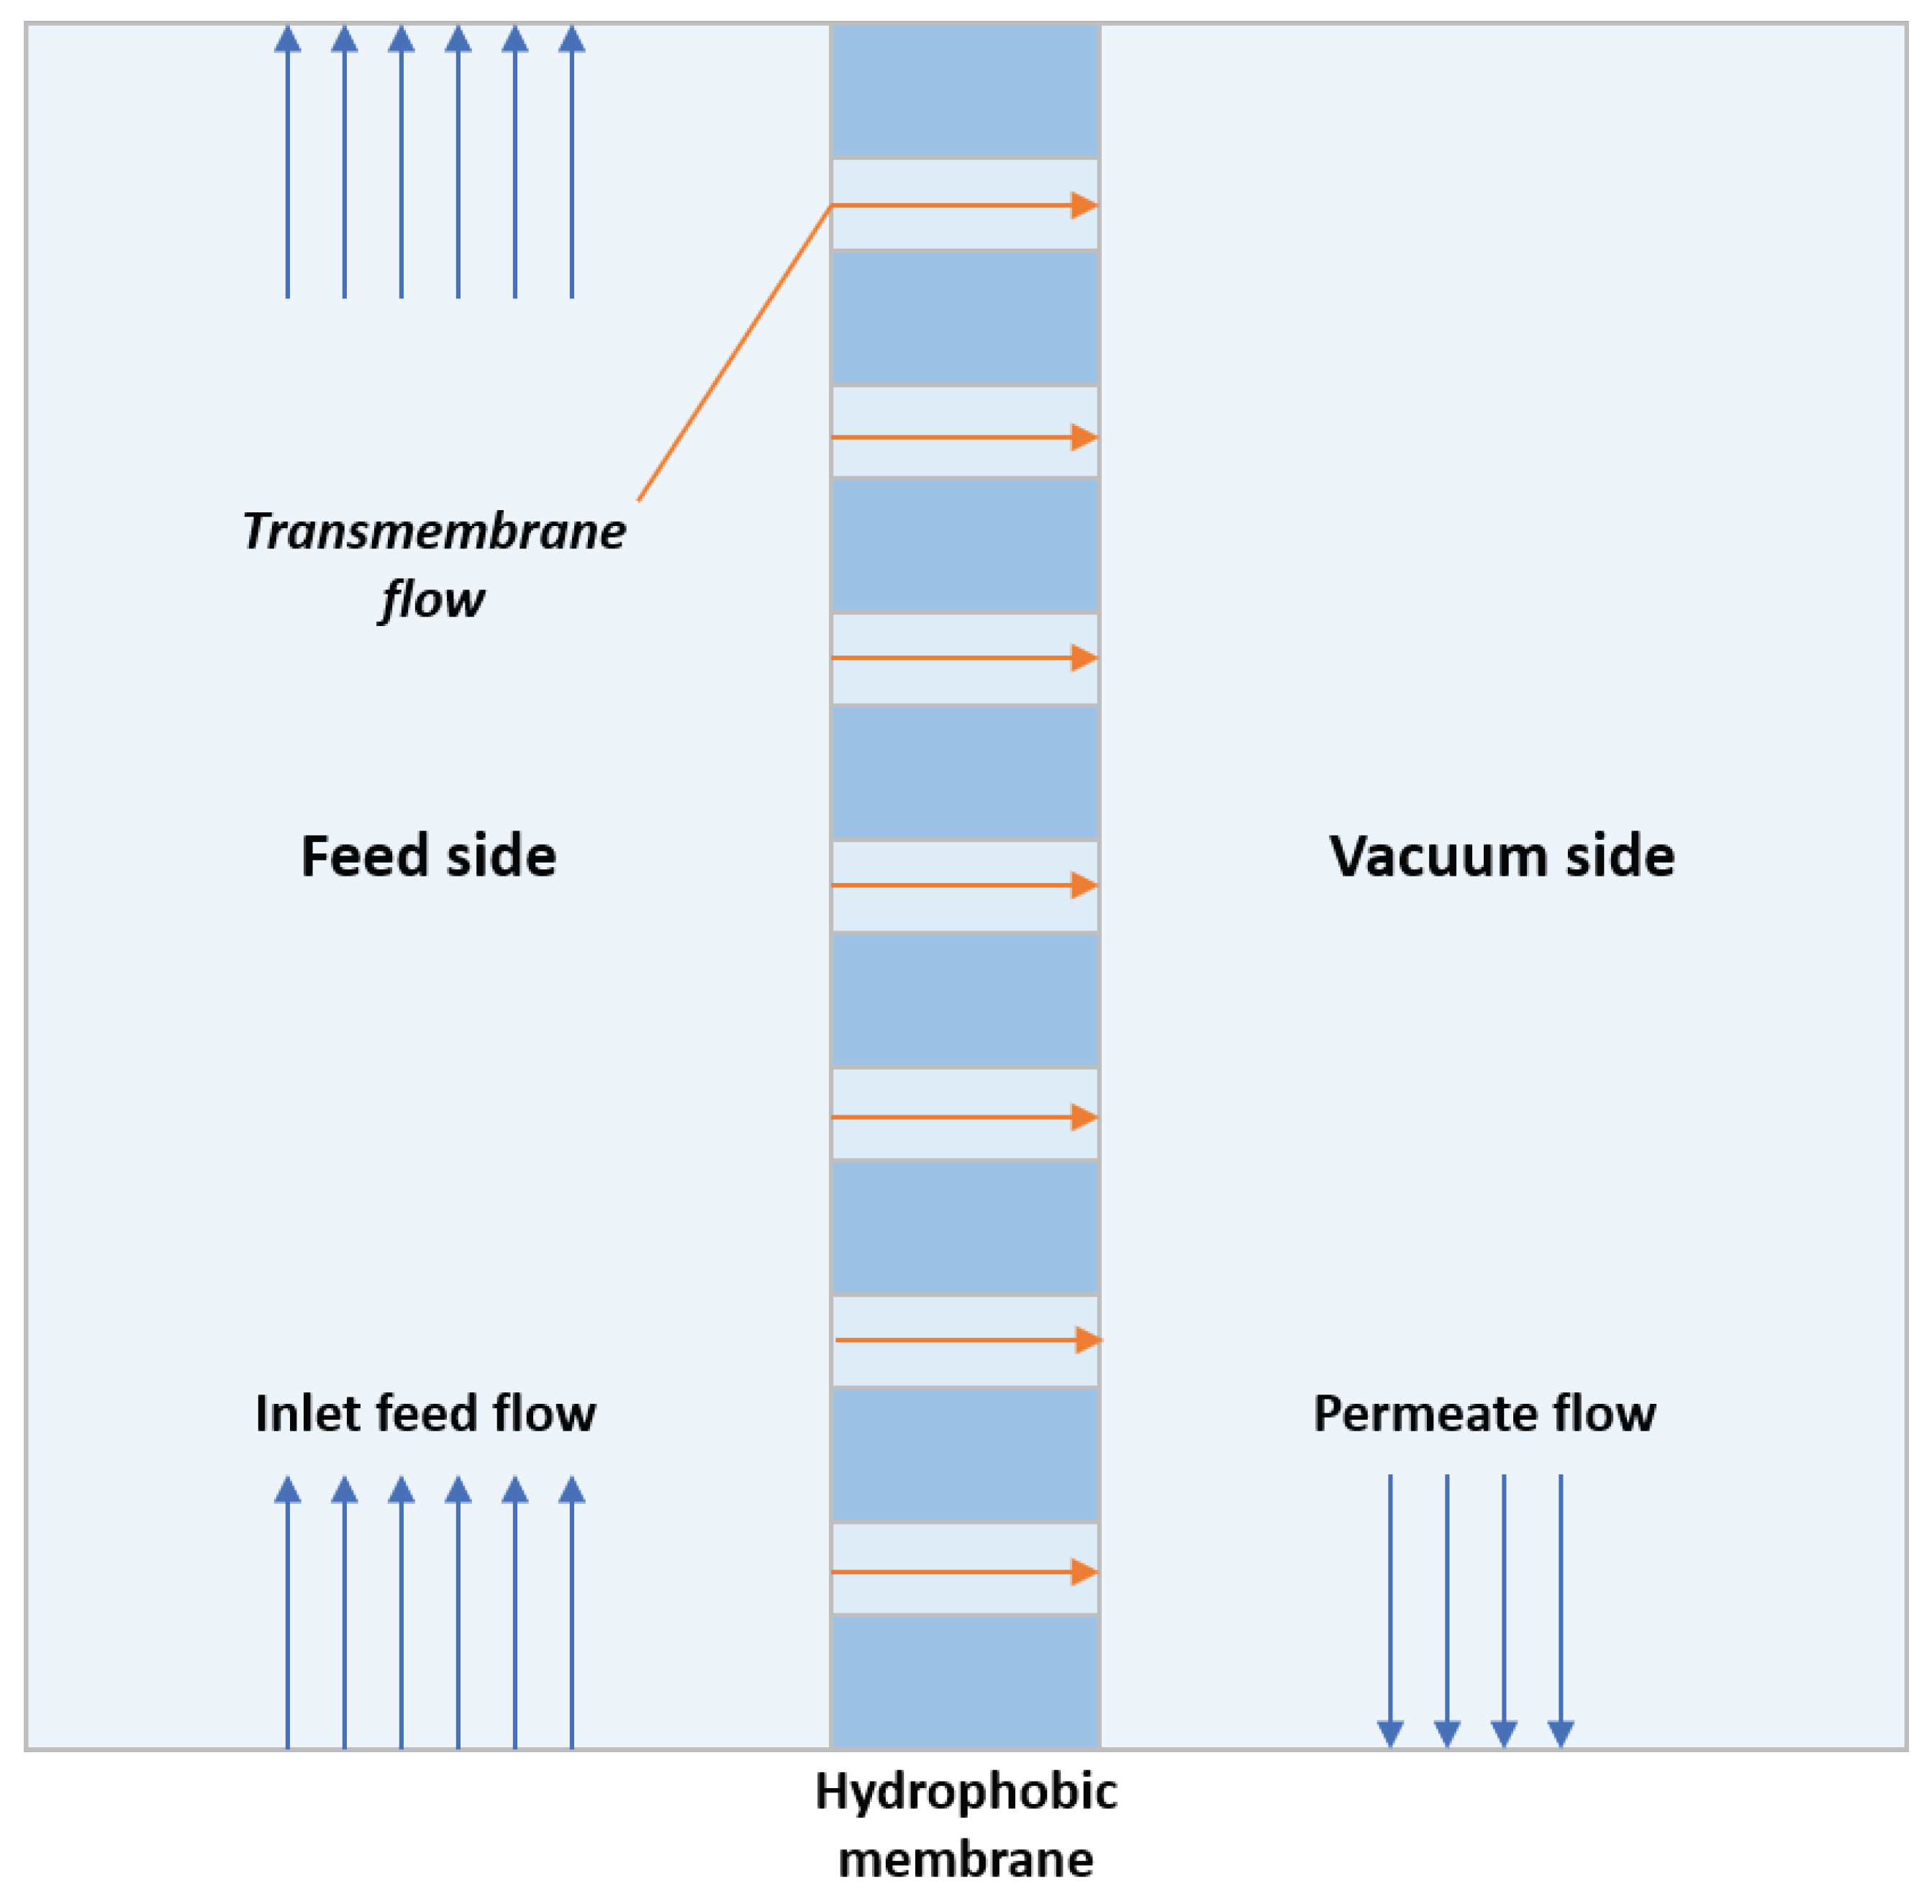
Despite there being already some research regarding the coupling of CPVT systems with MD technology, there remains an important gap in the literature for designing and performing parametric studies that assess the integration of hybrid solar desalination systems in different climate conditions. In addition, most of the research regarding solar desalination by MD is focused on the DCMD configuration because of its simplicity, paying little attention to other configurations, such as VMD, that could present a better performance under proper conditions. Therefore, VMD was selected in this study to be integrated with the hybrid solar collector because it is thermally more efficient and larger permeated flux production can be obtained. From the different types of solar collectors that can be used to provide thermal and electrical energy for the VMD system, the hybrid CPVT was selected because it can heat water at the required operating temperatures of the VMD and less capture solar area is required to produce heat and electricity compared with other technologies such as flat plate, vacuum tubes and PV collectors.
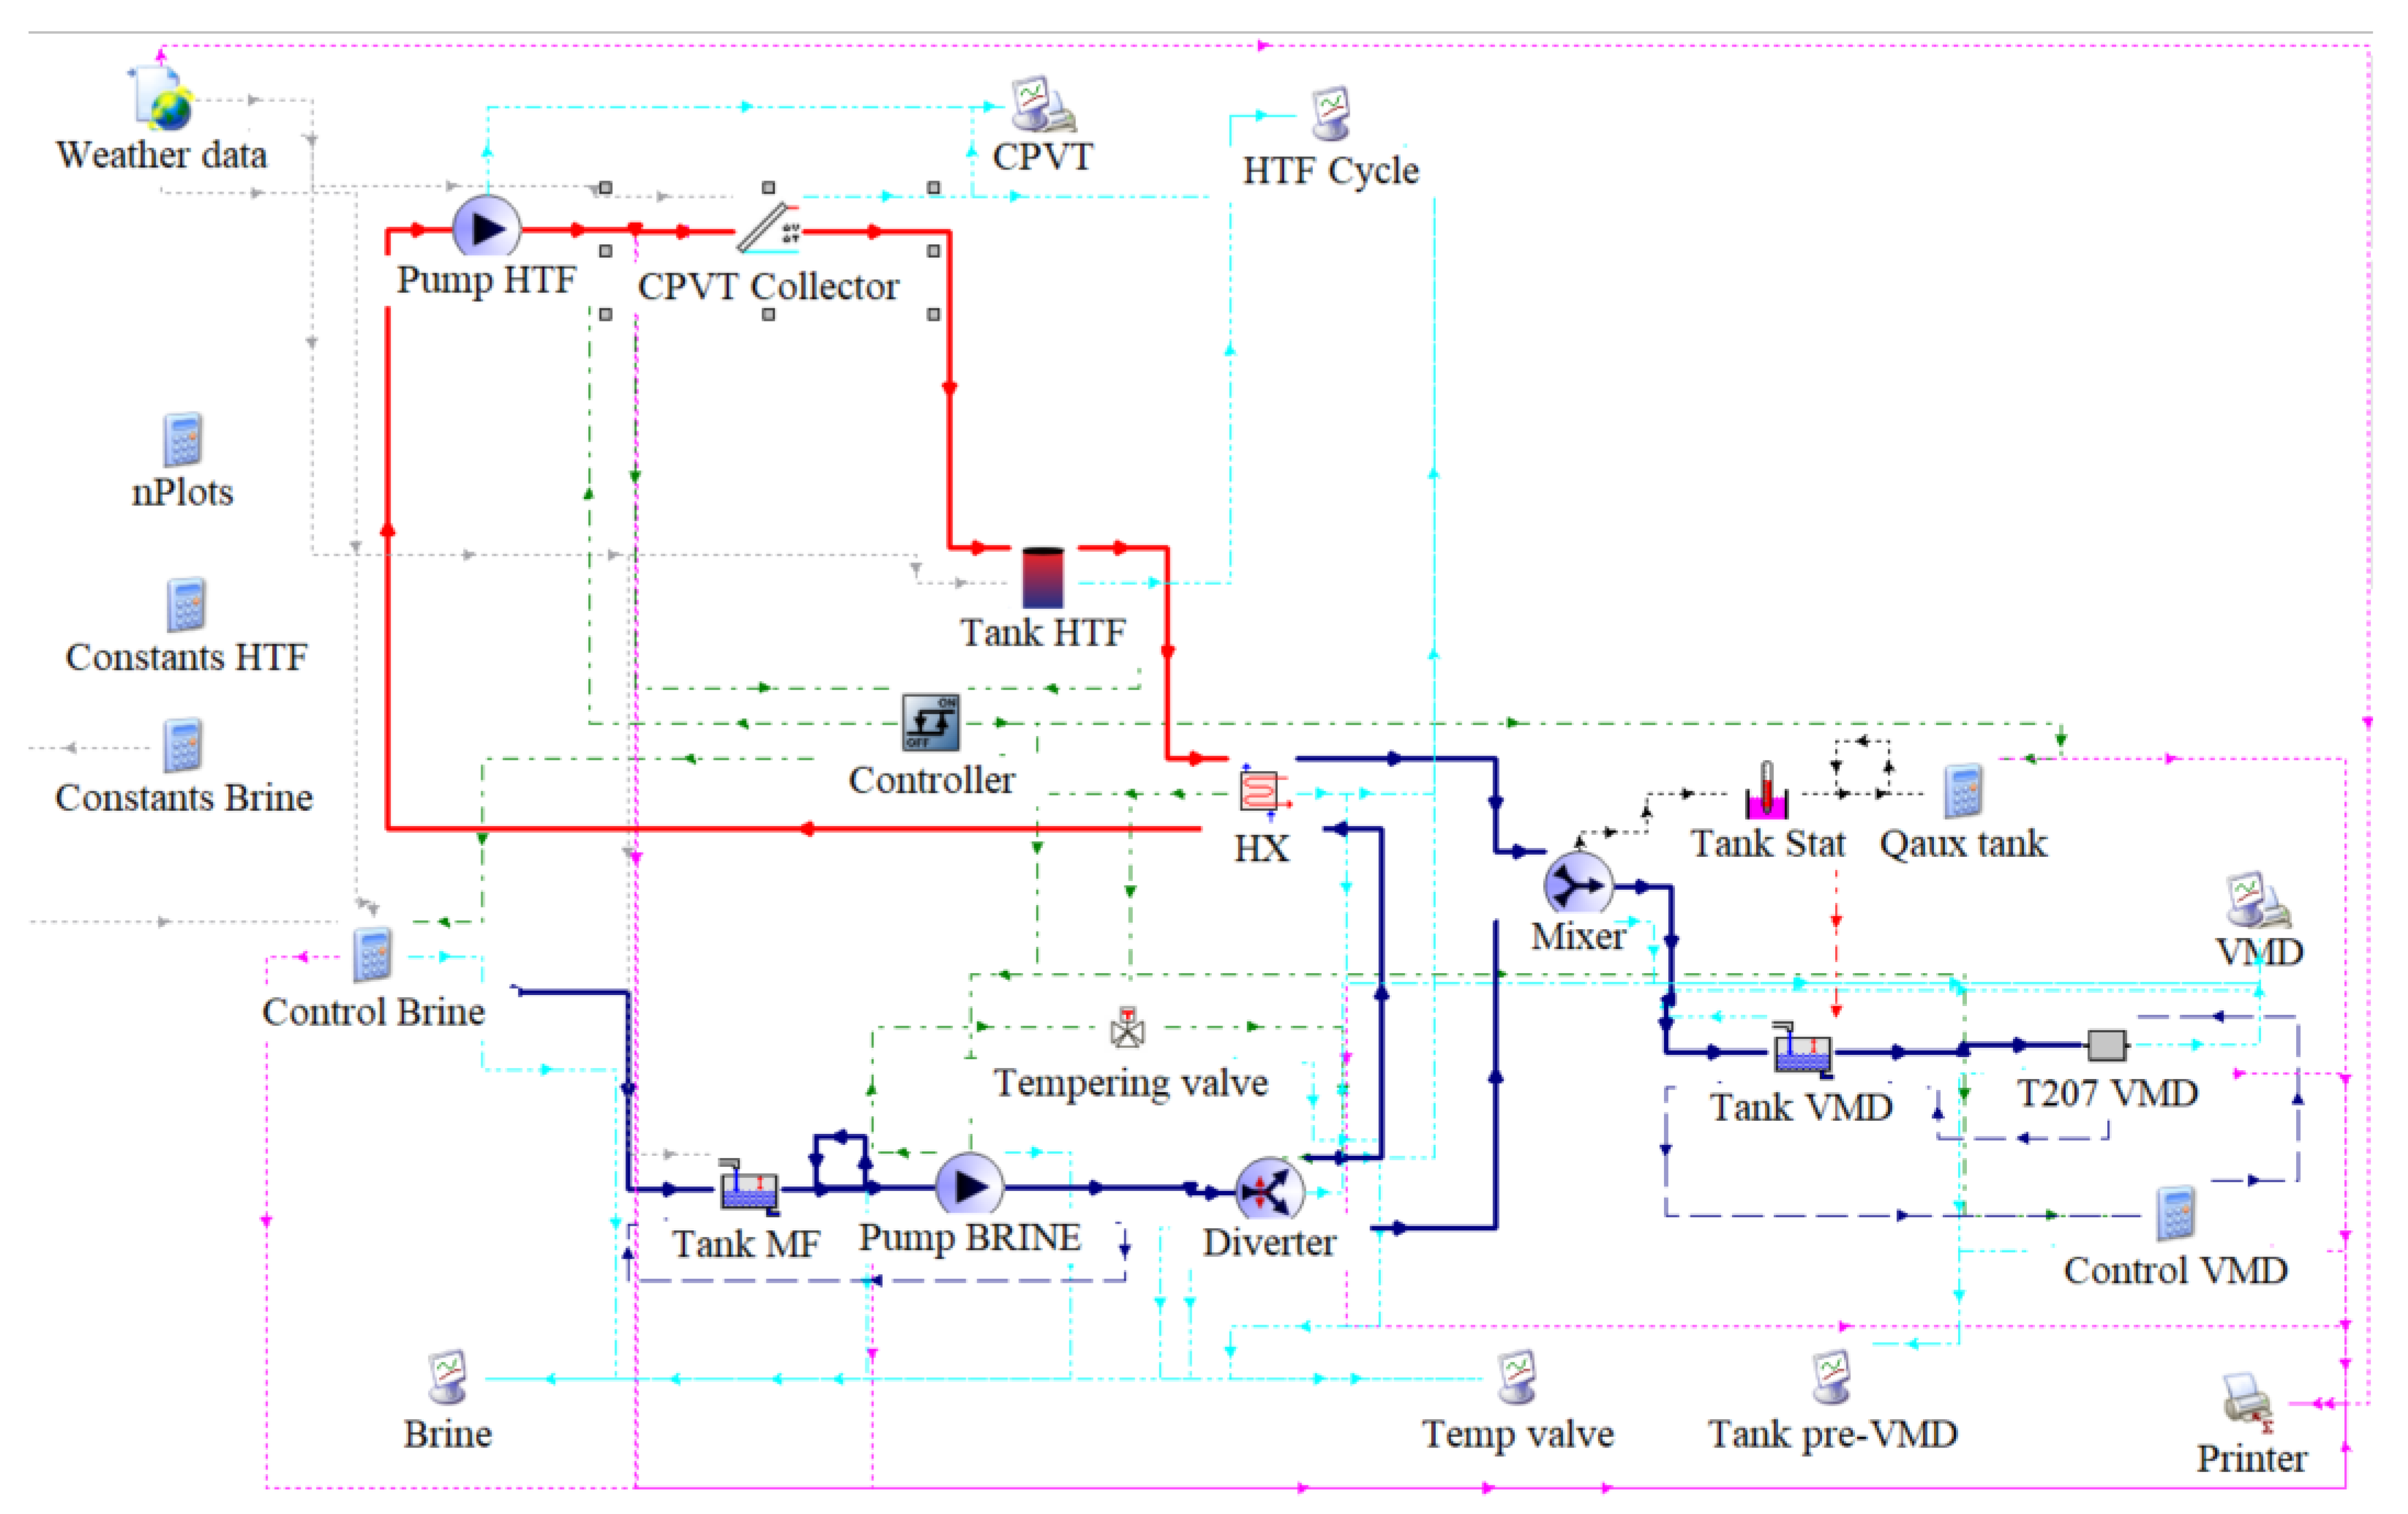
The purpose of this study is to numerically analyze the coupling of an innovative configuration of a CPVT-PTC module with a VMD module and evaluate the combined performance under real weather conditions for a year in four different coastal cities: La Paz, Mexico; Acapulco, Mexico; Nadi, Fiji; and Singapore, Singapore. The novelty and the contributions of this study can be summarized as follows: (1) the CPVT-PTC module used in the analysis consists of a commercial Parabolic Through Collector where the circular receiver has been replaced with a triangular receiver with PV cells in the two sides that are facing the reflecting surface. This type of hybrid collector has the advantage of requiring less PV area to produce more electricity due to the higher concentration ratio and at the same time providing thermal energy for the VMD process. Another advantage of this hybrid collector is the great potential to be industrially produced because conventional solar thermal plants with PTC can be easily hybridized by just replacing the receiver. (2) Design specifications and operating conditions based on annual simulations for different climate conditions of coastal cities are provided. These dynamics simulations were performed with TRNSYS to obtain the annual behavior of key parameters such as specific permeate production, thermal and electrical energy production, overall electrical consumption, etc. (3) The methodology employed to integrate the heat and mass transfer model of the VMD into the TRNSYS environment and the CPVT/PTC model using a modified version of the Type50f into the TRNSYS studio considering an incidence modifier angle of the system. To the best of our knowledge, energy annual simulations, for different coastal cities, of the coupling of the VMD module with the type of hybrid CPVT-PTC proposed have not been investigated. The results of this study are important for proving the technical and economic feasibility of the technology and for providing guides for the design of a prototype with potential to be commercialized.

2. Methodology

This section is organized as follow. First, it explains the CPVT module configuration and the operating principles of the VMD technology with the mathematical model describing such phenomena. Second, the integrated CPVT-VMD model simulated in TRNSYS and the metrics employed to evaluate the performance of the system are presented.

2.1. CPVT Module

The CPVT component of the system was characterized and developed by Acosta-Pazmiño [21]. The PV array of the system utilizes monocrystalline Si PV cells model C-60 [24] mounted on a Power Through 110 PTC [25] and is shown in Figure 1. Moreover, a 1D steady-state model of the hybrid collector was used to obtain relevant thermal performance parameters, such as the thermal loss heat-transfer coefficient, U L , the internal heat-transfer coefficient between the duct and the HTF, U H T F and the contact resistance between the PV cells and the absorber, R C [26]. Equations (1)–(6) present the calculation of the principal thermal performance parameters involved in the modelling of a unit of the hybrid CPVT collector. Additionally, the most relevant CPVT inputs for the simulation model are presented in Table 1.
Incidence angle modifier [27]
K ( θ ) = 1 b 0 1 c o s ( θ ) 1
Heat loss coefficient [28]
U L = Q L o s s A r ( T r T a m b )
Collector efficiency factor [28]
F = 1 + U L U H T F
Collector heat removal factor [29]
F R = m ˙ C p U L 1 e x p ( U L F / m ˙ C p )
Useful thermal output [28]
Q ˙ u = F R A a S A r A a U L ( T i T a m b )
Electric output [29]
E P V = A a S η P V α 1 η P V r K T η P V F R ( T i T a ) + S U L ( 1 F R )
where Q L o s s is the collector thermal loss, A r is the surface area of the receiver, T r is the temperature of the receiver, T a m b is the temperature of the ambient, m ˙ is the mass flow rate of the HTF inside the receiver, C p is the specific heat of the HTF, A a is the aperture area of the collector, S is the incident solar irradiance, T i is the intermediate temperature (average between the inlet and the outlet HTF temperatures), η P V is the efficiency of the PV cells, η P V r is the reference efficiency of the PV cells and K T is the temperature coefficient. The parameter b 0 shapes the curvature of the function in Equation (1) which was taken from [30]. The mathematical model for the collector was fully developed and experimentally validated by Acosta-Pazmiño [21].

2.2. VMD Module

The mass transfer mechanism in MD could be determined by the computation of the dimensionless Knudsen number, presented in Equation (7), where λ and d represent the mean free path of the water vapor molecule and the pore diameter, respectively.
K n = λ d
Depending on the resulting value of K n , it is possible to identify the mass transfer mechanism present in the porous membrane, as shown in Table 2.
From Equation (7), given that the Knudsen number resulted in the range of 0.11–0.55 ( 0.2 d 1 µm [31]; λ 0.11 µm [32]), the governing mass transfer mechanism across the membrane is the Poiseuille flow–Knudsen diffusion transition mechanism, which could be described as in Equations (8) and 9 [33].
N K P = N K + N P
N K P = 8 3 r ε b τ 1 2 π R M T + r ε 2 b τ 1 8 η P m R T Δ P
where N K and N P are the Knudsen diffusion and Poiseuille flow; r is the pore radius, ε is the membrane porosity, b is the thickness ( b = r i l n ( r o / r i ) of the hollow fiber membrane, with r i and r o as the inner and outer radii of the hollow fiber membrane, respectively), τ is the tortuosity factor of the pores, R is the universal gas constant, M is the molar mass, T is the mean pore temperature, η is the viscosity of the gas transferred through the membrane, P m = ( P v a p o u r + P v a c u u m ) / 2 is the mean pressure in the pores and Δ P = P v a p o u r P v a c u u m is the pressure difference between the feed and permeate interfaces. Figure 2 shows a schematic diagram of a small section of the VMD module near the membrane surface.
The 1D mathematical model for the transmembrane flow was developed and validated by Zhang et al. [33]. To use the model in the Simulation Studio, it is necessary to program it into a component using TRNSYS TypeStudio, where it is written in FORTRAN programming language using the values of the variables presented in Table 3.

2.3. TRNSYS Simulation

The integrated CPVT-VMD system is modeled using TRNSYS 18 [34], a software item for the simulation of dynamic system under real weather conditions, as shown in Figure 3. It involves two sub-processes: the CPVT loop in red and the VMD loop in blue. For the first loop, water at 80 °C is used as HTF (specific heat, Cp = 4.194 kJ/kg-K; density, ρ = 972 kg/m3; and thermal conductivity, k = 0.665 W/m-K) flowing at a speed of 1.7 GPM, or 6.4 L/min, ( W ˙ p u m p H T F = 72 W), while for the second loop salt water at 35 g/kg at 25 °C was used as the fluid to be treated (Cp = 4.001 kJ/kg-K, ρ = 1024 kg/m3 and k = 0.609 W/m-K) [35,36] flowing at 0.61 GPM, or 2.3 L/min, ( W ˙ p u m p B R I N E = 26.4 W). A modified version of Type 50f was used to model the hybrid collector because it considers the wind velocity and the collector temperature to calculate thermal losses. The modification aims to consider an incidence-angle modifier of the system, given receptor geometry. The components involved in each simulation loop are listed in Table A1. The simulation runs using an entire typical meteorological weather year (.epw files) obtained either from EnergyPlus for the cities of Acapulco, MX; Nadi, FJ; and Singapore, SG; [37,38,39], or from White Box Technologies for La Paz, MX [40], with a time-step of 10 min. The weather in four different cities (Acapulco, La Paz, Nadi and Singapore), representing the weathers of North America and Southeast Asia with a huge potential for the system implementation, are used to compare the performance of the system under different meteorological conditions. Table 4 shows the average daily weather conditions of these cities in a typical year regarding DNI, temperature and wind velocity. Moreover, using the weather data from Acapulco, MX, two parametric studies measure the effect of varying two key parameters in the simulation: the surface area of the CPVT collectors, varying between two, three and four CPVT units (6.5, 9.75 and 13.0 m2, respectively) and the temperature at which the brine reaches the VMD module, varying between 55, 60 and 65 °C. Additionally, complementary to the parametric studies, the collector surface area is increased using the best performing set point temperature, until the system can cover its energy requirements, analyzing the feasible conditions for an autonomous system.
Lastly, some key assumptions of the model are as follows: except for the CPVT collector, there are no environmental losses in the components or in the connections between them, the supply of salt water is sufficient to satisfy the demand of the pump, the VMD membrane operates without fouling and the PV modules work at the maximum power point.

2.4. Metrics

For an objective evaluation of the performance of the systems, four primary metrics are considered: Solar Fraction (SF), membrane-specific permeate production, SEC and thermal and electrical energy conversion efficiencies, both thermal and electrical. First, SF is defined as the hot water load percentage than can be met by solar energy [41], presented in Equation (10):
S F = Q s a v e d , s o l a r Q a u x n o s o l a r
where Q s a v e d , s o l a r and Q a u x n o s o l a r refer to the total solar energy input and the total energy required without the solar energy input, respectively. Furthermore, Q s a v e d , s o l a r is defined as
Q s a v e d , s o l a r = Q a u x n o s o l a r Q a u x s o l a r + Q p a r a s i t i c
where Q a u x s o l a r is the amount of energy needed to meet the load when the solar collector is used and Q p a r a s i t i c is the energy required to power other components related to the solar energy system, i.e., the pump in the HTF loop. By substituting the significant power-consuming components into the previous definitions, the resulting SF equation is presented in Equation (15), where Q H X is the heat gain by the brine at the heat exchanger, E P V is the electrical energy produced by the collector, W p u m p H T F , W p u m p B R I N E and W p u m p V M D represent the energy consumed by the pumps moving the HTF at the CPVT loop, the brine at the VMD loop and the vacuum pump of the VMD module, respectively, and Q a u x is the energy supplied to the brine by the external resistance. It is important to mention that the scenario without the solar energy input is achieved by assuming that the energy transferred from the heat exchanger into the salt water is provided by an external heater and that the energy coming from the PV panels is supplied by the conventional energy grid. By doing this, the energy performance of both systems can be objectively compared, since the operating hours and the permeate produced are the same.
Q a u x n o s o l a r = W p u m p B R I N E + W p u m p V M D + Q a u x + Q H X
Q a u x s o l a r = W p u m p B R I N E + W p u m p V M D + Q a u x E P V
Q p a r a s i t i c = W p u m p H T F
S F = Q H X + E P V W p u m p H T F W p u m p B R I N E + W p u m p V M D + Q a u x + Q H X
However, given that the thermal and electrical energies have different qualities, which is a measure of the ease with which a form of energy can be converted to useful work, it is adequate to separate the components in Equation (15) according to the nature of the energy they represent. By doing that, the following relations for the electrical SF, S F e and the thermal SF, S F t h , are obtained and presented in Equations (16) and (17), respectively. When the electrical output surpasses the electricity demand of the system, the excess energy, E e x c , may be converted into heat using an electrical resistance (assuming a 100% conversion efficiency) to raise the brine temperature before it reaches the VMD module. In that case, an adjusted thermal SF, S F a d j , would be adequate to include both kinds of energy, as shown in Equation (18):
S F e = E P V W p u m p H T F W p u m p B R I N E + W p u m p V M D
S F t h = Q H X Q a u x + Q H X
S F a d j = Q H X + E e x c Q a u x + Q H X
Second, the membrane-specific permeate production is defined as the amount of permeate produced by every m2 of the membrane, represented as follows:
m ˙ = m p e r m e a t e S V M D
where m p e r m e a t e is the total mass of the permeate and S V M D is the surface area of the VMD membrane.
Additionally, the SEC is the electrical energy required for producing a unit volume of freshwater. To ensure the same quality of the energies considered in the equation, the electricity equivalent of the thermal energy consumed is computed using the efficiency of a power plant, η = 30 % , as indicated by Al-Karaghouli [42]. The adjusted equation is presented in Equation (20).
S E C = W p u m p B R I N E + W p u m p V M D + W p u m p H T F m p e r m e a t e + 0.30 ( Q a u x ) E P V m p e r m e a t e
Lastly, the energy conversion efficiencies depict the fraction of the solar radiation converted to electrical and thermal energies by the CPVT module and are computed as presented in Equations (21) and (22), respectively, where D N I is the Direct Normal Irradiance and S C P V T is the receiving surface area of the CPVT collector.
η e = E P V D N I × S C P V T × 100 %
η t h = Q H X D N I × S C P V T × 100 %

3. Results and Discussion

This section summarizes the main results as follows. First, the effects of the solar collector area and the inlet brine temperature of the VMD on the performance of the CPVT-VMD system are shown. Second, a performance analysis to compare the energy and permeate production for different coastal cities is presented. Finally, an economic analysis of the applications of the system in a coastal city for real weather conditions is performed.

3.1. Effect of Collector Area on the System’s Performance

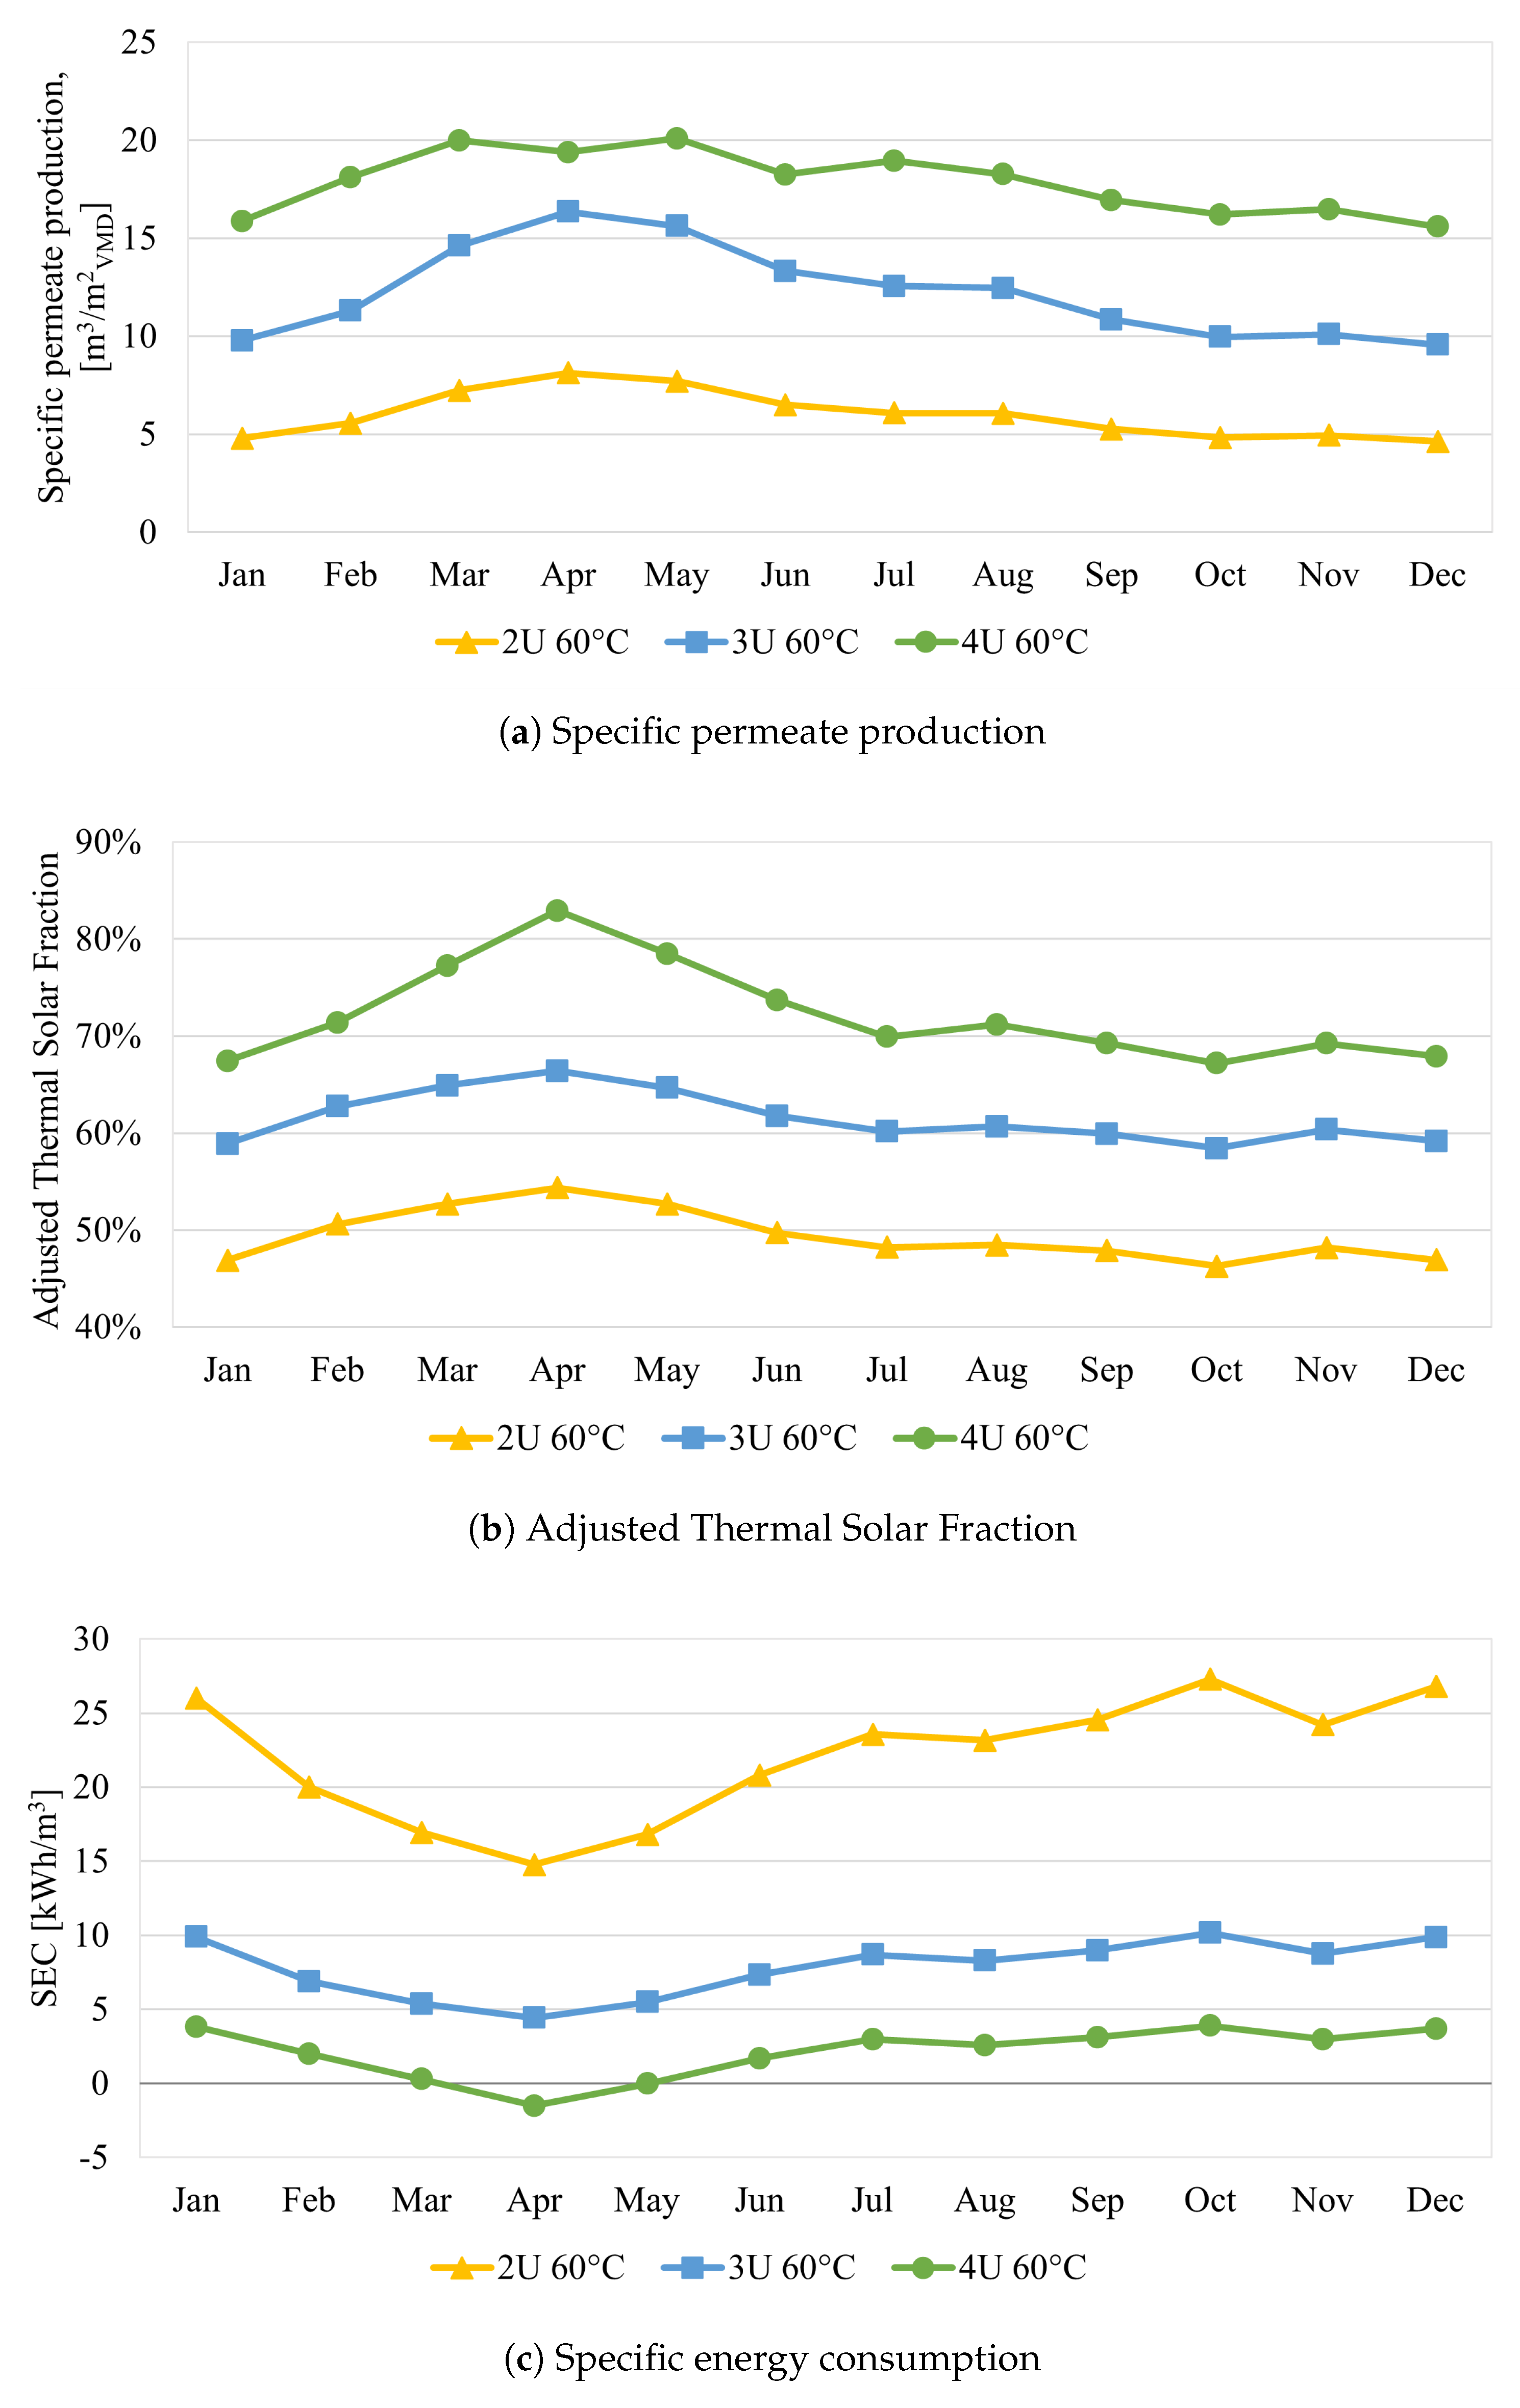
Using the weather data from Acapulco, the first study included the variation in CPVT collector surface area (2-, 3- and 4-collector units) with an invariant set point temperature (60 °C) and its results are presented in Figure 4.
As presented in Figure 4a, the 4-collector unit (4U) scenario showed better performance, reaching a maximum freshwater production of 20.09 m3/m2VMD during May. Likewise, the peak-specific permeate production of the 3-collector unit (3U) and 2-collector unit (2U) systems were 16.35 and 8.13 m3/m2VMD, respectively, during April. One of the reasons why the peak productions did not occur during the same month is that the pump controller halts the system if the output temperature of the CPVT-PTC is higher than the brine set point temperature. Therefore, with the larger surface area of the 4-collector unit system, the operation stopped during the high-radiation days of April.
Regarding the adjusted thermal SF, Figure 4b shows that the 4-collector unit system presented a better performance overall, reaching a maximum of 83%. Notably, all three systems presented their best performances during April, mainly due to the high solar incidence available. Alternatively, the lowest adjusted thermal SF was 46%, presented by the 2-collector unit system during October, with the 3-collector unit and the 4-collector unit systems presenting their lowest during this month as well with 58% and 67%, respectively.
Similarly, the 4-collect unit system presented the lowest SEC during any month of the year, even reaching negative values of −1.50 and −0.02 kWh/m3 for April and May, respectively, as shown in Figure 4c. This would mean that the energy production from the CPVT-PTC is larger than the energy consumption of the system during those months. Thus, the balance between the produced and consumed energies reached such values. Notably, the 3-collector unit and the 4-collector unit systems present a similar steady behaviour, with best (April) and worst (October) monthly performances of 5.72 and 5.41 kWh/m3, respectively. Meanwhile, the 2-collector unit showed a more erratic behaviour with an analogous difference of 12.53 kWh/m3 between the best and the worst monthly performances.
These findings define a significant parameter to size the coupled system and plan the production of a pilot plant. However, despite being outside the scope of this study, an economical assessment might demonstrate if the increment of the surface area in fact reduces the price of the specific permeate produced by the system.

3.2. Effect of VMD Set POINT Temperature on System’s Performance

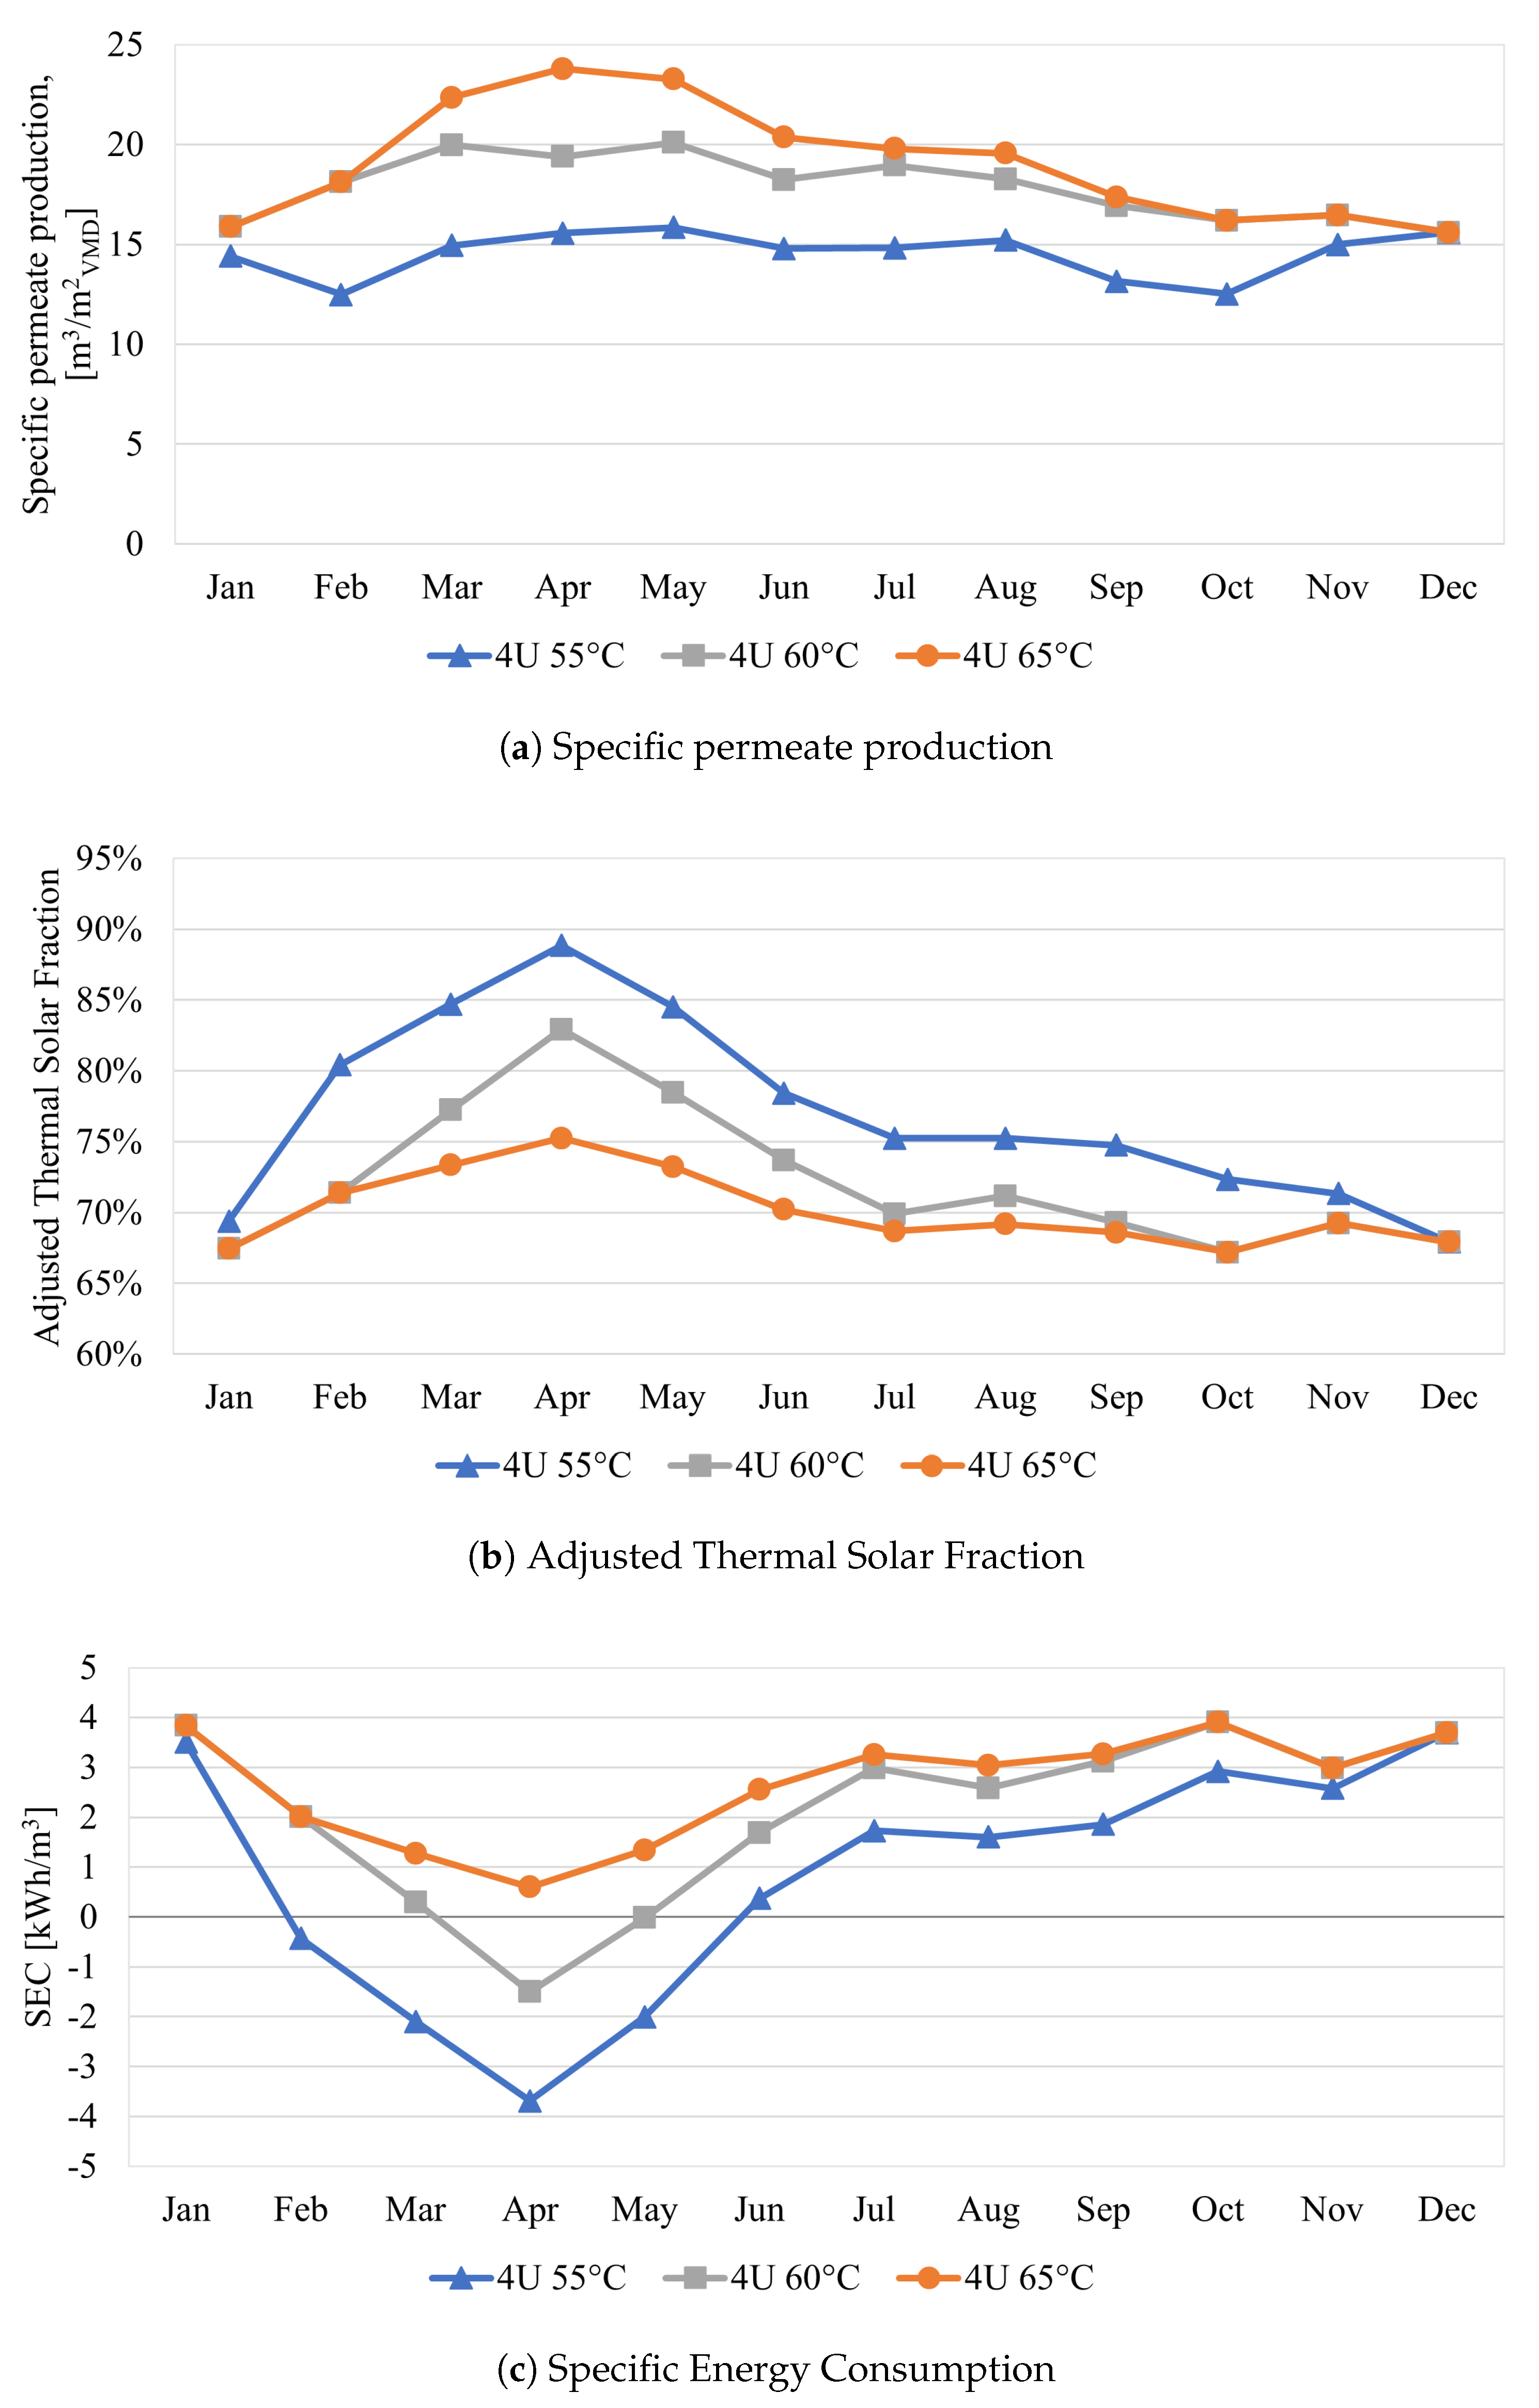
From the results of the previous parametric study, a surface area of 13 m2 (4-collector unit) was selected for the second study, where the effect of varying the set point temperature at which the brine reaches the VMD module was analyzed.
First, as shown in Figure 5a, the 55 °C system presented a lower specific permeate production, mainly since a lower brine temperature at the VMD produces a lower pressure difference between the vapor pressure of the feed side and the vacuum pressure of the permeate side of the membrane. Moreover, it is clear from the results of the 60 and 65 °C runs that a higher brine set point temperature generates a larger specific permeate production, especially from March to June, when the solar radiation available is higher. Notably, from October to February, the production is the same for both cases. This could be occasioned by the low availability of solar radiation, insufficient to rise the brine temperature up to the set point temperature and turning on the auxiliary heater to compensate for the missing energy input similarly in both cases, thus generating the same permeate output during those months.
Despite a larger permeate production, a higher brine set point temperature results in a much lower adjusted thermal SF, as presented in Figure 5b. Except for December, where the adjusted thermal SF for any brine set point temperature is the same, the 55 °C scenario showed a better performance for each month, reaching a top SF of 89% during April in comparison to the 83% and 75% peak-adjusted thermal SFs reached by the 60 and 65 °C scenarios, respectively. Moreover, despite the differences in performance, it is important to observe that the lowest adjusted thermal SF for the systems presented was 67%, occurring during October for both the 60 and 65 °C systems. However, this low performance is also present during December and January for all three systems. Therefore, an additional energy source could be used seasonally to enhance the performance of the system only during the months with low incident solar radiation.
Similarly to the metric previously discussed, the 55 °C system showed a lower SEC than the 60 and 65 °C systems, as displayed in Figure 5c. Moreover, it presented negative SECs from February to May, reaching down to −3.69 kWh/m3 during April. In particular, the 60 °C system also reached negative SEC values during April and May, achieving an SEC of −1.50 kWh/m3 during the former month. Additionally, independent of the brine set point temperature, the SEC does not vary much from November to January, even reaching the same value during December. As mentioned for the specific permeate production, this is due to the use of the same auxiliary heater to increase the temperature of the underheated brine coming from the heat exchanger during months with low solar radiation and the use of an additional heating element during this period could enhance the performance of the system.
Since it is intended for this system to be developed as a stand-alone unit able to run without much support from the local electricity grid, a higher SF is more attractive and from the results of the second parametric study, the set point temperature of the brine at the entrance of the VMD module was defined as 55 °C for the performance study of the system under different weather conditions.

3.3. Multi-CITY Performance Analysis

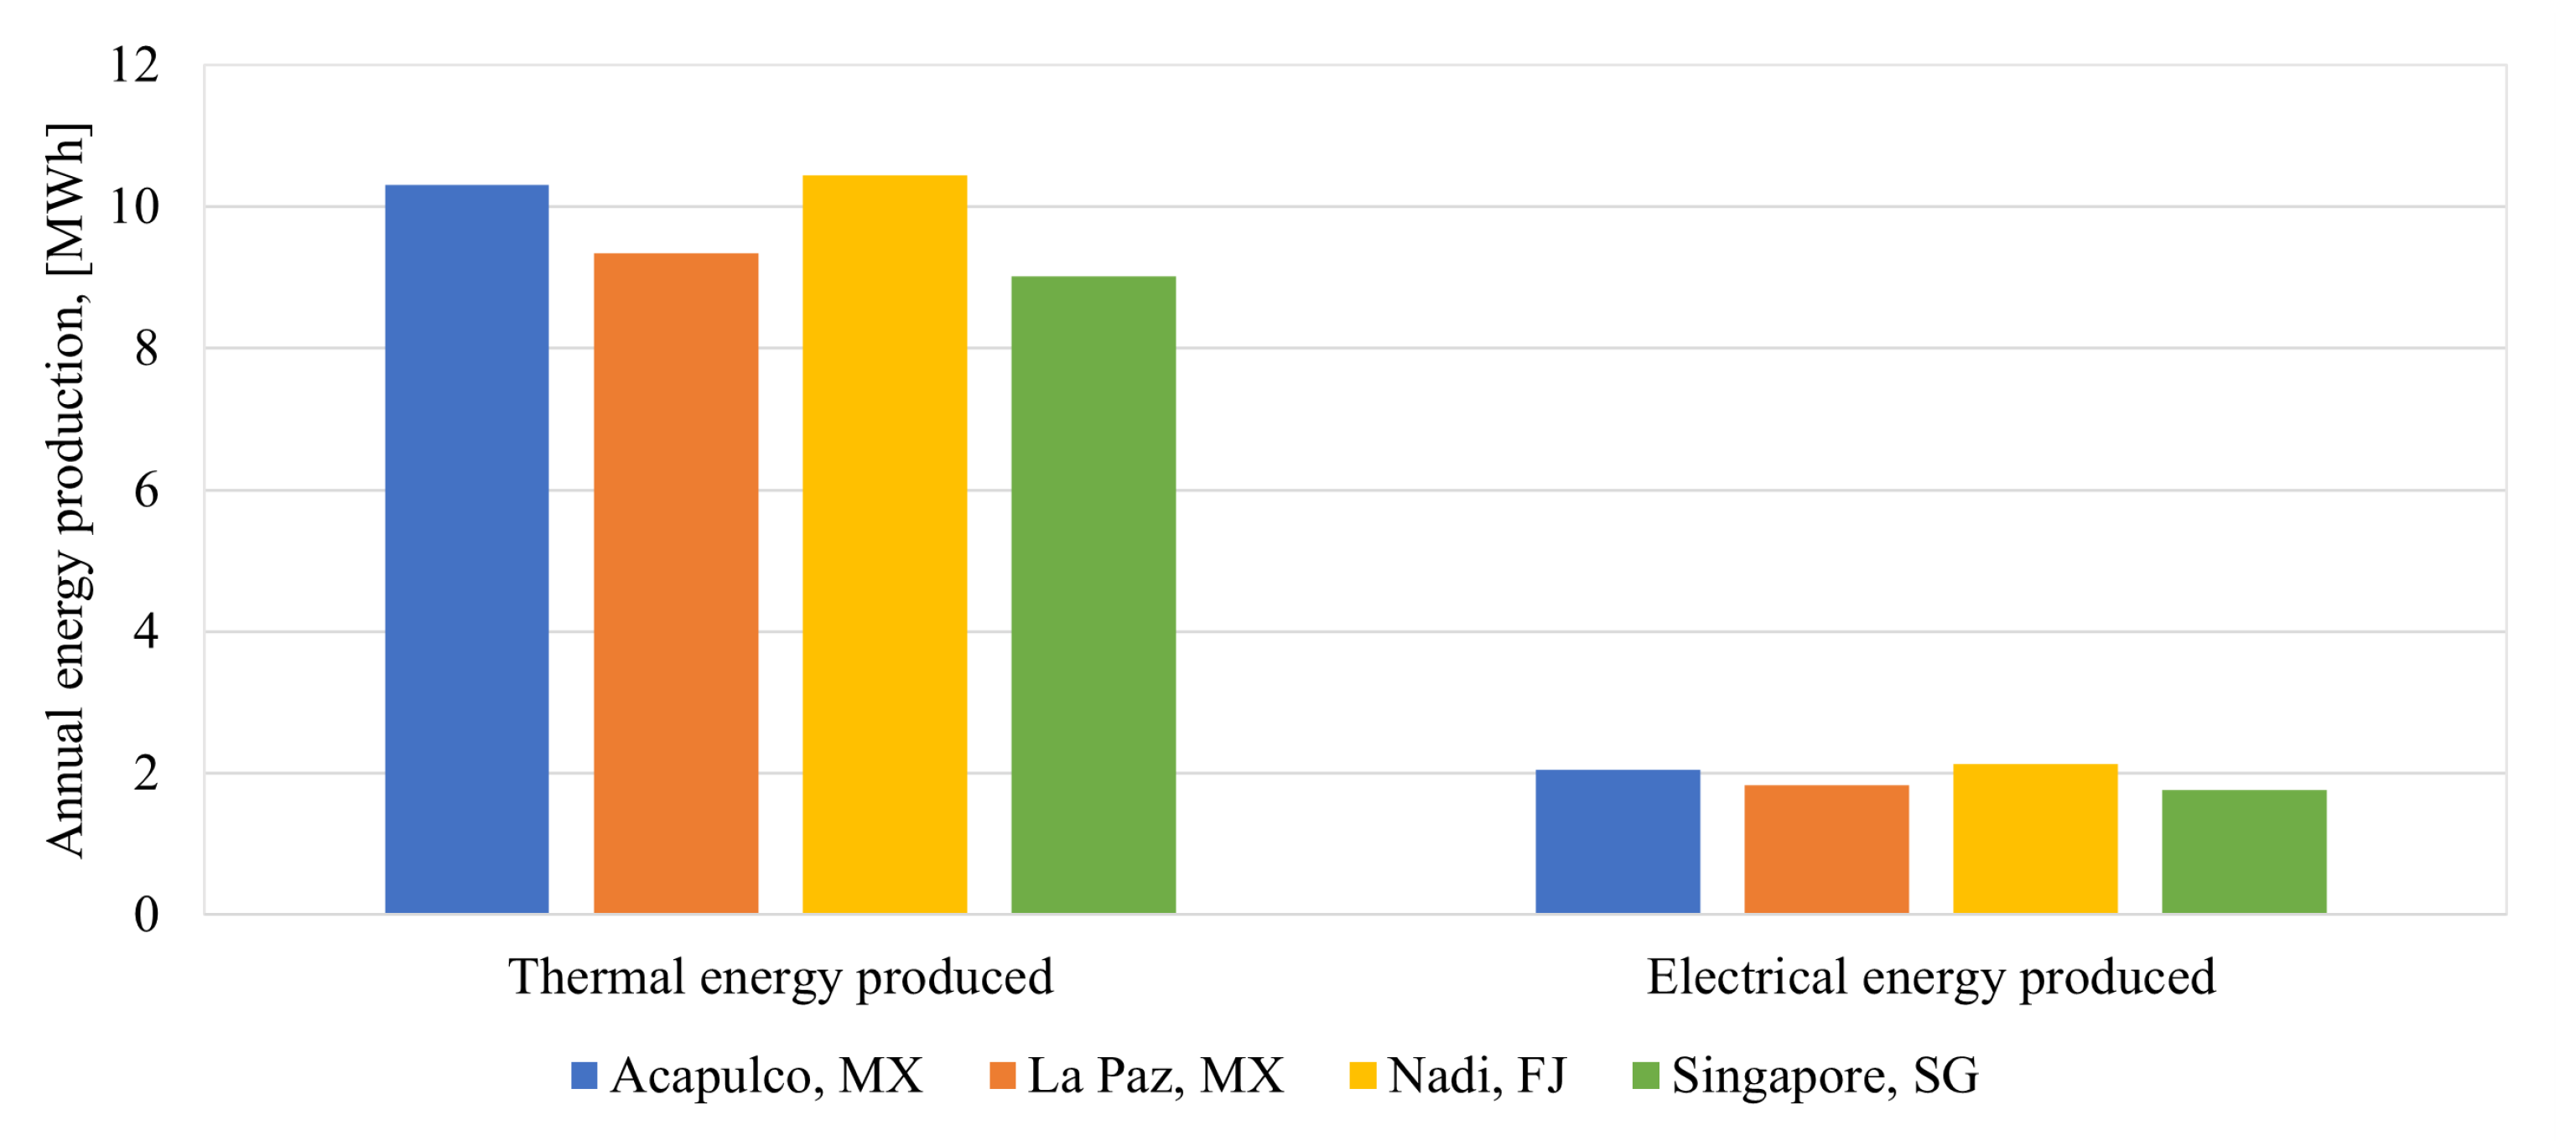
The electrical and thermal conversion efficiencies for the CPVT module averaged 8.2% and 41.4%, respectively, and did not change significantly among the different cities. These values show that the CPVT system can convert practically half of the solar radiation it receives into useful energy for any desired application, which herein is the desalination process. Figure 6 shows the annual thermal and electrical energies produced by the system under the weather conditions of each of the cities. Regardless of the location, the thermal energy production was significantly greater than the electrical output. The thermal and electrical energy production of Acapulco and Nadi cities was approximately 10% higher than the one of La Paz and Singapore. This behavior is expected due to the higher annual solar radiation of the Acapulco and Nadi cities.
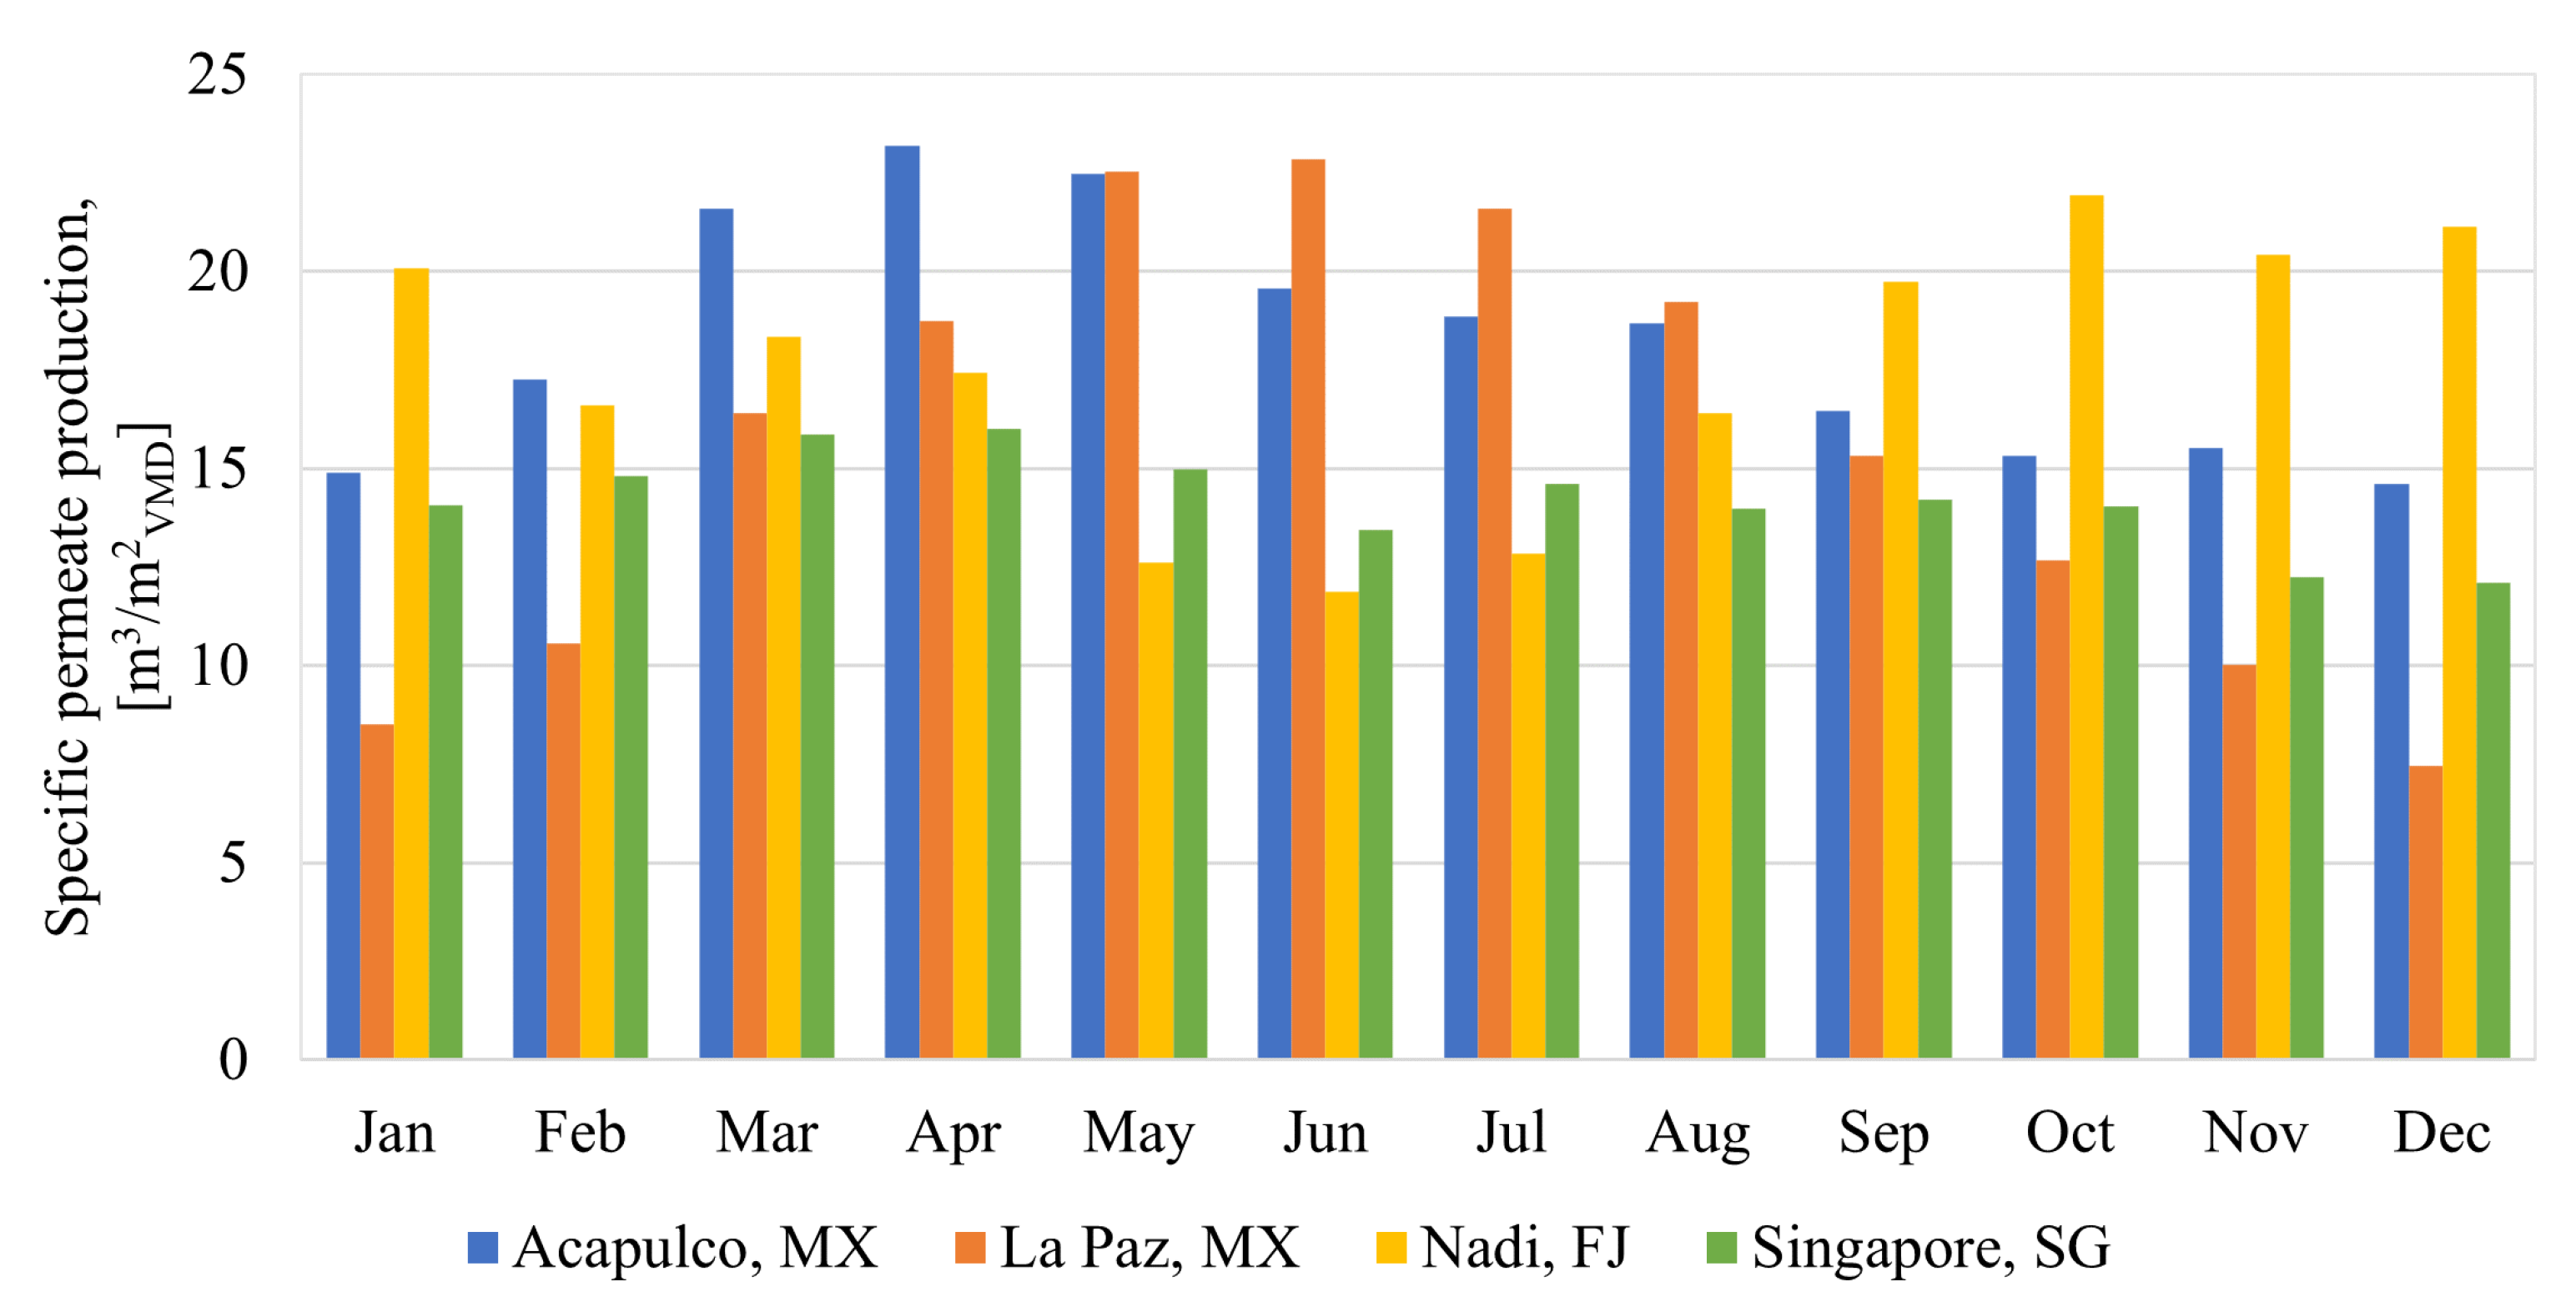
The month-specific permeate production of each city is presented in Figure 7. The largest annual production is presented in Acapulco, with 218.410 m3/m2VMD of permeate, followed by Nadi, with 209.415 m3/m2VMD, La Paz, with 185.886 m3/m2VMD and Singapore, with 170.365 m3/m2VMD. These values are coherent with those obtained from the literature [18], further confirming the results obtained from these simulations.
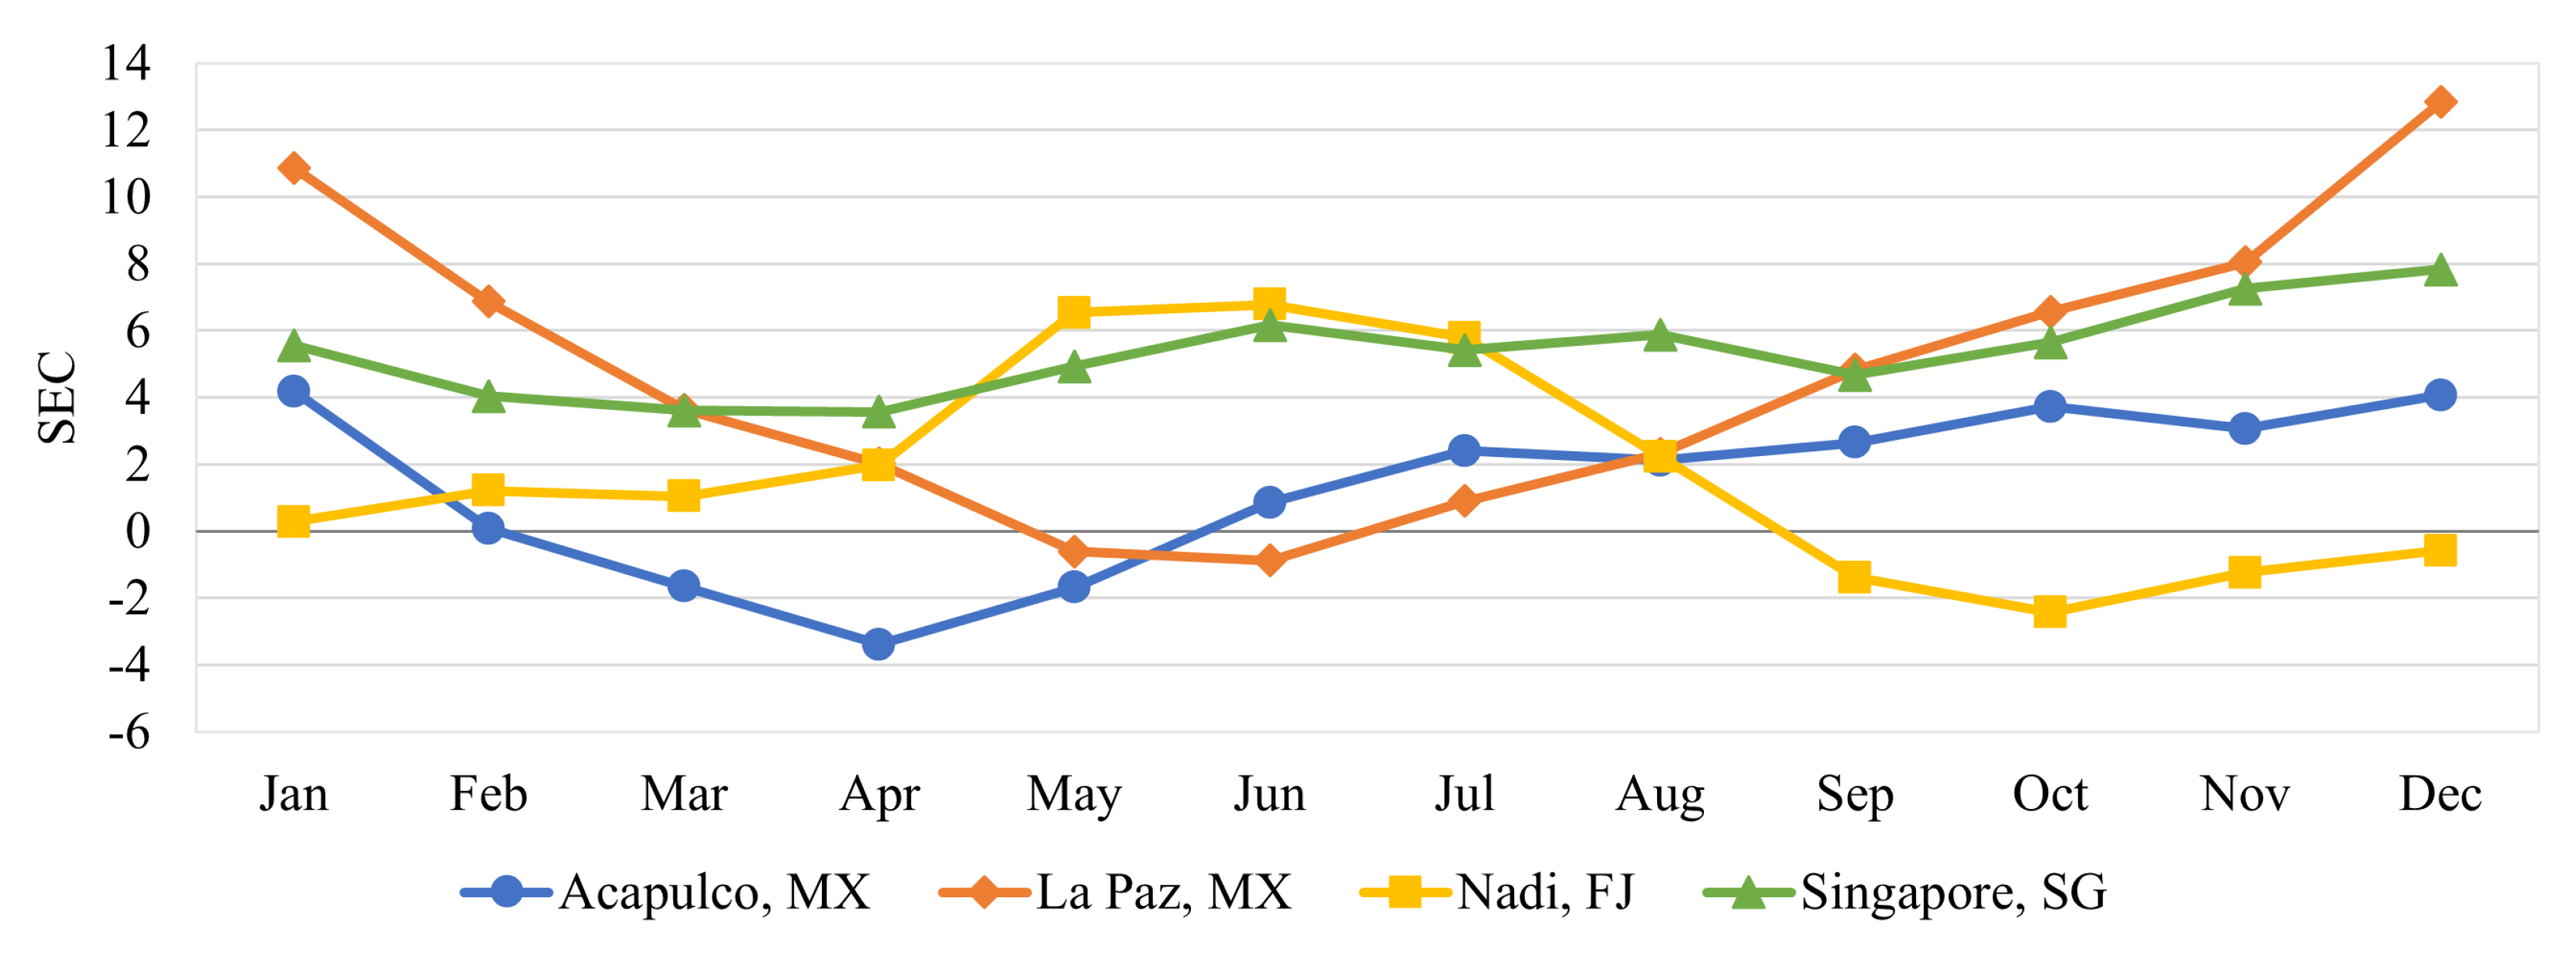
The lowest monthly SEC among the cities was 3.38 kWh/m3, reached in Acapulco, followed by Nadi with 2.43 kWh/m3, La Paz with 0.87 kWh/m3 and Singapore with 4.05 kWh/m3. However, it is important to notice that the performance of the system in Singapore is the steadiest of the four, while in the other cities it varies considerably between seasons. Furthermore, as shown in Figure 8, the coupled system reached negative SECs from March to May, in Acapulco; during May and June, in La Paz; and from September to December, in Nadi. This shows the great potential for desalination during the months with high solar radiation in each city.
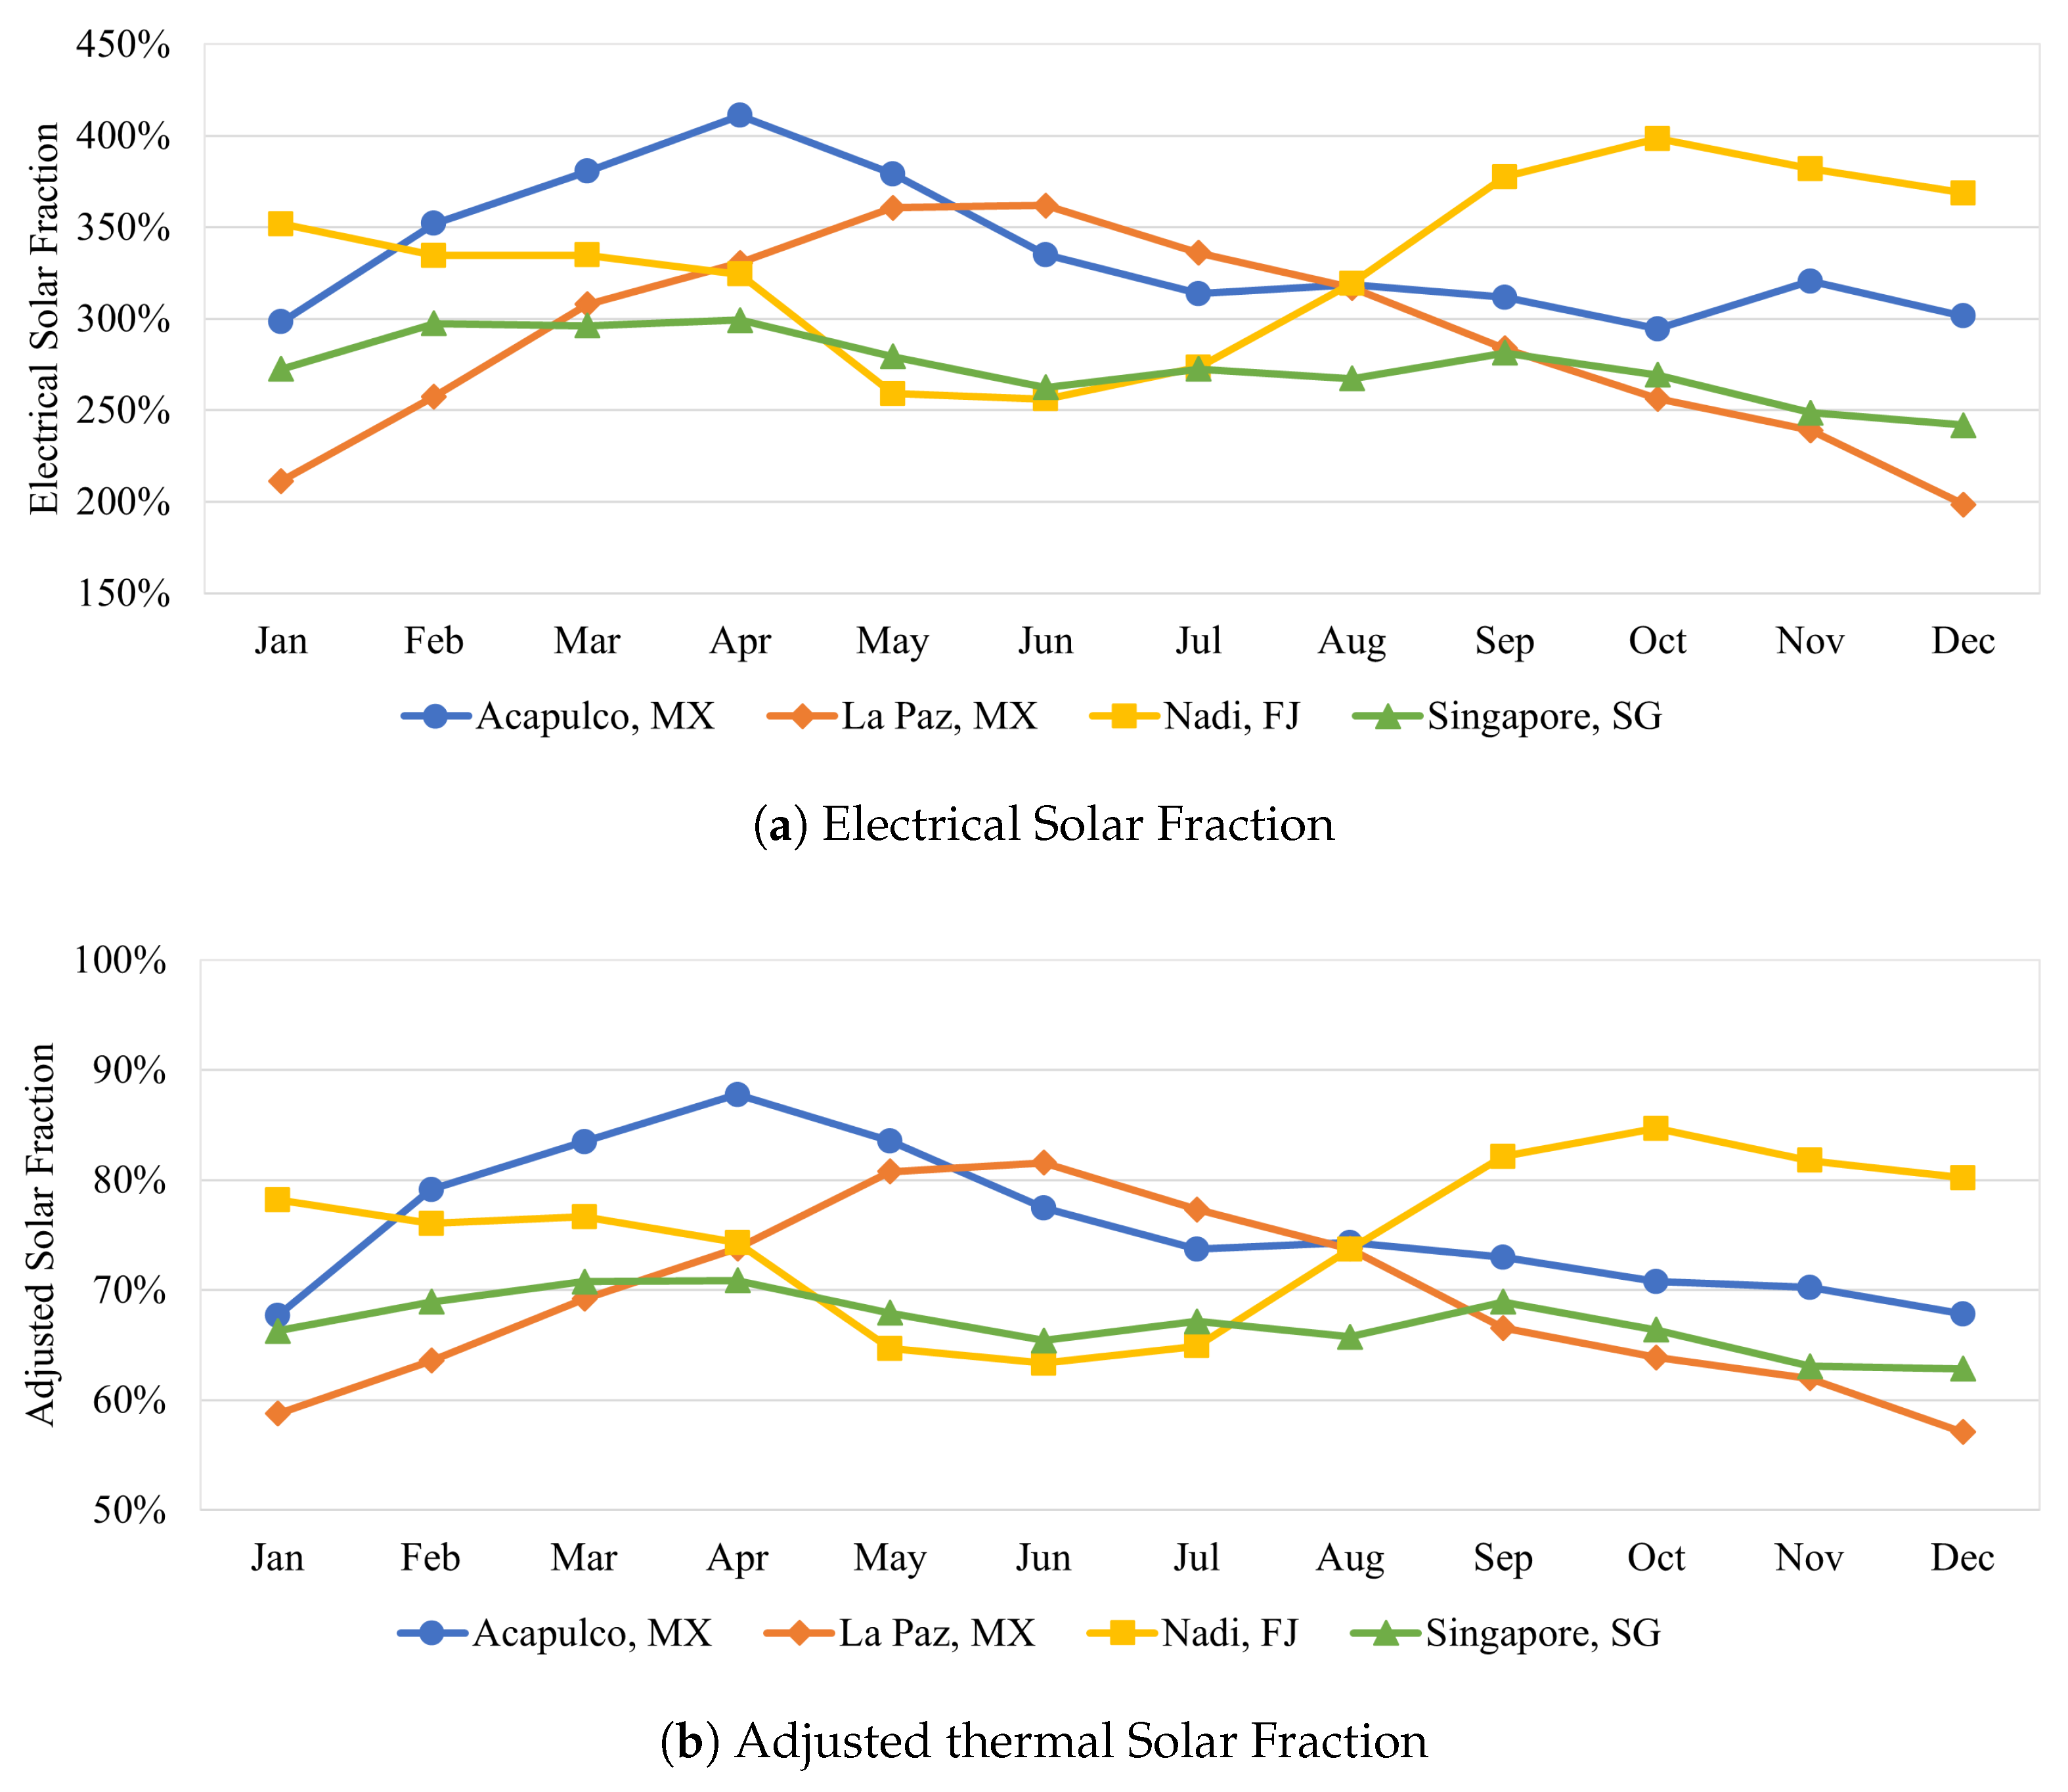
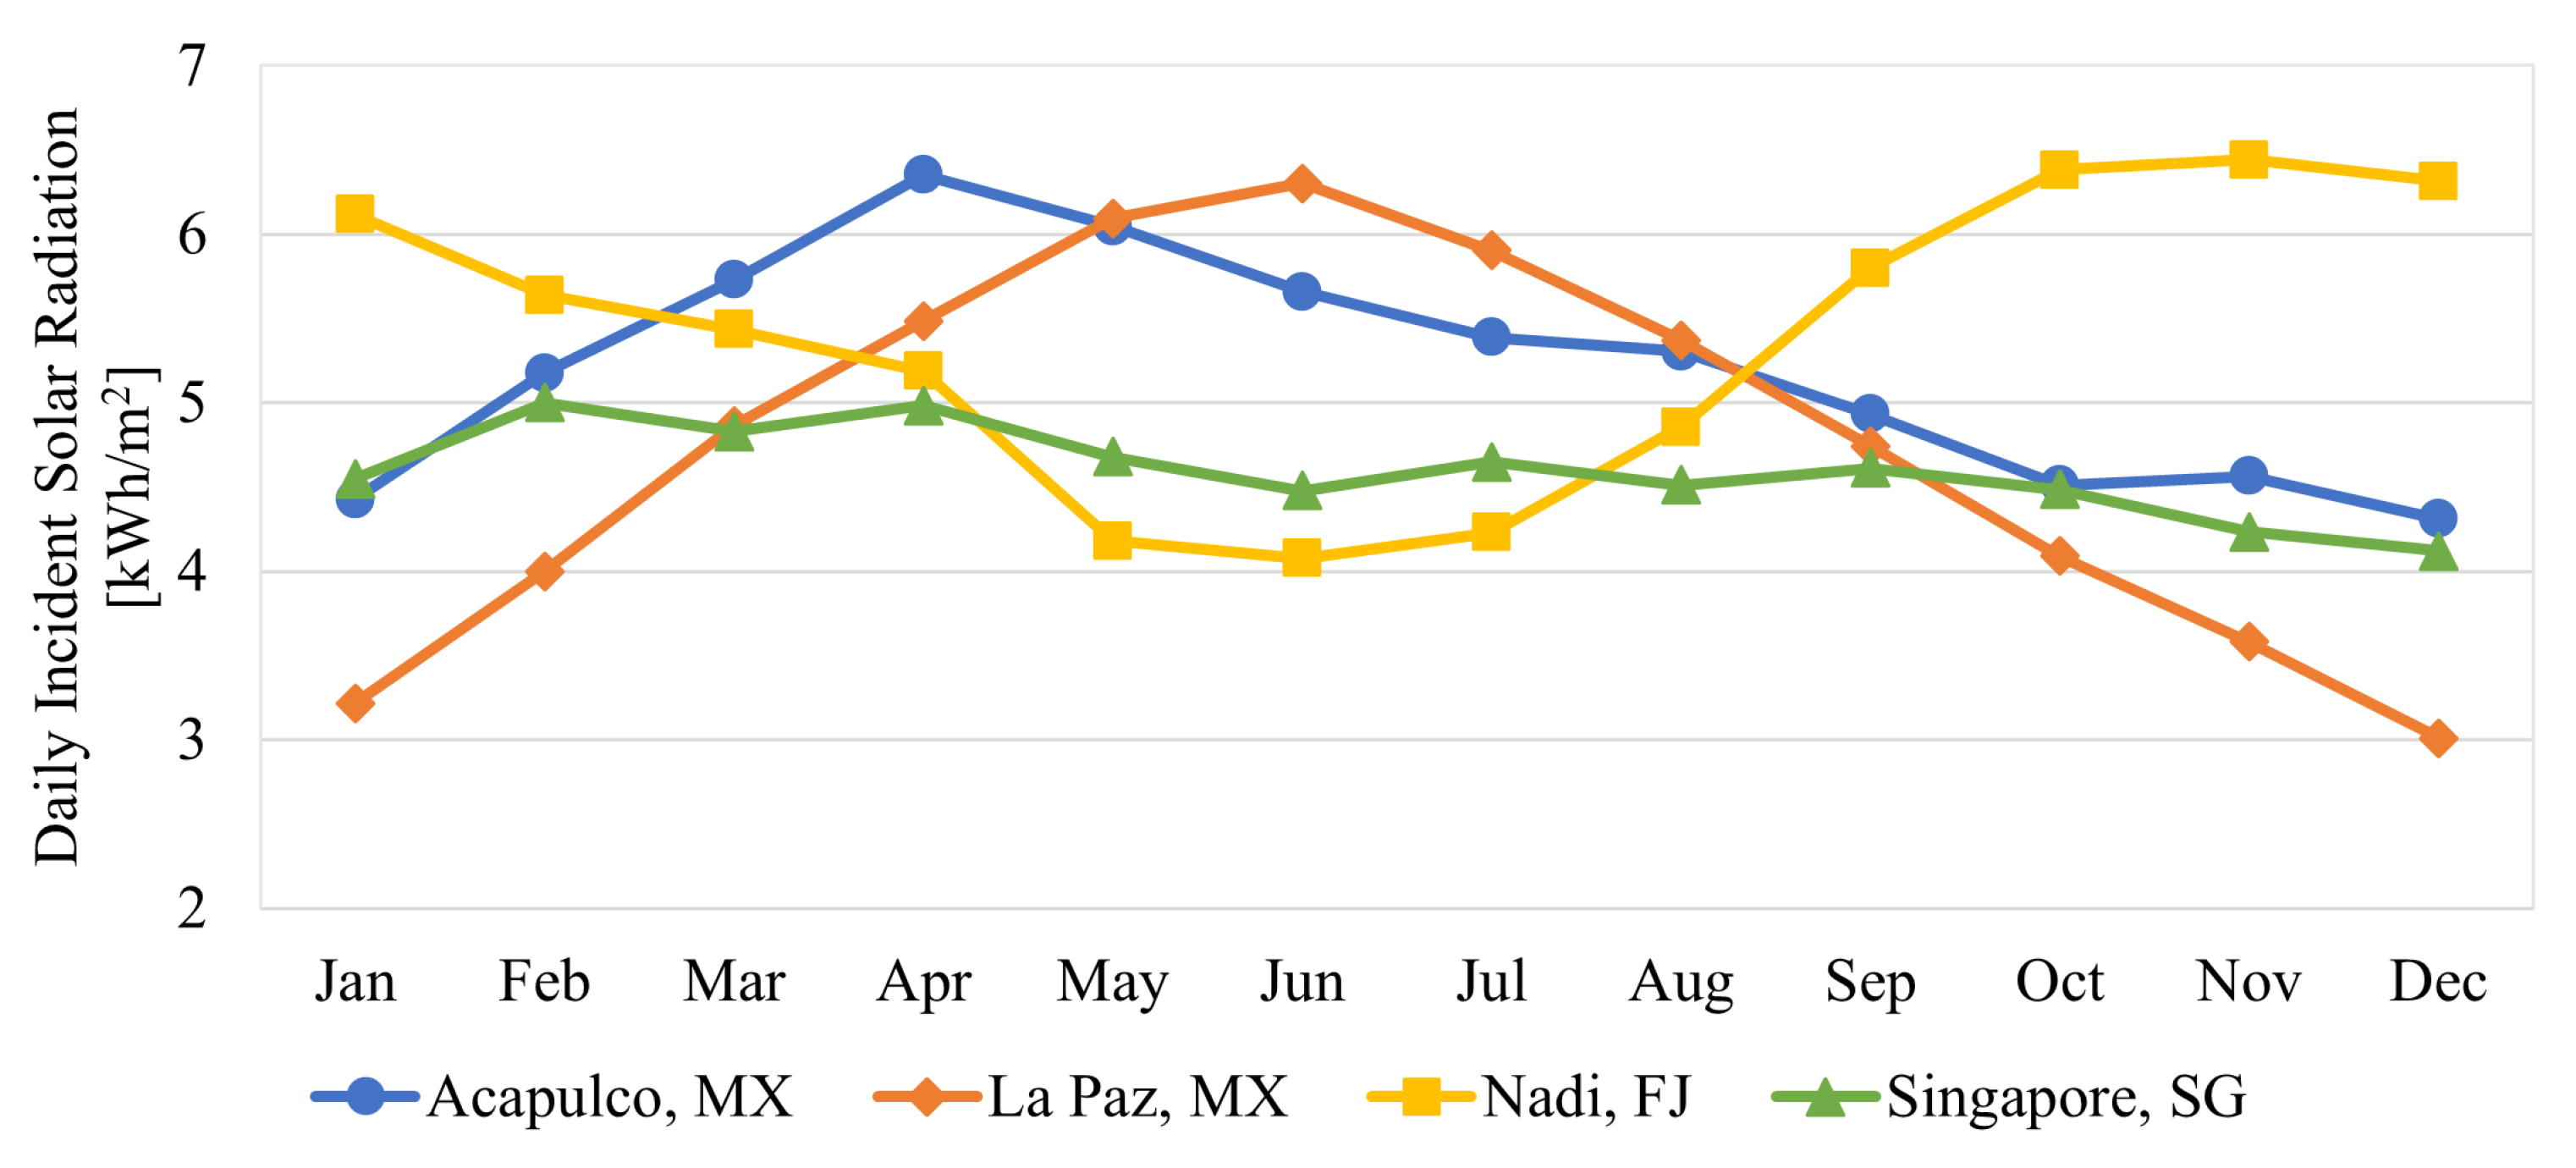
As mentioned in Section 2.4, one relevant metric to evaluate the performance of the integrated system is the solar fraction, which is directly related to the solar radiation in the city. Notably, since the electrical SF is larger than 100% throughout the year for every city, for the thermal SF, Equation (18) will be implemented. Figure 9 shows the monthly averaged daily solar radiation received by the system in each city and Figure 10 presents a comparison of the monthly SF achieved by the system under the different weather conditions, showing a clear correlation between the amount of solar radiation received and the performance of the system. Importantly, despite the thermal energy production being larger than the electrical, the electrical SF, depicted in Figure 10a, is over four times larger than its thermal counterpart, presented in Figure 10b, due to the high thermal energy required by the system to increase the brine temperature before reaching the VMD module. In other words, the electrical requirement for running the pumps integrated into the system can be easily covered by the electricity produced by the CPVT module; however, the thermal energy produced is insufficient to cover the energy required to heat the brine to the set point temperature and it is necessary to supplement it with an additional external energy source.
Moreover, the location of each city with respect to the equator influences the system’s performance. As expected, a better performance is presented in the months with a higher incident solar radiation and vice versa: La Paz, the northernmost city in this analysis (Lat.: 24.1426 N), presents its peak performance during the summer months in the northern hemisphere, while Nadi, the southernmost city (Lat.: 17.7765 S), presents the opposite behaviour and Singapore, practically sitting on the equator (Lat.: 1.3521 N), remains mostly stable throughout the whole year but produces less permeate and electrical energy.

3.4. Economic Analysis

In order to have an estimation of the cost of the proposed system, an economic analysis is performed. The data and results of Acapulco, MX, are for this analysis. Table A2 presents a list of all the components required to assemble the CPVT-VMD system with their respective prices. From this calculation, a subtotal capital cost of USD 10,186.11 was estimated for the whole system. Moreover, an estimated installation cost of 20% [26] was selected for this analysis, reaching a total capital cost of USD 12,223.33.
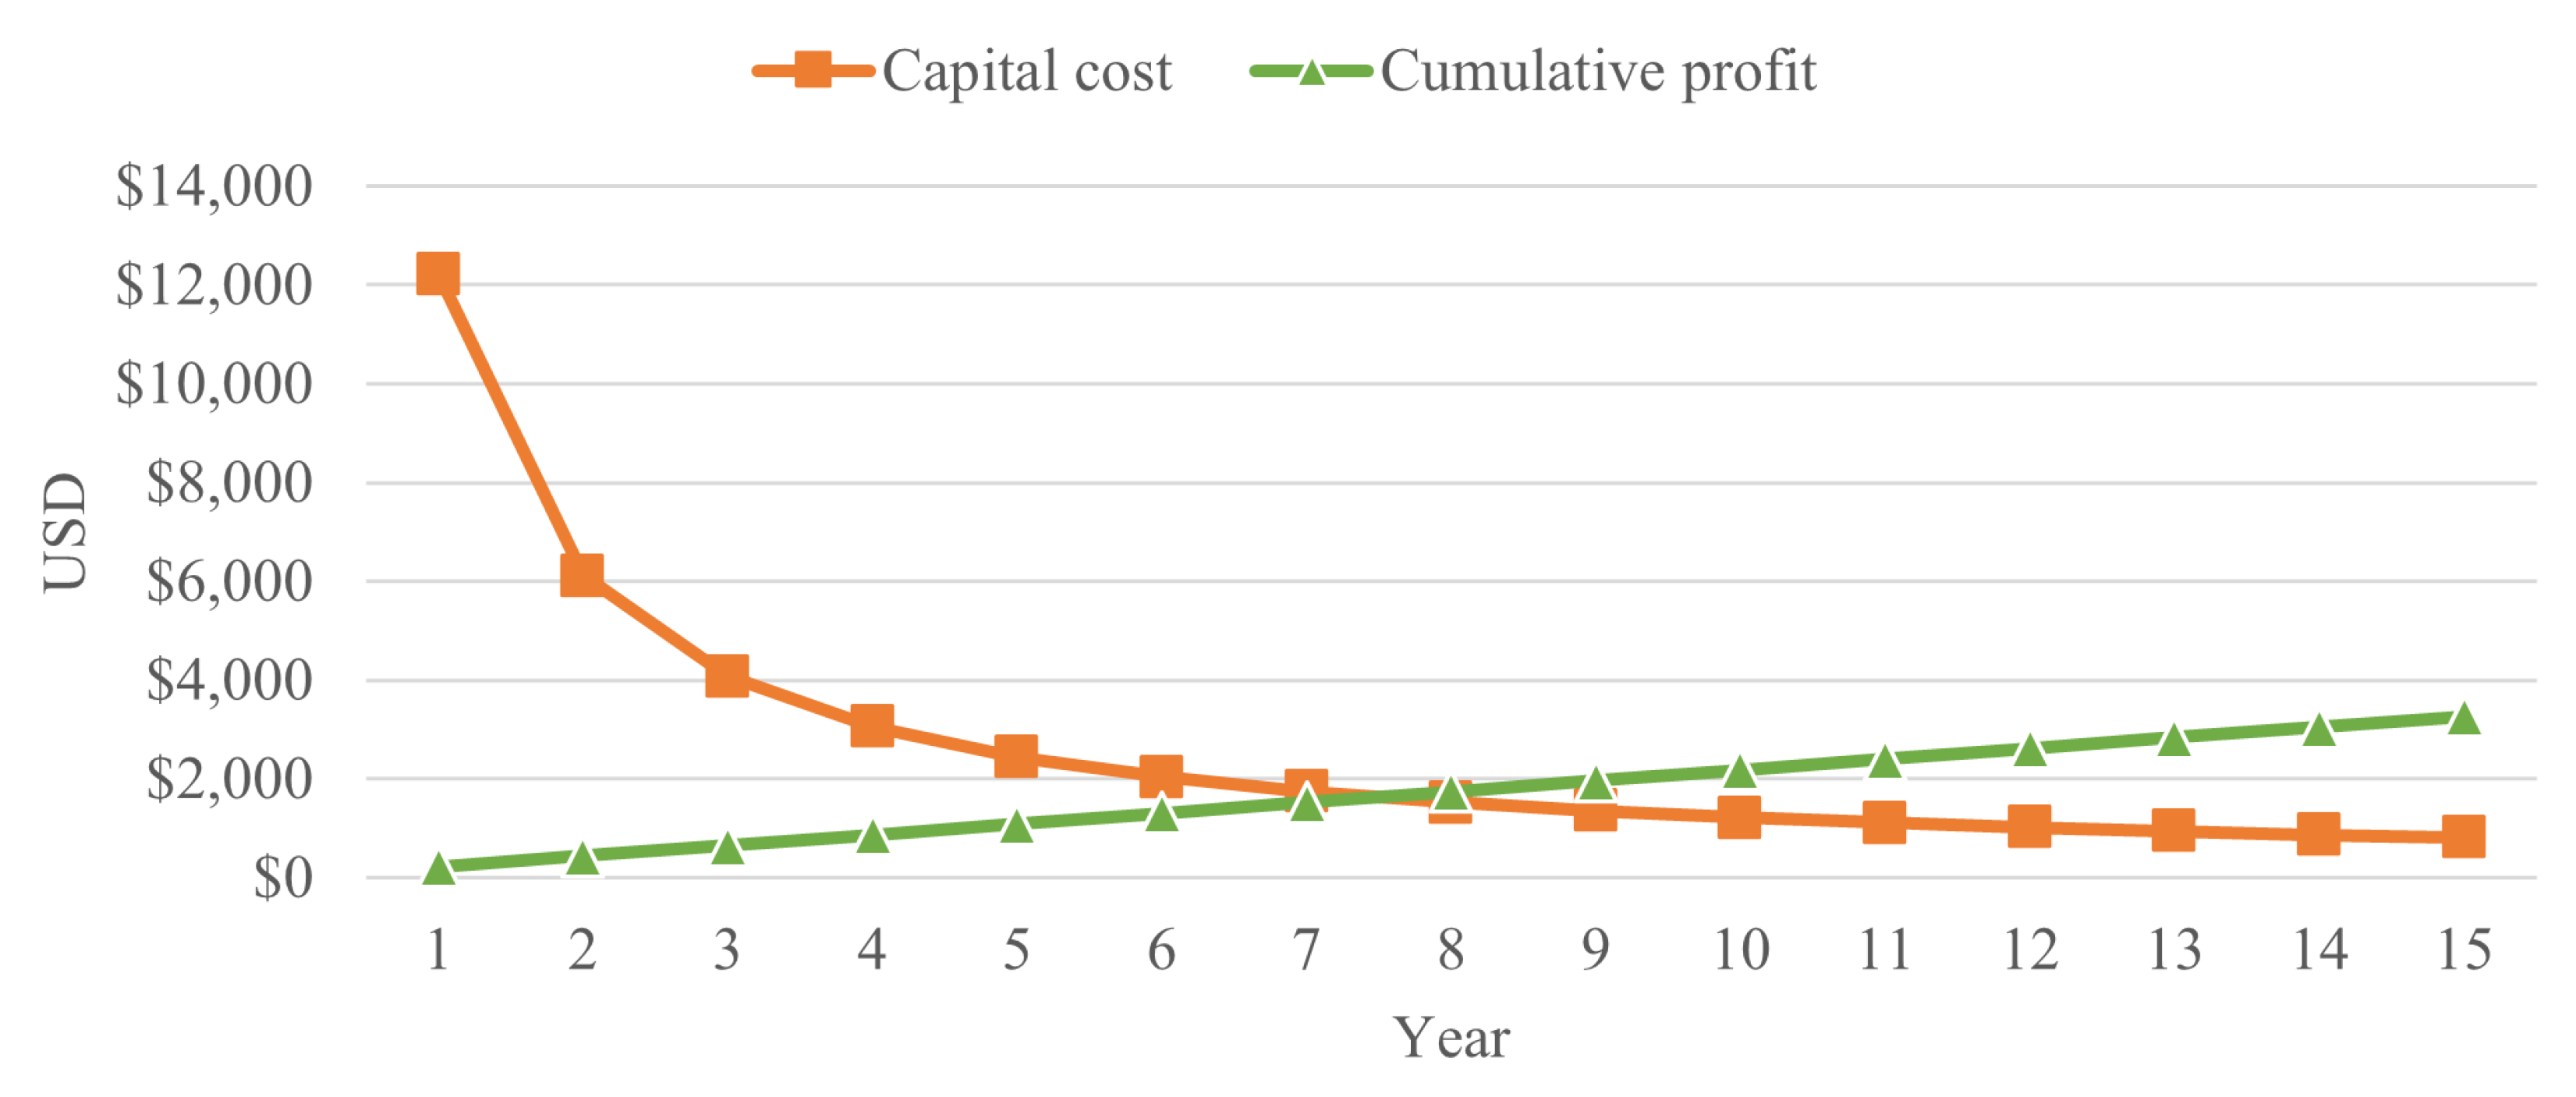
Once the capital costs were determined, a financial run spanning 15 years was performed to identify how this seemingly heavy initial investment is deferred with every year the system operates. Not only that, but this was used to calculate the Return of Investment (ROI) period and the Specific production cost for every m3 of permeate produced. A cost of USD 1 per m3 of supplied water is considered based on the site of the local water supplier of Acapulco, MX [43]. Additionally, as presented in the previous section, a constant annual production of 218 m3 of permeate was considered for this run.
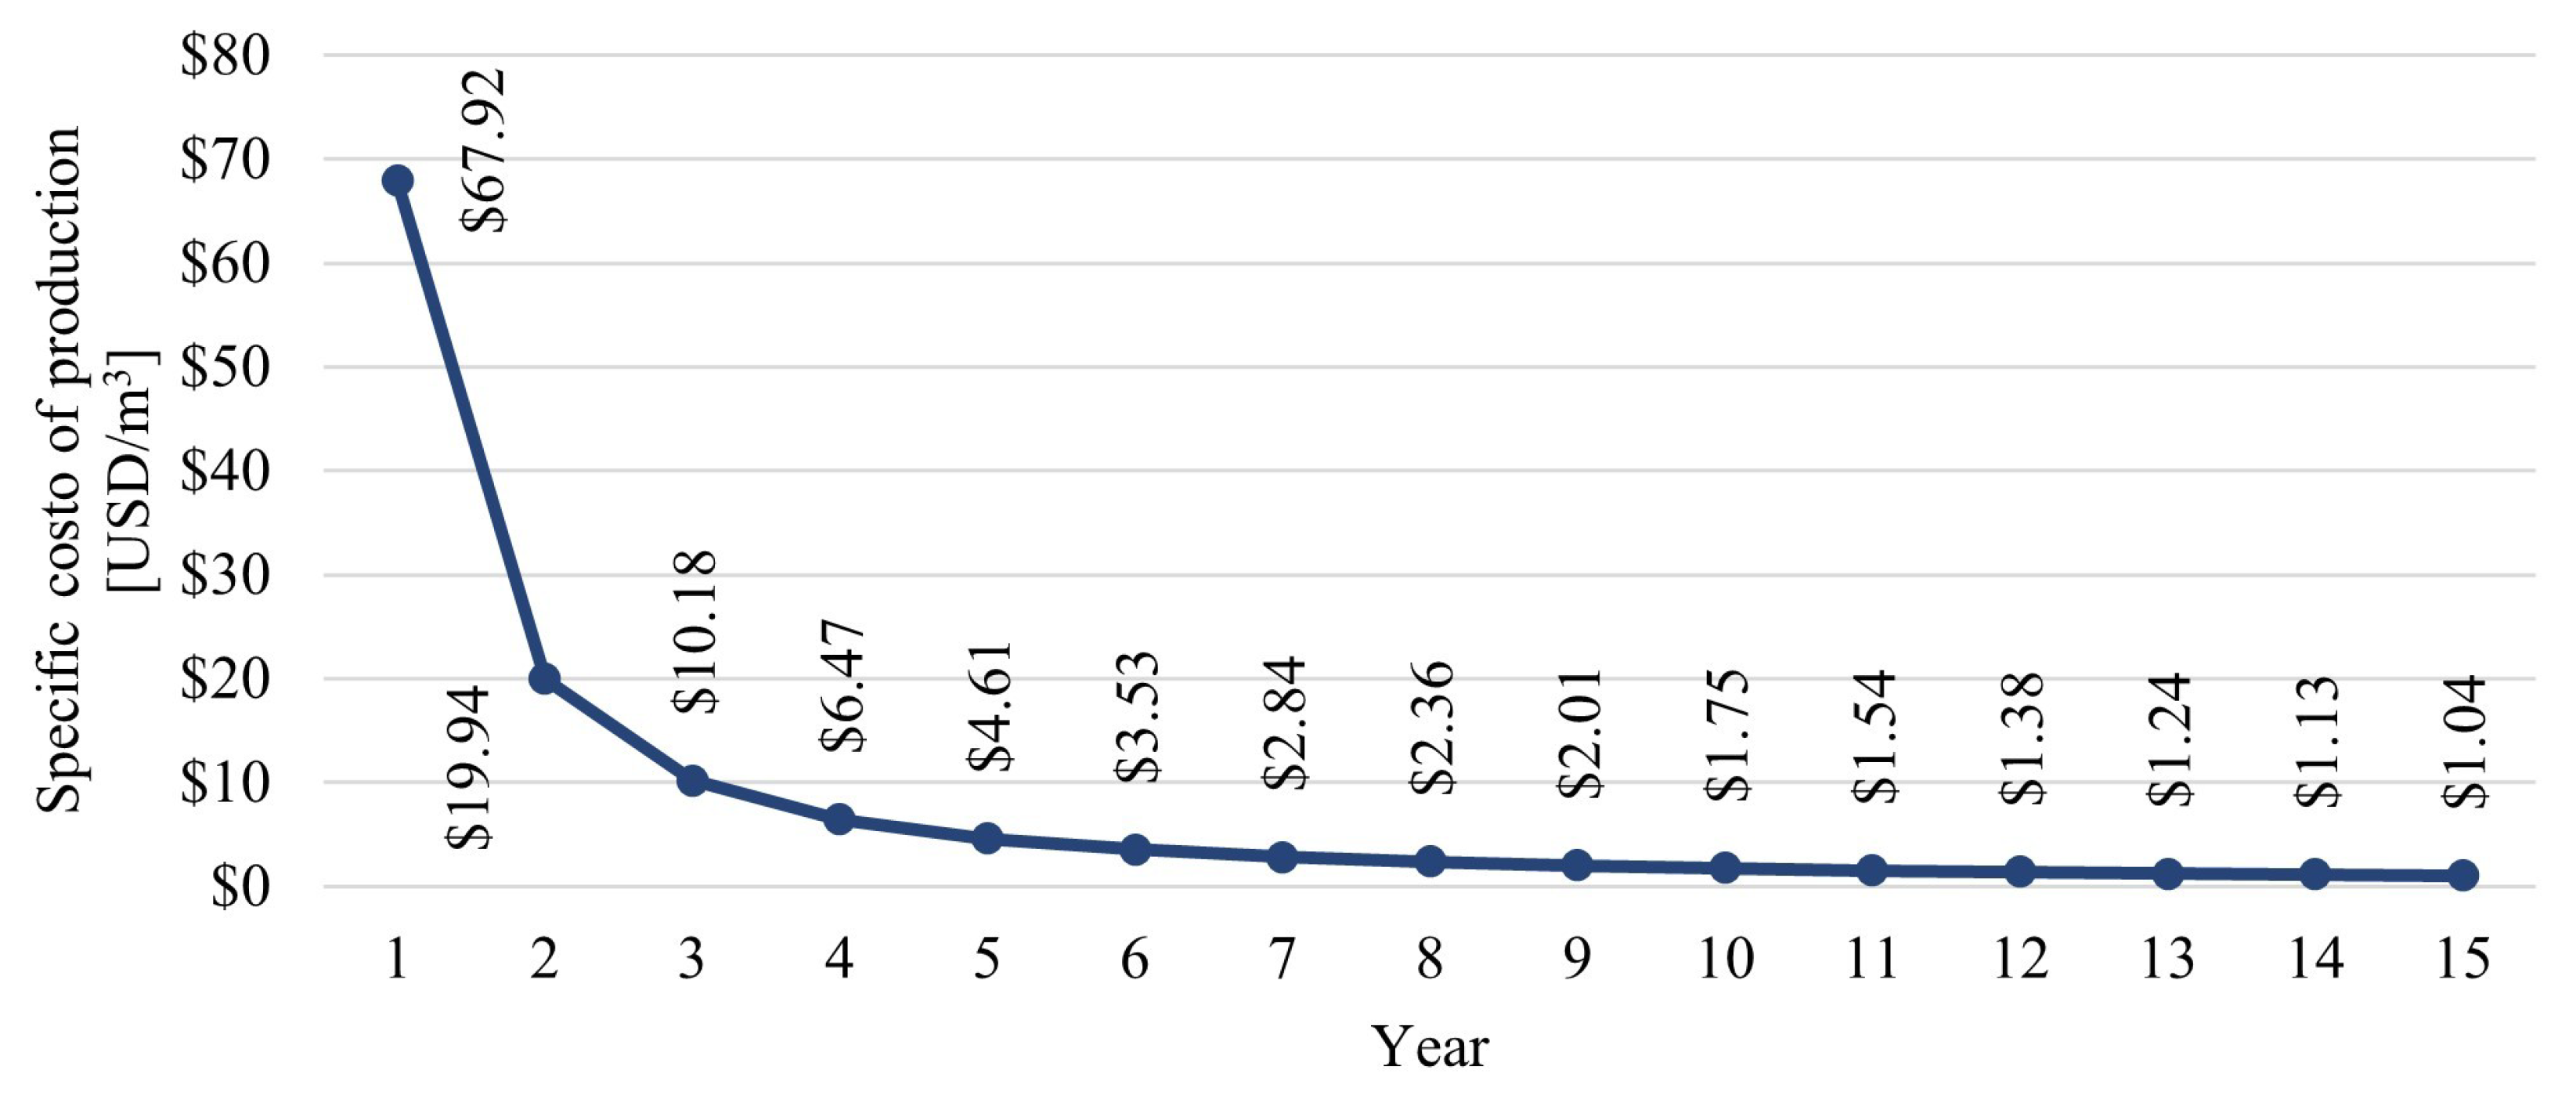
Figure 11 depicts the results of the ROI analysis for this system. It is noticeable that the deferment of the capital cost of the system has an exponential reduction with every year that the system is operating, reaching a break-even point after 7 years, achieving its first profits on the eighth. On the other hand, as shown in Figure 12, the cost of producing 1 m3 of permeate via the proposed system also decreases exponentially with every year the system operates. In this case, even after 15 years of operation, the cost per m3 is not able to match the local supplier price of USD 1 per m3 but it is still a more competitive cost than those presented by other authors in the literature such as Elminshawy et al. (22.48 USD/m3) [17] or Chen et al. (2.71 USD/m3) [18]. A larger VMD membrane area could reduce the capital and variable costs of the system, achieving lower price for every m3 of permeate produced.
In summary, from the energy and economic analysis, the results show the potential of this coupled system for the production of electrical energy and fresh water. Possible applications could involve the development of a low-cost prototype, which could aid remote coastal communities by supplying clean energy and water for their inhabitants. Future work must focus on the development of the prototype system required to experimentally validate the simulations.

4. Conclusions

The dynamic behavior of the coupled CPVT-VMD solar desalination system was studied under the weather conditions of Acapulco, MX, La Paz, MX, Nadi, FJ, and Singapore, SG, throughout a whole year. A transient simulation was developed in TRNSYS to evaluate the system performance and parametric studies help to identify the optimal operating conditions for the test. The CPVT model was previously developed by [21] and is represented in the simulation by a modified Type 50f component. Similarly, the VMD model was previously developed by [33] and a new Type was written using TypeStudo to include it in the simulation.
From the results of the parametric studies, the operating conditions considered for the multi-city system’s evaluation were 4-collector units (13 m2) and a set point temperature of 55 °C. The results showed that independent of the city evaluated, the system could fully cover the electrical energy requirements for its operation and a significant part of the thermal requirements and also that the performance of the system is strongly related to the solar radiation received in the city, i.e., a higher solar radiation results in a better performance. Additionally, the CPVT system can convert almost 50% of the received solar radiation into useful energy (8% into electricity and 41% into heat). The permeate production varied from 170.365 m3/m2VMD in Singapore, SG, to 218.410 m3/m2VMD in Acapulco, MX, with 185.885 and 209.415 m3/m2VMD produced in La Paz, MX, and Nadi, FJ, respectively, similar to other values presented in the literature regarding the solar-assisted VMD permeate production. From the economical analysis, it was determined that for the city of Acapulco, after 7 years a profit can be obtained with the proposed solar desalination system. The cost of producing 1 m3 of permeate approaches exponentially the low local supplier price and it is competitive with others costs reported in the literature with similar solar membrane distillation systems.
This work provides relevant information for the development of a functional prototype, which could further be scaled up to a pilot plant.

Author Contributions

Conceptualization, J.P.S., C.I.R.-S., J.W.C. and Y.Z.T.; methodology, J.P.S., C.I.R.-S., J.W.C., Y.Z.T., M.G.-R. and I.A.-P.; software, J.P.S. and I.A.-P.; validation, Y.Z.T. and I.A.-P.; formal analysis, J.P.S.; investigation, J.P.S.; resources, C.I.R.-S., M.G.-R. and I.A.-P.; writing—original draft preparation, J.P.S.; writing—review and editing, J.P.S., C.I.R.-S., J.W.C., Y.Z.T., M.G.-R. and I.A.-P.; visualization, J.P.S.; supervision, C.I.R.-S., J.W.C. and M.G.-R.; project administration, J.P.S., C.I.R.-S. and J.W.C. All authors have read and agreed to the published version of the manuscript.

Funding

This research was partially funded by the Tecnologico de Monterrey Challenge-Based Research Funding Program.

Acknowledgments

Special thanks to Tecnológico de Monterrey and CONACYT for their financial support to some of the researchers during the length of their post-graduate studies.

Conflicts of Interest

The authors declare no conflict of interest.

Abbreviations

The following abbreviations are used in this manuscript:
AGMDAir Gap Membrane Distillation
COPCoefficient of Performance
CPVConcentrating Photovoltaic
CPVTConcentrated Photovoltaic Thermal
CSPConcentrated Solar Power
DCMDDirect Contact Membrane Distillation
DNIDirect Normal Irradiance
EDElectrodialysis
FJFiji
FORTRANFORmula TRANslator
HDHHumidification-Dehumidification
HTFHeat Transfer Fluid
MDMembrane Distillation
MEDMulti-Effect Distillation
MJCMultijunction Cells
MSFMulti-Stage Flash
MXMexico
PVPhotovoltaic
PTCParabolic Through Collector
PV-TPhotovoltaic-Thermal
RERenewable Energy
ROReverse Osmosis
ROIReturn of Investment
SECSpecific Energy Consumption
SFSolar Fraction
SGSingapore
TRNSYSTransient System Simulation Tool
TVCThermal Vapor Compression
VMDVacuum Membrane Distillation
V-MEMDVacumm Multi-effect Membrane Distillation

Appendix A. TRNSYS Simulation Components

Table A1. Components used in the TRNSYS simulation.
ComponentTRNSYS TypeDescription
Weather dataType 15-3Provides real weather data from the specified city.
Pump HTFType 1Moves the Heat Transfer Fluid in the CPVT loop.
CPVT CollectorType 50fModels the CPVT collector which, using the weather data, computes the electrical and thermal energy outputs and the outlet temperature of the HTF.
Tank HTFType 158Buffers the HTF outlet temperature from the CPVT Collector to avoid divergence in the simulation.
ControllerType 165A differential controller that regulates when to start the pumps in the whole system.
HXType 5gHeat exchanger that transfers heat from the HTF to the salt water.
Control brineNAEquation box that provides the initial mass flow rate of the salt water and its temperature.
Tank MFType 39Tank for the salt water that serves as buffer before the pump.
Pump BrineType 114Moves the salt water in the VMD loop.
Tempering ValveType 115Determines the fraction of salt water that goes to the HX and the one that by-passes it.
DiverterType 11fDiverts a fraction of the salt water to the HX in order to heat it.
MixerType 11hCombines the flows from the HX and the bypass.
Tank VMDType 39Buffers the mixer outlet before feeding the VMD module.
Tank StatType 106Measures the temperature of the salt water before the VMD module and determines if it is necessary to add heat from the external heat source.
Qaux tankNAEquations that model the auxiliary resistance used to heat the feed flow.
T207 VMDType 207Vacuum Membrane Distillation module modeled using Equation (9) and written in FORTRAN
Control VMDNAEquation bow that provides information regarding the VMD module functioning, such as operating vacuum pressure and power consumption and computes the feed vapour pressure.

Appendix B. Costs Summary for CPVT-VMD System

Table A2. Capital and installation costs for proposed CPVT-VMD system.
Energy Production Cycle (EPC)Price [USD]Reference
Parabolic trough collector2990.00[26]
Heat exchanger258.00Local supplier
Hybrid receiver598.00[26]
Tank862.50[26]
Inverter238.00[26]
Hydraullic system631.80[26]
Controller558.00[26]
Subtotal6136.30-
Brine Treatment Cycle (BTC)Price [USD]Reference
MF Pump116.42[44]
MF module218.00[45]
MF tank800.00[46]
Brine pump131.25[47]
VMD tank800.00[46]
Vacuum pump619.75[48]
VMD module1000.00Own production
Aquastat72.39[49]
Auxiliary heater220.00[50]
Subtotal4029.81-
System capital costs10,186.11-
Installation costs2037.22[26]
TOTAL12,223.33-

References

  1. United Nations World Water Assessment Programme. The United Nations World Water Development report 2018: Nature-Based Solutions for Water; UNESCO: Paris, France, 2018. [Google Scholar]
  2. Al-Obaidi, M.A.; Zubo, R.H.A.; Rashid, F.L.; Dakkama, H.J.; Abd-Alhameed, R.; Mujtaba, I.M. Evaluation of Solar Energy Powered Seawater Desalination Processes: A Review. Energies 2022, 15, 6562. [Google Scholar] [CrossRef]
  3. Eke, J.; Yusuf, A.; Giwa, A.; Sodiq, A. The global status of desalination: An assessment of current desalination technologies, plants and capacity. Desalination 2020, 495, 114633. [Google Scholar] [CrossRef]
  4. Ali, M.T.; Fath, H.E.S.; Armstrong, P.R. A comprehensive techno-economical review of indirect solar desalination. Renew. Sustain. Energy Rev. 2011, 15, 4187–4199. [Google Scholar] [CrossRef]
  5. International Desalination Association (IDA). The IDA Desalination Yearbook 2011–2012 | Water Desalination Report; IDA: Topsfield, MA, USA, 2011. [Google Scholar]
  6. Tan, Y.Z.; Wang, H.; Han, L.; Tanis-Kanbur, M.B.; Pranav, M.V.; Chew, J.W. Photothermal-enhanced and fouling-resistant membrane for solar-assisted membrane distillation. J. Membr. Sci. 2018, 565, 254–265. [Google Scholar] [CrossRef]
  7. Alsaati, A.; Marconnet, A. Energy efficient membrane distillation through localized heating. Desalination 2018, 442, 99–107. [Google Scholar] [CrossRef]
  8. Drioli, E.; Ali, A.; Macedonio, F. Membrane distillation: Recent developments and perspectives. Desalination 2015, 356, 56–84. [Google Scholar] [CrossRef]
  9. Pangarkar, B.L.; Sane, M.G.; Guddad, M. Reverse Osmosis and Membrane Distillation for Desalination of Groundwater: A Review. ISRN Mater. Sci. 2011, 2011, 1–9. [Google Scholar] [CrossRef]
  10. UNICEF. Reimagining WASH Water Security for All; Technical Report; UNICEF: New York, NY, USA, 2021. [Google Scholar]
  11. Mollahosseini, A.; Abdelrasoul, A.; Sheibany, S.; Amini, M.; Salestan, S.K. Renewable energy-driven desalination opportunities—A case study. J. Environ. Manag. 2019, 239, 187–197. [Google Scholar] [CrossRef]
  12. Shoeibi, S.; Saemian, M.; Kargarsharifabad, H.; Hosseinzade, S.; Rahbar, N.; Khiadani, M.; Rashidi, M.M. A review on evaporation improvement of solar still desalination using porous material. Int. Commun. Heat Mass Transf. 2022, 138, 106387. [Google Scholar] [CrossRef]
  13. Abdelgaied, M.; Seleem, M.F.; Bassuoni, M.M. Recent technological advancements in membrane distillation and solar stills: Preheating techniques, heat storage materials and nanomaterials—A detailed review. Environ. Sci. Pollut. Res. 2022, 29, 38879–38898. [Google Scholar] [CrossRef]
  14. Zhao, Q.; Zhang, H.; Hu, Z.; Hou, S. A solar driven hybrid photovoltaic module/direct contact membrane distillation system for electricity generation and water desalination. Energy Convers. Manag. 2020, 221, 113146. [Google Scholar] [CrossRef]
  15. Ma, Q.; Xu, Z.; Wang, R. Distributed solar desalination by membrane distillation: Current status and future perspectives. Water Res. 2021, 198, 117154. [Google Scholar] [CrossRef]
  16. Krnac, A.; Araiz, M.; Rana, S.; Velardo, J.; Date, A. Investigation of direct contact membrane distillation coupling with a concentrated photovoltaic solar system. Energy Procedia 2019, 160, 246–252. [Google Scholar] [CrossRef]
  17. Elminshawy, N.A.; Gadalla, M.A.; Bassyouni, M.; El-Nahhas, K.; Elminshawy, A.; Elhenawy, Y. A novel concentrated photovoltaic-driven membrane distillation hybrid system for the simultaneous production of electricity and potable water. Renew. Energy 2020, 162, 802–817. [Google Scholar] [CrossRef]
  18. Chen, Y.H.; Hung, H.G.; Ho, C.D.; Chang, H.; Economic, H. Economic Design of Solar-Driven Membrane Distillation Systems for Desalination. Membranes 2020, 24, 15. [Google Scholar] [CrossRef]
  19. Fernández-García, A.; Zarza, E.; Valenzuela, L.; Pérez, M. Parabolic-trough solar collectors and their applications. Renew. Sustain. Energy Rev. 2010, 14, 1695–1721. [Google Scholar] [CrossRef]
  20. Soomro, M.I.; Kim, W.S. Parabolic-trough plant integrated with direct-contact membrane distillation system: Concept, simulation, performance and economic evaluation. Sol. Energy 2018, 173, 348–361. [Google Scholar] [CrossRef]
  21. Acosta Pazmiño, I.P. Caracterización y evaluación de un sistema híbrido fotovoltaico/térmico basado en el concentrador solar parabólico lineal. Ph.D. Thesis, Tecnológico de Monterrey, Monterrey, Mexico, 2016. [Google Scholar]
  22. Chen, Q.; Burhan, M.; Akhtar, F.H.; Ybyraiymkul, D.; Shahzad, M.W.; Li, Y.; Ng, K.C. A decentralized water/electricity cogeneration system integrating concentrated photovoltaic/thermal collectors and vacuum multi-effect membrane distillation. Energy 2021, 230, 120852. [Google Scholar] [CrossRef]
  23. Liu, Z.; Zhang, H.; Cheng, C.; Huang, J. Energetic performance analysis on a membrane distillation integrated with low concentrating PV/T hybrid system. Renew. Energy 2021, 179, 1815–1825. [Google Scholar] [CrossRef]
  24. SunPower. C60 SOLAR CELL; Technical Report; SunPower: San Jose, CA, USA, 2010. [Google Scholar]
  25. Inventive Power. Power Trough 110; Technical Report; Inventive Power: Zapopan, Mexico, 2012. [Google Scholar]
  26. Acosta-Pazmiño, I.; Rivera-Solorio, C.; Gijón-Rivera, M. Energetic and Economic Analyses of an LCPV/T Solar Hybrid Plant for a Sports Center Building in Mexico. Energies 2020, 13, 5681. [Google Scholar] [CrossRef]
  27. Gaul, H.; Rabl, A. Incidence-Angle Modifier and Average Optical Efficiency of Parabolic Trough Collectors. J. Sol. Energy Eng. 1980, 102, 16–21. [Google Scholar] [CrossRef]
  28. Duffie, J.A.; Beckman, W.A. Solar Engineering and Thermal Processes, 8th ed.; Wiley: Hoboken, NJ, USA, 2013. [Google Scholar]
  29. Florschuetz, L.W. Extension of the Hottel-Whillier model to the analysis of combined photovoltaic/thermal flat plate collectors. Sol. Energy 1979, 22, 361–366. [Google Scholar] [CrossRef]
  30. Bernardo, L.R.; Perers, B.; Håkansson, H.; Karlsson, B. Performance evaluation of low concentrating photovoltaic/thermal systems: A case study from Sweden. Sol. Energy 2011, 85, 1499–1510. [Google Scholar] [CrossRef]
  31. Alklaibi, A.M.; Lior, N. Membrane-distillation desalination: Status and potential. Desalination 2005, 171, 111–131. [Google Scholar] [CrossRef]
  32. Phattaranawik, J.; Jiraratananon, R.; Fane, A.G. Effect of pore size distribution and air flux on mass transport in direct contact membrane distillation. J. Membr. Sci. 2003, 215, 75–85. [Google Scholar] [CrossRef]
  33. Zhang, J.; Li, J.D.; Duke, M.; Hoang, M.; Xie, Z.; Groth, A.; Tun, C.; Gray, S. Modelling of Vacuum Membrane Distillation. J. Membr. Sci. 2013, 434, 1–9. [Google Scholar] [CrossRef]
  34. University of Wisconsin Madison. TRNSYS 18; University of Wisconsin Madison: Madison, WI, USA, 2017. [Google Scholar]
  35. Sharqawy, M.H.; Lienhard, J.H.; Zubair, S.M. Thermophysical properties of seawater: A review of existing correlations and data. Desalin. Water Treat. 2010, 16, 354–380. [Google Scholar] [CrossRef]
  36. Nayar, K.G.; Sharqawy, M.H.; Banchik, L.D.; Lienhard, J.H. Thermophysical properties of seawater: A review and new correlations that include pressure dependence. Desalination 2016, 390, 1–24. [Google Scholar] [CrossRef]
  37. EnergyPlus. Weather Data by Location-Acapulco 768056 (IWEC). Available online: https://energyplus.net/weather-location/north_and_central_america_wmo_region_4/MEX/MEX_Acapulco.768056_IWEC (accessed on 20 February 2022).
  38. EnergyPlus. Weather Data by Location-Nadi 916800 (IWEC). Available online: https://energyplus.net/weather-location/southwest_pacific_wmo_region_5/FJI/FJI_Nadi.916800_IWEC (accessed on 20 February 2022).
  39. EnergyPlus. Weather Data by Location-Singapore 486980 (IWEC). Available online: https://energyplus.net/weather-location/southwest_pacific_wmo_region_5/SGP/SGP_Singapore.486980_IWEC (accessed on 20 February 2022).
  40. White Box Technologies. Weather Data for Energy Calculations (MX2015); White Box Technologies: Salt Lake City, UT, USA, 2015. [Google Scholar]
  41. Hudon, K. Solar Energy-Water Heating. In Future Energy: Improved, Sustainable and Clean Options for our Planet; Elsevier Inc.: Amsterdam, The Netherlands, 2013; pp. 433–451. [Google Scholar] [CrossRef]
  42. Al-Karaghouli, A.; Kazmerski, L.L. Energy consumption and water production cost of conventional and renewable-energy-powered desalination processes. Renew. Sustain. Energy Rev. 2013, 24, 343–356. [Google Scholar] [CrossRef]
  43. (CONAGUA), N.W.C. Tarifas de agua potable y saneamiento para uso doméstico tipo residencial. Available online: http://sina.conagua.gob.mx/sina/tema.php?tema=tarifas (accessed on 14 November 2021).
  44. McMaster-Carr. Sumersible Pumps for Chemicals; McMaster-Carr: Elmhurst, IL, USA, 2021. [Google Scholar]
  45. Alibaba. UF Hollow Fiber Ultrafiltration Membrane PVC Material Internal Pressure Ultrafiltration Membrane Module Manufacturer; Alibaba: Hangzhou, China; Available online: https://www.alibaba.com/product-detail/Ultrafiltration-Membrane-Best-Quality-4040-Hollow_60837650114.html (accessed on 23 November 2022).
  46. PlastiBox. Contenedor IBC 1000 Litros Nuevo. Available online: https://www.cajadeplastico.com/product-page/contenedor-ibc-1000-litros-nuevo (accessed on 14 December 2021).
  47. McMaster-Carr. Compact Constant-Flow-Rate Pumps for Water and Oil; McMaster-Carr: Elmhurst, IL, USA, 2021. [Google Scholar]
  48. McMaster-Carr. Oil-Free Electric Vacuum Pumps; McMaster-Carr: Elmhurst, IL, USA, 2021. [Google Scholar]
  49. McMaster-Carr. Insertion Temperature Switches; McMaster-Carr: Elmhurst, IL, USA, 2021. [Google Scholar]
  50. McMaster-Carr. Compact Screw-Plug Immersion Heaters for Water; McMaster-Carr: Elmhurst, IL, USA, 2021. [Google Scholar]
Figure 1. Diagram of CPVT module [21].
Energies 16 01541 g001
Figure 2. Schematic diagram of VMD module.
Energies 16 01541 g002
Figure 3. TRNSYS integrated simulation layout.
Energies 16 01541 g003
Figure 4. Effect of variation of CPVT surface area on system’s performance.
Energies 16 01541 g004
Figure 5. Effect of varying the set point temperature of brine at VMD module entrance.
Energies 16 01541 g005
Figure 6. Annual thermal, electrical and net electrical energy production of the CPVT-VMD system under different weather conditions.
Energies 16 01541 g006
Figure 7. Monthly specific permeate production.
Energies 16 01541 g007
Figure 8. Monthly SEC of CPVT-VMD system under different weather conditions.
Energies 16 01541 g008
Figure 9. Average daily solar radiation received.
Energies 16 01541 g009
Figure 10. Monthly solar fraction of CPVT-VMD system under different weather conditions.
Energies 16 01541 g010
Figure 11. Return of Investment analysis for CPVT-VMD system.
Energies 16 01541 g011
Figure 12. Specific permeate production cost for CPVT-VMD system.
Energies 16 01541 g012
Table 1. Inputs for CPVT model in the TRNSYS simulation [26].
ParameterValue
Optical efficiency, η 0 A 0.601
Concentration ratio14.8
Internal heat transfer coefficient, U H T F 3838 W/m2K
Heat loss coefficient, U L 2.77 W/m2K
Temperature coefficient, K T 0.33 %/K
Aperture area of 1 unit, A a 3.25 m2
Heating tank volume, V H T 0.25 m3
Table 2. Mass transfer mechanisms in membrane pore.
Kn < 0.01 0.01 < Kn < 1 Kn > 1
Poiseuille flowPoiseuille flow–Knudsen diffusion transition mechanismKnudsen diffusion
Table 3. Values implemented in VMD modeling.
DescriptionValue
Pore radius, r0.141575 µm
Membrane porosity, ε 0.701
Membrane thickness, b0.1177 mm
Pore tortuosity, τ 2.14
H 2 O molar mass, M18 g/mol
Dynamic viscosity, η 9.096 µPa s
Vacuum pressure, P v a c u u m 8200 Pa
Table 4. Average daily weather conditions of selected cities.
City (Köppen Classification)DNI (Summer) (kWh/m2)DNI (Winter) (kWh/m2)Temperature (Annual) (°C)Wind Velocity (Annual) (m/s)
Acapulco, MX (Aw)5.574.6227.82.05
La Paz, MX (BWh)5.983.3925.32.68
Nadi, FJ (Am)6.044.4925.22.81
Singapore, SG (Af)4.654.5427.52.18
Disclaimer/Publisher’s Note: The statements, opinions and data contained in all publications are solely those of the individual author(s) and contributor(s) and not of MDPI and/or the editor(s). MDPI and/or the editor(s) disclaim responsibility for any injury to people or property resulting from any ideas, methods, instructions or products referred to in the content.

