Article

Energy Performance, Environmental Impacts and Costs of a Drying System: Life Cycle Analysis of Conventional and Heat Recovery Scenarios

by
Dario Giuseppe Urbano
1,
Andrea Aquino
1 and
Flavio Scrucca
2,*
1
Department of Mechanical and Industrial Engineering, University of Brescia, 25123 Brescia, Italy
2
Department of Sustainability, Circular Economy Section, Italian National Agency for New Technologies Energy and Sustainable Economic Development (ENEA), 00059 Rome, Italy
*
Author to whom correspondence should be addressed.
Energies 2023, 16(3), 1523; https://doi.org/10.3390/en16031523
Submission received: 20 December 2022 / Revised: 20 January 2023 / Accepted: 27 January 2023 / Published: 3 February 2023
(This article belongs to the Special Issue Advanced Data Modeling for Sustainable Energy Systems)

Abstract

:
High energy consumption is one of the main problems of drying, a critical process for many industrial sectors. The optimization of drying energy use results in significant energy saving and has become a topic of interest in recent decades. We investigate benefits of heat recovery in a convective drying system by comparing two different scenarios. The Baseline Scenario is a conventional industrial dryer, and Scenario 1 includes the preheating of drying air by exhausts from the drying chamber. We show that the energy efficiency of the drying cycle is strictly related to the properties of the dried material and operative conditions, and performance improves significantly (by 59% to 87%) when installing a heat recovery unit (Scenario 1). Additionally, the temperature of drying air affects performance. We assess both scenarios by LCA analysis, measuring the environmental impacts and externalities of four different fuels (natural gas, light fuel oil, biomethane, and hardwood chips). Our findings indicate that heat recovery reduces environmental impacts, both when fossil and renewable fuels feed the system, but unexpected impact arises for some categories when renewable fuels are used.

1. Introduction

Thermal drying is essential for processing chemicals, pharmaceuticals, and agricultural products [1]. The process evaporates the moisture of a wet product by thermal energy, and we can distinguish three main drying setups according to the dominant energy transfer mechanism: conductive (contact or indirect dryers), convective (direct dryers), and radiative (radiation dryers) [2,3].
Our study focuses on convective drying operated as a continuous process on a horizontal fluidized bed. The heat transfer fluid of convective dryers can be hot air (most common), inert gas, direct combustion gases, or super-heated steam [4]. These systems are widespread in the industry since they guarantee an extended contact surface between the hot fluid and wet product, resulting in higher drying rates and more uniform temperature distribution during the process [5] compared to conductive and radiative types. However, convective drying is very energy-demanding: some studies estimated that drying processes accounted for at least 7–15% of the industry’s overall energy consumption in some regions [6], and the fuel supply is the main cost of a drying system. To reduce the energy use of drying systems, many authors studied strategies to enhance the heat and mass transfer process into the drying chamber (e.g., flow pulsation [7], acoustic [8], particle mixing [9], mechanical vibration [10]) or install heat recovery units that preheat the inflow air by exhausts from the drying chamber.
The energy efficiency of a drying system is a crucial but only a partial requisite for its sustainability since the latter requires a holistic approach. For instance, previous literature studies compared different types of dryers to assess their potential Green Houses Gases (GHGs) emissions during the drying process [11], including techno-economic and environmental aspects to evaluate the pros and cons associated with their use [12]. As a wide-ranging approach, life cycle evaluations, which allows complete and consistent impact quantification, can be considered particularly strategic to evaluate the performance of drying processes. In this regard, in particular, Haque et al. [13] identified LCA (life cycle assessment) as one of the key tools to be used by drying practitioners and R&D personnel on a regular basis, and some case studies are available in the literature. Kumar et al. [14] applied the LCA methodology to two systems (a heat pump dryer and a microwave vacuum dryer) for tomato drying. They showed that the dryer performance should be evaluated not only on the characteristic parameters (such as drying time, final moisture content, and final product aesthetics) but also on energy efficiency and environmental impacts from the sustainability point of view.
In the existing literature, some other authors carried out their studies in line with this finding. Ciesielski and Zbicinski [15] used LCA to compare two spray dryers, one at laboratory scale and one at industrial scale, and found that both units generated the greatest environmental impact during the use phase of the life cycle. De Marco et al. [16] used LCA to evaluate the environmental impacts of the industrial phases of apple powder production, which includes a drum drying process that was found to be the one that mainly affects all of the studied impact categories (essentially due to the high quantity of water that has to be removed). Prosapio et al. [17], instead, carried out a LCA to optimize the production of strawberries by freeze-drying, comparing a traditional drying process and a freeze drying combined with osmotic dehydration on industrial scale. They showed that the processing steps represent the main contributors to the impacts, while the other steps (agricultural, packaging, and end of life) only have marginal effects and, moreover, that the traditional process generated higher emissions in terms of all of the studied environmental categories. Van Oirschot et al. [18] evaluated the system design of seaweed cultivation and drying using LCA and found that the drying step, performed in an industrial furnace using light fuel oil, had the highest contribution to the environmental impacts. Léonard and Gerbinet [19] applied LCA to assess the environmental impacts associated with a drying operation, focusing their analysis on the main process parameters influencing them so as to highlight some potential eco-design strategies for dryers. Romdhana et al. [20], instead, developed a general eco-design model of biomass drying (focused only on carbon footprint) with the idea of developing an assessment computer-aided process engineering tool to compare environmental impacts of different operating conditions and fuel types. All of this literature puts emphasis on the importance of using life cycle evaluations to assess drying processes and, in this regard, also the particular relevance of this approach has to be kept in mind in the design of products. Formalizing the entire product life cycle scenarios during the design phase helps designers to focus on hotspots [21] and their optimization, and this applies also to industrial systems/products, such as dryers or similar equipment.
This paper couples the energy Life Cicle Assessment (LCA) and Life Cycle Costing (LCC) analyses of two fluidized bed drying systems. For each one of them, we considered both fossil (natural gas and light fuel oil) and renewable (biomethane and hardwood chips) fuels to supply the drying system. Life Cycle Assessment (LCA) and environmental Life Cycle Costing (eLCC) methodologies estimate the system’s life cycle environmental and economic performance. The final goal is to introduce Life Cycle Thinking (LCT) in the contest of drying systems and propose a different approach to support the process of dryer design/selection from a sustainable point of view.

2. Materials and Methods

We compare the energy use, environmental impact, and environmental costs of two convective drying systems: the Baseline Scenario and heat recovery scenario (i.e., Scenario 1). We modeled the drying process using the two-phase Euler–Euler model presented in [22], which calculates the thermodynamic state of the air and product along the drying cycle.

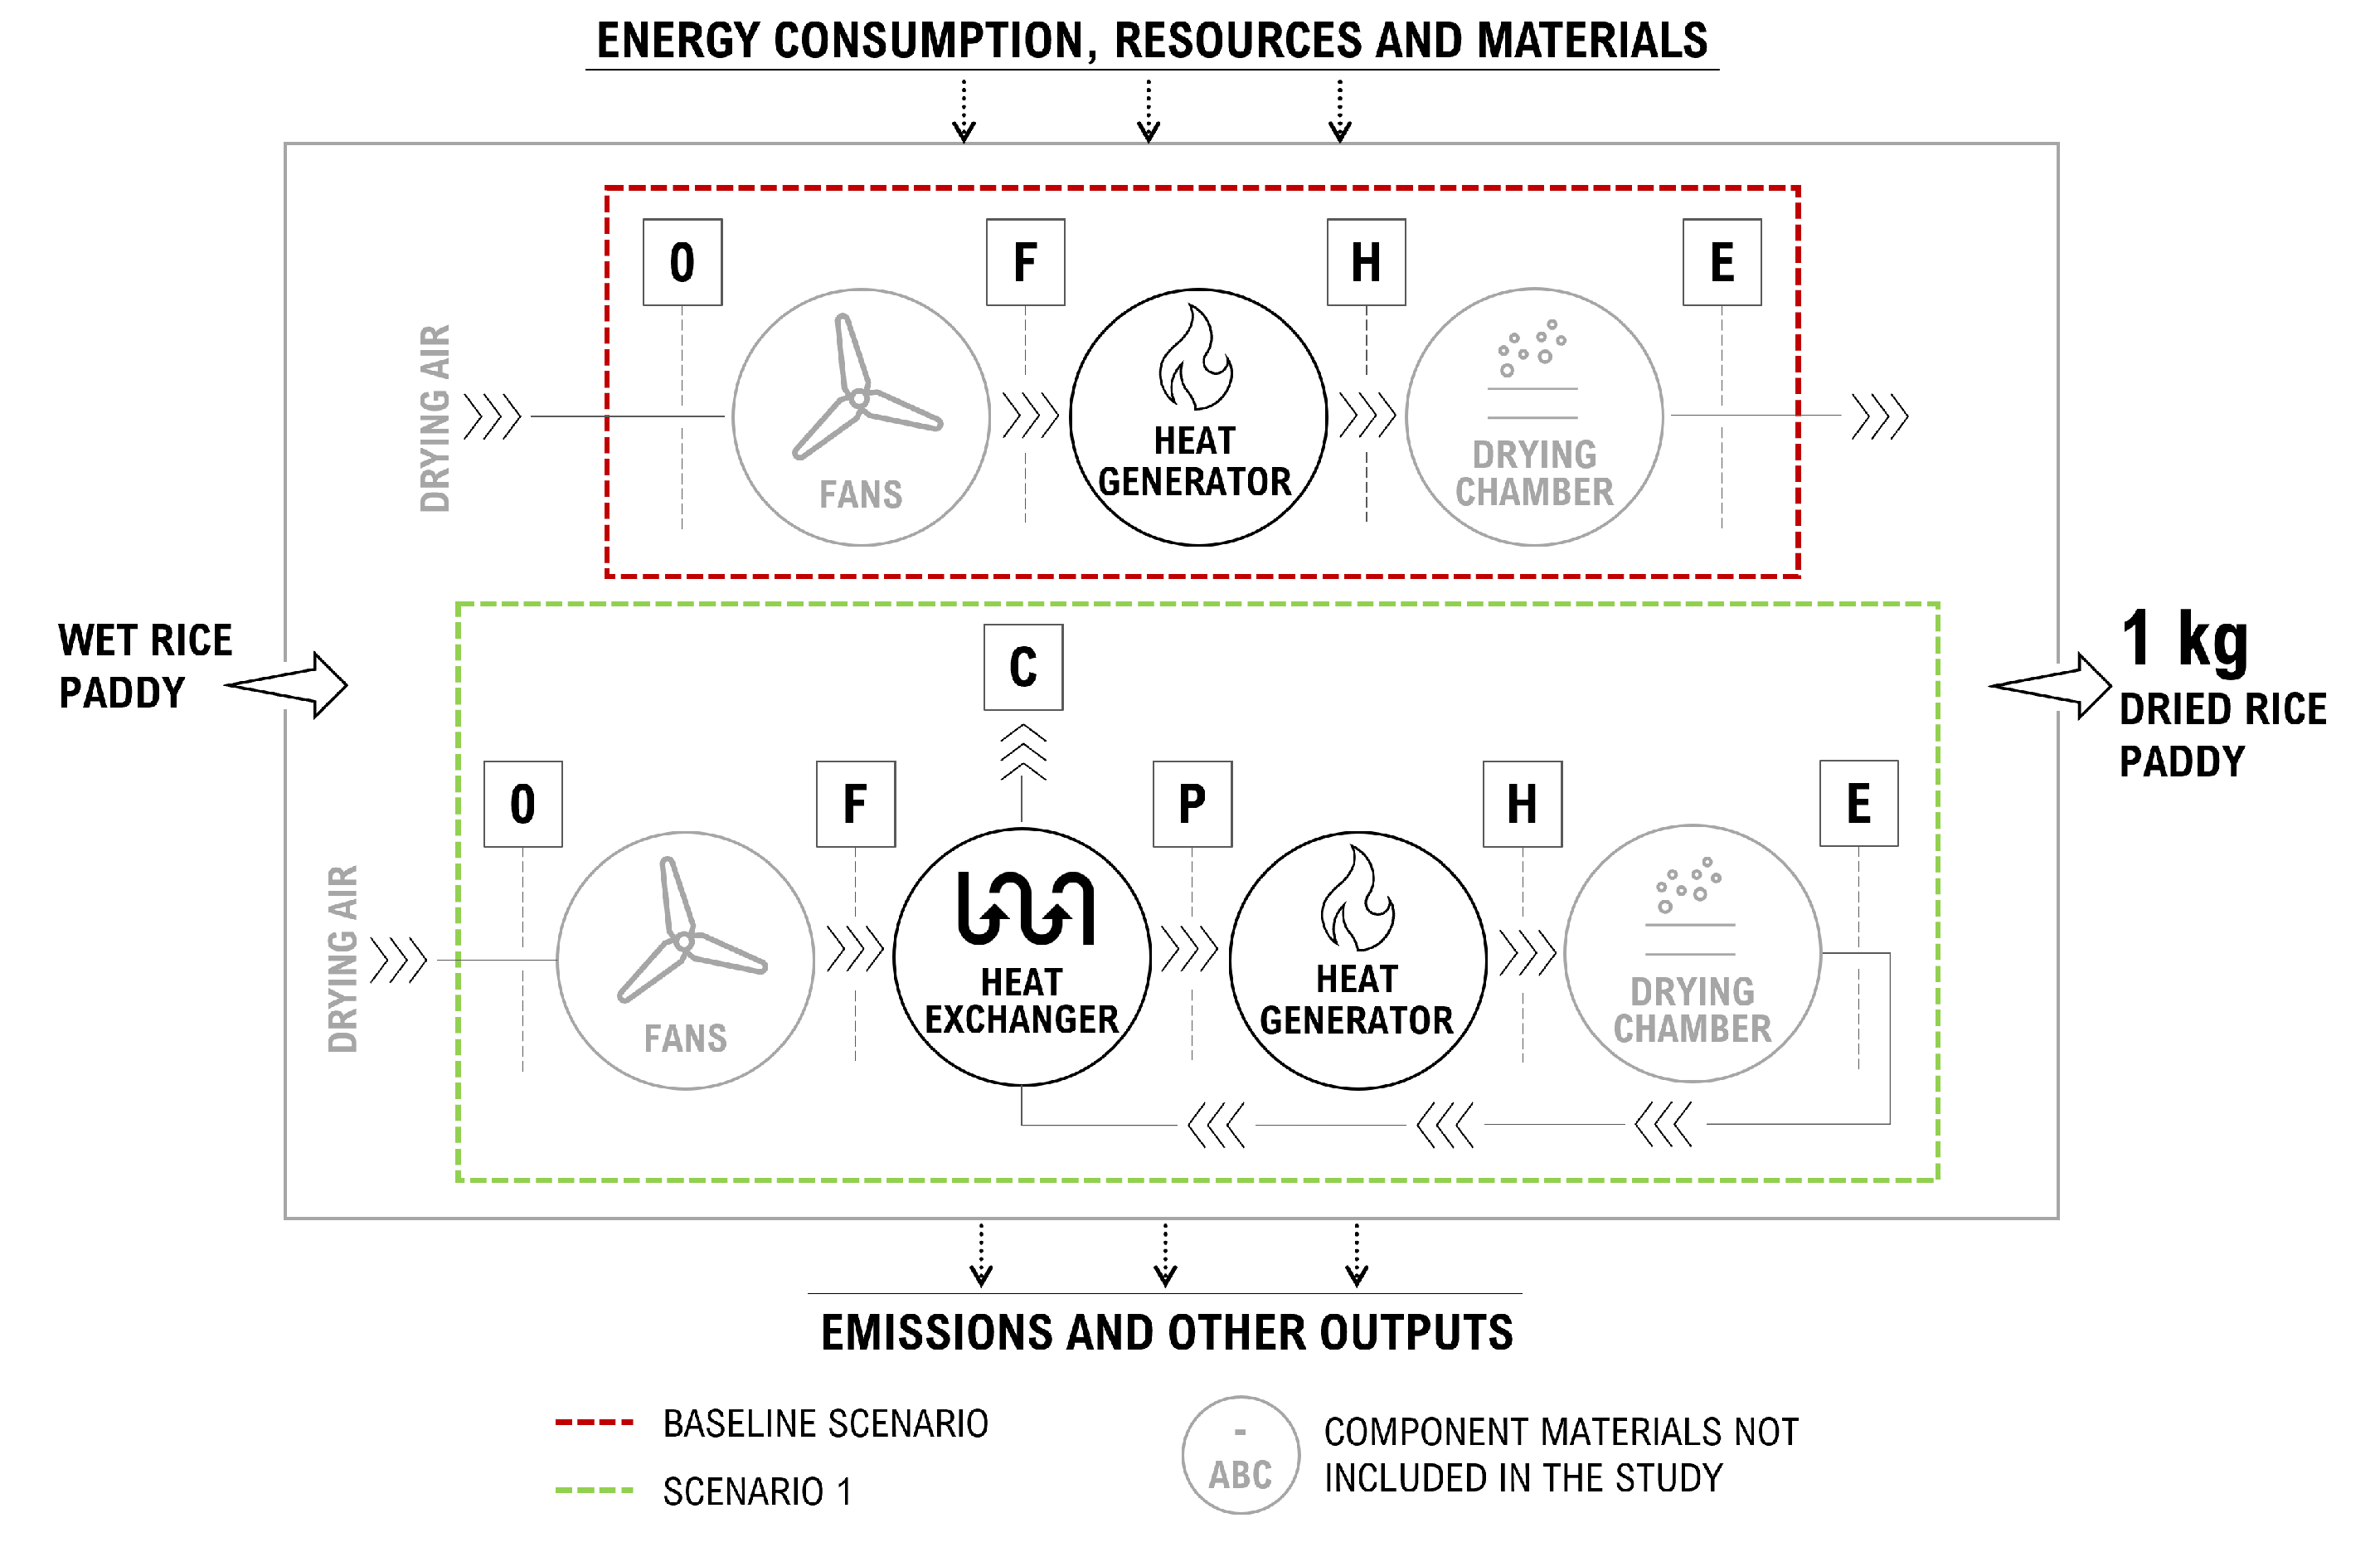
2.1. The Drying Cycles

The Baseline Scenario reproduces the industrial dryer presented in [23]. This system includes three centrifugal fans with a combined maximum capacity of 15 kW, a furnace, and a fluidized bed drying chamber. The latter presents a horizontal setup, i.e., the wet product moves on a conveyor belt while it is crossed by the drying air. The bed’s dimensions are 4.85 m in length and 0.97 m in width, and its thickness is assumed to be 0.1 m according to the majority of experimental observations [23,24].
We calculated the amount of evaporated moisture using the Page model [25] that includes the effects of the product nature on heat and mass exchange by two empirical constants. The values of these constants for rice paddies derive from experimental-based correlations in [23], and we took the thermophysical properties of rice from [26,27]. We neglected the heat losses from the wall of the chamber and calculated the pressure losses of the airflow across the bed using the Ergun equation [28].
In the Baseline Scenario (the red frame in Figure 1), a fan blows the fresh air into the combustion chamber; this chamber heats the air to a set temperature ( T H ). Next, the hot air enters the drying chamber and crosses the bed, and the drying process occurs as a cross-flow heat and mass transfer. Finally, the exhausts from the drying chamber are released into the atmosphere. Scenario 1 (the green frame in Figure 1) upgrades the baseline system by reducing its energy demand and mitigating the environmental impact due to the wasted heat (one of the first causes of global warming according to [29]). In particular, we install a heat recovery unit after the drying chamber to recover the waste heat from the drying exhausts and preheat the outside air before the combustion chamber. This component is an air–air cross-flow heat exchanger consisting of banks of aluminum tubes with an inner diameter of 7.55 × 10 3 m and a shell diameter of 2 × 10 3 m. The distance between two nearby tubes is 1.25 times the diameter, and the tube length is 3 m. We size the heat exchanger to produce a Δ T = 10 K between two fluids. Such a value is coherent with works specifically focused on heat recovery in drying systems [30,31,32].
We assume the operating conditions of both scenarios to be the same as those presented in [23]: the initial air temperature and absolute humidity are T 0 = 300 K and ω 0 = 0.011 , the target temperature of the combustion chamber is T H = 363 K, and the mass flow rate of the air is m ˙ a = 10.98 kg/s. The dried product is rice, processed at an operative mass flow rate of m ˙ s = 2.36 kg/s and an initial moisture content on a dry basis u 0 = 0.3 . The drying efficiency of both scenarios reads:
η = q e v E t h
where E t h is the thermal energy needed by the combustion chamber to heat the drying air at T H , and q e v is the heat fraction effectively employed by the evaporation process calculated as in [22].

2.2. Life Cycle Assessment and Life Cycle Costing

LCA evaluates the potential environmental impacts of products or services along their whole life cycle and provides a qualitative, quantitative, confirmable, and manageable environmental performance of production processes or products. As regulation standards, see the ISO 14040 [33] and 14044 [34] and ILCD Handbook guidelines [35]. The standard stages of an LCA study are:
  • Goal and scope definition, i.e., the phase during which the LCA study’s objective and the main parameters, such as functional unit, system boundaries, and data quality, are defined.
  • Life Cycle Inventory (LCI), i.e., the phase during which an inventory of all input/output flows concerning the analyzed system is carried out.
  • Life Cycle Impact Assessment (LCIA), i.e., the phase that aims at evaluating the significance of potential environmental impacts of the investigated product/process/service using the LCI results.
  • Interpretation of results, i.e., the phase during which the LCI analysis and the LCIA are jointly considered to deliver results consistent with the defined goal and scope, reach conclusions, explain limitations and provide recommendations.
Our LCA study analyzes the environmental impacts of eight different scenarios: the Baseline Scenario and Scenario 1, each supplied by fossil (natural gas and light fuel oil) and renewable (biomethane and hardwood chips) fuels to meet their heat demand. The system boundaries set for the life cycle evaluations are in Figure 1. The functional unit (FU) chosen for the assessment is 1 kg of dried material. Data resulting from energy modeling were used as primary inventory data for the use phase of the analyzed system, as well as to model the production of the components of the heat exchange unit in Scenario 1, coupled with the background dataset of the Ecoinvent v3.8—[36] included in the SimaPro v9.3 software [37].
Specific datasets for 1 MJ heat from the different fuels and for 1 kWh medium voltage electricity from the Italian grid were selected from Ecoinvent (cut-off allocation), as detailed in the Supplementary Materials. Regarding heat, all of the selected datasets refer to small-scale generation (50–100 kW) and to specific fuel characteristics, as well as to particular technologies/locations (generally representative of activities at the European level).
The lifetime of the system was assumed to be equal to 10 years. The EF 3.0 method [38], which is the impact assessment method of the Environmental Footprint initiative of the European Commission [39], was selected for the impact assessment.
Life Cycle Costing (LCC) estimates the cost of the system under investigation during its whole life cycle, focusing on all consumed resources. These latter are quantified as costs [40], including current costs for investment, operation and maintenance, replacement and final disposal [41]. We carried out an eLCC, i.e., an analysis that considers the external costs of environmental impacts (commonly known as “externalities” or “environmental costs”) [42] that arise from climate change and other changes in air/water/soil quality, inducing impacts on human health, the developed environment, and ecosystems [43]. The eLCC was carried out consistently with the LCA analysis following a steady-state modeling approach, which lacks any temporal specification, assuming all technologies will remain constant in time. The Environmental Priority Strategies (EPS) method, version 2015dx [44], was applied to calculate the externalities, thus investigating those impacts from emissions and use of resources that cause significant changes in any of the following safeguard subjects (or areas of protection): ecosystem services, access to water, biodiversity, building technology, human health, and abiotic resources. The results of the impact assessment are monetary values of environmental impacts, indicated as damage costs and expressed as ELU (Environmental Load Units), 1 ELU being the externality corresponding to 1 Euro that an average OECD inhabitant, having the impacts on her/himself, is willing to pay to avoid environmental damage.

3. Results and Discussion

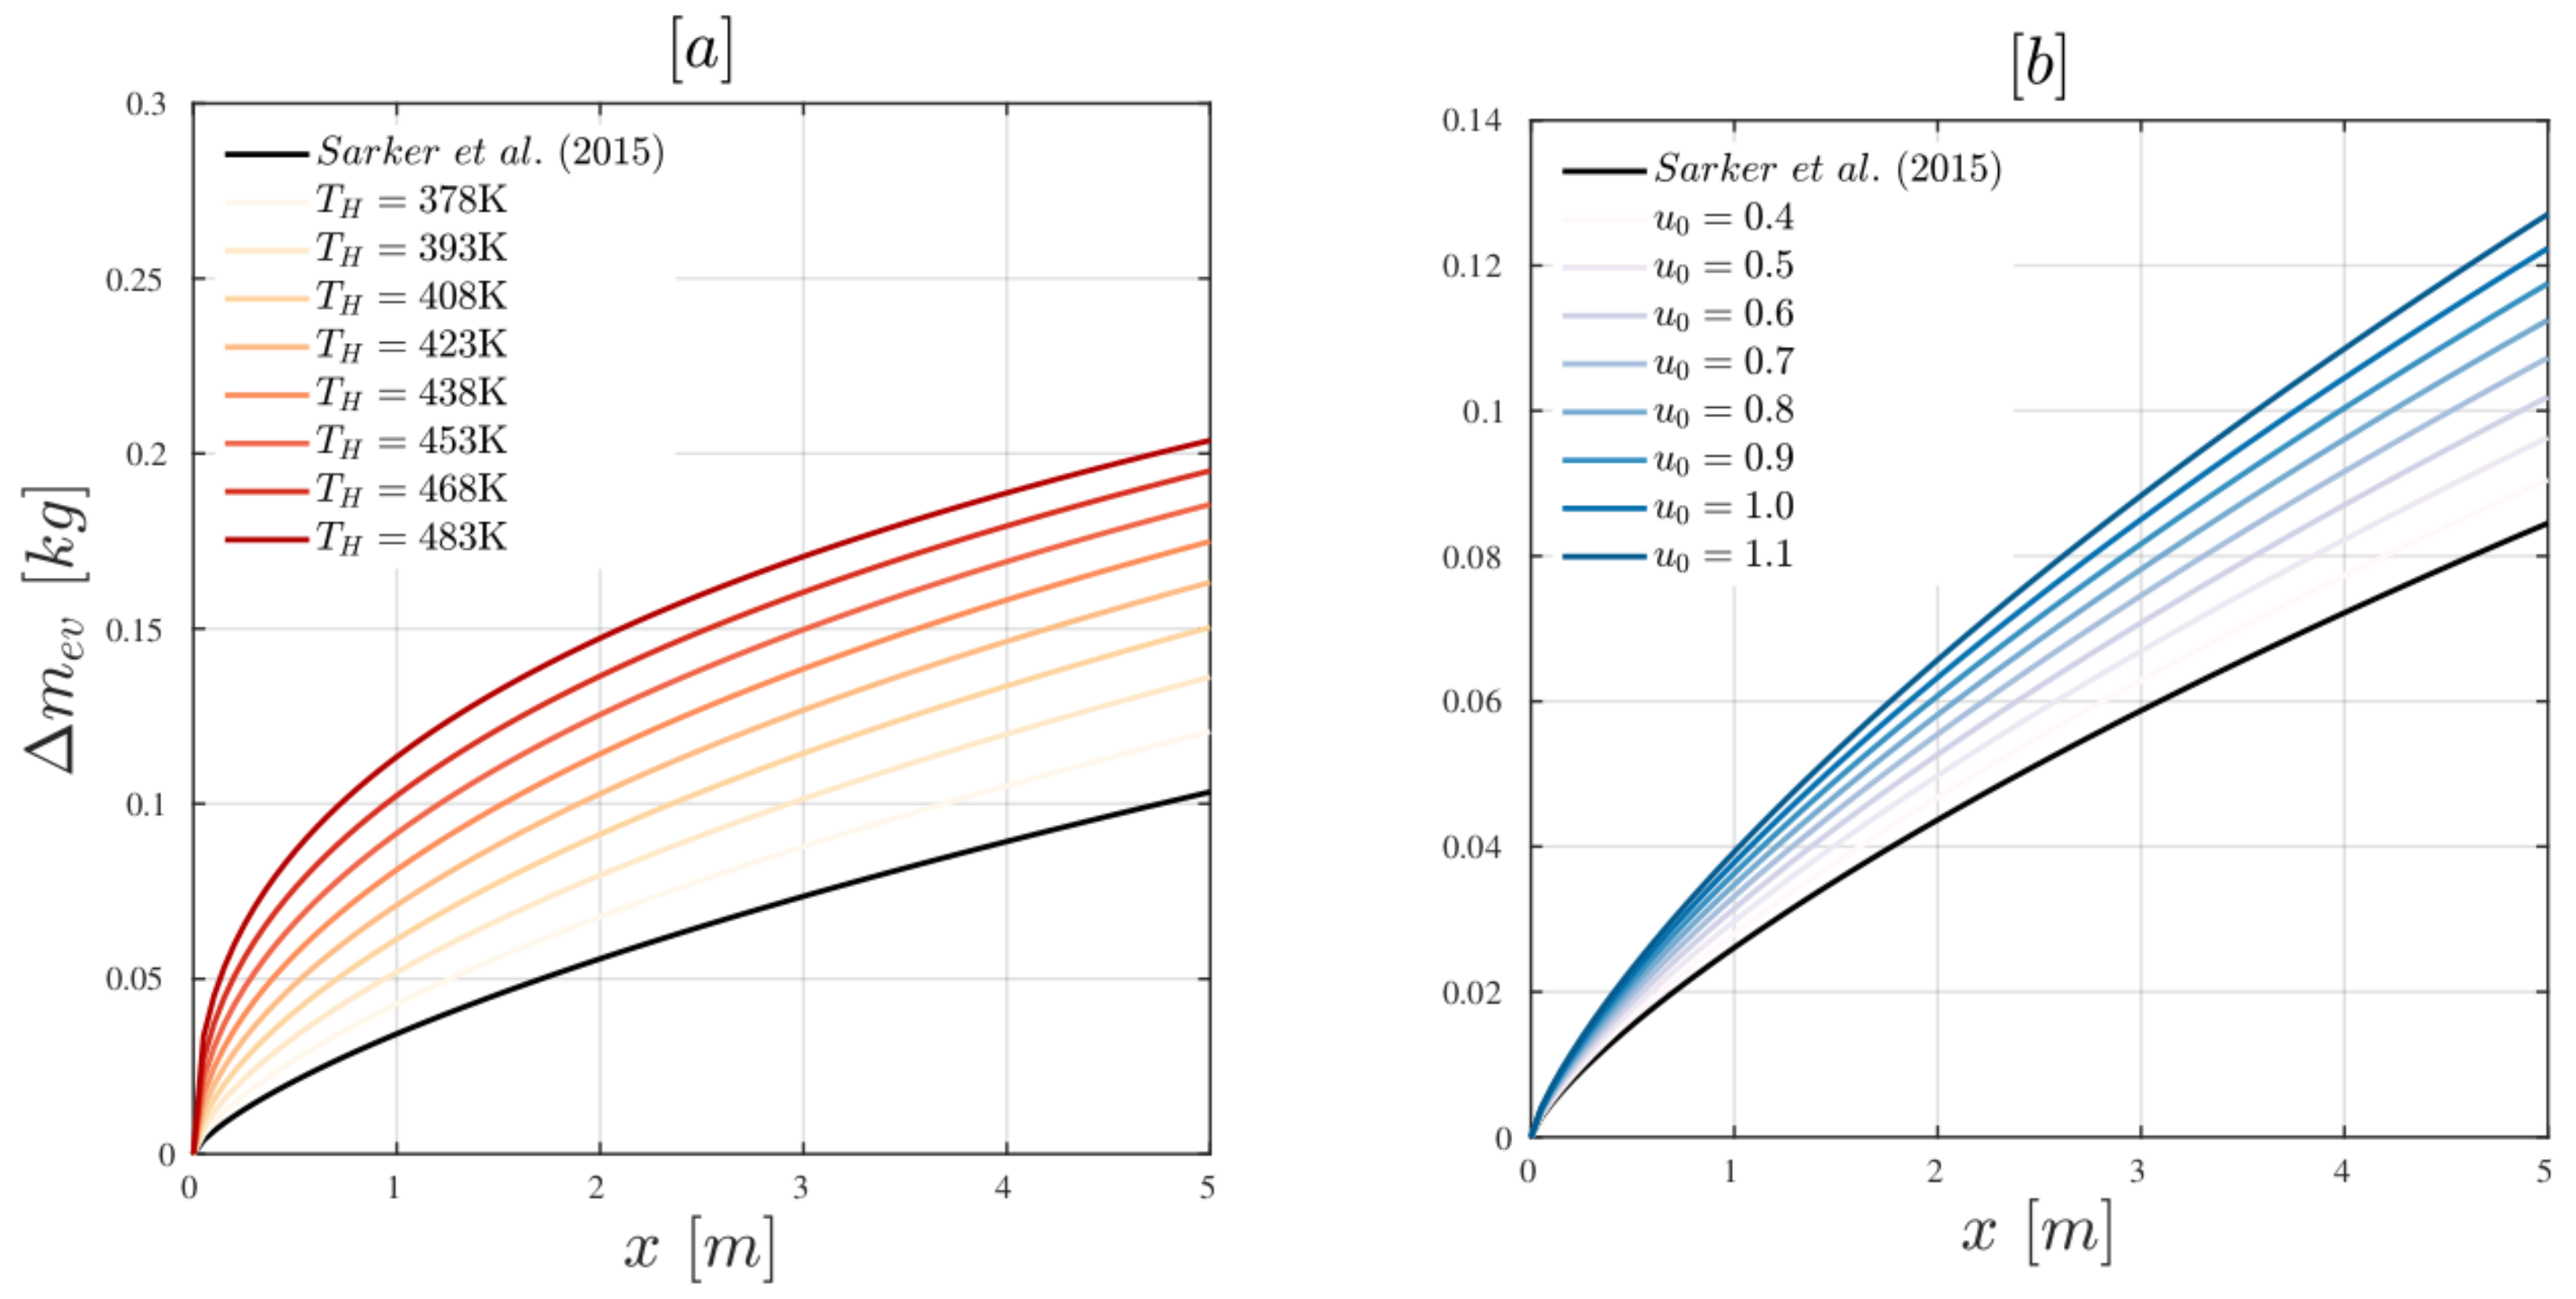
3.1. Energy Analysis

We simulated the drying process at different air temperatures T H and initial moisture contents of the product u 0 , calculating the total moisture evaporated along the bed (Figure 2a,b), to study how these operating conditions affect the drying performance and energy use.
In all simulations, the evaporation rate (i.e., curves’ slope) was at maximum at the beginning of the process. Then, it slowed down since the product’s water activity reduces, and the humidity of air tends to an equilibrium level [45,46]. A hotter airflow enhances the evaporation rate: we simulated different processes augmenting the air temperature by a constant value ( 15 K), and the total evaporated water increased on average by 9 % between each step. However, the benefits of increasing the air temperature are bounded: when T H = 363 K 378 K, the final m e v increased by 16.5 % while there was a minimum of 4.1 % when T H = 468 K 483 K. When the air temperature increases, the system evaporates a moisture layer, which is more challenging to subtract. The latter is within the deeper porous network of the material, resulting in a higher heat and mass transfer resistance, and presents a stronger bond with the solid matrix (i.e., the heat of evaporation increases) [47,48].
The initial product moisture also has a critical effect on the evaporation rate. We increased u 0 by a constant interval keeping T H = 363 K, and the total evaporated moisture augmented on average by 5.32 % between each step. A more humid product presents a lower resistance to the evaporation, and the difference between absolute air humidity and solid moisture content increases evaporating more water. However, the effects of the initial product moisture on the evaporation rate gradually reduces: when u 0 = 0.3 0.4 , the final m e v increased by 7.14 % against a minimum of 3.85 % when u 0 = 1 increased to 1.1 .
Since the product’s air temperature and moisture content affect the evaporation rate, both parameters have critical implications on energy performance. First, we modeled the drying process according to the operating conditions presented in Section 2.1, obtaining a drying efficiency of about 19%. Then, we compared this value to the performance obtained by varying the air temperature and initial product moisture (Figure 3). A hotter T H increases the evaporation rate and q e v , but reduces the energy efficiency of the process since it needs a higher energy input ( E t h ). On the contrary, the efficiency increases with a higher initial moisture content of the wet product, since this results in a higher evaporation rate without affecting the energy supplied to the system ( E t h ).
We sized the heat recovery unit according to the design criteria in Section 2.1 with a heat exchange surface of 530 m 2 . This unit boosts the drying efficiency since the electrical need increases by about ten times for additional pressure losses of the heat exchanger. However, the thermal energy use per amount of evaporated moisture decreases by 30%, resulting in a final drying efficiency of about 24% (Figure 4). Exhausts preheat the drying air, and the heat (i.e., fuel) demand decreases, resulting in higher drying efficiency. We also calculated the drying efficiency at different T H , enlarging the heat exchange surface to 680 m 2 and 940 m 2 . Results show that the drying efficiency augments to 25% and 26–28%. A higher T H results in hotter exhausts, and therefore the fraction of recovered heat augments; such an effect increases by enlarging the heat exchange area ( A H E 1 ).

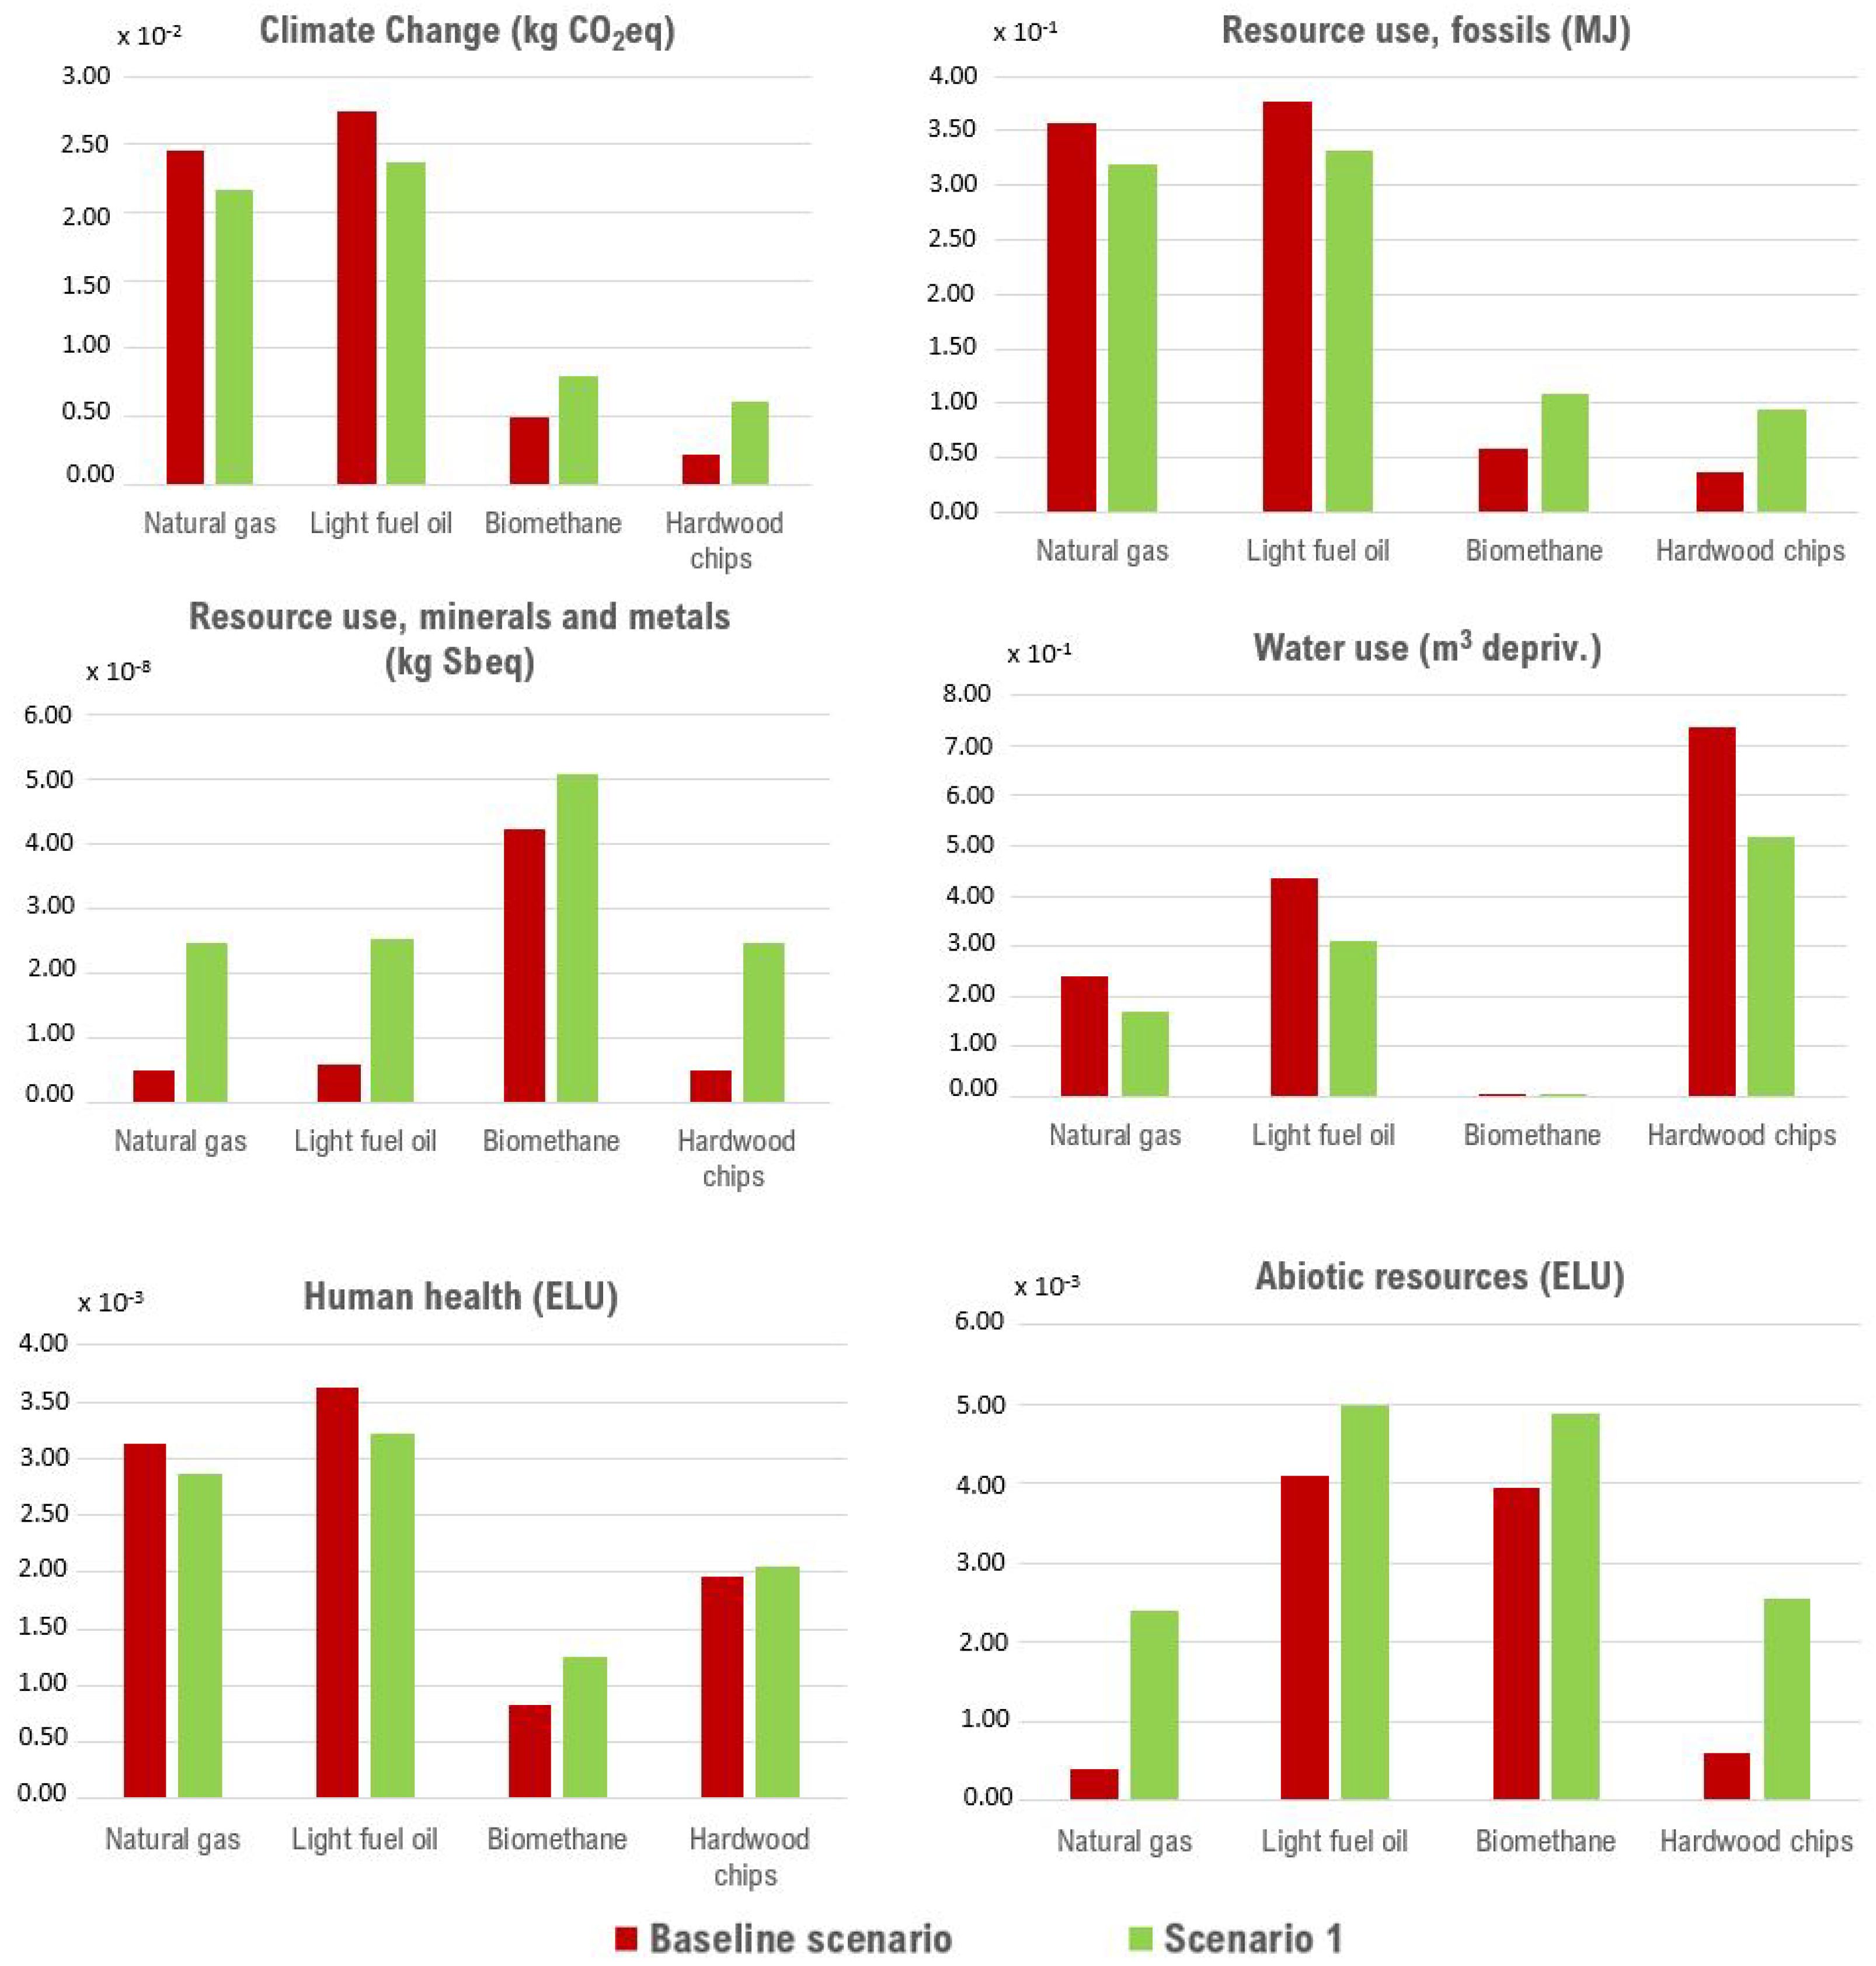
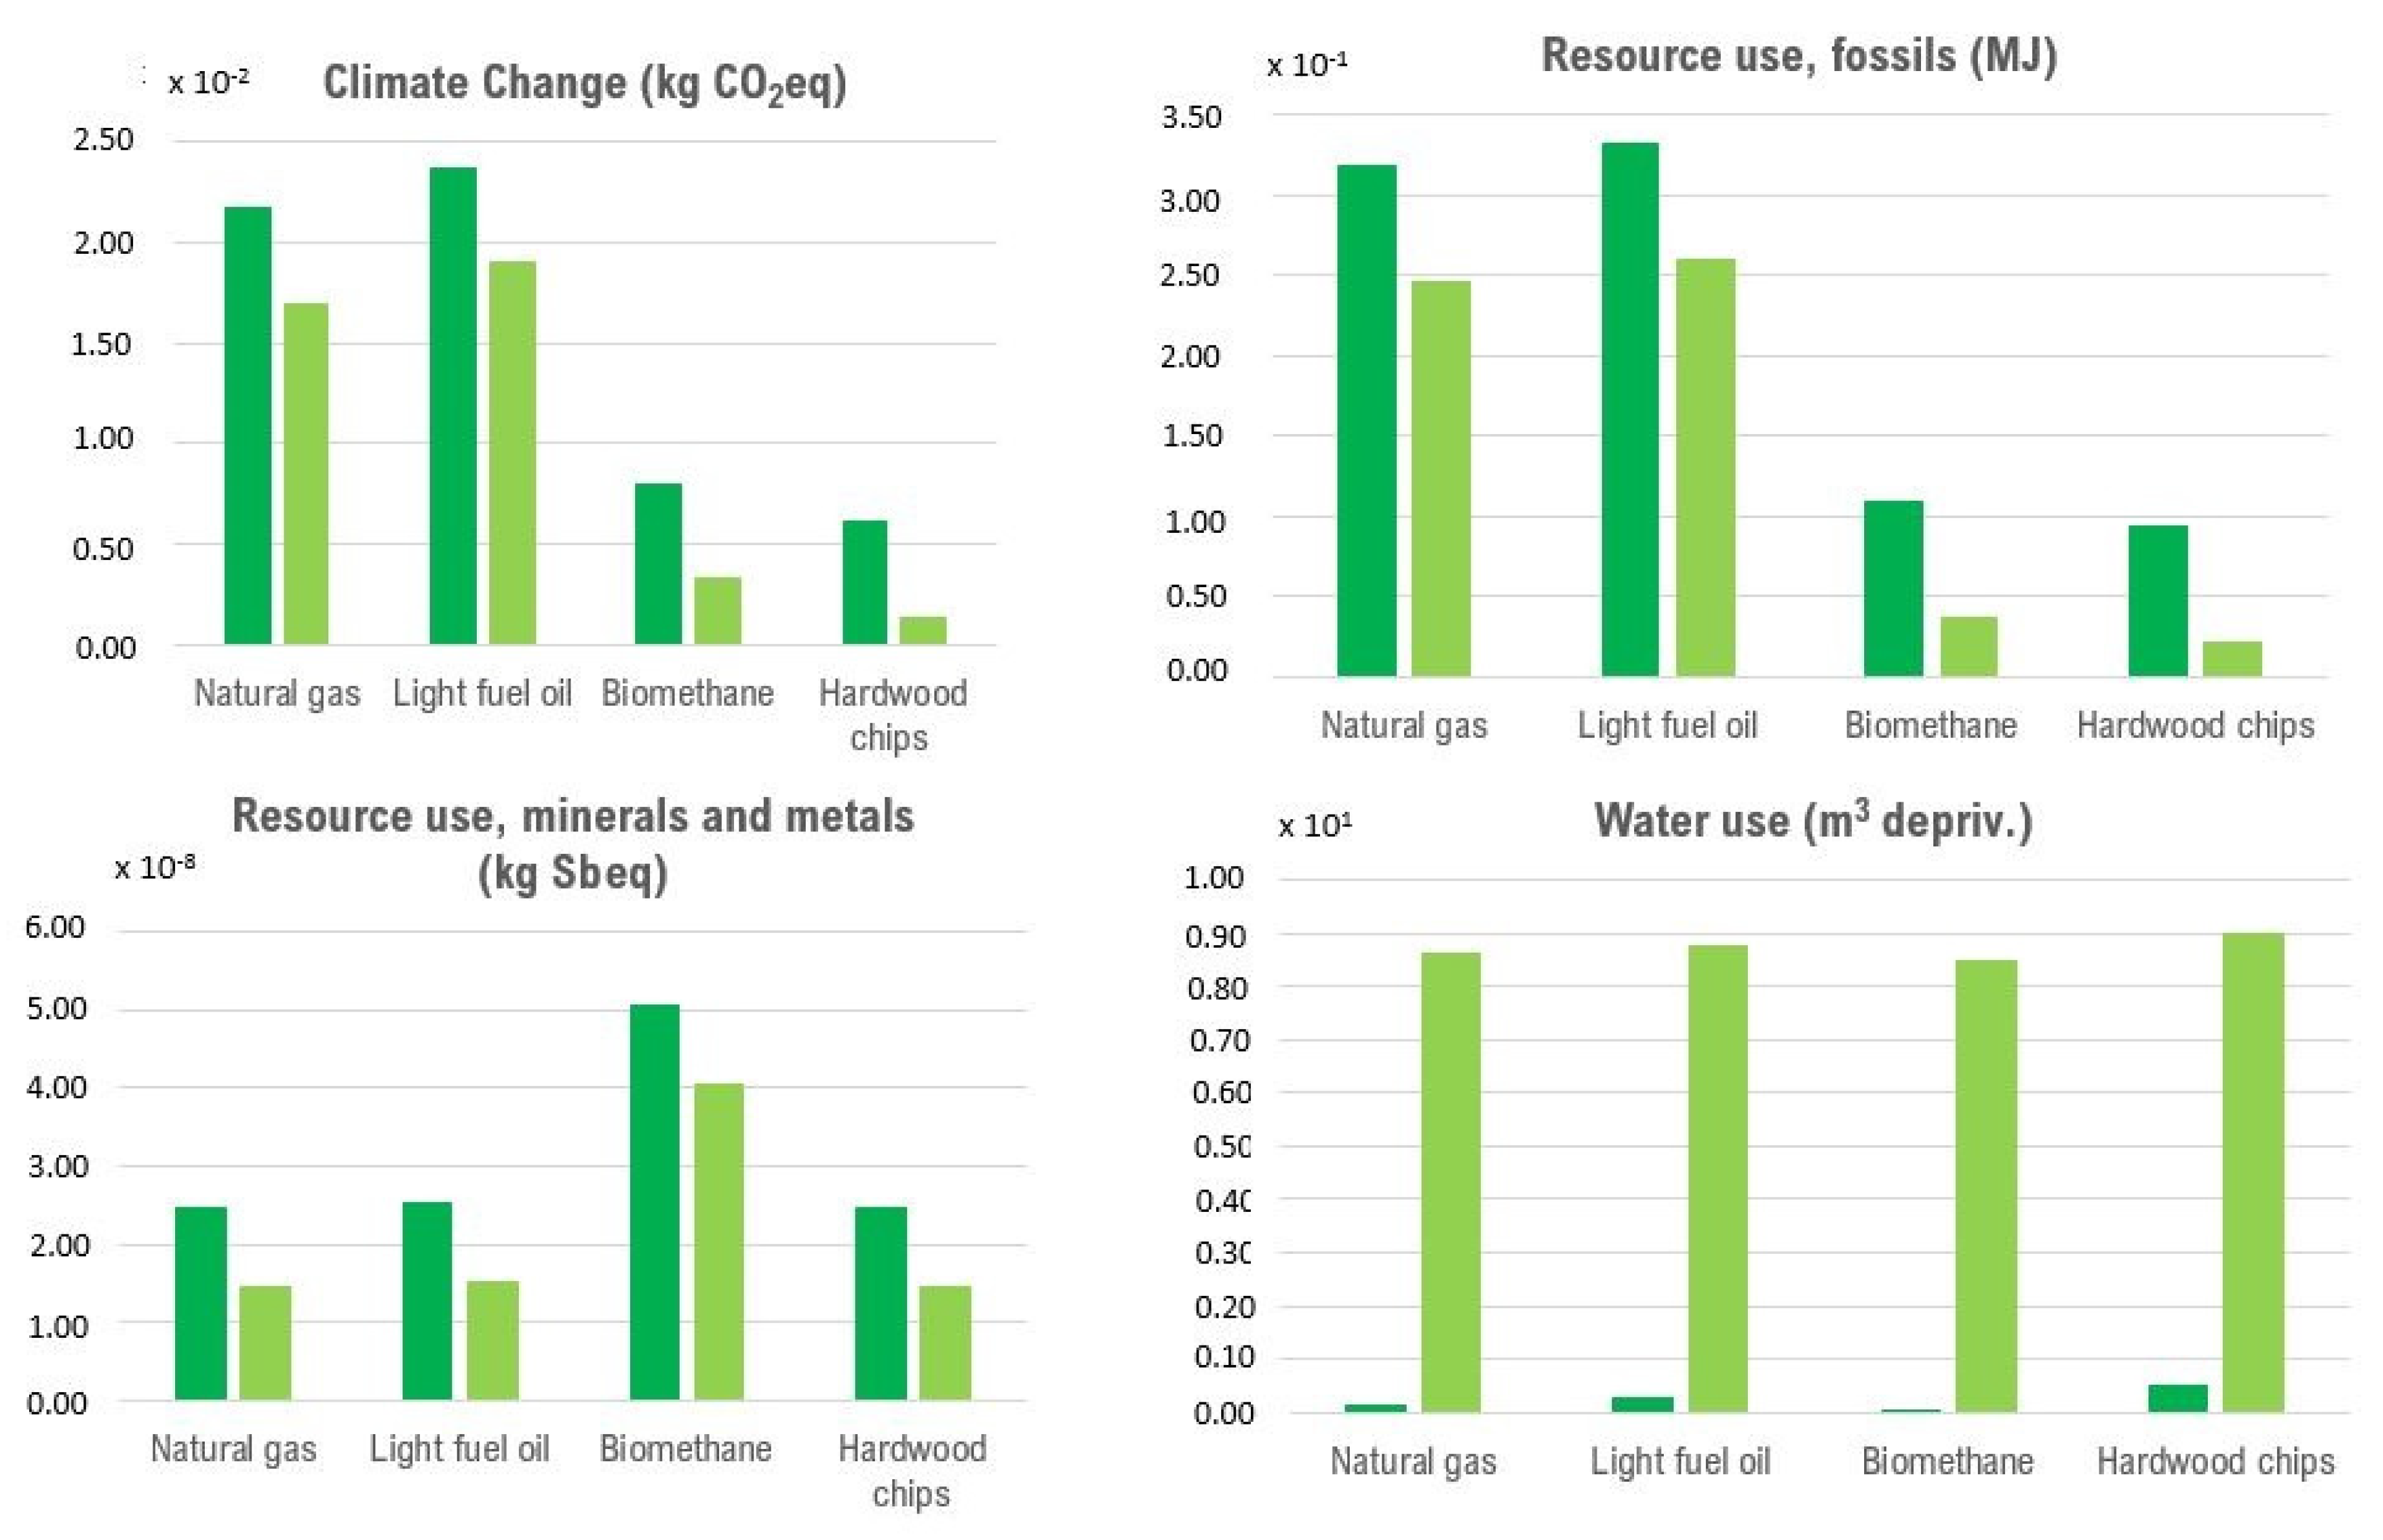
3.2. Life Cycle Analyses Results

We compared the impact categories of Baseline and Scenario 1, simulating both systems at the operating conditions presented in Section 2.1. Results of the LCA analysis, based on the use of primary activity data coupled with the background dataset of the Ecoinvent database and focused on a selection of impact categories of the EF 3.0 method, are summarized in Figure 5. More detailed results are available in the Supplementary Materials. As was reasonably expected, due to the addition of the heat exchanger to the drying cycle, in Scenario 1, an increased impact is evident regarding the use of material resources for all of the considered fuels. On the other hand, impacts on the use of other resources (e.g., fossil resources and water) are, in general, reduced in this scenario.
Concerning the shift to renewable fuels to meet the energy demand of the system, it is worth noting that biomethane is the one that performs better compared to fossil fuels, both in the Baseline Scenario and Scenario 1. The use of biomethane, in fact, is characterized by a reduction in most of the impact categories compared to light fuel oil (the only impacts that increase are those regarding human toxicity, cancer, eutrophication, freshwater, and land use) and natural gas (an impact increase is also observed in particulate matter, human toxicity, non-cancer, ecotoxicity, freshwater and resource use, minerals, and metals). On the other hand, the use of hardwood chips generates an increase in all of the impact categories compared to fossil fuels, except for climate change, ozone depletion, eutrophication, freshwater, resource use, fossils (and resource use, minerals, and metals only compared to light fuel oil).
Focusing on the effects of the heat recovery system (i.e., Baseline vs. Scenario 1), the use of natural gas is characterized by an increase in all the impact categories, except for climate change, ozone depletion, water use and resource use, fossils, while the use of light fuel oil shows a reduction in all these impact categories and in two additional ones, i.e., photochemical ozone formation and particulate matter. The increase in the mentioned impact categories that occurred for the renewable fuels shifting to Scenario 1 is essentially the consequence of the increase in the electricity consumption related to heat exchanger operation, which increases by about an order of magnitude compared to a heat consumption reduced by about 30%. Given this picture, since the use of heat from renewable fuels is much less impacting than the use of electricity from the grid, the overall impact associated with the use of this fuels is increased in Scenario 1. On the other hand, this trend is not observed for fossil fuels, the use of which to generate heat has a greater impact compared to the use of electricity for heat exchanger operation.
The use of hardwood chips shows an intermediate situation, with an increase in 7 categories out of the 16 considered (climate change, ozone depletion, ionising radiation, acidification, eutrophication, freshwater, resource use, fossils and resource use, minerals, and metals), while the use of biomethane is characterized by an increase in all the impact categories. Comparing Scenario 1 using renewable fuels with the Baseline Scenario using fossil ones, biomethane still represents the best performing solution (in particular in comparison with light fuel oil), while the use of hardwood chips shows an increase in most of the impact categories (both compared to natural gas and light fuel oil) again.
As it is possible to observe in Figure 5, the increase in the impact categories occurred shifting to Scenario 1 are different for the renewable fuels considered. This has to be intended as a direct consequence of the characteristics of each specific fuel and the specific Ecoinvent datasets selected to approximate them in building up the LCA model. In fact, biomethane has specific impacts related to 1 MJ of heat consumed (e.g., kgCO2eq/MJ and kgSbeq/MJ) that are quite different compared to those characterizing woodchips, and this sensibly affects the impacts related to the FU.
The eLCC results show in Scenario 1 an increase in terms of damage costs regarding abiotic resources for all considered fuels (as a consequence of the heat exchanger installation). The shift to renewable fuels to meet the energy demand of the system is characterized by significant reductions in all damage categories, both for biomethane and hardwood chips and both in the Baseline Scenario and Scenario 1. Only the damage cost related to abiotic resources increases when the use of biomethane and hardwood chips is compared to natural gas. On the other hand, considering the shift from the Baseline Scenario to Scenario 1, the use of fossil fuels is characterized by a decrease in all damage categories (except for abiotic resources), while the use of renewable fuels shows an increase in each one of the categories.
Comparing Scenario 1 using renewable fuels with the Baseline Scenario using fossil ones, a generalized decrease in the damage categories is observed, with the exception of the use of biomethane both compared to natural gas and light fuel oil and the use of hardwood chips compared to natural gas, that is characterized by an increase in Abiotic resources damage category. This evidence also has to be regarded as a direct consequence of the characteristics of each specific fuel and the specific Ecoinvent datasets selected to approximate them in building up the LCA calculation model.
Since the increase in the electricity consumption related to the heat exchanger operation came out as significant and appreciably affected the results in Scenario 1, a preliminary sensitivity analysis was carried out for this specific input. In particular, we considered that the energy need of the heat exchanger is 100% met through the use of electricity from hydroelectric sources (a solution actually possible through guarantees of origin) instead of electricity from the grid. According to this assumption, a decrease of impacts was observed for all of the considered categories except for the water use. Climate change impact, for instance, decreased by about 20–22% for the natural gas and light fuel oil configurations, while its reduction was more evident for the renewable fuel ones, being about 60% for biomethane and about 80% for hardwood chips. The same applied to the eLCC results, with appreciable reductions for all of the damage categories, that were in general particularly relevant for the renewable fuels. Figure 6 shows the effect of using 100% hydroelectric electricity for the same categories considered in previous Figure 5, while the complete picture of results is reported in the Supplementary Materials.

4. Conclusions

We studied the sustainability of a convective drying system and its upgrade (Scenario 1) through energy simulations and life cycle evaluations (LCA and eLCC). For each scenario, the analysis considered both renewable (biomethane and hardwood chips) and fossil fuels (natural gas and light fuel oil). The functional unit was 1 kg of dried material.
The findings suggest that renewable fuels lead to an improvement over the classical fossil fuel configuration for most of the known impact categories (e.g., climate change, human health) in both drying systems, even if unexpected impacts on other categories can modify the overall sustainability. The heat recovery strategy decreases all impacts of fossil fuels, except the abiotic and minerals resource consumption, while impacts unexpectedly increasing for several categories with the use of renewable fuels.
It appears that the use of renewable sources can represent an effective solution to generally reduce the impacts of drying systems from an environmental perspective, while heat recovery from exhausted air is a great strategy for reducing both energy demand and the environmental impacts of conventional fossil-fueled plants. The use of renewable electricity to meet the energy need for the operation of the system also emerged as a solution that, coupled with the ones above mentioned, is particularly strategic in terms of overall sustainability.
The present findings encourage a complete strategy in dryer systems’ design that has to consider the energy and economic performance, but also a comprehensive sustainability assessment. It is indeed clear that a systematic and comprehensive impact evaluation is crucial to analyze the sustainability of drying processes and compare the improved system to existing ones.
Future work could extend our methodology to evaluate more complex drying cycle configurations (i.e., closed cycles). Furthermore, the Euler–Euler model simulates the thermodynamic equilibrium of the drying process, but more complex (and computationally expensive) models can increase the accuracy of the model in describing the drying physics.

Supplementary Materials

The following are available at https://www.mdpi.com/article/10.3390/en16031523/s1: Table S1: LCA results (FU: 1 kg dried material); Table S2: eLCC results (FU: 1 kg dried material); Table S3: Contributions to LCA results: natural gas (FU: 1 kg dried material); Table S4: Contributions to LCA results: light fuel oil (FU: 1 kg dried material); Table S5: Contributions to LCA results: biomethane (FU: 1 kg dried material); Table S6: Contributions to LCA results: hardwood chips (FU: 1 kg dried material); Table S7: Contributions to eLCC results: natural gas (FU: 1 kg dried material); Table S8: Contributions to eLCC results: light fuel oil (FU: 1 kg dried material); Table S9: Contributions to eLCC results: biomethane (FU: 1 kg dried material); Table S10: Contributions to eLCC results: hardwood chips (FU: 1 kg dried material); Table S11: LCA results: electricity 100% hydroelectric (FU: 1 kg dried material); Table S12: eLCC results: electricity 100% hydroelectric (FU: 1 kg dried material); Table S13: Ecoinvent dataset used in the analysis

Author Contributions

Conceptualization, D.G.U., A.A. and F.S.; methodology, D.G.U., A.A. and F.S.; software, A.A.; validation, D.G.U., A.A. and F.S.; formal analysis, D.G.U., A.A. and F.S.; investigation, D.G.U., A.A. and F.S.; writing—original draft preparation, D.G.U., A.A. and F.S.; writing—review and editing, D.G.U., A.A. and F.S.; visualization, D.G.U., A.A. and F.S.; supervision, D.G.U., A.A. and F.S. All authors have read and agreed to the published version of the manuscript.

Funding

This research received no external funding.

Data Availability Statement

The data presented in this study are available in the Supplementary Material.

Conflicts of Interest

The authors declare no conflict of interest.

Sample Availability

The presented data came from a specific design analysis carried out consistently with the aim of the study. All data are available under request to the corresponding author.

References

  1. Gardner, A.W. Industrial Drying; Biliing & Sons Ltd.: London, UK, 1971. [Google Scholar]
  2. Strumillo, C. Drying: Principles, Applications, and Design; CRC Press: Boca Raton, FL, USA, 1986; Volume 3. [Google Scholar]
  3. Iqbal, J.M.; Akbar, W.M.; Aftab, M.R.; Younas, I.; Jamil, U. Heat and mass transfer modeling for fruit drying: A review. MOJ Food Process. Technol. 2019, 7, 69–73. [Google Scholar] [CrossRef]
  4. Mujumdar, A.S. Handbook of Industrial Drying; CRC Press: Boca Raton, FL, USA, 2006. [Google Scholar]
  5. Behjat, Y.; Shahhosseini, S.; Hashemabadi, S.H. CFD modeling of hydrodynamic and heat transfer in fluidized bed reactors. Int. Commun. Heat Mass Transf. 2008, 35, 357–368. [Google Scholar] [CrossRef]
  6. Chou, S.; Chua, K. New hybrid drying technologies for heat sensitive foodstuffs. Trends Food Sci. Technol. 2001, 12, 359–369. [Google Scholar] [CrossRef]
  7. Akhavan, A.; van Ommen, J.R.; Nijenhuis, J.; Wang, X.S.; Coppens, M.O.; Rhodes, M.J. Improved drying in a pulsation-assisted fluidized bed. Ind. Eng. Chem. Res. 2009, 48, 302–309. [Google Scholar] [CrossRef]
  8. Si, C.; Wu, J.; Wang, Y.; Zhang, Y.; Liu, G. Effect of acoustic field on minimum fluidization velocity and drying characteristics of lignite in a fluidized bed. Fuel Process. Technol. 2015, 135, 112–118. [Google Scholar] [CrossRef]
  9. Ali, S.S.; Asif, M. Effect of particle mixing on the hydrodynamics of fluidized bed of nanoparticles. Powder Technol. 2017, 310, 234–240. [Google Scholar] [CrossRef]
  10. Lehmann, S.; Hartge, E.U.; Jongsma, A.; deLeeuw, I.M.; Innings, F.; Heinrich, S. Fluidization characteristics of cohesive powders in vibrated fluidized bed drying at low vibration frequencies. Powder Technol. 2019, 357, 54–63. [Google Scholar] [CrossRef]
  11. Motevali, A.; Koloor, R.T. A comparison between pollutants and greenhouse gas emissions from operation of different dryers based on energy consumption of power plants. J. Clean. Prod. 2017, 154, 445–461. [Google Scholar] [CrossRef]
  12. Haque, N.; Somerville, M. Techno-economic and environmental evaluation of biomass dryer. Procedia Eng. 2013, 56, 650–655. [Google Scholar] [CrossRef]
  13. Haque, N. Guest editorial: Life cycle assessment of dryers. Dry. Technol. 2011, 29, 1760–1762. [Google Scholar] [CrossRef]
  14. Kumar, S.; Jadhav, S.V.; Thorat, B.N. Life cycle assessment of tomato drying in heat pump and microwave vacuum dryers. Mater. Today Proc. 2022, 57, 1700–1705. [Google Scholar] [CrossRef]
  15. Ciesielski, K.; Zbicinski, I. Evaluation of environmental impact of the spray-drying process. Dry. Technol. 2010, 28, 1091–1096. [Google Scholar] [CrossRef]
  16. De Marco, I.; Iannone, R.; Miranda, S.; Riemma, S. Life cycle assessment of apple powders produced by a drum drying process. Chem. Eng. Trans. 2015, 43, 193–198. [Google Scholar]
  17. Prosapio, V.; Norton, I.; De Marco, I. Optimization of freeze-drying using a Life Cycle Assessment approach: Strawberries’ case study. J. Clean. Prod. 2017, 168, 1171–1179. [Google Scholar] [CrossRef]
  18. van Oirschot, R.; Thomas, J.B.E.; Gröndahl, F.; Fortuin, K.P.; Brandenburg, W.; Potting, J. Explorative environmental life cycle assessment for system design of seaweed cultivation and drying. Algal Res. 2017, 27, 43–54. [Google Scholar] [CrossRef]
  19. Léonard, A.; Gerbinet, S. Using Life Cycle Assessment methodology to minimize the environmental impact of dryers. In Proceedings of the IDS 2018. 21st International Drying Symposium Proceedings; Editorial Universitat Politècnica de València: Valencia, Spain, 2018; pp. 33–38. [Google Scholar]
  20. Romdhana, H.; Bonazzi, C.; Esteban-Decloux, M. Computer-aided process engineering for environmental efficiency: Industrial drying of biomass. Dry. Technol. 2016, 34, 1253–1269. [Google Scholar] [CrossRef]
  21. Evrard, D.; Ben Rejeb, H.; Zwolinski, P.; Brissaud, D. Designing immortal products: A lifecycle scenario-based approach. Sustainability 2021, 13, 3574. [Google Scholar] [CrossRef]
  22. Aquino, A.; Poesio, P. Off-Design Exergy Analysis of Convective Drying Using a Two-Phase Multispecies Model. Energies 2021, 14, 223. [Google Scholar] [CrossRef]
  23. Sarker, M.; Ibrahim, M.; Aziz, N.A.; Punan, M. Application of simulation in determining suitable operating parameters for industrial scale fluidized bed dryer during drying of high impurity moist paddy. J. Stored Prod. Res. 2015, 61, 76–84. [Google Scholar] [CrossRef]
  24. Sarker, M.S.H.; Ibrahim, M.N.; Aziz, N.A.; Punan, M.S. Energy and exergy analysis of industrial fluidized bed drying of paddy. Energy 2015, 84, 131–138. [Google Scholar] [CrossRef]
  25. Erbay, Z.; Icier, F. A review of thin layer drying of foods: Theory, modeling, and experimental results. Crit. Rev. Food Sci. Nutr. 2010, 50, 441–464. [Google Scholar] [CrossRef] [PubMed]
  26. Tohidi, M.; Sadeghi, M.; Torki-Harchegani, M. Energy and quality aspects for fixed deep bed drying of paddy. Renew. Sustain. Energy Rev. 2017, 70, 519–528. [Google Scholar] [CrossRef]
  27. Mohapatra, D.; Bal, S. Determination of Specific Heat and Gelatinization Temperature of Rice using Differential Scanning Calorimetry. In Proceedings of the 2003 ASAE Annual Meeting; American Society of Agricultural and Biological Engineers: St. Joseph, MI, USA, 2003; p. 1. [Google Scholar]
  28. Macdonald, I.; El-Sayed, M.; Mow, K.; Dullien, F. Flow through porous media-the Ergun equation revisited. Ind. Eng. Chem. Fundam. 1979, 18, 199–208. [Google Scholar] [CrossRef]
  29. Bian, Q. The nature of climate change-equivalent climate change model’s application in decoding the root cause of global warming. Int. J. Environ. Clim. Chang. 2019, 9, 801–822. [Google Scholar] [CrossRef]
  30. Aktaş, M.; Şevik, S.; Amini, A.; Khanlari, A. Analysis of drying of melon in a solar-heat recovery assisted infrared dryer. Sol. Energy 2016, 137, 500–515. [Google Scholar] [CrossRef]
  31. Oǧulata, R.T. Utilization of waste-heat recovery in textile drying. Appl. Energy 2004, 79, 41–49. [Google Scholar] [CrossRef]
  32. El Fil, B.; Garimella, S. Waste heat recovery in commercial gas-fired tumble dryers. Energy 2021, 218, 119407. [Google Scholar] [CrossRef]
  33. ISO 14040; Environmental Management-Life Cycle Assessment-Principles and Framework. ISO: Geneva, Switzerland, 1997.
  34. ISO 14044; Environmental Management-Life Cycle Assessment-Requirements and Guidelines. ISO: Geneva, Switzerland, 1997.
  35. ILCD Handbook. European Commission-Joint Research Centre-Institute for Environment and Sustainability: International Reference Life Cycle Data System (ILCD) Handbook–General Guide for Life Cycle Assessment-Detailed Guidance. March 2010. Available online: https://eplca.jrc.ec.europa.eu/uploads/ILCD-Handbook-General-guide-for-LCA-DETAILED-GUIDANCE-12March2010-ISBN-fin-v1.0-EN.pdf (accessed on 10 December 2022).
  36. Wernet, G.; Bauer, C.; Steubing, B.; Reinhard, J.; Moreno-Ruiz, E.; Weidema, B. The ecoinvent database version 3 (part I): Overview and methodology. Int. J. Life Cycle Assess. 2016, 21, 1218–1230. [Google Scholar] [CrossRef]
  37. Pré Sustainability. LCA Software for Informed Change-Makers. 2022. Available online: https://simapro.com/ (accessed on 10 December 2022).
  38. Zampori, L.; Pant, R. Suggestions for Updating the Product Environmental Footprint (PEF) Method; Publications Office of the European Union: Luxembourg, 2019. [Google Scholar]
  39. European Commission. PEFCR Guidance Document-Guidance for the Development of Product Environmental Footprint Category Rules (PEFCRs). Version 6.3; Environmental Footprint Guidance Document. 2017. Available online: https://ec.europa.eu/environment/eussd/smgp/pdf/PEFCR_guidance_v6.3.pdf (accessed on 10 December 2022).
  40. Bagg, M. Save cash and energy costs via an LCC model. World Pumps 2013, 2013, 26–27. [Google Scholar] [CrossRef]
  41. Hin, J.N.C.; Zmeureanu, R. Optimization of a residential solar combisystem for minimum life cycle cost, energy use and exergy destroyed. Sol. Energy 2014, 100, 102–113. [Google Scholar]
  42. Bierer, A.; Götze, U.; Meynerts, L.; Sygulla, R. Integrating life cycle costing and life cycle assessment using extended material flow cost accounting. J. Clean. Prod. 2015, 108, 1289–1301. [Google Scholar] [CrossRef]
  43. Stern, N.; Stern, N.H. The Economics of Climate Change: The Stern Review; Cambridge University Press: Cambridge, UK, 2007. [Google Scholar]
  44. Steen, B. The EPS 2015d Impact Assessment Method—An Overview; Swedish Life Cycle Center: Gothenburg, Sweden, 2015. [Google Scholar]
  45. Soponronnarit, S. Fluidised-bed paddy drying. Sci. Asia 1999, 25, 51–56. [Google Scholar] [CrossRef]
  46. Castro, A.; Mayorga, E.; Moreno, F. Mathematical modelling of convective drying of fruits: A review. J. Food Eng. 2018, 223, 152–167. [Google Scholar] [CrossRef]
  47. Vik, T.; Reif, B.P. Modeling the evaporation from a thin liquid surface beneath a turbulent boundary layer. Int. J. Therm. Sci. 2011, 50, 2311–2317. [Google Scholar] [CrossRef]
  48. Joardder, M.U.; Karim, A.; Kumar, C.; Brown, R.J. Porosity: Establishing the Relationship between Drying Parameters and Dried Food Quality; Springer: Berlin/Heidelberg, Germany, 2015. [Google Scholar]
Figure 1. The drying cycles with system boundaries for the life cycle evaluations.
Energies 16 01523 g001
Figure 2. Cumulative evaporated water along the bed length at different drying air inlet temperature (a) and moisture content (b) of the product [23].
Energies 16 01523 g002
Figure 3. Drying efficiency at different temperatures T H (a) and initial moisture contents u 0 (b) compared to the efficiency ( η r e f ) of [23].
Energies 16 01523 g003
Figure 4. Drying efficiency for Baseline and Scenario 1 plotted against drying air inlet temperature ( T H ).
Energies 16 01523 g004
Figure 5. LCA and eLCC results for Baseline Scenario and Scenario 1 (FU: 1 kg dried material).
Energies 16 01523 g005
Figure 6. LCA and eLCC results for Baseline Scenario and Scenario 1 (FU: 1 kg dried material supplied by hydroelectric energy.
Energies 16 01523 g006
Disclaimer/Publisher’s Note: The statements, opinions and data contained in all publications are solely those of the individual author(s) and contributor(s) and not of MDPI and/or the editor(s). MDPI and/or the editor(s) disclaim responsibility for any injury to people or property resulting from any ideas, methods, instructions or products referred to in the content.

