Article

Prediction of Fuel Properties of Torrefied Biomass Based on Back Propagation Neural Network Hybridized with Genetic Algorithm Optimization

1
School of Mines, China University of Mining and Technology, Xuzhou 221116, China
2
State Key Laboratory of Coal Combustion, School of Energy and Power Engineering, Huazhong University of Science and Technology, Wuhan 430074, China
3
School of Low-Carbon Energy and Power Engineering, China University of Mining and Technology, Xuzhou 221116, China
*
Author to whom correspondence should be addressed.
Energies 2023, 16(3), 1483; https://doi.org/10.3390/en16031483
Submission received: 21 October 2022 / Revised: 20 December 2022 / Accepted: 16 January 2023 / Published: 2 February 2023

Abstract

:
Torrefaction is an effective technology to overcome the defects of biomass which are adverse to its utilization as solid fuels. For assessing the torrefaction process, it is essential to characterize the properties of torrefied biomass. However, the preparation and characterization of torrefied biomass often consume a lot of time, costs, and manpower. Developing a reliable method to predict the fuel properties of torrefied biomass while avoiding various experiments and tests is of great value. In this study, a machine learning (ML) model of back propagation neural network (BPNN) hybridized with genetic algorithm (GA) optimization was developed to predict the important properties of torrefied biomass for the fuel purpose involving fuel ratio (FR), H/C and O/C ratios, high heating value (HHV) and the mass and energy yields (MY and EY) based on the proximate analysis results of raw biomass and torrefaction conditions. R2 and RMSE were examined to evaluate the prediction precision of the model. The results showed that the GA-BPNN model exhibited excellent accuracy in predicting all properties with the values of R2 higher than 0.91 and RMSE less than 1.1879. Notably, the GA-BPNN model is applicable to any type of biomass feedstock, whether it was dried or not before torrefaction. This study filled the gap of ML application in predicting the multiple fuel properties of torrefied biomass. The results could provide reference to torrefaction technology as well as the design of torrefaction facilities.

1. Introduction

As the only carbon-based renewable resource, biomass is considered to be a promising alternative to fossil fuels because it can not only be used for power generation and heat supply but can also be converted into gaseous, liquid, and solid products with zero CO2 emissions through their life cycle via various technologies [1]. Therefore, the utilization of biomass has attracted increasing attention in the past decades. However, the commercial utilization of biomass is still conditional since the raw resources exhibit the shortcomings of high moisture content, low calorific value, and low energy density, leading to the high collection, storage, and transportation costs and low conversion efficiency [2].
To overcome the abovementioned shortcomings, various pretreatment technologies have been proposed, including torrefaction, hydrothermal carbonization, pyrolysis, etc. Compared to pyrolysis and hydrothermal carbonization, torrefaction consumes the least energy and costs, while obtaining the highest energy values in the solid products [3,4,5]. Torrefaction is traditionally performed at 200~300 °C in an inert atmosphere. A few studies also included an oxidative atmosphere, such as air, steam, flue gas, etc., in the definition of torrefaction [6,7]. It is widely accepted that the qualities of biomass are significantly upgraded after torrefaction. To date, utilization as solid fuels for power generation and heat supply is still the dominant pathway of biomass. Fuel ratio (FR), O/C, H/C, high heating value (HHV), and mass (MY) and energy yields (EY) are important parameters for evaluating the fuel performance of the raw and torrefied biomass [8].
FR, the content ratio of fixed carbon (FC) to volatile matter (VM), is often used to determine the combustibility of solid fuels [9]. The FR value of torrefied biomass is higher than that of the raw material due to the release of volatiles caused by the cleavage of weak chemical bonds during the torrefaction process [8]. O/C and H/C are other two important ratios to help assess the fuel properties for energy applications, which are usually visualized by the Van Krevelen diagram in the literature [10]. The O/C and H/C ratios of biomass decline at a linear trend with increasing torrefaction temperature [11]. Lower H/C and O/C ratios indicate higher energy density [12]. Low O/C ratio also leads to less formation of smoke and soot during combustion [13]. To obtain the above ratios, proximate and ultimate analyses need to be performed to determine the contents of FC, VM, and CHO elements.
Simultaneously, the decrease of O/C and H/C ratios is also beneficial to the HHV of solid fuels. Therefore, torrefaction enhances the HHV of biomass, which is quite important for the design of biomass conversion technologies. The HHV of the torrefied biomass is reported to be comparable to that of coal (25~35 MJ/kg) [14]. The HHV of torrefied biomass is either experimentally tested by a calorimeter bomb or mathematically calculated based on the proximately and ultimate analysis results [15].
For assessing the torrefaction performance, it is necessary to determine the MY and EY values of torrefied biomass [7]. The MY is calculated by dividing the mass of torrefied biomass by that of the raw material, while EY represents the proportion of energy maintained in torrefied biomass compared to that of the raw biomass. With the increase in temperature, the two yields decrease with an invariable tendency that the EY value is always higher than that of MY.
As discussed above, it is quite cumbersome and costly to obtain the necessary fuel properties of torrefied biomass by repetitive experiments, and subsequently, instrumental analysis or mathematical methods. Therefore, developing a reliable method to predict the properties of torrefied biomass based on those of feedstock without various tests and experiments is of great value to save time, costs, and manpower. Two-step kinetic models were employed by Bach et al. [16] and Lin et al. [17] to predict the elemental composition, the HHV, and EY of torrefied biomass. Chen et al. [18] used the interpolation and regression method to predict the HHV, MY, and EY. Xu et al. [19] also developed a model which was established by using a two-stage torrefaction process involving mild and severe stages to predict the ultimate and proximate properties as well as the mass and energy yields. However, the aforementioned methods were appropriate to only small amounts of data obtained from the experiments performed by the authors. Nevertheless, the properties of torrefied biomass are highly dimensional and non-linear relationships with variable factors, including biomass types, torrefaction conditions, such as temperature, duration time, etc. There is an urgent need to develop more advanced methods for biomass torrefaction.
Machine Learning (ML), which is a subset of artificial intelligence (AI), allows software to automatically learn and integrate knowledge from an existing dataset and then generate a model to predict the target. ML has the superiorities of time-saving and high prediction accuracy in solving non-liner problems without unnecessary repetitive experiments [20]. Due to this, the ML algorithms, such as Artificial Neural Network (ANN), genetic algorithm (GR), decision tree (DT) and support vector machines (SVM), have been widely employed for biomass applications, including hydrothermal processing, gasification, pyrolysis, etc. [21] which provided good performance for exploring the relationships between input and output variables and performing predictions from small data sizes of around 20 to >20,000 [22].
For torrefied biomass, ANN model, which is an efficient tool to deal with nonlinear problems, was most frequently used to predict the yields [23,24], the CHO contents and HHV [25], and the exergy [26] of torrefied biomass, as well as to optimize the torrefaction process [27]. Several other models have also been employed to predict the yield and HHV of torrefied product. García et al. [28,29] predicted the HHV of torrefied biomass using support vector machine models (SVMs) combined with particle swarm optimization (PSO) or simulated annealing (SA) optimization. Onsree et al. [30,31] compared the accuracy of kernel ridge regression (KRR), gradient tree boosting (GTB), ANN, SVM, and random forest (RF) models in predicting the yields. Leng et al. [32] employed extreme gradient boosting (XGB), RF, SVM, and multilayer perceptron (MLP) algorithms to predict the distribution of three-phase products. These studies indicated that ML algorithms are appropriate for the prediction of torrefied biomass properties, especially the yield and HHV.
It is reported that the optimization of ANN-based models by algorithms, such as genetic algorithm (GA) [33] and particle swarm optimization (PSO) [34], can improve the prediction accuracy in energy systems. However, the literature with respect to the application of ML in biomass torrefaction is fairly scarce and mainly focused on the prediction of HHV and yield using basic algorithms, whereas predictions of other important fuel properties of torrefied biomass have not been reported. Moreover, the implementation of an optimized model to predict the fuel properties of torrefied biomass is still absent. Therefore, there is a wide gap in the prediction of torrefied biomass properties, especially for fuel purposes.
The purpose of this study was to develop an ML model for the prediction of fuel properties of torrefied biomass. The back propagation neural network (BPNN) was employed as an initial ML model, and it was further optimized by genetic algorithm (GA) to improve its prediction precision. Then, both the BPNN and GA-BPNN models were applied to predict the fuel properties of torrefied biomass, including the ratios of FR, O/C and H/C, HHV, the MY and EY from the proximate analysis results of the feedstock, and torrefaction conditions. To the authors’ knowledge, this is the first study that simultaneously predicts the multiple properties of torrefied biomass for fuel purposes using an optimized ML algorithm.

2. Methods

2.1. Data Collection and Pre-Processing

In this study, only the data of the traditional torrefaction, which was performed at 200~300 °C in an inert (N2, He, Ar and anoxic environment) atmosphere, were employed. Four hundred ninety-seven data points were extracted from 66 peer-reviewed publications, including our previous studies [11], to create a dataset, the detailed information of which is shown in the Supplementary Materials (Table S1). Most of the data were directly obtained from the experimental reports in the text and tables of the literature and the corresponding supplementary materials. While for those data which were not directly listed, we used WebPlotDigitizer tool (https://apps.automeris.io/wpd/, accessed on 2 October 2022) to extract the demand data from the figures. Various types of biomass feedstock involving agricultural residues, forestry residues, energy crops, leaves, fruit wastes, sewage sludge, etc., were included. The proximate analysis results of the raw biomass involving moisture (MO, wt.%), volatiles (VM, wt.%), fixed carbon (FC, wt.%), and ash (Ash, wt.%) contents as a function of torrefaction conditions involving temperature (Temp, °C) and duration time (Time, min) were collected as input features. The FR, the O/C, and H/C ratios, the MY (wt.%) and EY (%), and the HHV (MJ/kg) values of the torrefied biomass were assigned to the targets. The FR, the O/C, and H/C ratios were calculated based on the proximate and elemental analysis results.
Once the dataset was prepared, correlation analysis was applied to the dataset and the linear dependency between any two of the features was evaluated by Pearson’s correlation coefficient (PCC) [35].
r = i = 1 n ( x i x ¯ ) i = 1 n ( y i y ¯ ) i = 1 n ( x i x ¯ ) 2 i = 1 n ( y i y ¯ ) 2
where r is the value of PCC ranging from −1 to 1; x ¯ and y ¯ are the means of the input feature and output target, respectively. It means no linear correlation when r value is 0. The values of negative or positive indicate negative or positive correlation. The greater the absolute value of r, the stronger the linear correlation. The two features were considered to be strongly correlated to each other when the absolute value of r is greater than 0.7, and one of them will be excluded [36].
To unify the range of the features and the targets, they were normalized with Z-score standardization using Equation (2):
x i = x i μ s
where xi is the value of feature i; xi* is the normalized value of xi; μ is the mean value of xi, and s represents its standard deviation.
After preprocessing, the data points were then randomly divided into training and testing subsets at a ratio of 80% to 20% for further model evaluation.

2.2. Training Models

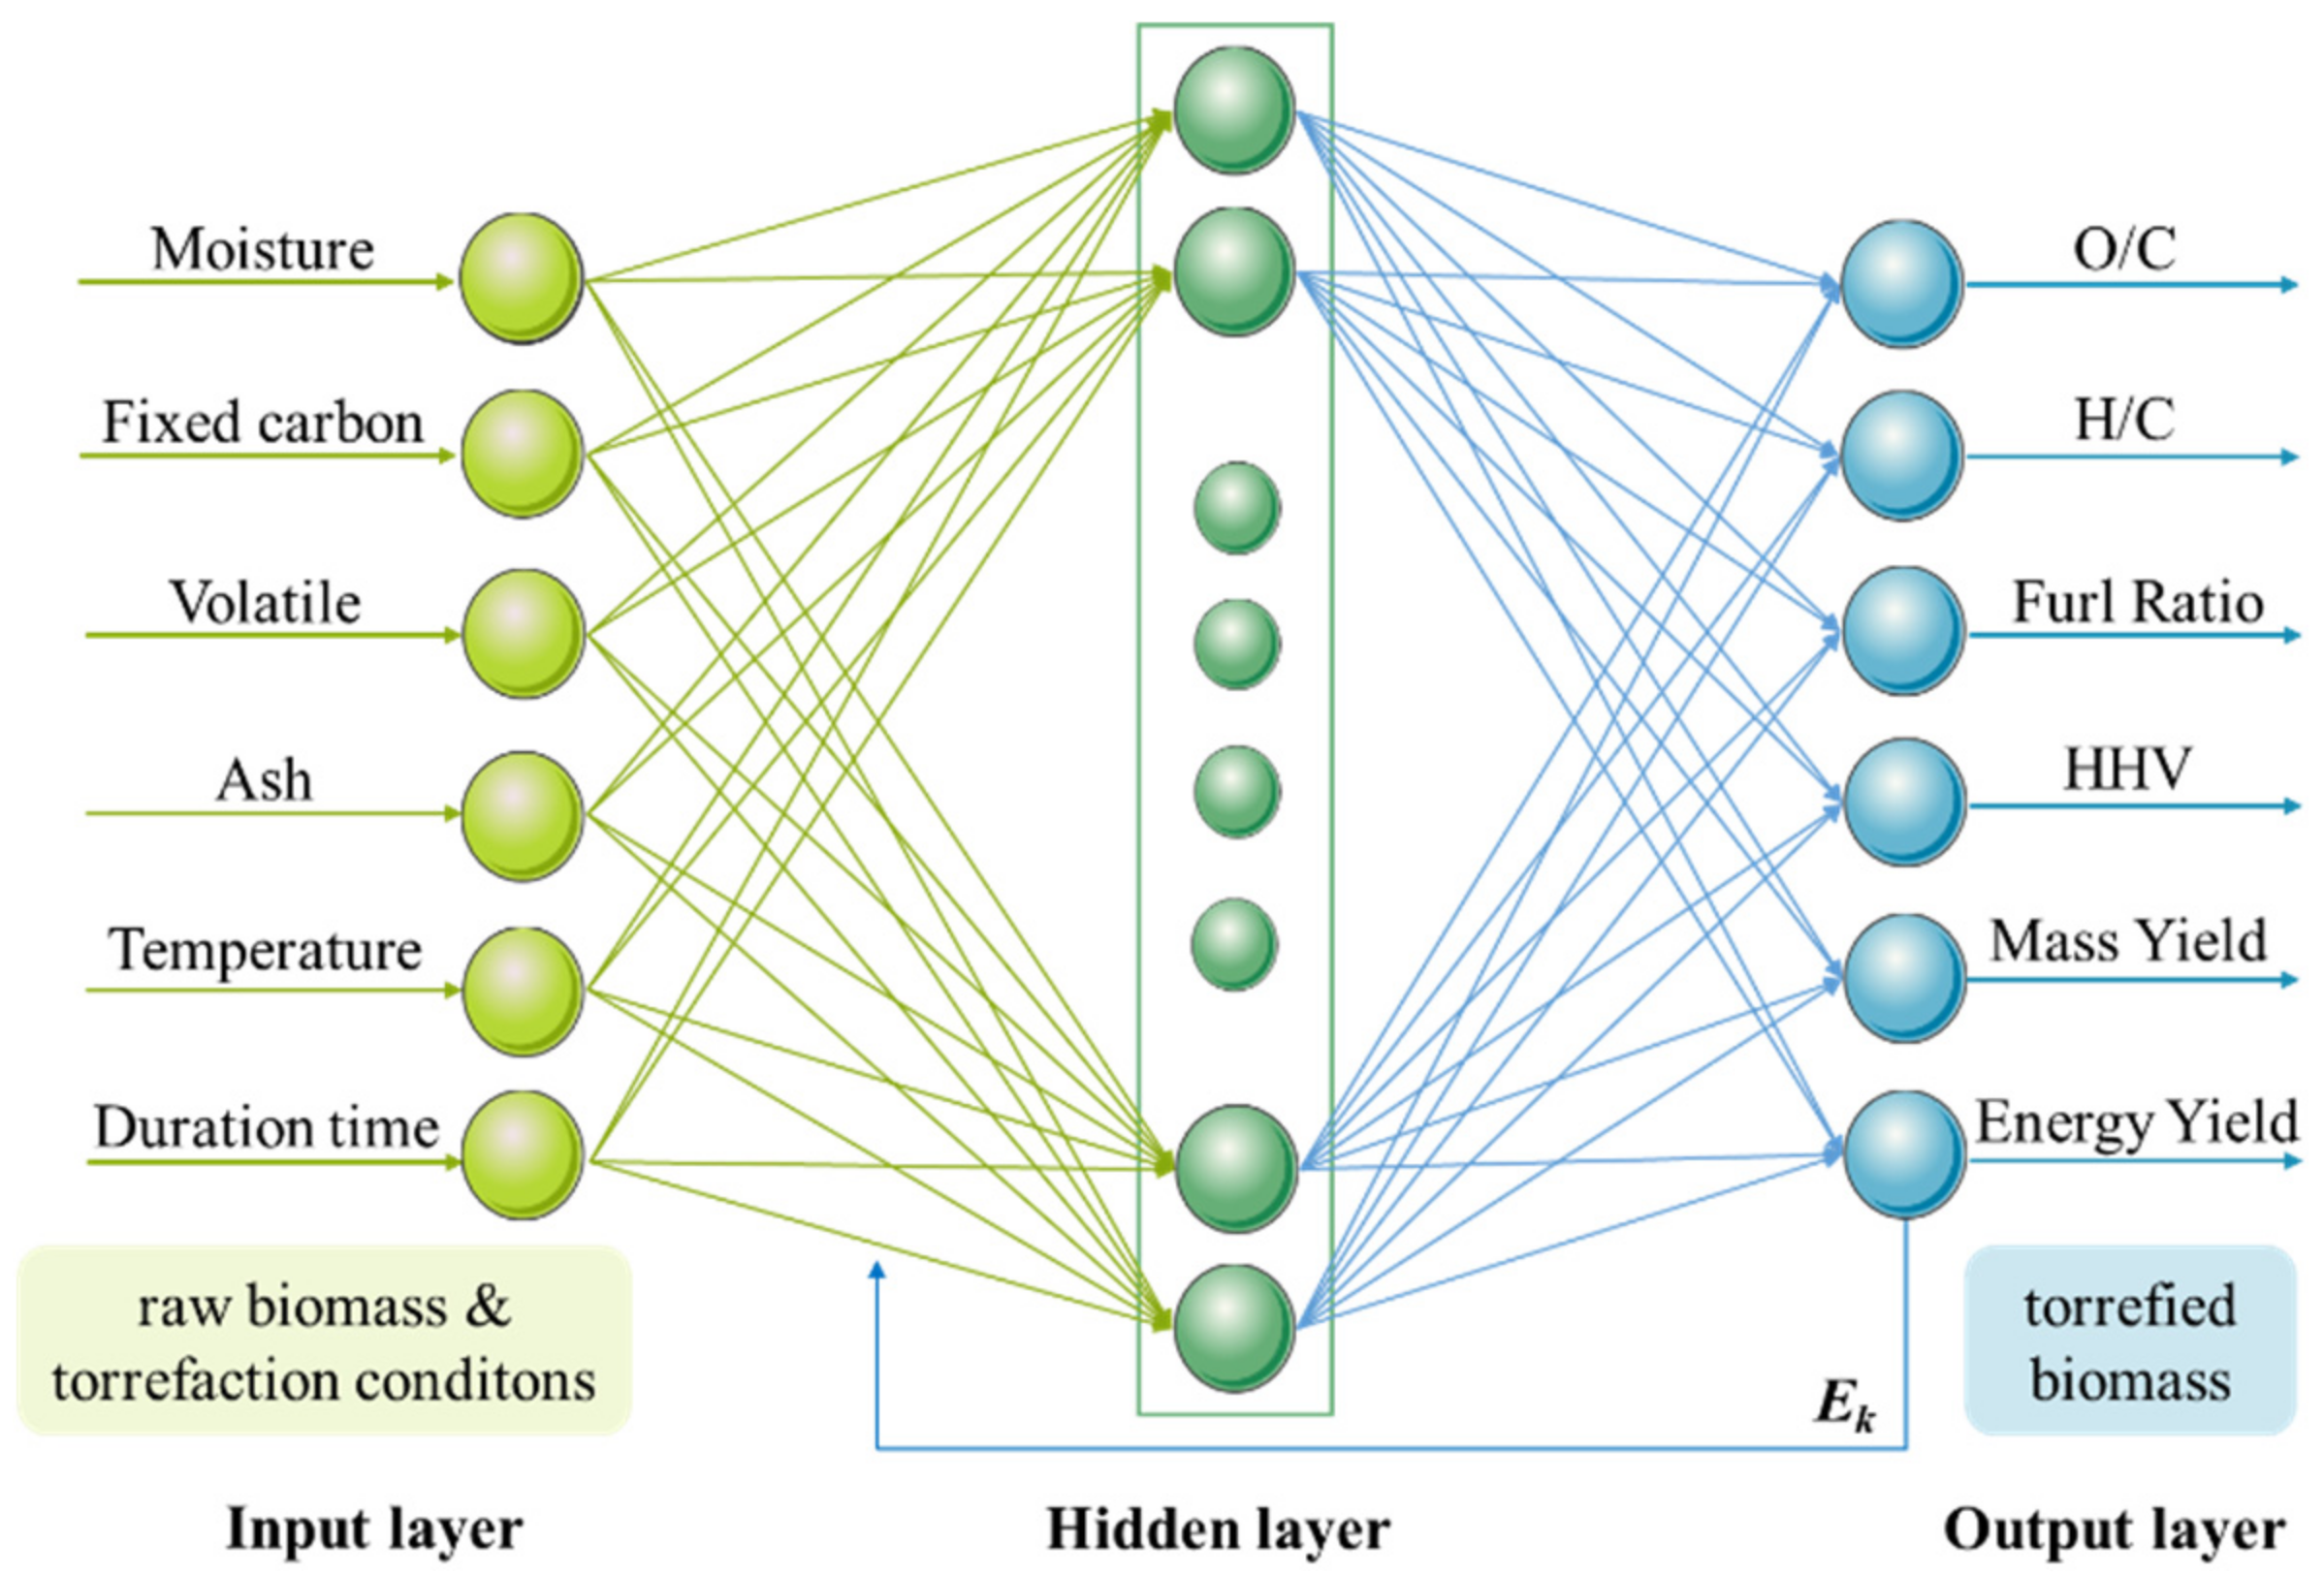
2.2.1. BPNN Model Description

BPNN is the most extensively used multilayer feedforward neural network based on gradient descent. It is a supervised learning model inspired by the neural system of the human brain consisting of neurons and connections. There are three or more layers involving an input layer, a single or multiple hidden layer(s), and an output layer in the networks [37]. The structure of the BPNN model with one hidden layer is shown in Figure 1.
The BP neural network transforms the input signals forward via a nonlinear activation function to the output layer and propagates the error back, and then the neural network continuously adjusts the threshold and weight. The iterative process continues in a loop until the error converges to a stable value. Finally, the model will output the predicted result.
In this study, the BPNN model consisted of 6 input neurons, 6 output neurons, and 1 hidden layer. The number of the hidden neurons was determined by Equation (3) [38].
X = m + n + a
where X is the number of hidden neurons; m and n are the number of the input and output variables, respectively, a is the integer ranging from 1~10. Therefore, the number of hidden neurons was 4~14.

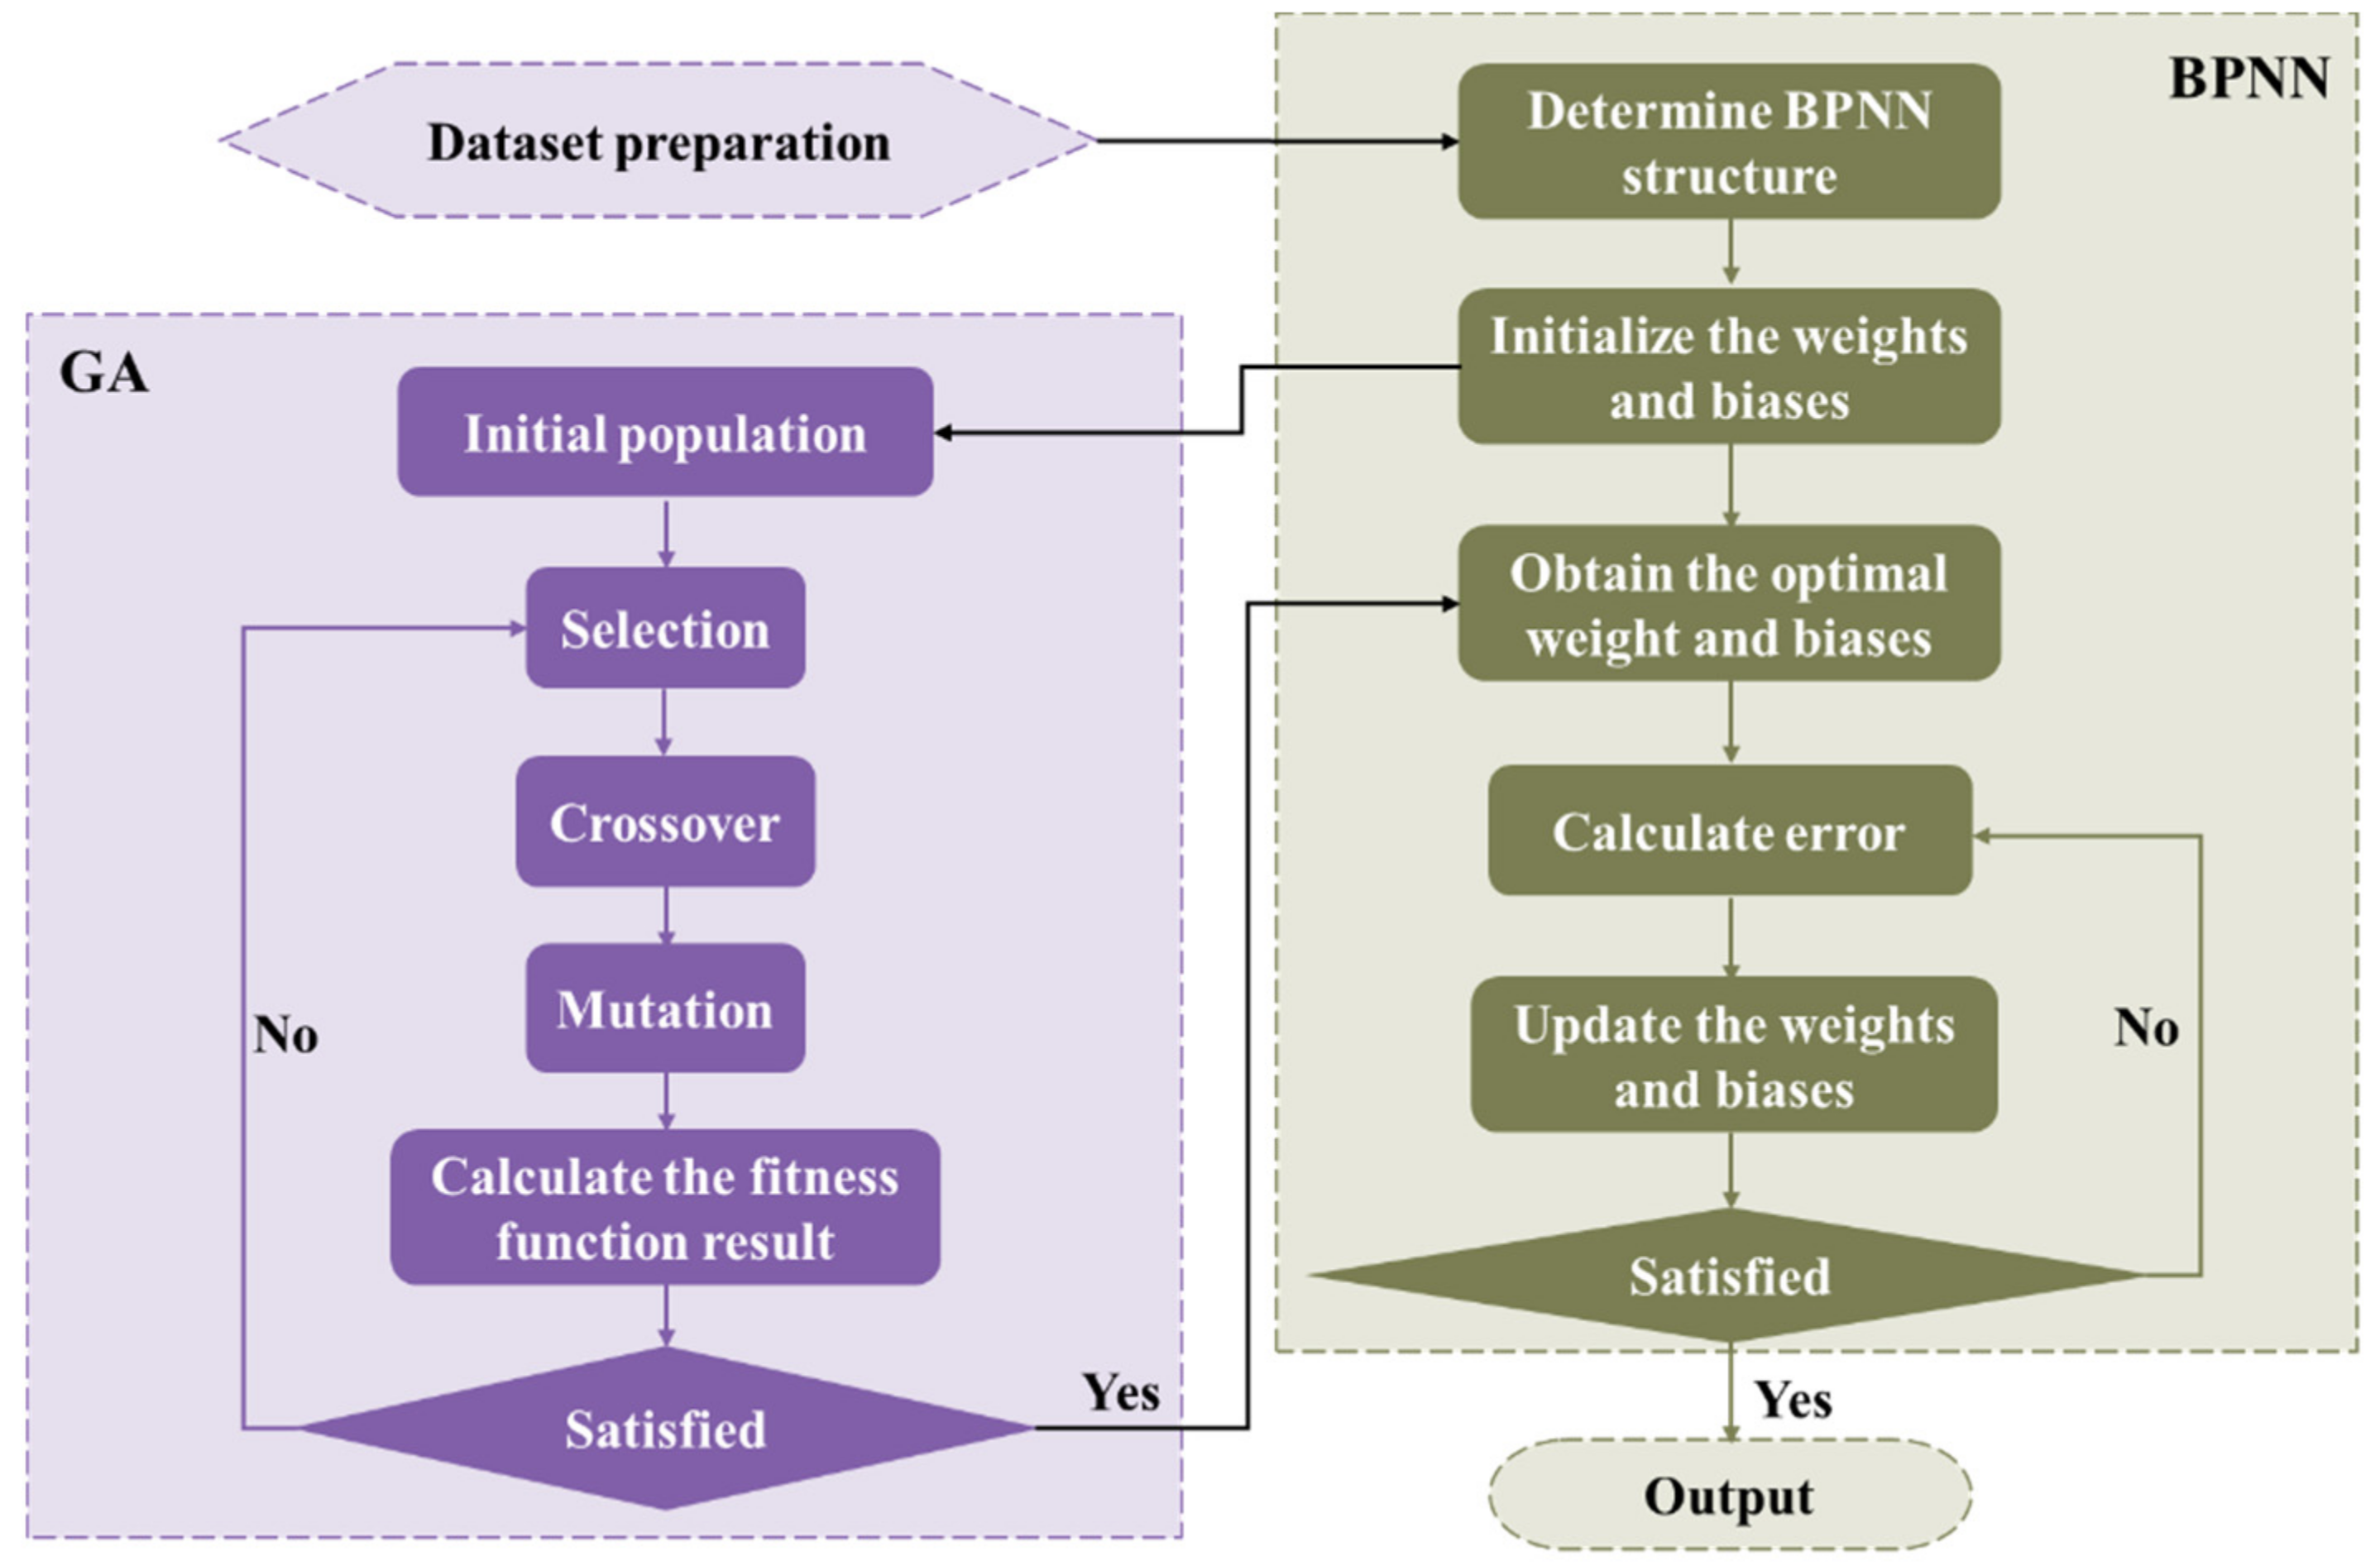
2.2.2. GA-BPNN Model

As described above, the BPNN is a training method based on error function gradient descent, due to this, it is easily trapped in the local minima or even not converging in the search space [33]. Thus, genetic algorithm (GA) was employed to further optimize the BPNN model.
GA is a stochastic optimization algorithm that searches for the optimal solution by simulating natural evolution based on the ‘survival of the fittest’ of Darwin’s biological evolution law and biological evolution of the genetic mechanism [39]. Compared with the local optimization of BPNN, GA devotes itself to searching for the optimal weights and thresholds globally. Therefore, the parameters optimized by GA can significantly improve the stability and prediction precision of the BPNN model. In this study, the initial population was comprised of the weights and thresholds. For the 6-X-6 network, the weights and thresholds number were 13X + 6, which was coded as genes of the chromosomes.
The Implementation of the GA-BPNN model is shown in Figure 2. The initial weights and thresholds of BPNN were taken as the initial population of GA, and all individuals in the initial population were encoded in real numbers to generate corresponding chromosomes. Then, the fitness function (Equation (4)) was used to assess the adaptability of the individuals to the change of the environment, and the individuals that survived were selected. The individuals with poor adaptability were sent back for iterative calculation until the optimal solution was found. When the number of iterations increased to the set value or the moderate value of the fitness function reached the required threshold, or the population was no longer updated, GA optimization was considered to be completed. The obtained individuals with the maximum fitness value were employed as the initial weights and thresholds of the BPNN model. The detailed settings of GA-BPNN are listed in Table S2.
f GA = 1 2 i = 1 n y ^ t r a i n y t r a i n 2 + i = 1 n y ^ t e s t y t e s t 2
where y ^ and y are the predicted and actual values of the targets, respectively.

2.3. Performance Evaluation

The performance of the BPNN and GA-BPNN models was evaluated using R2 and RMSE [40]. Conceptually, a higher R2 and a lower RMSE indicate better model accuracy.
R 2 = 1 i = 1 N ( y ^ y ) 2 i = 1 N ( y ^ y ¯ ) 2
RMSE = i = 1 N ( y ^ y ) 2 N
where y ^ is the predicted value of the target, y is the actual value and y ¯ is the mean value, N is the total number of data points.

3. Results and Discussion

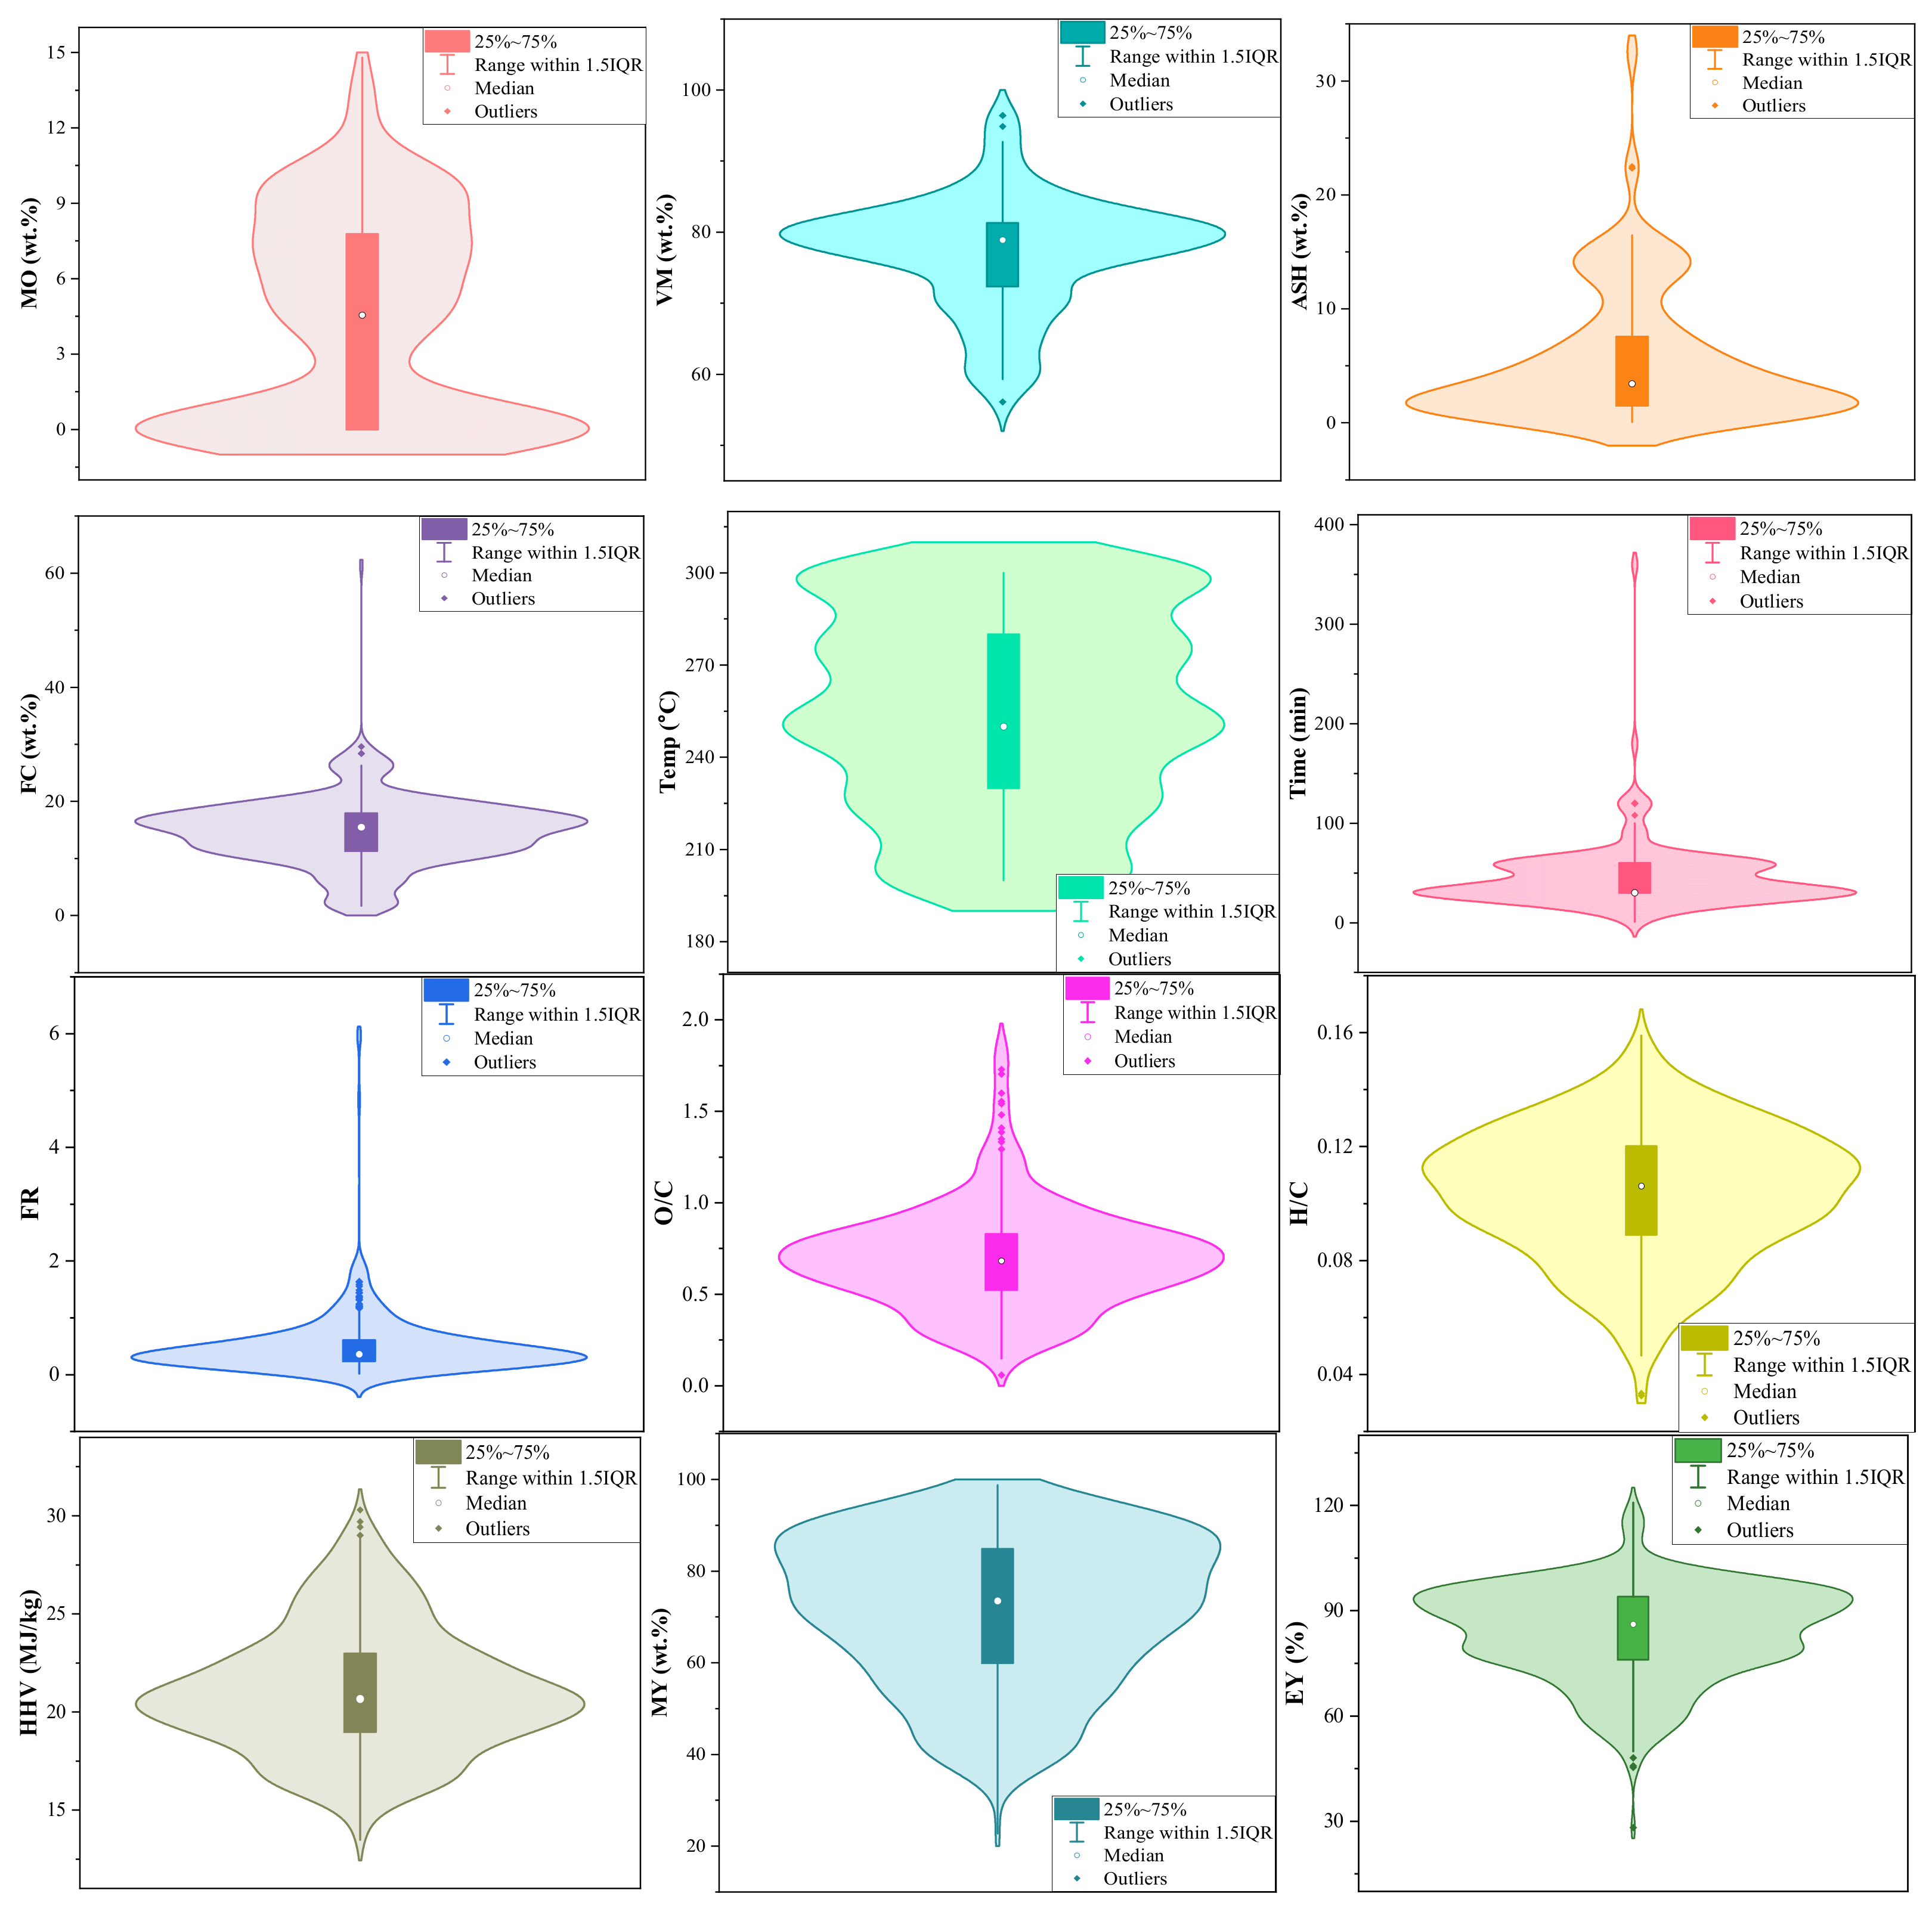
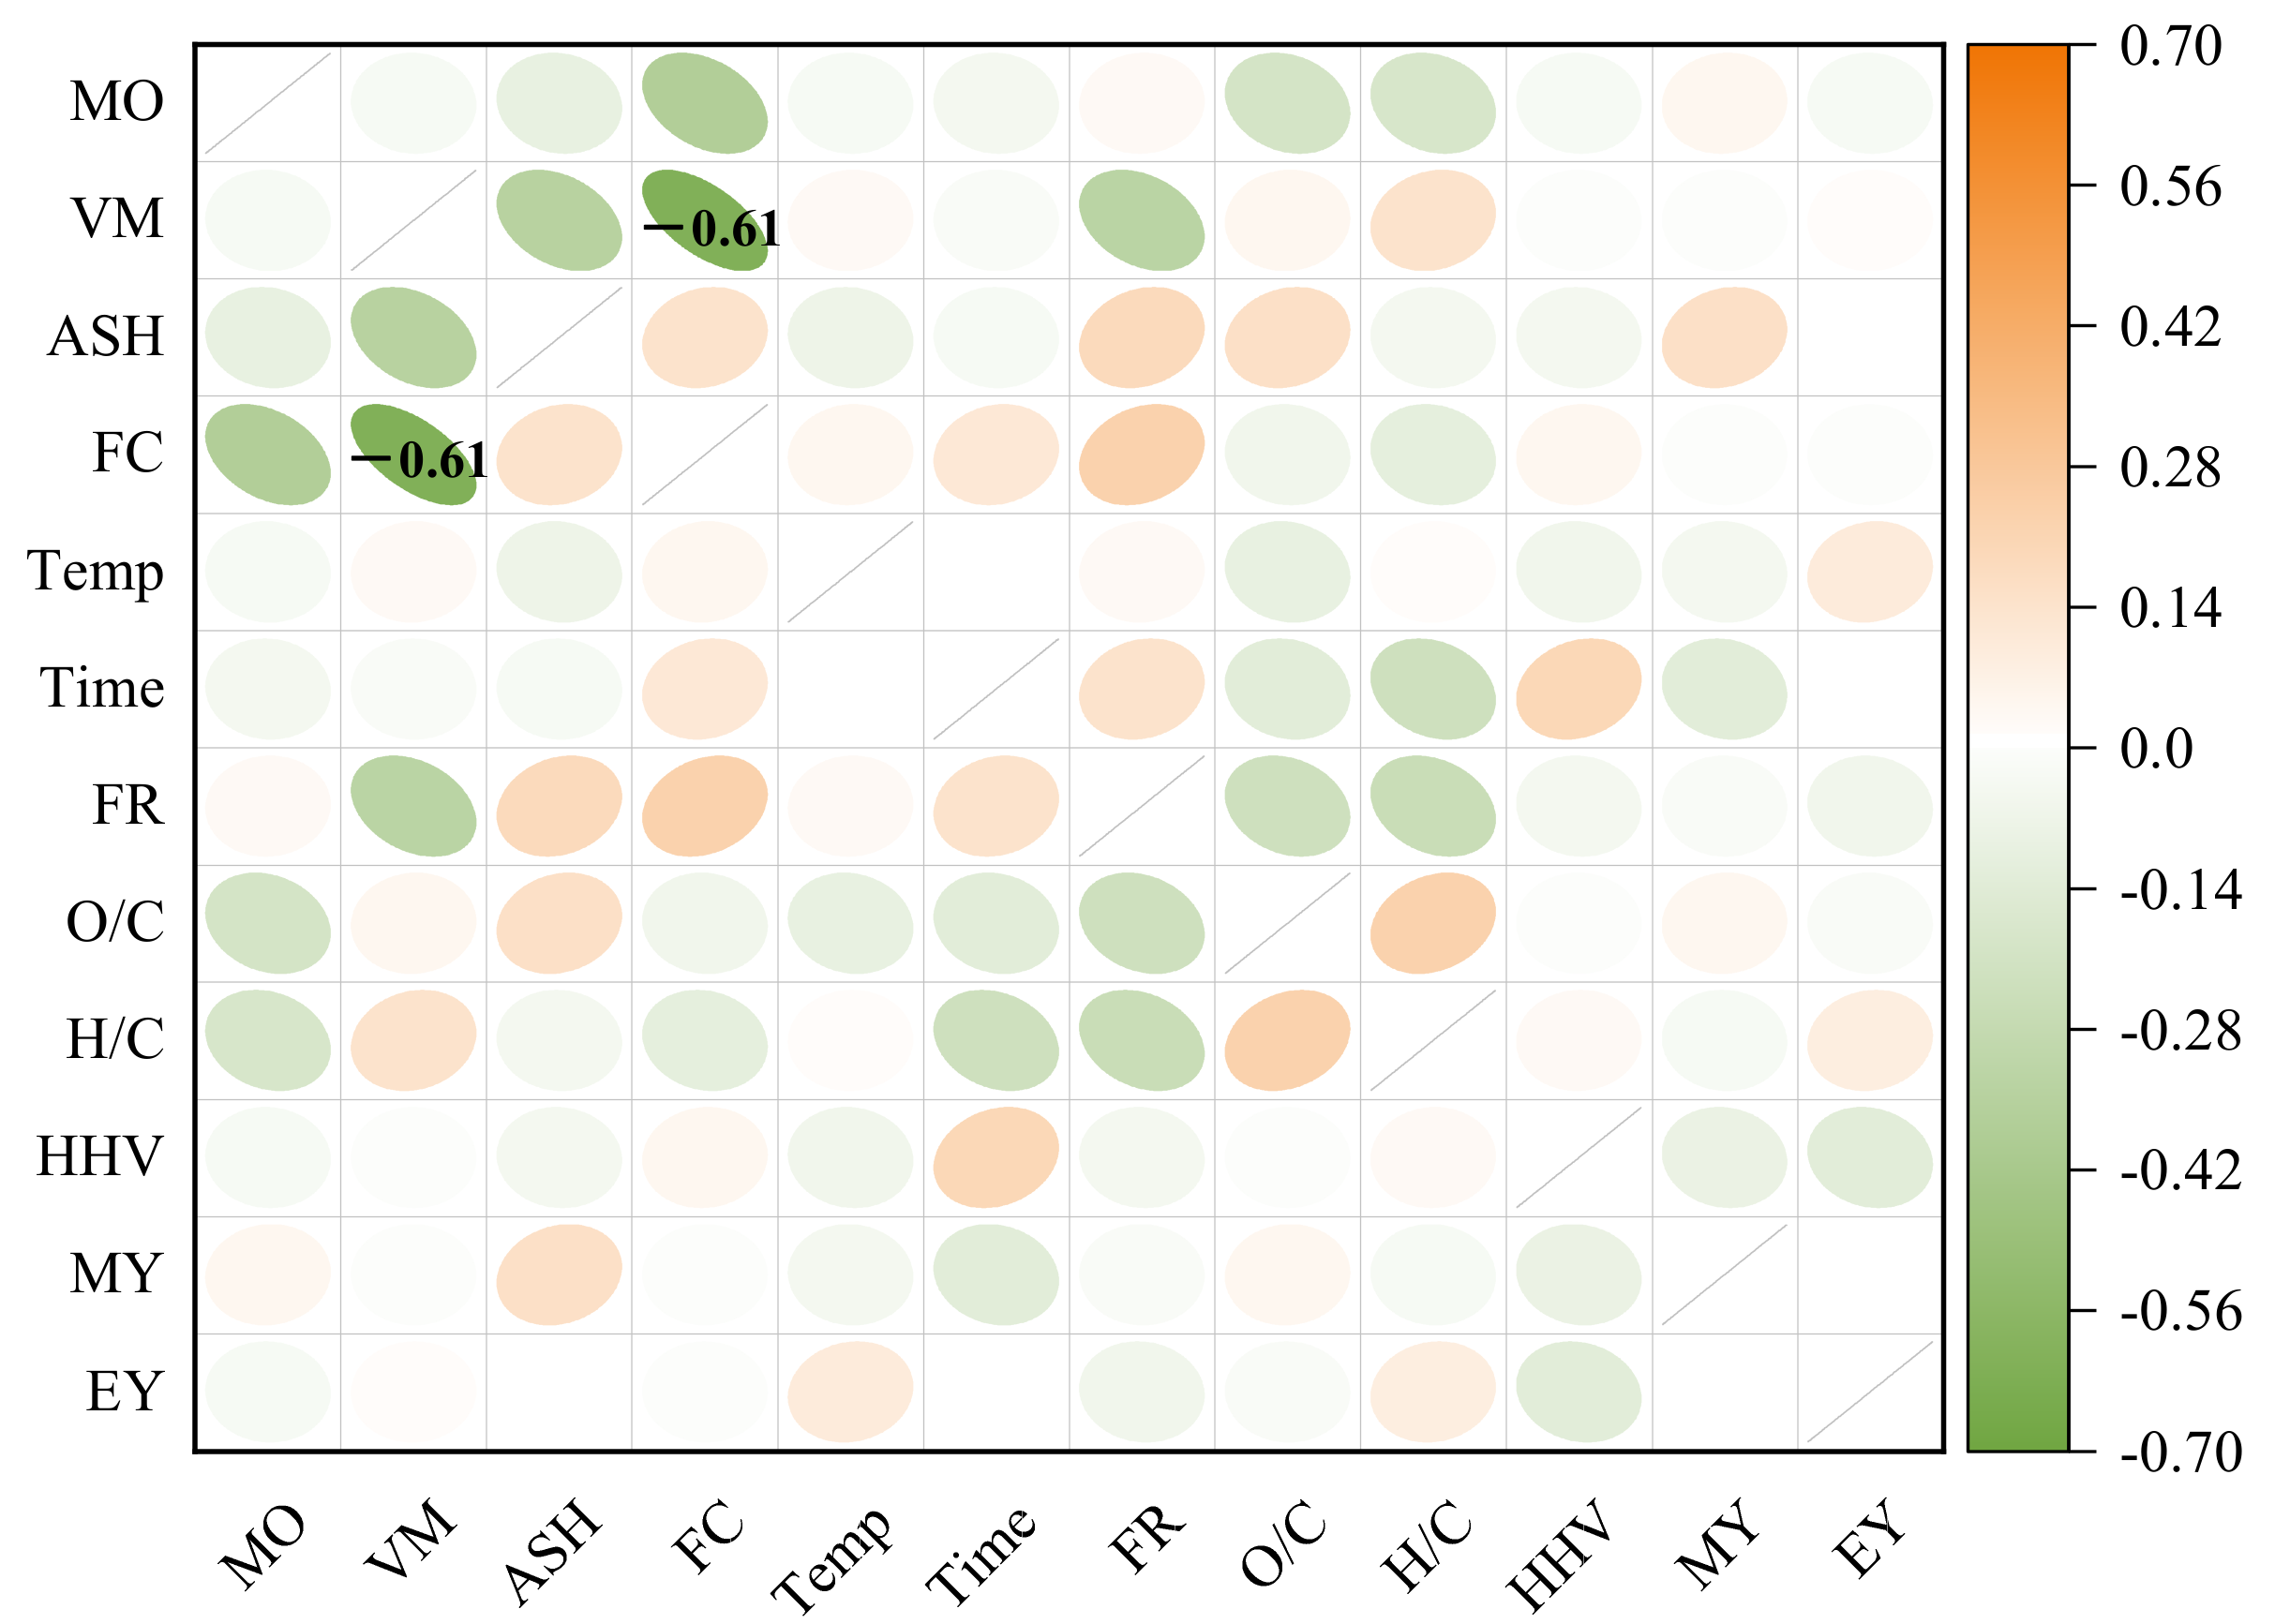
3.1. Dataset Description

An overview of the statistical distribution of the dataset is presented in Figure 3. The violin plots consist of boxplots (inner) and data distribution (outer) based on kernel density estimation. For the boxplot, the data are divided into quartiles by the interquartile range (IQR) to evaluate data variability. The points outside the range, i.e., outliers, are displayed individually with rhombus, which would be directly removed from the dataset in the subsequent prediction. Table S2 is a brief description of the dataset, including the unit, count, range, mean value, and standard deviation of all the features.
As shown in Figure 3 and Table S2, the MO content of raw biomass in the dataset ranged from 0 to 14.8 wt.%. The samples had VM content ranging from 32.2 to 96.4 wt.% with the violin-plot peak of approximately 80 wt.%. The ASH content exhibited a peak density at 1.76 wt.% in the range of 0~32.58 wt.%. The FC content varied from 1.67 to 61.4 wt.% with a peak density of 16.51 wt.%. The significant variation in the textural properties should be attributed to the diversity of the feedstock. In terms of the torrefaction conditions, the preferential duration time was 30 min followed by 60 min. Generally, 250 °C and 300 °C were employed in the literature, while other temperatures within 200~300 °C were also frequently used.
For torrefied biomass properties, the FR was widely distributed in the range of 0.021~7.19 with a mean value of 0.53, which is in close proximity to that of the industrially used coal (0.5~2.0) [41]. The density peaks of O/C and H/C ratios in the violin plots were 0.71 and 0.11, which are within the ranges of the two ratios of coal, i.e., 0.38~0.91 and 0.02~0.28 [42], respectively. The HHV ranged from 13.48 to 30.3 MJ/kg, with a median of 20.67 MJ/kg. The violin plot peaks of MY and EY were 85.61 wt.% and 93.43%, respectively.
According to the Pearson correlation matrix among the features (Figure 4), there was no significant linear correlation between any two of them since all the PCC absolute values were lower than 0.7. Detailed information on the PCCs was given in the supplementary material (Table S3). A relatively strong negative correlation was found between FC and VM (−0.61), which was acceptable simply because the sum of the proximate analysis results should be 100%. Therefore, due to the lack of strong liner correlation among the features, all of them were retained since each feature would then contribute individually to the model. Simultaneously, the output features exhibited a very weak linear connection with the input variables. However, the lack of a linear correlation does not imply the absence of other relationships.

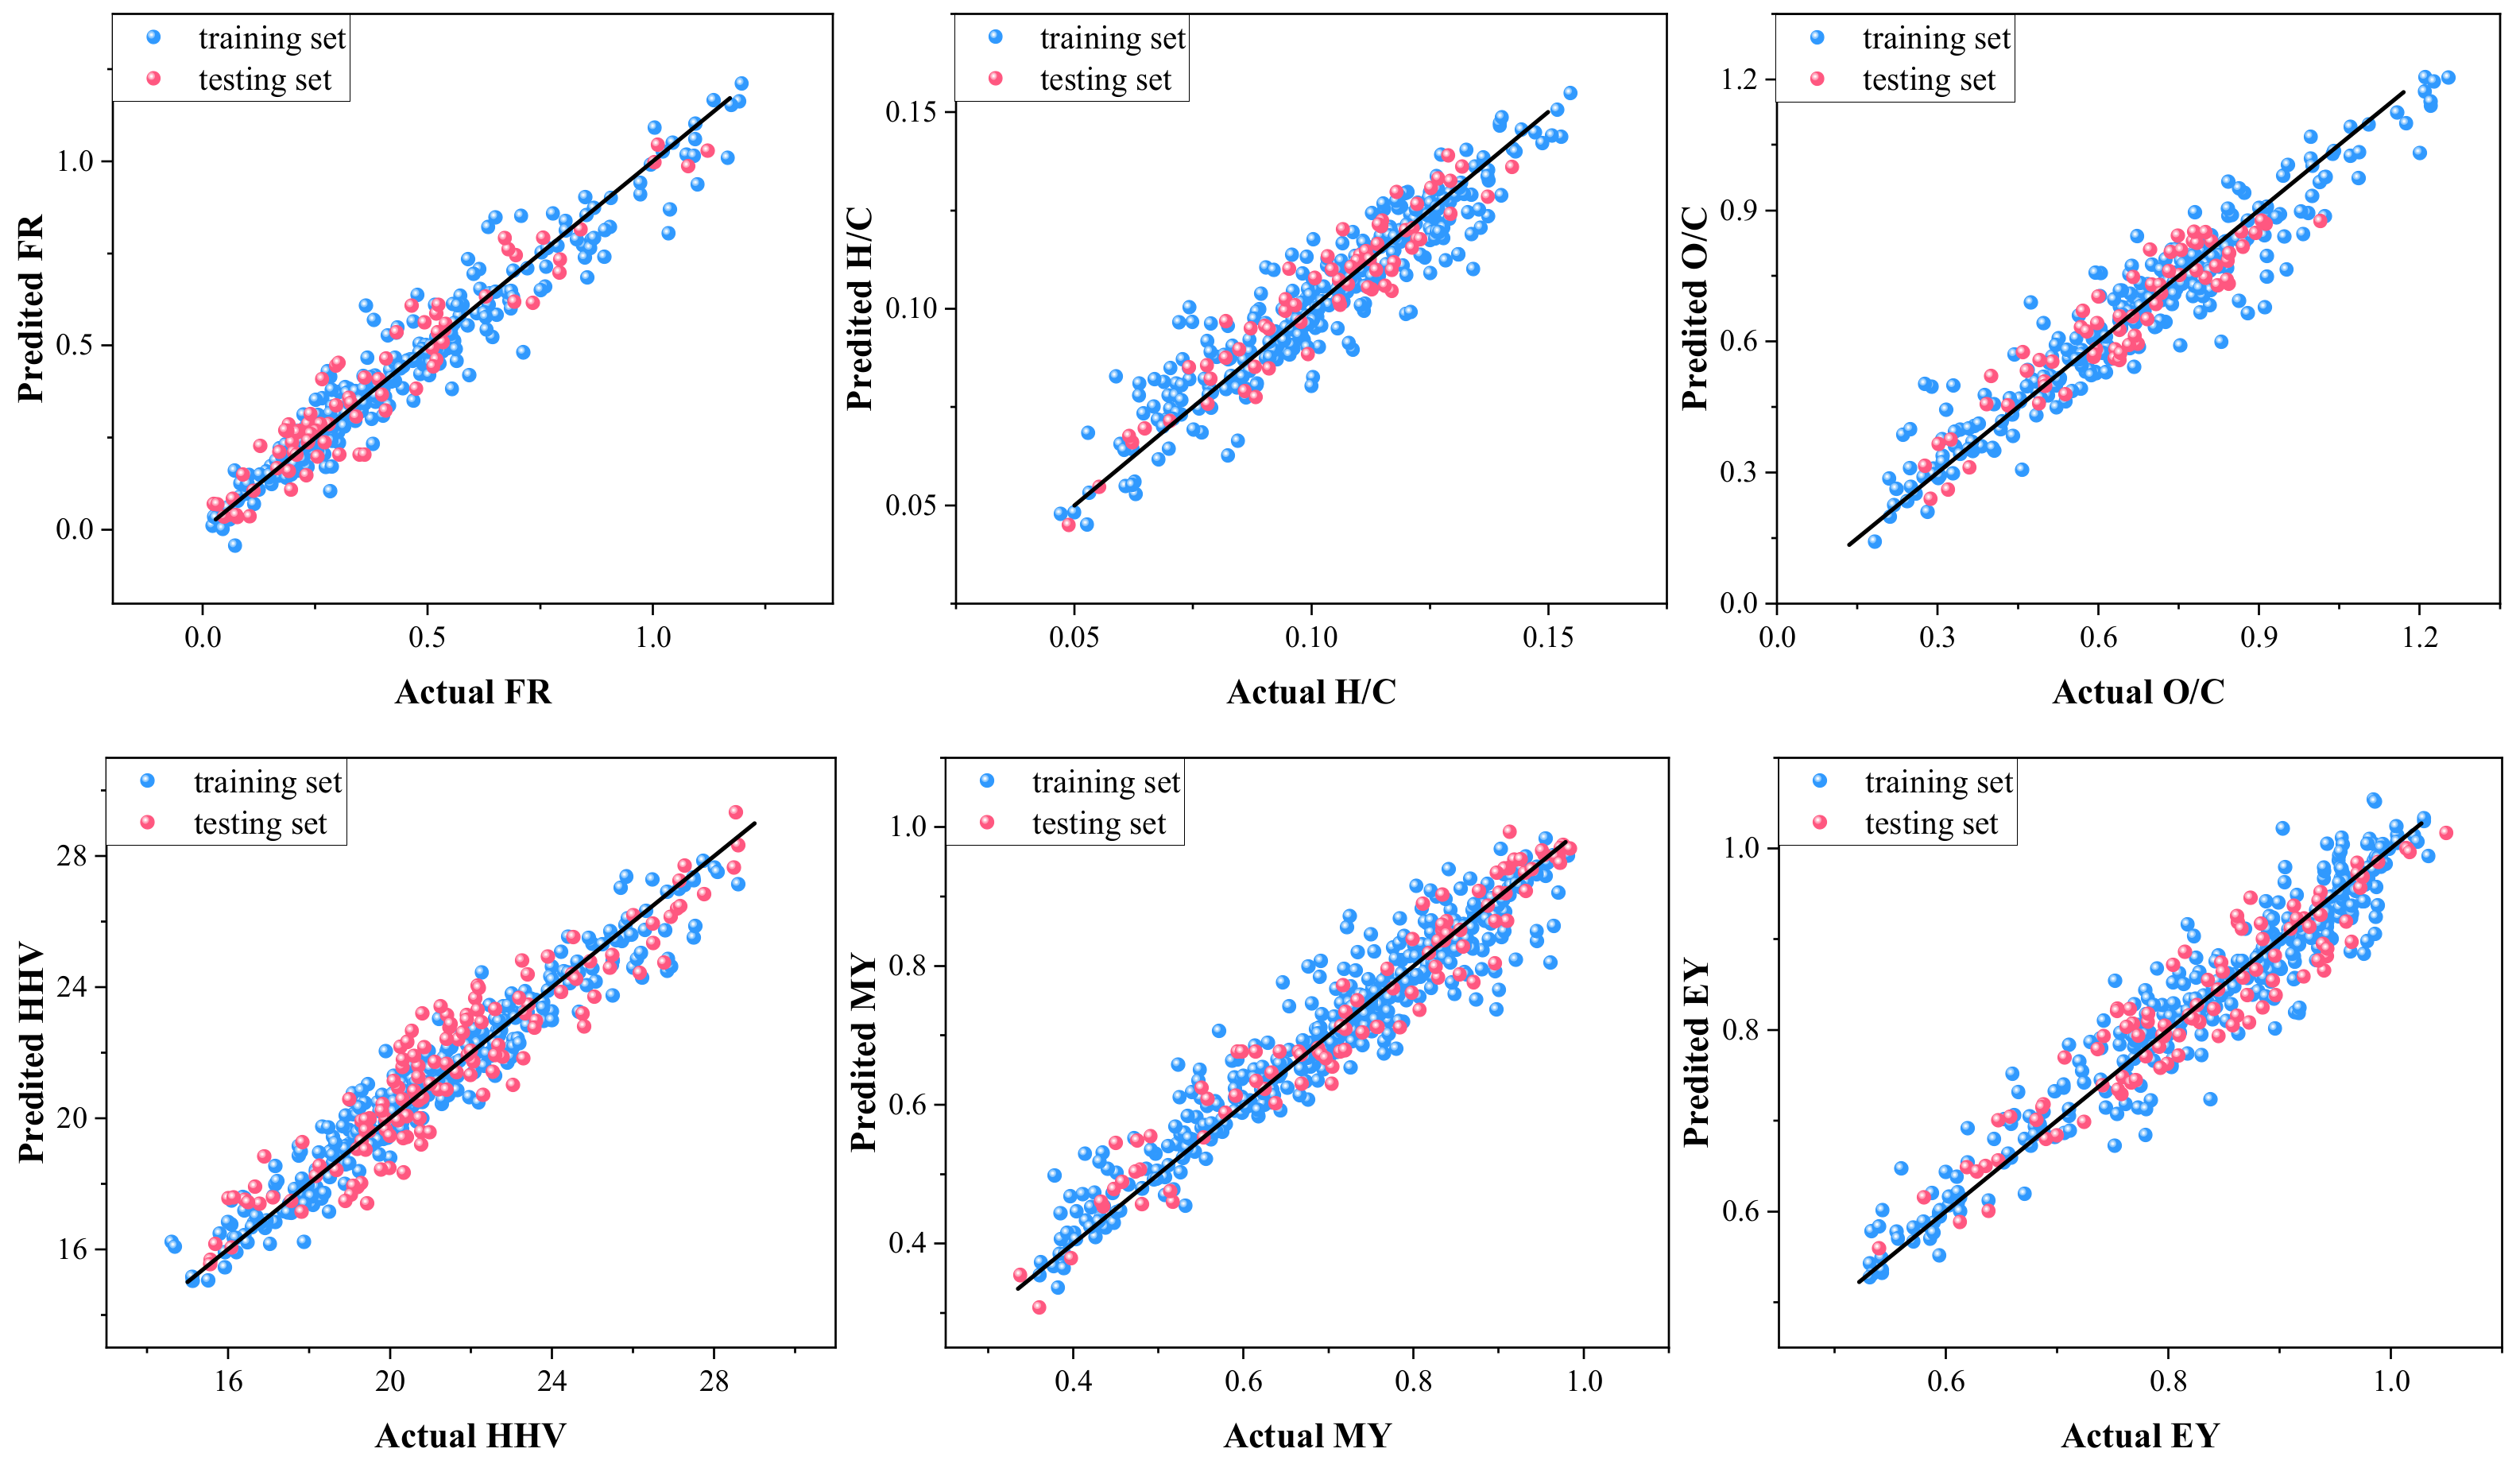
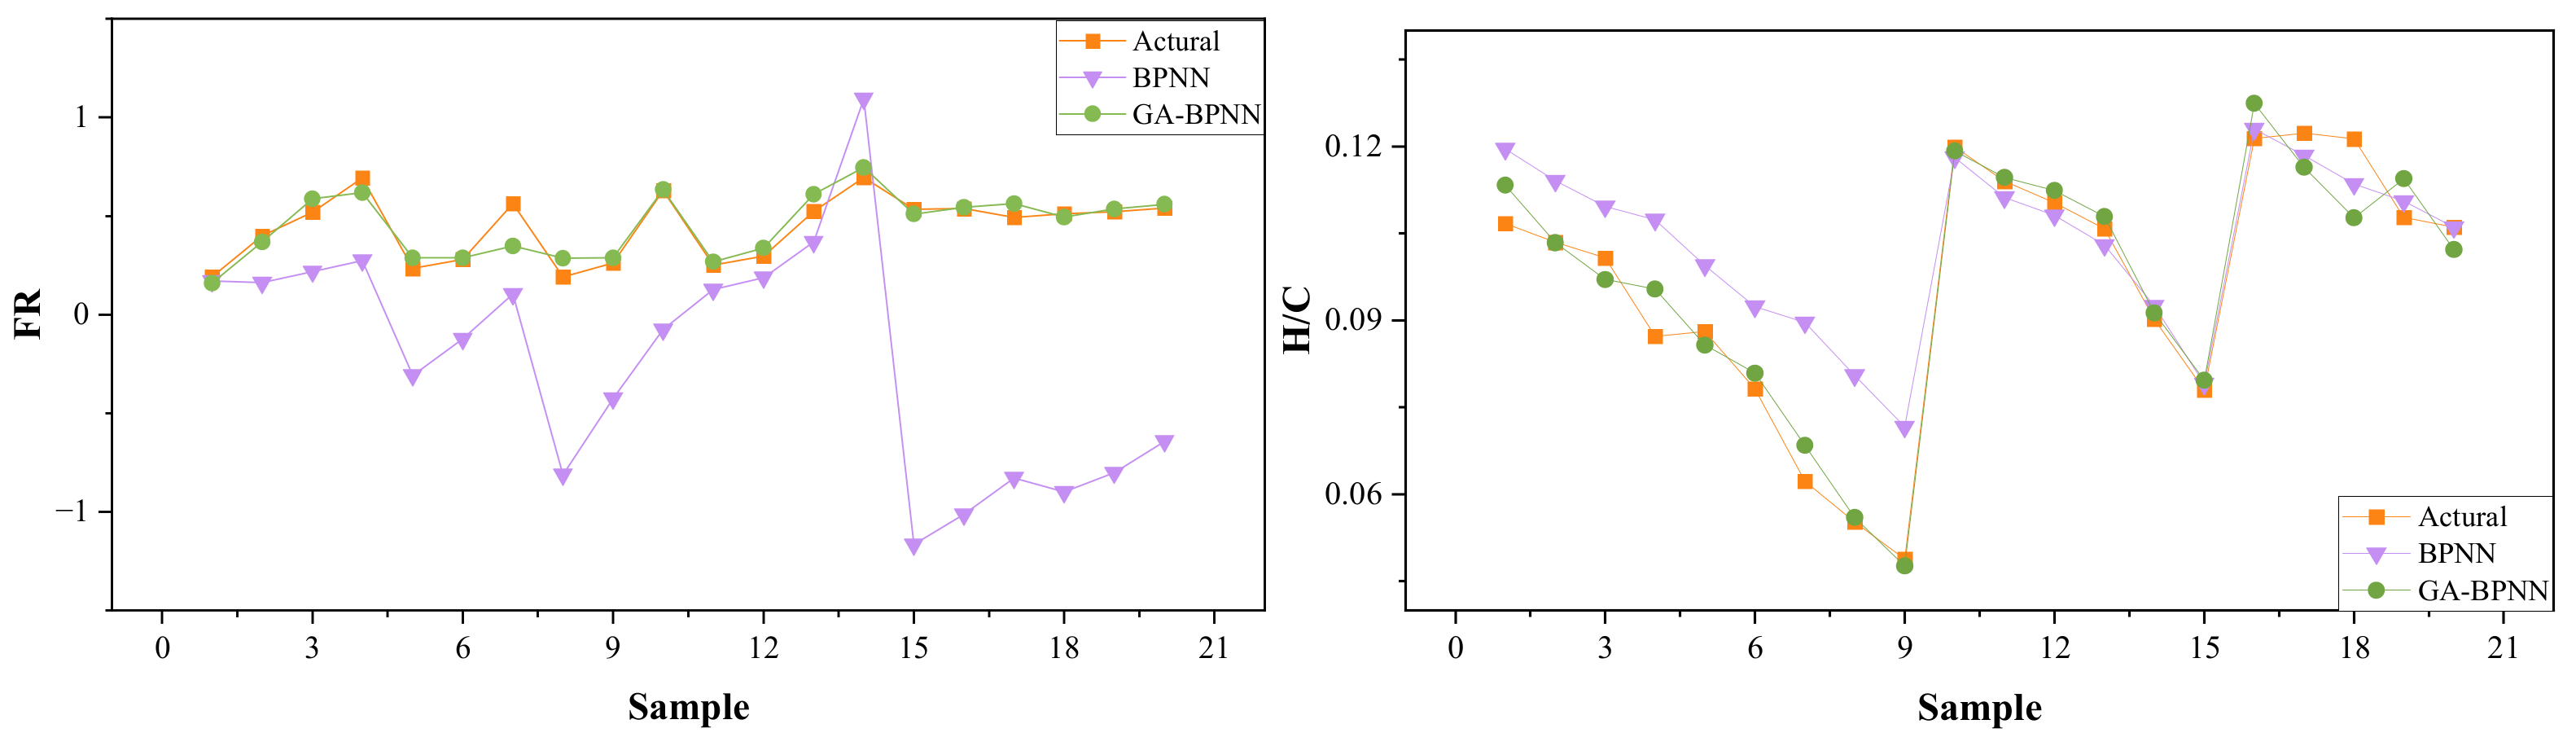
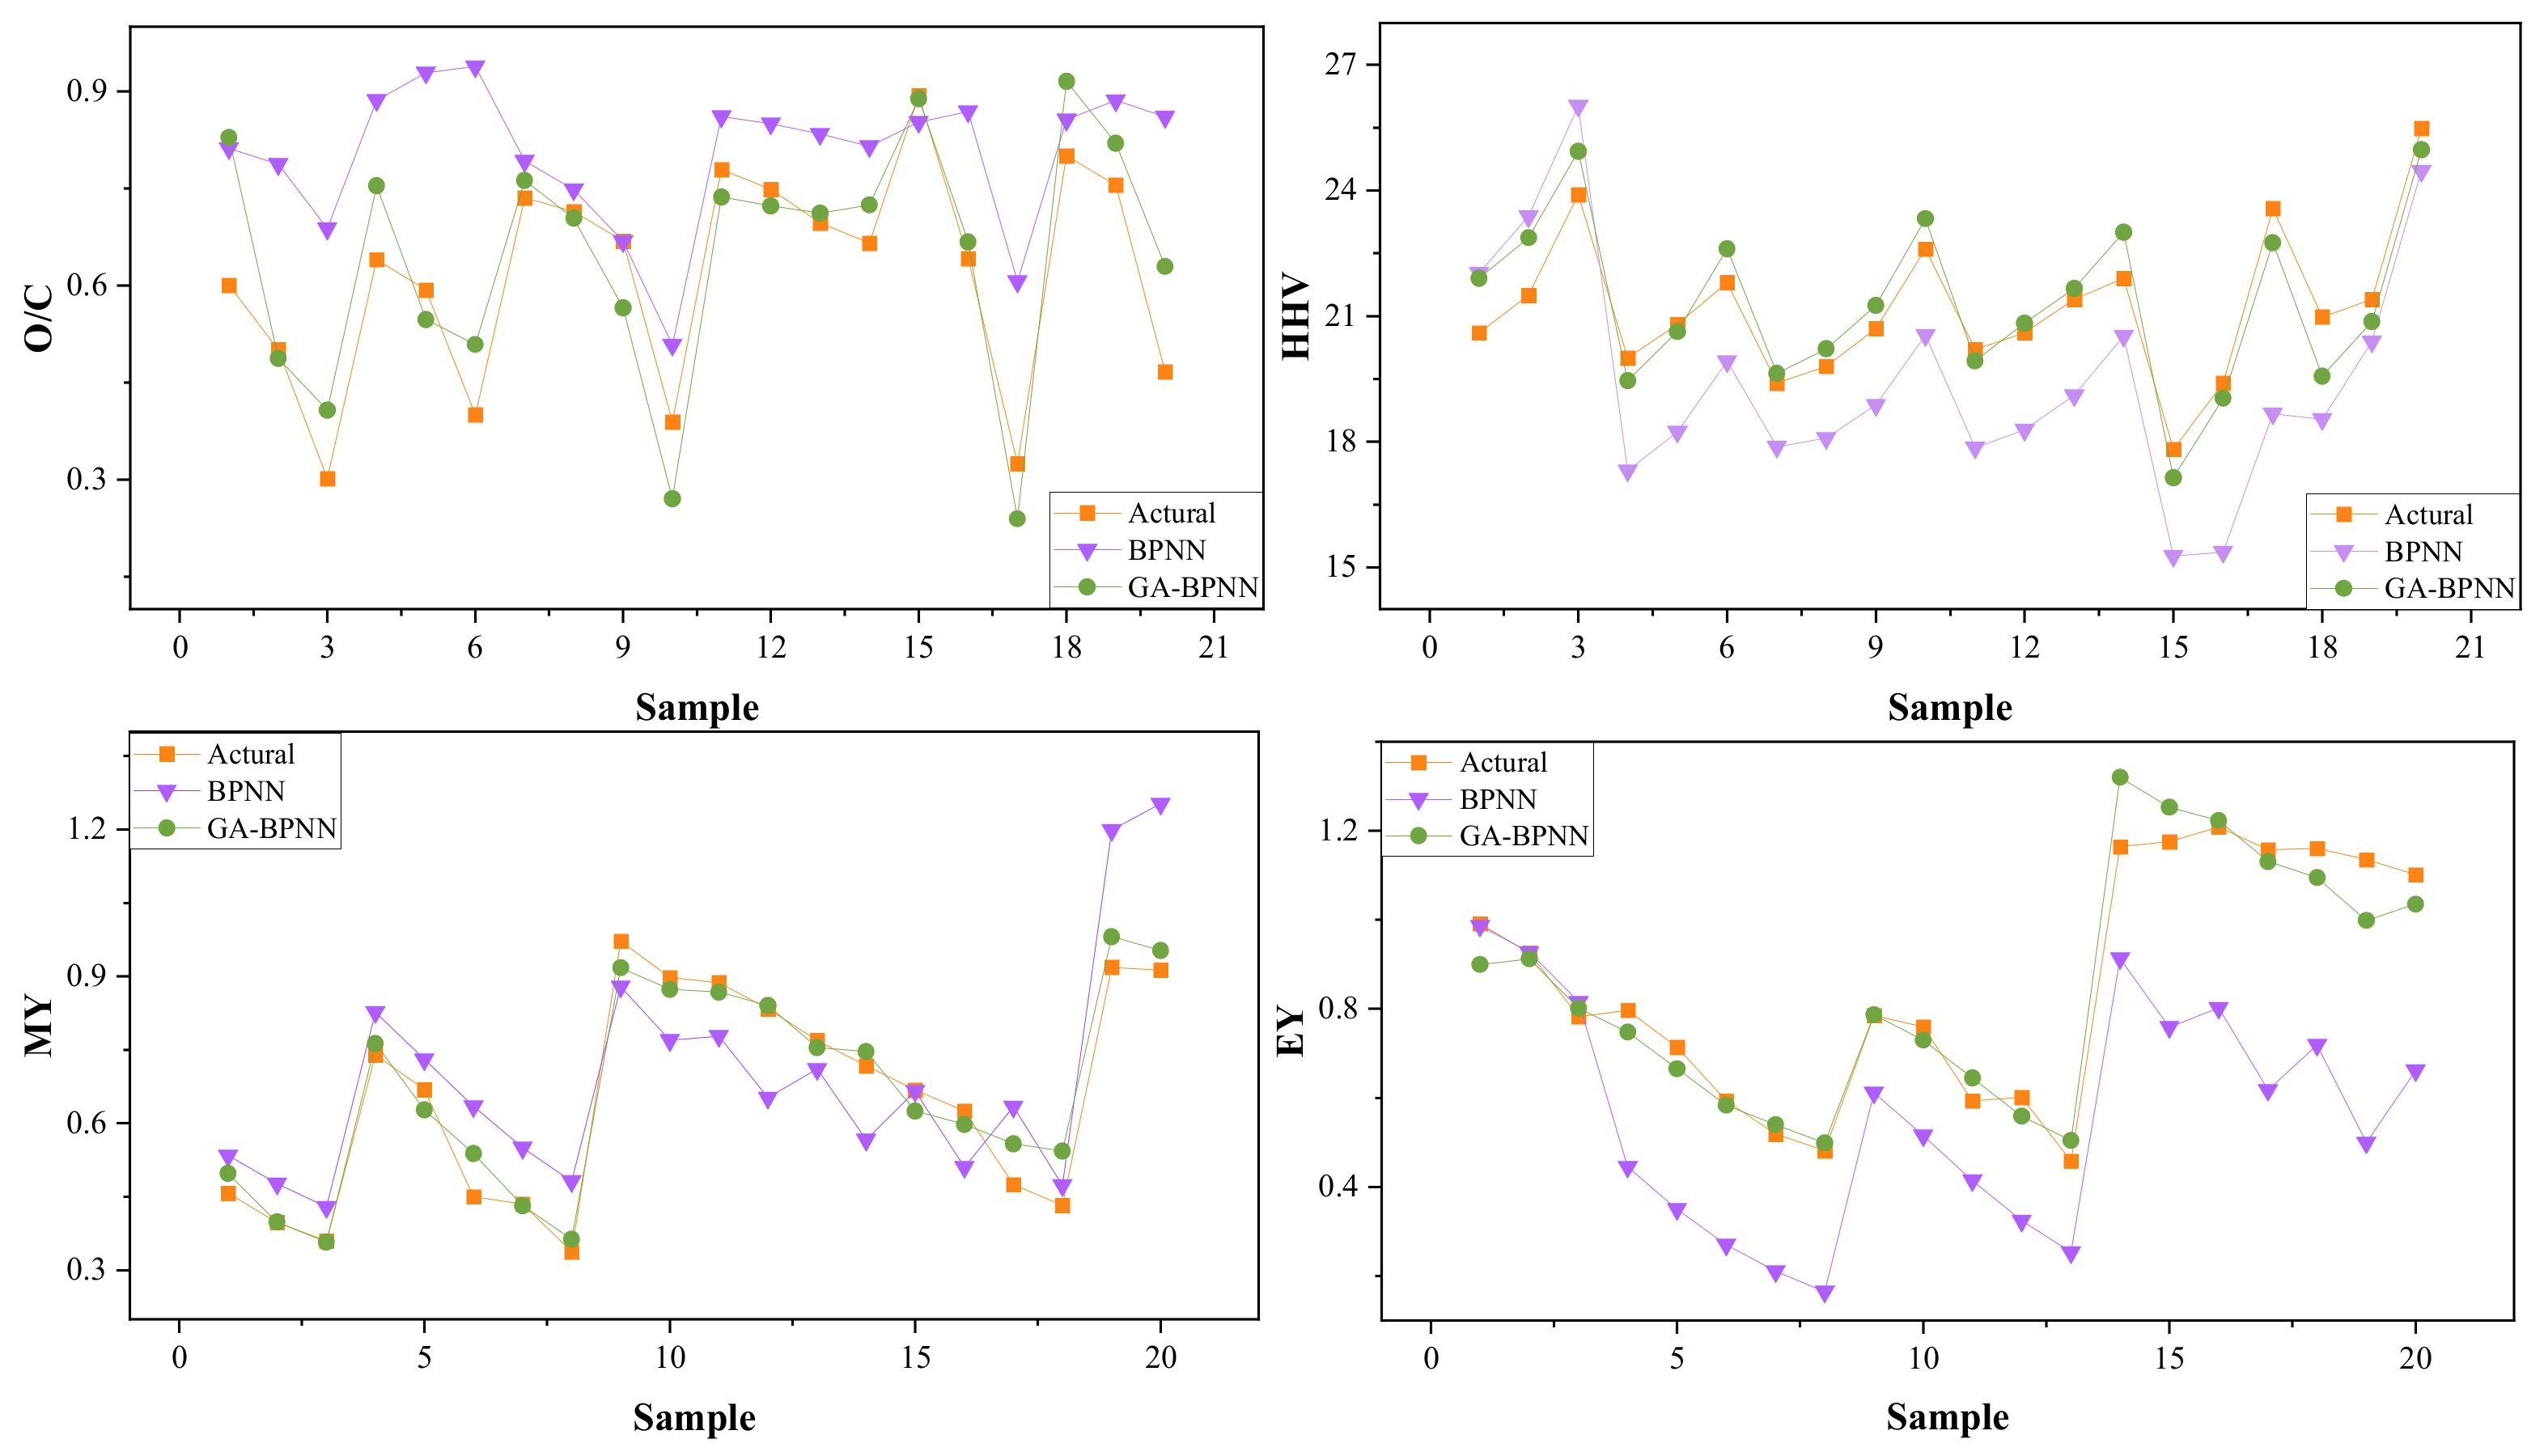
3.2. Model Prediction

Figure 5 presents the comparison between GA-BPNN predicted value and the experimental data for the training set and testing set, respectively. The corresponding BPNN predicted results are given in the supplemental materials (Figures S1 and S2). It can be seen that all the data points were densely distributed along the black line of y = x, implying the equivalence between the predicted values and the actual data. Therefore, the GA-BPNN model had the ability to perfectly predict the FR, H/C, O/C ratios and the HHV, MY, and EY of torrefied biomass from the proximate analysis results of the feedstock and torrefaction conditions for both the training set and the testing set with high precision. Besides, no outliner was observed for all the features. While for BPNN model, the data points, especially the ones for the testing set, were dispersedly distributed around the y = x line, as shown in Figures S1 and S2, implying that the BPNN model was obviously trapped in the local minima. Therefore, GA optimization greatly improved the prediction performance of the BPNN model.
The results of R2 and RMSE for the training set and the testing set using the GA-BPNN model are shown in Table 1, while those of BPNN are also given in the supplemental materials (Table S4) for comparison. The R2 values of the GA-BPNN model were larger than 0.91 for both the training set and the testing set of all the targets, implying the strong predictive ability of the model. When comparing the two models, GA-BPNN always exhibited much higher R2 values for both the training set and the testing set than the BPNN model, indicating that GA optimization significantly improved the stability and prediction accuracy of the BPNN model.
The RMSE values of all the features were fairly acceptable, implying the excellent performance of the GA-BPNN model. HHV had the highest RMSE values for training (0.7569) and testing (1.1879). Similarly, the highest RMSE values were also obtained for HHV prediction by the BPNN model (Table S4), with a value of 1.6033 for training and 1.8196 for testing.
Kartal et al. [25] examined the estimation capacity of the ANN model and ANFIS in modeling the torrefaction process. The R2 values of the training set and testing set for the two models were 0.8643 and 0.8296, 0.8233, and 0.9207, respectively. Onsree et al. [30,31] found that the GTB model exhibited higher accuracy in MY and HHV prediction than other models with R2 and RMSE values of 0.9153 and 0.0641, 0.9052, and 0.8086 for MY and HHV prediction, respectively. When predicting MY using the Kriging-ANN model, the values of R2 and RMSE for the training set and the testing set were 0.904 and 0.9099 [24]. Comparing the best results of R2 and RMSE for MY and HHV in the existing literature and the values obtained in this study, the GA-BPNN model exhibited more outstanding performance.
Figure 6 illustrates the data points of the output variables in the testing set obtained by BPNN and GA-BPNN prediction and their comparison with the actual values. Compared with BPNN, the curve behaviors of GA-BPNN predicted data were sufficiently consistent with the actual values, meaning that GA optimization was an efficient method to improve the prediction ability of the BPNN model.

4. Conclusions

An innovative ML model of BPNN hybridized with GA (GA-BPNN) was developed to predict the multiple properties of torrefied biomass for the fuel purpose in terms of FR, O/C, H/C ratios, HHV, MY, and EY based on the proximate analysis results of the feedstock and the torrefaction conditions. Compared with the original BPNN model, the GA-BPNN model exhibited a more excellent prediction performance for all the targets with the values of R2 higher than 0.91 and MASE less than 1.1879, indicating that GA optimization significantly improved the prediction ability of the BPNN model. In addition to the high precision, the GA-BPNN model had another prominent advantage of strong adaptability to various kinds of feedstock, whether the raw biomass has been dried or not. In the future, the effect of each feature on the targets will be investigated to reveal the torrefaction mechanism and to provide optimal parameters for torrefaction technique.

Supplementary Materials

The following supporting information can be downloaded at: https://www.mdpi.com/article/10.3390/en16031483/s1, Figure S1: Comparison of BPNN predicted and experimental data of training set; Figure S2: Comparison of BPNN predicted and experimental data of testing set; Table S1: Dataset; Table S2: Dataset description; Table S3: Pearson correlation coefficient between any two features; Table S4: R2 and RMSE results of the training and testing set using BPNN model.

Author Contributions

Conceptualization, X.L. and H.Y.; methodology, J.Y.; validation, H.Y.; writing—original draft preparation, X.L.; writing—review and editing, X.L.; visualization, F.L.; project administration, X.L.; funding acquisition, X.L. All authors have read and agreed to the published version of the manuscript.

Funding

This research was funded by the Natural Science Foundation of Jiangsu Province, grant number BK20210511.

Data Availability Statement

Not applicable.

Conflicts of Interest

The authors declare no conflict of interest.

References

  1. Seo, M.W.; Lee, S.H.; Nam, H.; Lee, D.; Tokmurzin, D.; Wang, S.; Park, Y. Recent advances of thermochemical conversion processes for biorefinery. Bioresource Technol. 2022, 343, 126109. [Google Scholar] [CrossRef] [PubMed]
  2. Liu, Y.; Rokni, E.; Yang, R.; Ren, X.; Sun, R.; Levendis, Y.A. Torrefaction of corn straw in oxygen and carbon dioxide containing gases: Mass/energy yields and evolution of gaseous species. Fuel 2021, 285, 119044. [Google Scholar] [CrossRef]
  3. González-Arias, J.; Gómez, X.; González-Castaño, M.; Sánchez, M.E.; Rosas, J.G.; Cara-Jiménez, J. Insights into the product quality and energy requirements for solid biofuel production: A comparison of hydrothermal carbonization, pyrolysis and torrefaction of olive tree pruning. Energy 2022, 238, 122022. [Google Scholar] [CrossRef]
  4. Lokmit, C.; Nakason, K.; Kuboon, S.; Jiratanachotikul, A.; Panyapinyopol, B. Enhancing lignocellulosic energetic properties through torrefaction and hydrothermal carbonization processes. Biomass Convers. Bior. 2022. [Google Scholar] [CrossRef]
  5. Lin, Y.; Chen, W.; Colin, B.; Pétrissans, A.; Lopes Quirino, R.; Pétrissans, M. Thermodegradation characterization of hardwoods and softwoods in torrefaction and transition zone between torrefaction and pyrolysis. Fuel 2022, 310, 122281. [Google Scholar] [CrossRef]
  6. Tu, R.; Sun, Y.; Wu, Y.; Fan, X.; Cheng, S.; Jiang, E.; Xu, X. The fuel properties and adsorption capacities of torrefied camellia shell obtained via different steam-torrefaction reactors. Energy 2022, 238, 121969. [Google Scholar] [CrossRef]
  7. Zhang, L.; Wang, Z.; Ma, J.; Kong, W.; Yuan, P.; Sun, R.; Shen, B. Analysis of functionality distribution and microstructural characteristics of upgraded rice husk after undergoing non-oxidative and oxidative torrefaction. Fuel 2022, 310, 122477. [Google Scholar] [CrossRef]
  8. Yu, S.; Kim, H.; Park, J.; Lee, Y.; Park, Y.K.; Ryu, C. Relationship between torrefaction severity, product properties, and pyrolysis characteristics of various biomass. Int. J. Energ. Res. 2022, 46, 8145–8157. [Google Scholar] [CrossRef]
  9. Lin, Y.; Zheng, N. Torrefaction of fruit waste seed and shells for biofuel production with reduced CO2 emission. Energy 2021, 225, 120226. [Google Scholar] [CrossRef]
  10. Li, J.; Pan, L.; Suvarna, M.; Tong, Y.W.; Wang, X. Fuel properties of hydrochar and pyrochar: Prediction and exploration with machine learning. Appl. Energ. 2020, 269, 115166. [Google Scholar] [CrossRef]
  11. Xiaorui, L.; Longji, Y.; Xudong, Y. Evolution of chemical functional groups during torrefaction of rice straw. Bioresource Technol. 2021, 320, 124328. [Google Scholar] [CrossRef]
  12. Chen, W.; Lin, B.; Lin, Y.; Chu, Y.; Ubando, A.T.; Show, P.L.; Ong, H.C.; Chang, J.; Ho, S.; Culaba, A.B.; et al. Progress in biomass torrefaction: Principles, applications and challenges. Prog. Energ. Combust. 2021, 82, 100887. [Google Scholar] [CrossRef]
  13. Niu, Y.; Lv, Y.; Lei, Y.; Liu, S.; Liang, Y.; Wang, D.; Hui, S. Biomass torrefaction: Properties, applications, challenges, and economy. Renew. Sustain. Energy Rev. 2019, 115, 109395. [Google Scholar] [CrossRef]
  14. Matin, S.S.; Chelgani, S.C. Estimation of coal gross calorific value based on various analyses by random forest method. Fuel 2016, 177, 274–278. [Google Scholar] [CrossRef]
  15. Samadi, S.H.; Ghobadian, B.; Nosrati, M. Prediction of higher heating value of biomass materials based on proximate analysis using gradient boosted regression trees method. Energy Sources Part A Recovery Util. Environ. Eff. 2021, 43, 672–681. [Google Scholar] [CrossRef]
  16. Bach, Q.; Chen, W.; Chu, Y.; Skreiberg, Ø. Predictions of biochar yield and elemental composition during torrefaction of forest residues. Bioresource Technol. 2016, 215, 239–246. [Google Scholar] [CrossRef]
  17. Lin, B.; Silveira, E.A.; Colin, B.; Chen, W.; Pétrissans, A.; Rousset, P.; Pétrissans, M. Prediction of higher heating values (HHVs) and energy yield during torrefaction via kinetics. Energy Procedia 2019, 158, 111–116. [Google Scholar] [CrossRef]
  18. Chen, W.; Hsu, H.; Kumar, G.; Budzianowski, W.M.; Ong, H.C. Predictions of biochar production and torrefaction performance from sugarcane bagasse using interpolation and regression analysis. Bioresource Technol. 2017, 246, 12–19. [Google Scholar] [CrossRef]
  19. Xu, J.; Huang, M.; Hu, Z.; Zhang, W.; Li, Y.; Yang, Y.; Zhou, Y.; Zhou, S.; Ma, Z. Prediction and modeling of the basic properties of biomass after torrefaction pretreatment. J. Anal. Appl. Pyrol. 2021, 159, 105287. [Google Scholar] [CrossRef]
  20. Guo, H.N.; Wu, S.B.; Tian, Y.J.; Zhang, J.; Liu, H.T. Application of machine learning methods for the prediction of organic solid waste treatment and recycling processes: A review. Bioresource Technol. 2021, 319, 124114. [Google Scholar] [CrossRef]
  21. Ullah, Z.; Khan, M.; Raza Naqvi, S.; Farooq, W.; Yang, H.; Wang, S.; Vo, D.N. A comparative study of machine learning methods for bio-oil yield prediction—A genetic algorithm-based features selection. Bioresource Technol. 2021, 335, 125292. [Google Scholar] [CrossRef] [PubMed]
  22. Sundui, B.; Ramirez Calderon, O.A.; Abdeldayem, O.M.; Lázaro-Gil, J.; Rene, E.R.; Sambuu, U. Applications of machine learning algorithms for biological wastewater treatment: Updates and perspectives. Clean Technol. Envir. 2021, 23, 127–143. [Google Scholar] [CrossRef]
  23. Aniza, R.; Chen, W.; Yang, F.; Pugazhendh, A.; Singh, Y. Integrating Taguchi method and artificial neural network for predicting and maximizing biofuel production via torrefaction and pyrolysis. Bioresource Technol. 2022, 343, 126140. [Google Scholar] [CrossRef] [PubMed]
  24. Ismail, H.Y.; Fayyad, S.; Ahmad, M.N.; Leahy, J.J.; Naushad, M.; Walker, G.M.; Albadarin, A.B.; Kwapinski, W. Modelling of yields in torrefaction of olive stones using artificial intelligence coupled with kriging interpolation. J. Clean Prod. 2021, 326, 129020. [Google Scholar] [CrossRef]
  25. Kartal, F.; Özveren, U. Prediction of torrefied biomass properties from raw biomass. Renew. Energ. 2022, 182, 578–591. [Google Scholar] [CrossRef]
  26. Kartal, F.; Özveren, U. Investigation of the chemical exergy of torrefied biomass from raw biomass by means of machine learning. Biomass Bioenergy 2022, 159, 106383. [Google Scholar] [CrossRef]
  27. Ozonoh, M.; Oboirien, B.O.; Daramola, M.O. Optimization of process variables during torrefaction of coal/biomass/waste tyre blends: Application of artificial neural network & response surface methodology. Biomass Bioenergy 2020, 143, 105808. [Google Scholar]
  28. García Nieto, P.J.; García-Gonzalo, E.; Paredes-Sánchez, J.P.; Bernardo Sánchez, A.; Menéndez Fernández, M. Predictive modelling of the higher heating value in biomass torrefaction for the energy treatment process using machine-learning techniques. Neural Comput. Appl. 2019, 31, 8823–8836. [Google Scholar] [CrossRef]
  29. García Nieto, P.J.; García Gonzalo, E.; Sánchez Lasheras, F.; Paredes Sánchez, J.P.; Riesgo Fernández, P. Forecast of the higher heating value in biomass torrefaction by means of machine learning techniques. J. Comput. Appl. Math 2019, 357, 284–301. [Google Scholar] [CrossRef]
  30. Onsree, T.; Tippayawong, N. Machine learning application to predict yields of solid products from biomass torrefaction. Renew. Energ. 2021, 167, 425–432. [Google Scholar] [CrossRef]
  31. Onsree, T.; Tippayawong, N.; Phithakkitnukoon, S.; Lauterbach, J. Interpretable machine-learning model with a collaborative game approach to predict yields and higher heating value of torrefied biomass. Energy 2022, 249, 123676. [Google Scholar] [CrossRef]
  32. Leng, E.; He, B.; Chen, J.; Liao, G.; Ma, Y.; Zhang, F.; Liu, S.; E, J. Prediction of three-phase product distribution and bio-oil heating value of biomass fast pyrolysis based on machine learning. Energy 2021, 236, 121401. [Google Scholar] [CrossRef]
  33. Tian, Z.; Gan, W.; Zou, X.; Zhang, Y.; Gao, W. Performance prediction of a cryogenic organic Rankine cycle based on back propagation neural network optimized by genetic algorithm. Energy 2022, 254, 124027. [Google Scholar] [CrossRef]
  34. Chiñas-Palacios, C.; Vargas-Salgado, C.; Aguila-Leon, J.; Hurtado-Pérez, E. A cascade hybrid PSO feed-forward neural network model of a biomass gasification plant for covering the energy demand in an AC microgrid. Energ. Convers. Manage. 2021, 232, 113896. [Google Scholar] [CrossRef]
  35. Li, J.; Zhu, X.; Li, Y.; Tong, Y.W.; Ok, Y.S.; Wang, X. Multi-task prediction and optimization of hydrochar properties from high-moisture municipal solid waste: Application of machine learning on waste-to-resource. J. Clean Prod. 2021, 278, 123928. [Google Scholar] [CrossRef]
  36. Tang, Q.; Chen, Y.; Yang, H.; Liu, M.; Xiao, H.; Wang, S.; Chen, H.; Raza Naqvi, S. Machine learning prediction of pyrolytic gas yield and compositions with feature reduction methods: Effects of pyrolysis conditions and biomass characteristics. Bioresource Technol. 2021, 339, 125581. [Google Scholar] [CrossRef]
  37. You, H.; Ma, Z.; Tang, Y.; Wang, Y.; Yan, J.; Ni, M.; Cen, K.; Huang, Q. Comparison of ANN (MLP), ANFIS, SVM, and RF models for the online classification of heating value of burning municipal solid waste in circulating fluidized bed incinerators. Waste Manage. 2017, 68, 186–197. [Google Scholar] [CrossRef]
  38. White, H.; Hornik, K.; Stinchcombe, M.B. Multilayer Feedforward Networks Are Universal Approximators. Neural Netw. 1989, 2, 12–28. [Google Scholar]
  39. Bagley, J.D. The Behavior of Adaptive Systems Which Employ Genetic and Correlation Algorithms Technical Report. Ph.D. Thesis, University of Michigan, Ann Arbor, MI, USA, 1967. [Google Scholar]
  40. Yuan, X.; Suvarna, M.; Low, S.; Dissanayake, P.D.; Lee, K.B.; Li, J.; Wang, X.; Ok, Y.S. Applied Machine Learning for Prediction of CO2 Adsorption on Biomass Waste-Derived Porous Carbons. Environ. Sci. Technol. 2021, 55, 11925–11936. [Google Scholar] [CrossRef]
  41. Conag, A.T.; Villahermosa, J.E.R.; Cabatingan, L.K.; Go, A.W. Energy densification of sugarcane leaves through torrefaction under minimized oxidative atmosphere. Energy Sustain. Dev. 2018, 42, 160–169. [Google Scholar] [CrossRef]
  42. Adeleke, A.A.; Odusote, J.K.; Ikubanni, P.P.; Lasode, O.A.; Malathi, M.; Paswan, D. Essential basics on biomass torrefaction, densification and utilization. Int. J. Energ. Res. 2021, 45, 1375–1395. [Google Scholar] [CrossRef]
Figure 1. BPNN model for prediction of fuel properties of torrefied biomass.
Energies 16 01483 g001
Figure 2. The working flow chart of the GA-BPNN model.
Energies 16 01483 g002
Figure 3. The statistical distribution of each variable in terms of the inherent properties of the raw biomass, the torrefaction conditions, and the fuel properties of torrefied biomass with violin plots.
Energies 16 01483 g003
Figure 4. Pearson correlation matrix between any two features.
Energies 16 01483 g004
Figure 5. Comparison of GA-BPNN predicted values and experimental data.
Energies 16 01483 g005
Figure 6. Comparison between the actual and BPNN/GA-BPNN predicted output variables of the testing set.
Energies 16 01483 g006aEnergies 16 01483 g006b
Table 1. R2 and RMSE results of the training and testing set using the GA-BPNN model.
FRH/CO/CHHVMYEY
R2 (training)0.99360.91560.99380.94320.97640.9634
RMSE (training)0.04040.00680.06720.75690.03510.0389
R2 (testing)0.96690.94710.95330.91280.93640.9661
RMSE (testing)0.06660.00560.07931.18790.05010.0721
Disclaimer/Publisher’s Note: The statements, opinions and data contained in all publications are solely those of the individual author(s) and contributor(s) and not of MDPI and/or the editor(s). MDPI and/or the editor(s) disclaim responsibility for any injury to people or property resulting from any ideas, methods, instructions or products referred to in the content.

