Article

A Bio-Inspired Cluster Optimization Schema for Efficient Routing in Vehicular Ad Hoc Networks (VANETs)

1
Department of Computer Science, Iqra National University, Peshawar 25100, Pakistan
2
Department of Mechatronics Engineering, University of Engineering and Technology, Peshawar 25100, Pakistan
3
Intelligent Information Processing Lab, National Centre of Artificial Intelligence (NCAI), University of Engineering and Technology, Peshawar 25000, Pakistan
4
Attock Campus, COMSATS University Islamabad, Islamabad 43600, Pakistan
5
Department of Computer Engineering, Sungkyul University, Anyang 14097, Republic of Korea
*
Author to whom correspondence should be addressed.
Energies 2023, 16(3), 1456; https://doi.org/10.3390/en16031456
Submission received: 10 October 2022 / Revised: 9 December 2022 / Accepted: 20 January 2023 / Published: 1 February 2023
(This article belongs to the Special Issue Development of Intelligent Electric Vehicles and Smart Transportation)

Abstract

:
Vehicular ad hoc networks (VANETs) are vital to many Intelligent Transportation System (ITS)-enabled technologies, including efficient traffic control, media applications, and encrypted financial transactions. Due to an increase in traffic, vehicular network topology is constantly changing, and sparse vehicle distribution (on highways) hinders network scalability. Thus, there is a challenge for all vehicles (in the network) to maintain a stable route, which would increase network instability. Concerning IoT-based network transportation, this study proposes a bio-inspired, cluster-based algorithm for routing, i.e., the intelligent, probability-based, and nature-inspired whale optimization algorithm (p-WOA), which produces cluster formation in vehicular communication. Various parameters, such as communication range, number of nodes, velocity, and route along the highway were considered, and their probaabilities were incorporated into the fitness function, hence resulting in randomness reduction. Results were compared to existing methods such as Ant Lion Optimizer (ALO) and Grey Wolf Optimization (GWO), demonstrating that the developed p-WOA technique produces an optimal number of cluster heads (CH). The results achieved by calculating the Packet Delivery Ratio (PDR), average throughput, and latency demonstrate the superiority of the proposed method over other well-established methodologies (ALO and GWO). This study confirms statistically that VANETs employing ITS applications optimize their clusters by a factor of 75, which has the twin benefits of decreasing communication costs and routing overhead and extending the life of the cluster as a whole.

1. Introduction

The development of devices has led to greater precision in terms of driver ease and safety, the introduction of intelligent systems, and the modification of vehicles in recent years in response to the growing concern for safety on the roads. The Intelligent Transportation System’s (ITS) core focus is on improving road traffic and safety data, which has benefited greatly from the proliferation of wireless and mobile networks. Some of the most common applications of ITS include real-time information on traffic routes, monitoring of traffic conditions to prevent accidents and collisions, and the collection of data on traffic volumes and congestion [1]. Other than safety-related data, users can also find information about features such as gas stations, toll booths, and Wi-Fi hotspots. Intelligent Transportation Systems include V-WLANs (Vehicular Wireless Local Area Networks) and V-Cell Networks (Vehicular Cellular Networks) (VCN). The first makes use of wireless local area networks (WLANs) to connect cars to the internet, whereas the second relies on fifth-generation (5G) mobile networks to do the same by allowing cars to tap into the existing cellular network’s infrastructure to access those services; in this case, the base station’s coverage area is measured in Cubicles (cells). When packets are transmitted with low latency and high bandwidth base stations in mind, new applications in the fields of VCN and V-WLAN are made possible; nevertheless, these systems are not utilized because their devices and infrastructures are costly, and their locations are less than ideal. Due to these discrepancies, the network’s efficiency suffers, and the connected vehicles’ range, latency, and connectivity are all severely limited. The high speeds at which vehicles (on highways) travel reduce the efficiency of the network and may cause radio links to be severed [2]. This is because the transmission range is shortened due to issues such as handoffs, message dropouts, and limited connectivity between cars. V-WLANs and VCNs have a big limitation in terms of cost-effectiveness because each vehicle must be linked and provided with an access point, which increases the price of the entire ITS [3]. Wireless nodes and the operator’s data transfer packages work together to provide cost-efficient answers [4]. It is more challenging to deliver messages to all vehicles at once due to the limitations of the vehicular network; as a result, only unicast and multicast communications are possible. Taking into account the aforementioned constraints, along with the desire to improve dependability and mobile connection, a new network called a vehicular network emerged [5]. Each car in this network is linked to every other car in the system as well as to a central unit and several access points along the road. Introducing standardized On-Board Units (OBUs) for automobiles that interface with the network has the potential to increase system reliability and coverage area while also lowering the system’s overall cost [6]. Numerous vehicle communication apps have an impact on drivers’ comfort and security in a variety of ways [7]. Several different kinds of ITS security applications can be distinguished in inter-vehicle communication based on the transmission method, which can be either geo mode or broadcast. Businesses that stay put on the road offer a variety of ITS security services, including freeway management, accident detection and avoidance, and climate control. Businesses typically employ unicast mode for sending sensitive information, and the same is true of the ITS application known as VRC (Vehicle-to-Roadside Communication) that these businesses offer. For example, ITS software could help cars detect and avoid collisions, assist drivers of frame vehicles, and describe their locations. Maintaining a safe distance from potential collisions or taking the necessary precautions is made easier when such vehicles are transported and used responsibly [8]. To enable the correct sending of various forms of security notifications, timely, reliable, and useful information is required. For instance, sending recordings of street conditions (such as heavy traffic, a catastrophic event, or fire) in advance of the route could allow drivers to make complex judgments in advance or reverse course [9]. In addition, many gas stations, weather reports, crisis management offices, intelligent letters, Internet connections, and other services are now integrated into vehicle-based communication and entertainment systems, making for a more pleasant and informative driving experience for everyone. Creating a system that allows direct messaging between cars is impossible without first ensuring a high level of service quality (QoS) [10], which includes its media services [11]. By eliminating the need for roadside equipment and allowing vehicles on the same network to exchange data directly, Vehicle-to-Vehicle (V2V) communication has benefited [12]. Traffic reliability, infotainment network security, and driver and passenger safety are among the primary motivations behind V2x application optimization. It has been established that V2x applications encounter several challenges regarding the appropriateness of decision-making and the consistency and dependability of data sharing across vehicles. Many of these difficulties can be overcome with the help of artificial intelligence (AI) techniques, in particular those that deal with decision-making in IoV systems [13]. By limiting the number of clusters, many bio-inspired routing (clustering) algorithms have been created to guarantee optimal route selection, facilitating fast V2V communication among vehicular networks without the need for centralized infrastructure to extend the life of the network. Delay mitigation, topological stability in networks, bandwidth optimization, and data aggregation are some of the issues investigated in this paper. The existing whale optimization algorithm for clustering was analyzed, and several changes are proposed to make it more effective. These include using probabilistic modeling, increasing the convergence factor to avoid local optima, and making smart adjustments to the algorithm’s self-adaptive weights. An intelligent probabilistic whale optimization strategy, inspired by the way whales locate and target prey, has been proposed in [14] as a way to deal with routing problems in the context of cluster deployment. The primary contribution is as follows:
  • A mathematical model of an intelligent whale optimization algorithm (p-WOA) for cluster optimization was developed.
  • Predictive vehicle initialization procedures to eliminate randomness were created.
  • Self-adjusted weights of each vehicle based on their fitness functions for optimal performance were designed.
  • A statistical analysis to evaluate the developed method with other well-established methods was performed.

1.1. Bio-Inspired Algorithms for VANETs

The performance and overall strength of the current ITS have improved due to many VANETs capabilities and applications. To apply the VANET technology, though, there have also been a number of difficulties and problems. Numerous studies in this domain concentrate on several fundamental aspects of vehicle networks, such as routing, safety, and space management. Recently, techniques based on biological inspiration have been utilized to enhance ITS frameworks already in use. Due to the following issues, bio-inspired cluster optimization has been implemented in vehicular ad hoc networks [15]:
  • Evolutionary algorithms effectively handle varied topological structures found in VANET networks because they are self-organizing and adaptable to different scenarios.
  • As they incorporate the highest level of exploration and exploitation, algorithms with bio-inspiration are more accurate at detecting the network’s damaged nodes. This offers a practical means of lowering security attacks on the network and, thus, improving its security.
  • Employing biologically inspired approaches has additional benefits, including their low complexity in handling a VANET’s computational issues, which include network overhead, packet delivery ratio, minimizing delay, and improving the convergence factor.

1.2. Background Research and Literature

Metaphor and natural metaheuristics are two examples of bio-inspired approaches that can be used to solve the NP-hard clustering optimization problems of in-vehicle networks [16]. In contrast to conventional metaheuristics, biologically inspired approaches or metaheuristics procedures are error-free. The techniques here take their cues from real-world examples, be they biological, natural, or human-made. These techniques are used to address a wide range of NP-hard optimization problems, and they do not require any prior knowledge of the problem domain. When combined with efficient search strategies, metaheuristics can quickly identify the optimal answer. It has been established that routing in a VANET is an NP-hard problem. Clustering algorithms form an integral part of several CBR methods [17]. Multi-Objective Problems (MOPs) are put into practice in the field of clustering [18]. In particular, these MOPs affect routing in ad hoc networks. The effectiveness of traditional QoS is affected by several variables. These include Packet Delivery Ratio (PDR), average end-to-end delay, and bandwidth utilization. Some of the benefits of clustering optimizations, as shown in Figure 1, include network topology stability, data aggregation, minimizing the number of clusters, bandwidth optimization, and efficient handover management [19].
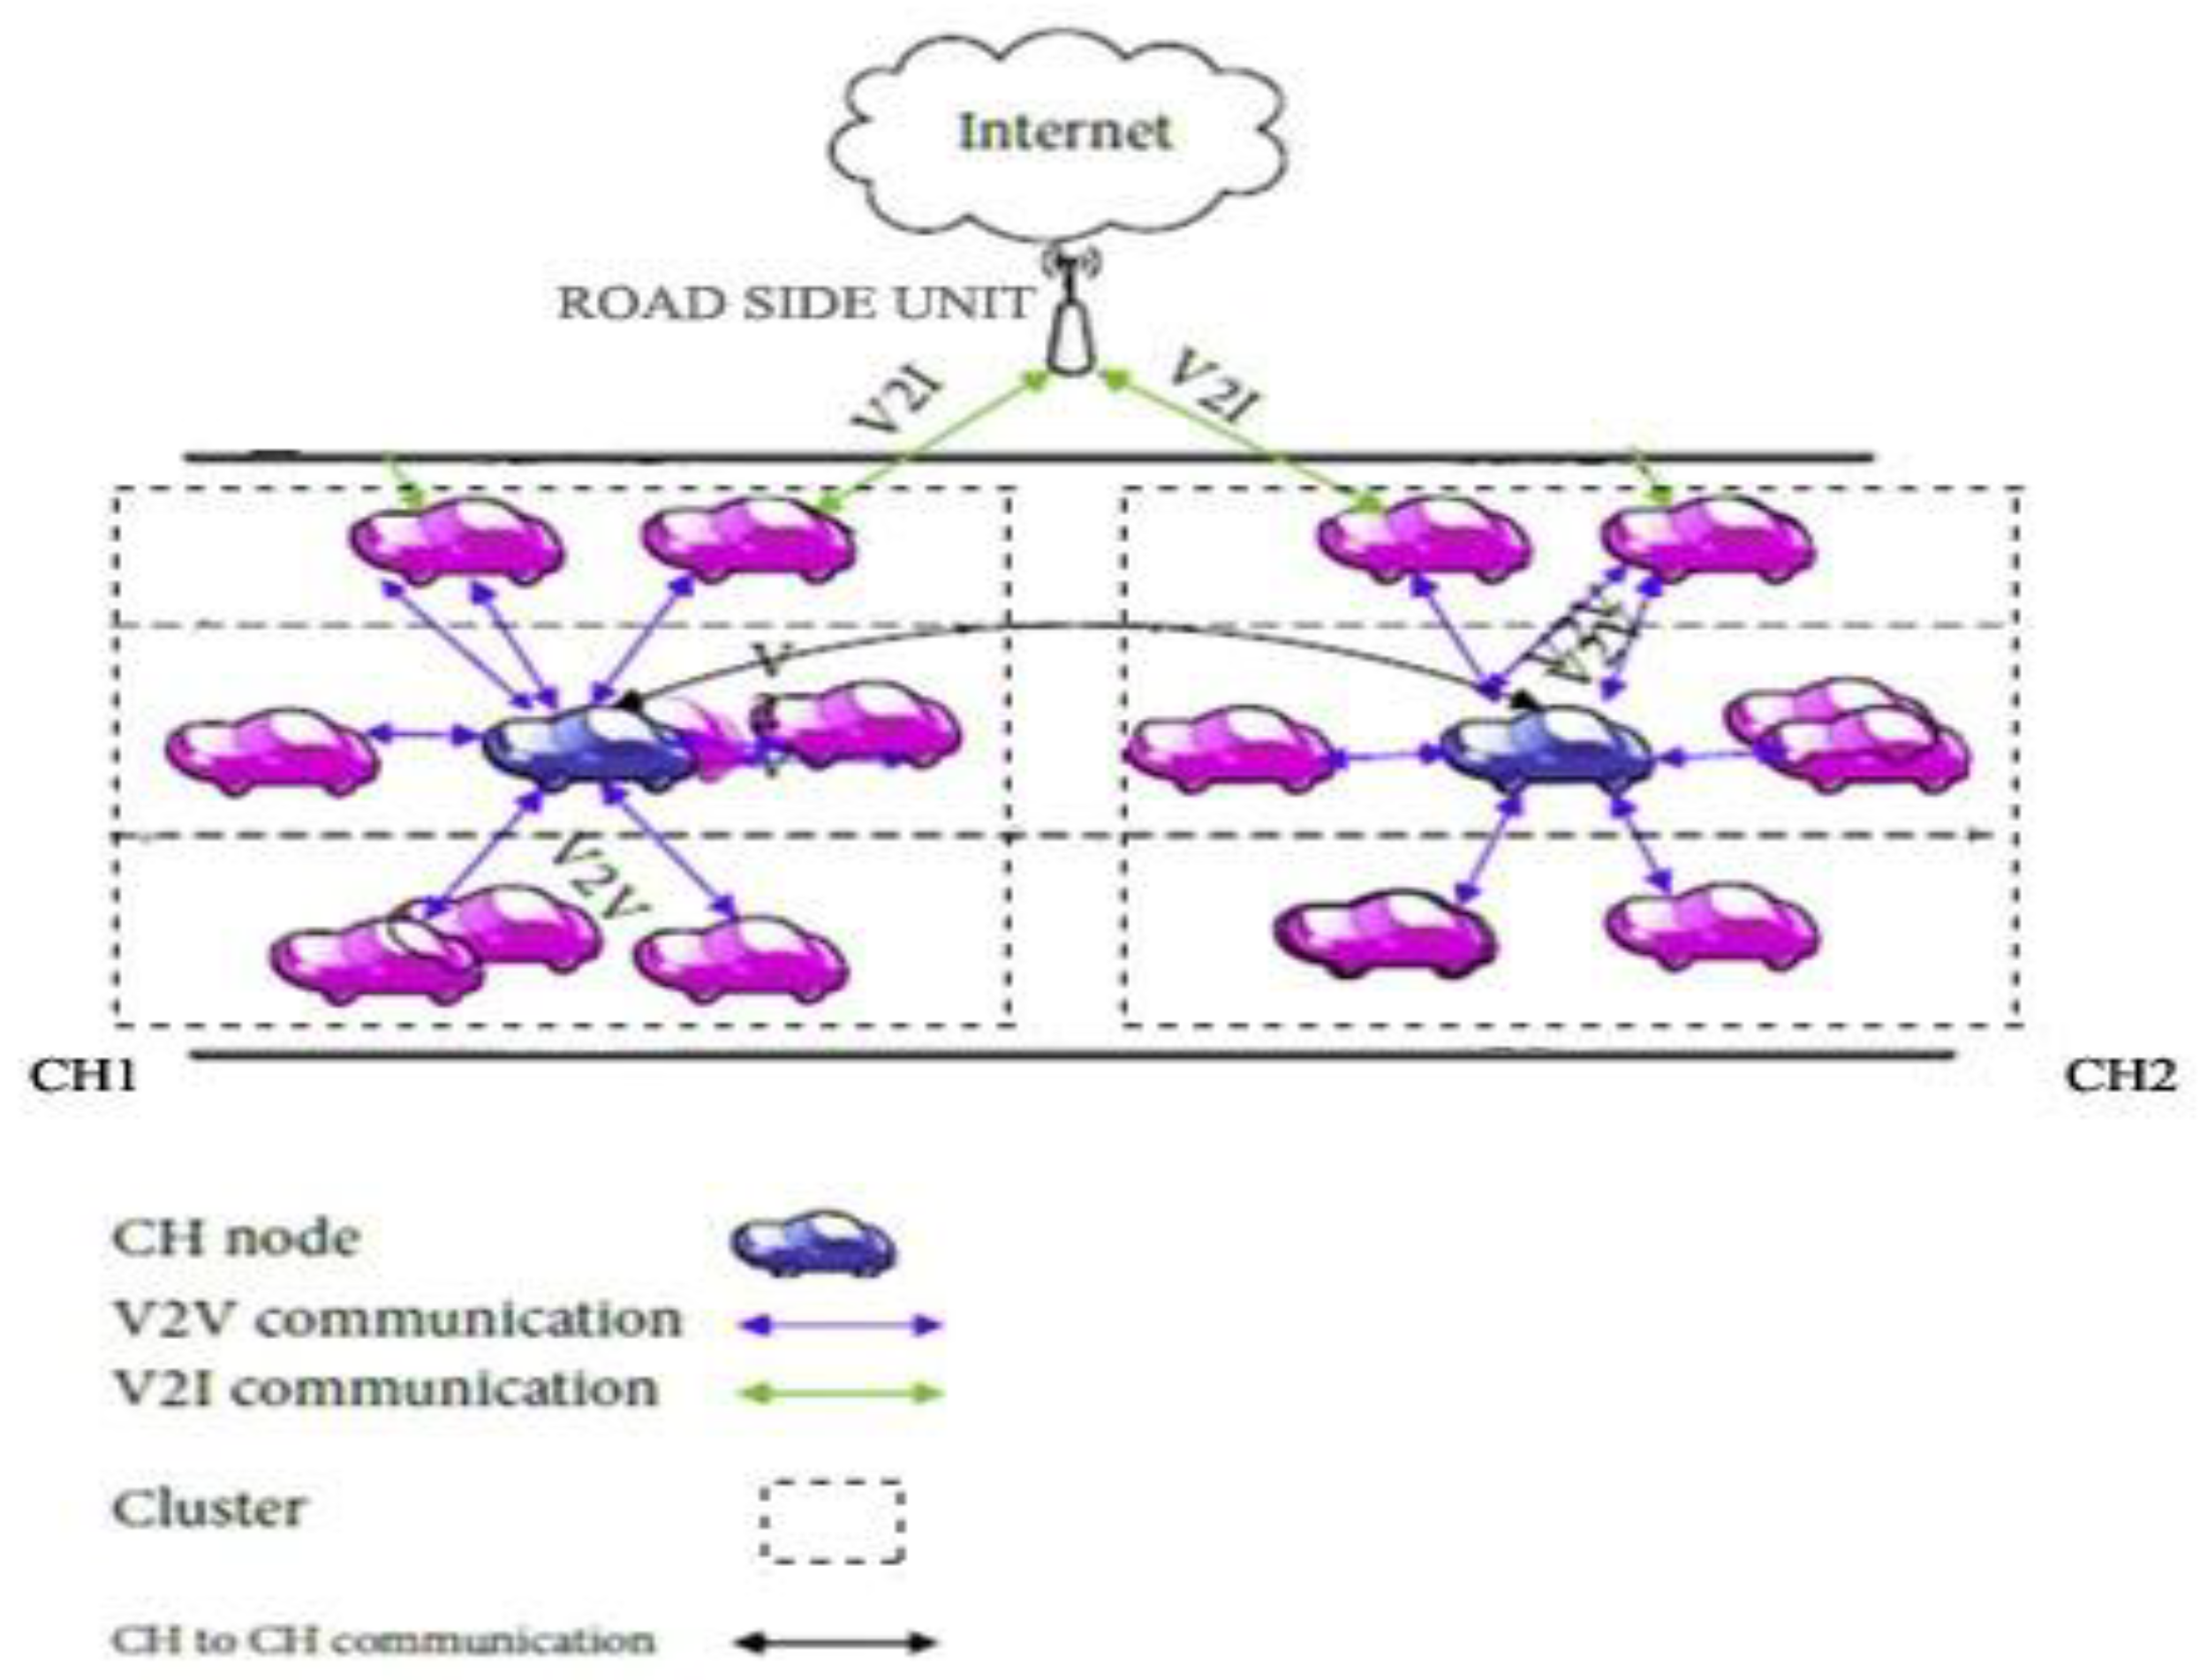
As cluster stability increases, the need for these optimization tasks decreases [20]. However, metaheuristics, particularly bio-inspired optimization techniques, can be used to increase cluster performance even though cluster stability is an NP-hard problem. Figure 2 [21] as shown below depicts the overall structure of VANETs.
This is seen in [22] when Levy’s expedition to free the Ant Lion Optimizer from local optima displaces the insects’ shambolic gait. To further strengthen the presentation of ALO, the population growth rate was used as an input to progressively adjust the deception dimensions by the 1/5 Principle, which includes changes to assembly precision, velocity, and control. The authors of [23] suggest implementing the lion optimization algorithm (LOA) in VANETs. It is a refined method of routing in automobile networks that use LOA QoS. Utilizing mobility from local to stronger networks, this technique enhances vehicle QoS pathfinding, which is inspired by a lion pride’s most important characteristics. The authors of [24] introduced the Bull Optimization Algorithm to facilitate routing based on reactive topologies. The Bull Optimization Algorithm is a property of all forms of directional finding that, when given a sufficient evaluation constraint, interferes with the production of optimal pathways for recovery and regular forwarding. One method for routing in VANETs that was proposed in [25] was based on water wave optimization (WWO). The optimal path was determined by simulating water-wave characteristics and taking into account QoS requirements, collision probabilities, and network congestion.
According to [26], a genetic algorithm-enhanced method based on the AODV was proposed (G-AODV). It was a safe method of backup routing that is used only when necessary, and it helped strengthen the security of the connections between nodes and other networks. To improve VANET multicast routing performance, [27] recommended emulating bee-life behavior (BLA). It was presented to address the NP-complete Quality-of-Service Multicast Routing Problem (QoS-MRP) in VANETs. Using preexisting paths that maximize bandwidth utilization while minimizing cost and time, the ABC Algorithm determined the optimal multicast tree between the sender and the receiver. The BLA took cues from bee activities such as breeding and foraging to generate new routes predicated on the BLA’s tolerance of scavenging in the surrounding area. The ACO-based clustering technique presented in [28] was a novel CACONET (Constrained Ad Hoc Network) algorithm. This algorithm addressed the issue of VANET scalability. The CACONET minimized cluster size while maintaining CH stability, which resulted in less strain on the network’s infrastructure. The authors of [29] presented a moth–flame-based clustering algorithm called CAMONET. This approach utilized Moth–Flame Optimization (MFO) to guarantee a high cluster lifetime and an ideal CH number, two crucial components of a reliable network. This concept was inspired by the moths’ ability to track their flight path by watching the moonlight as they travel at night. A moth keeps an eye out for the flaming object in space and reports its whereabouts. By determining the CNs’ speeds, directions, and communication ranges, this phenomenon made it possible to trap CHs and reduce the network’s cluster density while simultaneously taking advantage of the moth’s position and intended capabilities to improve location via a diminishing aspect. Consequently, the most effective clusters for dependable networking were amassed. When using a wide range of densities and transmission distances, CAMONET outperformed CACONET. Node clustering in VANET, based on the work of Grey Wolf, was presented in [21] (GWOCNET). GWOCNET made use of the hunting and social habits of grey wolves to find the optimal cluster size. A vehicle’s heading, velocity, and location can all be determined with a cluster number, which must be optimized. The GWOCNET model minimized the linear factor convergence discovered during various phases of wolf hunting by using methods such as social ranking for hunting guidance, seeking out prey, highlighting prey, and attacking prey. Increasing the quality of all optimization methods, including the selection of the alpha wolf, requires the development of the election of the leader wolf. The suggested method built the optimal number of clusters across all zones and communication distances, outperforming both CLPSO and MOPSO [30]. For VANETs, the authors of [31] took cues from fireflies and suggested a multi-objective weighted clustering method (RWCP-MFO). This algorithm used the metaheuristics of the Firefly Algorithm, which was inspired by the fluttering movements and light-intensity observations of fireflies, to optimize the RWCP parameters while accounting for the vehicles’ speeds, directions, reputations, land identifiers, and neighborhood sizes. Multiple agents gathered information at a secure urban monitoring site, as proposed in [32] (Datataxis). When E. coli infiltrated a network, it disrupted a topology-based unicast routing protocol. According to [33], glow-worm routing packets were propagated via glow-worm swarm optimization (GSO) to provide numerous routing paths. The GSO approach made use of new phenomena of required data that were node-specific. The ED between the current hop and the source, as well as the number of cars present, were what established the fitness value. Following a calculation of the fitness value, the luciferin was optimized with each successive hop. By utilizing inter-layer approaches, a traffic flow system, and an AI-based system for cluster selection that took into account cluster size, network density, and CN velocity, the authors of [34] presented an intelligent-based clustering algorithm in VANETs (IBCAV) that enhanced directional accuracy. A new clustering strategy for VANETs was created in [35]: a highway-transmittable environment. To establish reliable groups, the authors suggested an algorithm based on the Ant Colony System (ACS) called ASVANET. By taking into account travel time, road quality, and mobility congestion, the authors of [36] proposed an ACO- and PSO-based synchronized self-motivated direction-finding optimization strategy to aid the central decision-making routing system. These evaluations showed how effective PSO and ACO algorithms are at cutting down on travel time. The authors proposed using a whale optimization-based cluster optimization technique to achieve an optimal number of clusters through fine-tuning a wide variety of parameters, including communication range, node count, network size, and load balancers. The efficiency and longevity of the network were both boosted. The authors of [22] suggested a method for optimizing the number of clusters in a transportation network that takes its cues from the behavior of wolves in their search for food or prey. The convergence factor and total network overhead were both optimized with the suggested technique. A unique optimization approach, suggested by the authors of [37] and based on the behavior of ant lions during foraging, delivered the optimal solution (cluster head) within a local optimum (limited coverage area).
This study evaluated the WOACNET [15] and proposes a new p-WOA strategy for an optimal number of clusters for efficient routing amongst vehicles, based on the requirements of cluster optimization in VANETs, by increasing the nodes’ density to their maximum range, expanding the network area, and boosting the load balancing factor. In addition, a probabilistic technique was created for the initialization of vehicles on the road. The paper’s contents are as follows: In the second section, we discuss a summary of materials and methods used, followed by a discussion of simulations based on probabilities. Section 3 details the outcomes and comparative statistical analysis. Section 4 comprises discussion, and the final portion, Section 5, concludes the paper.

2. Materials and Methods

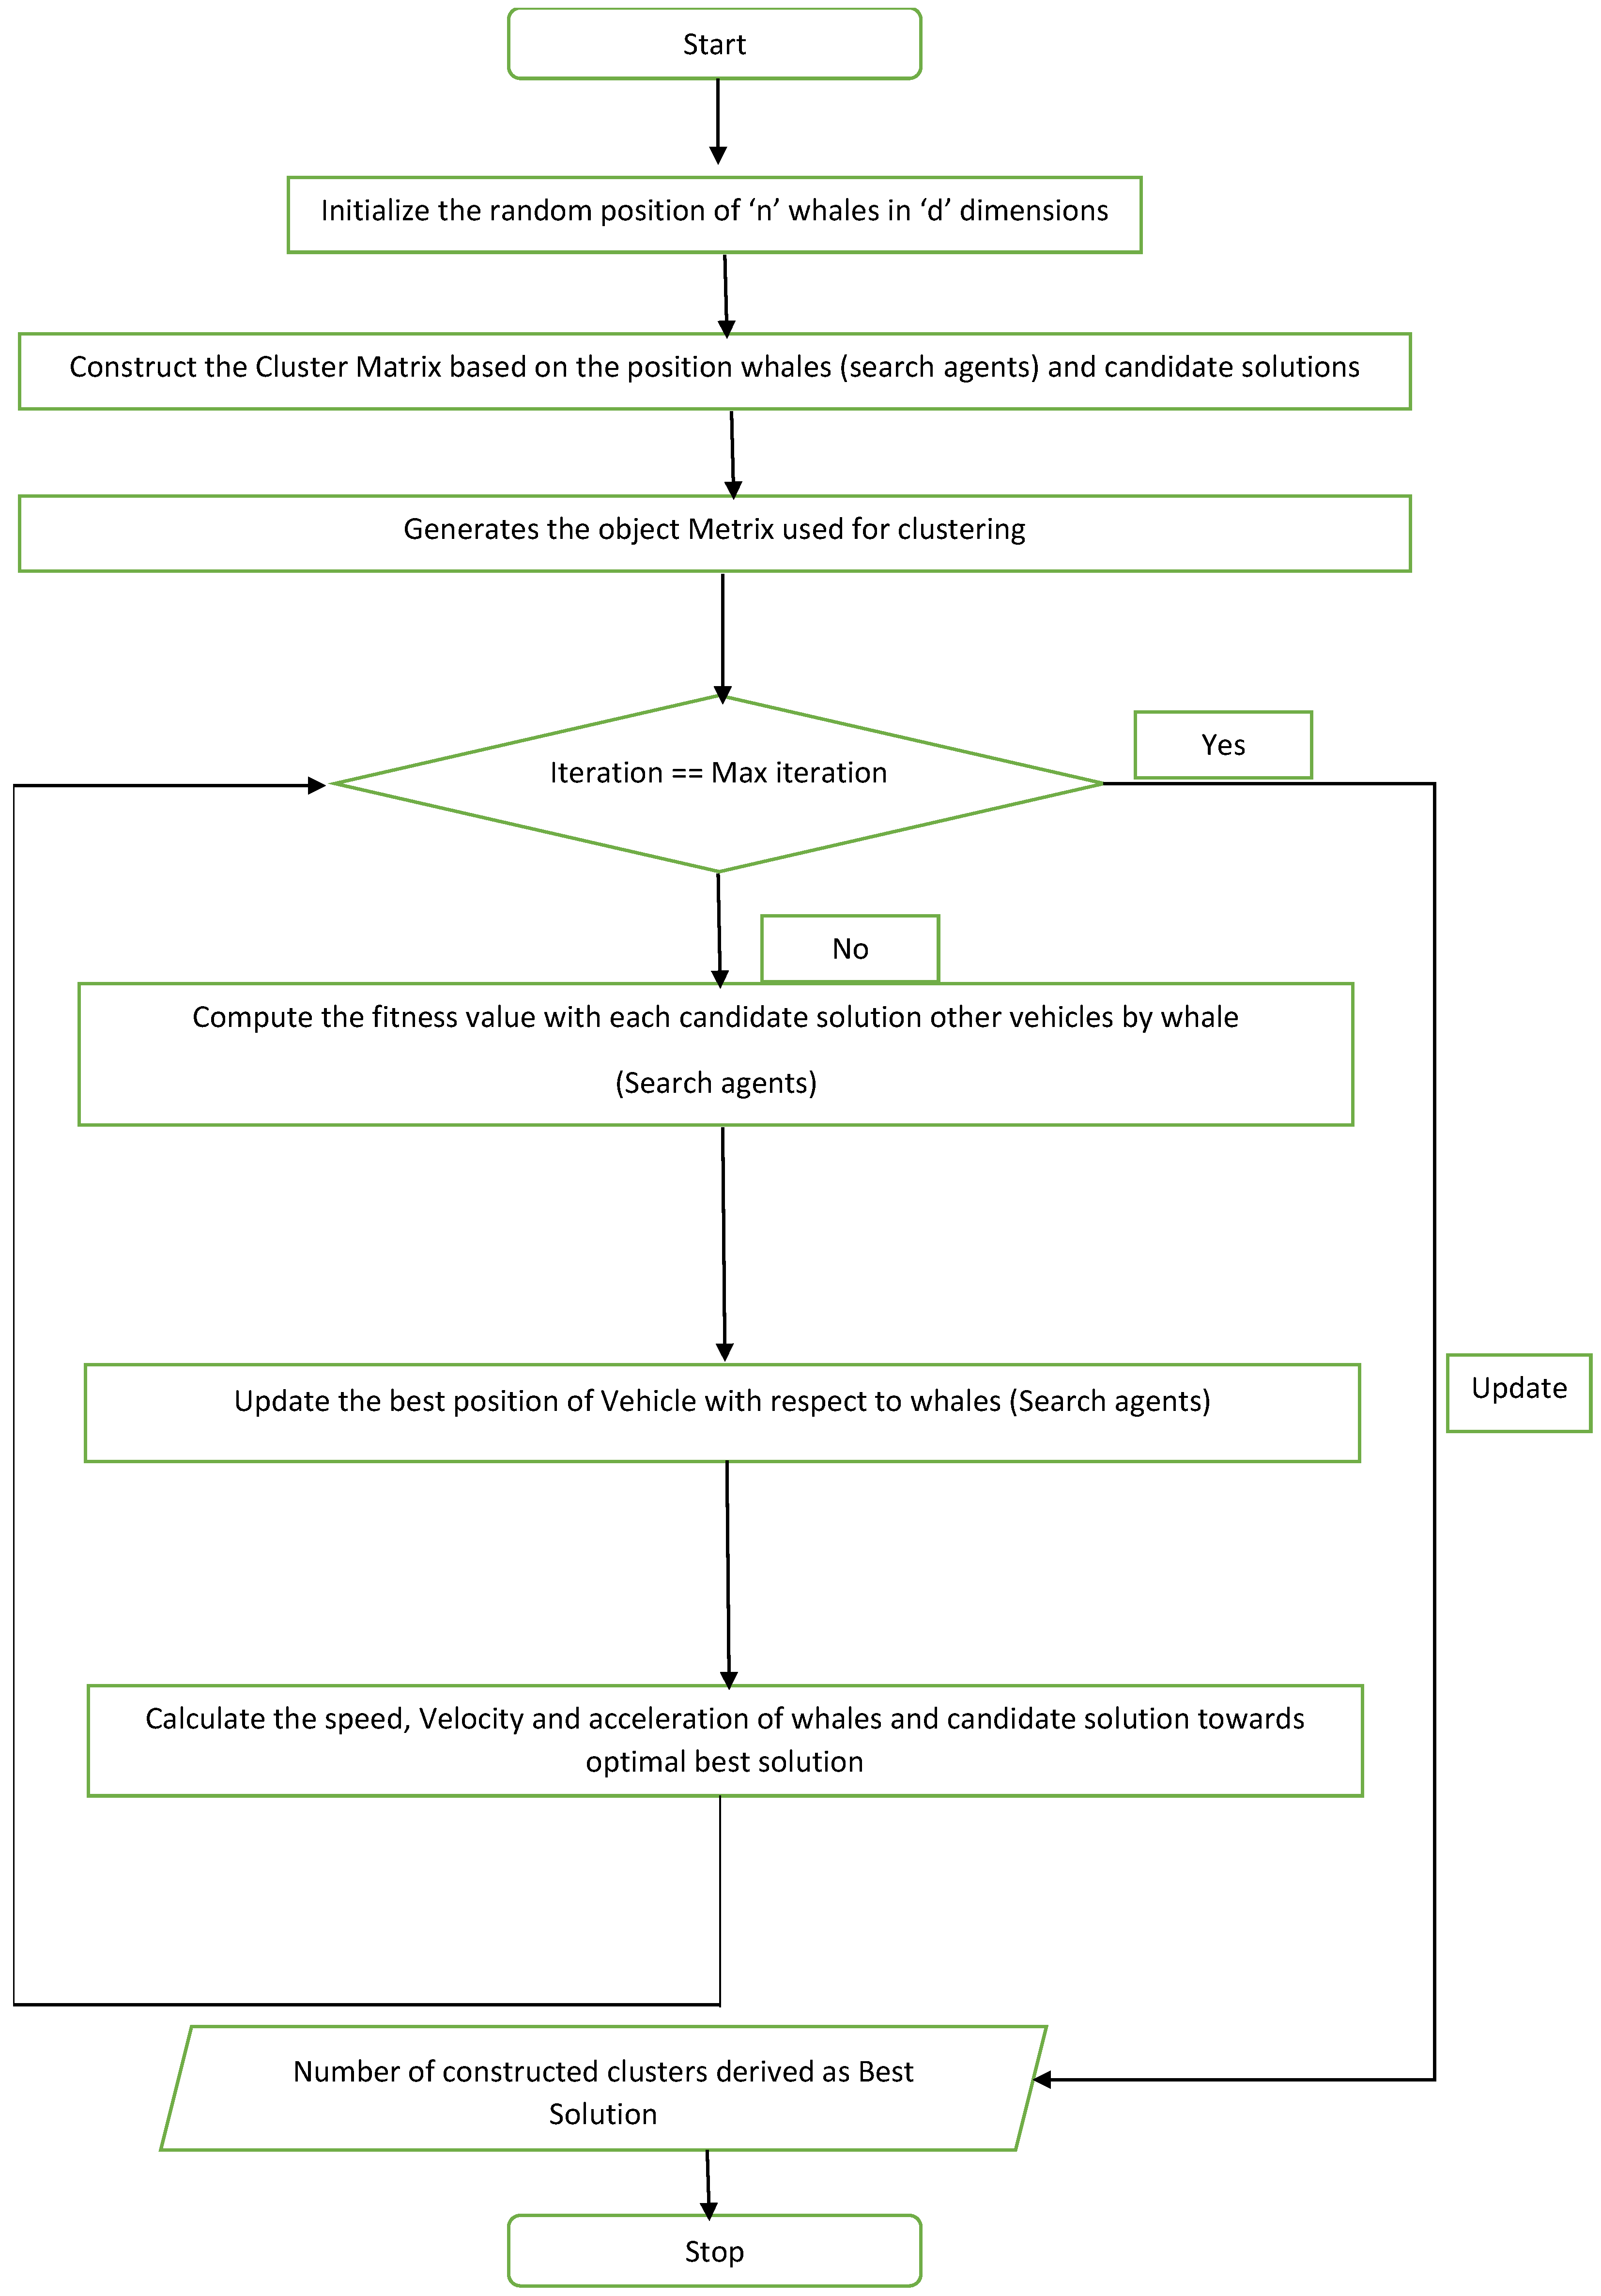
Routing protocols may be limited in scope or rely on a small set of parameters if they are expected to fulfill all of the critical requirements for information exchange. To solve all of these issues with ITS in one fell swoop, this study proposes an intelligent cluster optimization approach (p-WOA), including efficient cluster formation, packet delivery ratio, average throughput, and latency, and involves probabilistically seeding the road with a single vehicle, increasing the number of cars to 100, and accounting for the time and resources required to run such a simulation. To optimize the paths taken by data messages as they travel through the network, a clustering technique that takes its cues from the laws of probability was employed. Figure 3 depicts the suggested framework with an emphasis on inputs and outputs:
The proposed framework works as follows:
  • Representation: Individuals inside evolutionary algorithms are defined in representation.
  • Evaluation Function: The fundamental for enabling improvements is the identification of a fitness function or maximized function. To determine the legitimacy of a solution, this threshold value must be attained.
  • Population: This contains every potential resolution.
  • Parent Selection Mechanism: This identifies solutions that can serve as the foundation or parents for the following generation.
  • Variation Operators: To separate the novel solutions from the old ones, two variation operators, mutations and rearrangements, were used.
  • Selection Mechanism: This works exactly like parent selection, only it happens in the following cycle of evolution when the candidate solution is mature enough to be judged.
  • Best Solution: Once all of the fitness functions are evaluated, the cluster head is selected based on the best packet Delivery Ratio, latency, and average throughput.

2.1. The p-WOA Algorithm for Intelligent Whale Optimization

To decrease cluster formation processing time, computational cost, network overhead, packet latency, and end-to-end delay between vehicles, a probabilistic whale optimizer was developed to decrease vehicles’ randomness. The probabilistic method and mathematical modeling are covered in sections B and C.

2.2. Mathematical Modelling of p-WOA

In this study, we provide numerical examples to explain how to search for vehicles, how to construct clusters, and how to choose a cluster leader for optimal performance of clustering. The numerical analysis of enclosing a target, plotting an attack using a bubble circle, and searching a vehicle are all depicted in this section (Figure 3).
(1)
Encircling Prey
After being assigned a cluster head, vehicles can locate it and establish communication with it by incorporating Equations (1) and (2), where D represents the distance between vehicle X(t) and cluster head X*(t), and X(t + 1) displays the next iteration toward the optimal solution (cluster head). Because p-WOA does not know where exactly exploration will take place, it will pick whichever vehicle has the most optimal cluster head arrangement as the target. In Equations (1) and (2), we see how, once the optimized investigation is set up, other vehicles looking for cluster heads inform the optimized vehicle specialist of the locations in which they agree:
D =   | C . X * ( t ) X ( t ) |
X ( t   + 1 ) = X * ( t ) A . D
Here, t represents the current iteration, A and C are coefficient vectors, X* is the vector indicating the position of the best possible arrangement found so far, X represents the location direction, | |is the highest possible esteem, and “.” represents the growth in dot-product size. Each iteration toward the best solution requires X* to be refreshed. Equations (3) and (4) can be used to determine the trajectories A and C:
A = 2 a   .   r   a  
C = 2 . r  
Whale optimization techniques have two basic stages: the exploration stage (where vehicles are searched) and the exploitation stage (formation of the cluster head). Finding all of the cars in a network based on their distance from one another requires first performing a search or exploration, and then grouping. The variable (a) in Equation (3) is used to toggle between the exploration and exploitation stages; it is reduced from 2 to 0 at each iteration, and (r) is a random vector in the interval [0, 1].
(2)
Bubble-net Attacking Method (Exploitation Phase)
Two strategies, based on vehicles’ Bubble-net behavior, are offered:
(3)
(2.1) Shrinking Encircling Mechanism
This strategy reduces the value of (a) in Equation (3). Additionally, (a) minimizes the path to the validation of A. The interval [−a, a] where a is minimized from 2 to 0 over a specific collection of emphases can be thought of as including arbitrary esteem in (a). The unused location of a search agent can be set anywhere between the true position of the operator and the position of the current best operator by altering the value of A between −1 and 1.
(4)
(2.2) Spiral Updating Position
This technique measures the distance between the area of the vehicle (X, Y) and the desired area (X*, Y*). Soon after, a spiral condition is produced for two points to characterize the spherical growth of automobiles, as depicted in Equation (5):
X ( t   +   1 ) =   D   . e bl . cos ( 2 π l ) + X * ( t )
where   D   =| X * ( t ) X | and it seems to be the elimination of the ith vehicle from the cluster head (the best possible arrangement is reached), b is a constant used to determine the shape of a logarithmic curve, l can be any number in [–1, 1], and “.” denotes a replication of the elements one by one. Vehicles move around in a spherical or spiraling pattern within the environment of the vehicle they are concentrating on (the cluster head). Before optimizing the clusters as indicated, it is assumed that there is a probability of 50% that both activities will be presented because they appear to be rare synchronous practices; hence the formulation of Equation (6):
X ( t + 1 ) = { X * ( t ) A . D   i f   p < 0.5 D . e bl . cos ( 2 π l ) + X * ( t )   i f   p 0.5
where p might be any non-integer in the range [0, 1]. Vehicles also randomly scan the area for cluster heads, and the segment’s accompanying scientific display is shown in the closing credits.
(5)
Search for Prey (Exploration Phase)
It is possible to employ the comparative part, which is derived from a transformation of vector A, for hunting (investigation). In addition to specifically targeting their current locations, vehicles also conduct random searches. For vehicle searches, the arbitrary range 1–−1 on A was employed. In this setup, the searching automotive operator’s standing is raised above that of the randomly selected expert, which is in contrast to the manipulation stage. This method, together with the |A| > 1 focus on investigation, enables the p-WOA to perform a universe-wide search. A representation of this phenomenon can be seen in Equation (7):
D = | C . X rand X |

2.3. p-WOA Probabilistic Modelling

To obtain the most up-to-date location of the vehicle, a probabilistic model was incorporated by adjusting the cross-over probability to increase the efficacy and population coverage of the suggested strategy. For more information on the crossover procedure, see Equation (8):
P n m   ( t + 1 ) = { P n m   ( t )   i f   b < c p P n m ( t + 1 )   i f   b c p
In this equation, P n m represents the mth reading taken from the current nth agent, b represents the random nodes or search vehicles in the population, and cp is the crossover probability used to determine the algorithm’s running duration and convergence factor. The method will take longer to run, converge more quickly, and have a lower population range if cp is made smaller. The formula for determining cp’s value is:
cp   =   c   +   ( 0.5   c )   _   sin ( t   . π 2 . tmax )
In this expression, tmax is the maximum number of iterations allowed, and [0, 0.5] is the range of values for the constant c that is used to regulate the fluctuations of the parameter cp. By adjusting cp as given in Equation (9), we may enhance diversity and accuracy in vehicle location estimates.
Self-adaptive weights have been assigned in the planned p-WOA to ensure that no vehicle can get lost. As demonstrated in Equation (10), where tmax is the maximum number of cycles permitted, we choose an adaptive probability ‘ap’ such that every automobile is linked to the best automobile found so far:
ap = 1.2 0.9 .   cos ( t . π / tmax )
Algorithm 1 displays the generated mathematical model’s pseudocode:
Algorithm 1 Pseudocode of p-WOA
  • Initialization of vehicles’ positions and velocity randomly on a freeway by creating a mesh between vehicles. All vehicles in the above mesh should have the same values for their search agents.
  • Determine the separation between a vehicle and others,
  • WHILE (Iteration == Iterations ≤ 350) or Convergence Factor = 0.001 do
  • FOR Nodesi = 1 to 100 do
  •  Nodes for clustering = {All Nodes}
  • WHILE (Nodes for clustering! =empty) do
  •   Calculate the likelihood of each node’s selection
  •   CH = Roulette Wheel selection [All nodes for clustering are possible]
  •   Node. tour. append (CH) (Equation (1))
  •   Neighbors of CH = find Neighbors (CH)
  •   (Nodes for clustering) = (Nodes for clustering) –CH
  •   (Nodes for clustering) = (Nodes for clustering)- Neighbors of CH
  • END WHILE
  •  Nodesi.cost = evaluation (Nodei.tour)
  •  IF (Nodesi.cost < Best Node.cost)
  •  Best Node = Nodei
  •  Nodei++
  • END FOR
  • FOR Nodei = 1 to Population size do
  •  Update Search (Nodei.tour, Nodei.cost)
  • IF (Best Node.cost == Last iteration Best.Node.cost) do
  •   Calculate PDR for each node;
  •   Calculate Latency between nodes;
  •   Calculate the Average Throughput of the medium;
  •   Stall Iteration ++;
  • ELSE
  •   Stall Iteration = 0;
  • END IF
  •  Iteration++;
  • END WHILE
  • Output: CHs = Best Node.tour;
The p-WOA kicks off with some made-up configurations. Every cycle, the cars improve their standing with either a predetermined vehicle or the best possible configuration found using a probabilistic method. Providing individual cluster head searching and identification necessitates lowering the "a" value from 2 to 0. When |A| > 1, the probability work chooses the most erratic vehicle, and when |A| < 1, the best configuration for the rearrangement of the vehicles is chosen. p-WOA may exhibit either a spiral or circular motion, as determined using the value of p.
Simulation parameters are presented in Table 1.

3. Results

In this section, we provide numerical results for various configurations for a number of nodes, communication ranges, network area, and load balancing factors. The developed cluster optimization method for route optimization in vehicular networks, namely (p-WOA), was evaluated in comparison to two state-of-the-art methods: the Ant Lion Optimizer (ALO) [38] and the Grey Wolf Optimizer (GWO) [22].
A. Cluster Density and Optimal Transmission Range
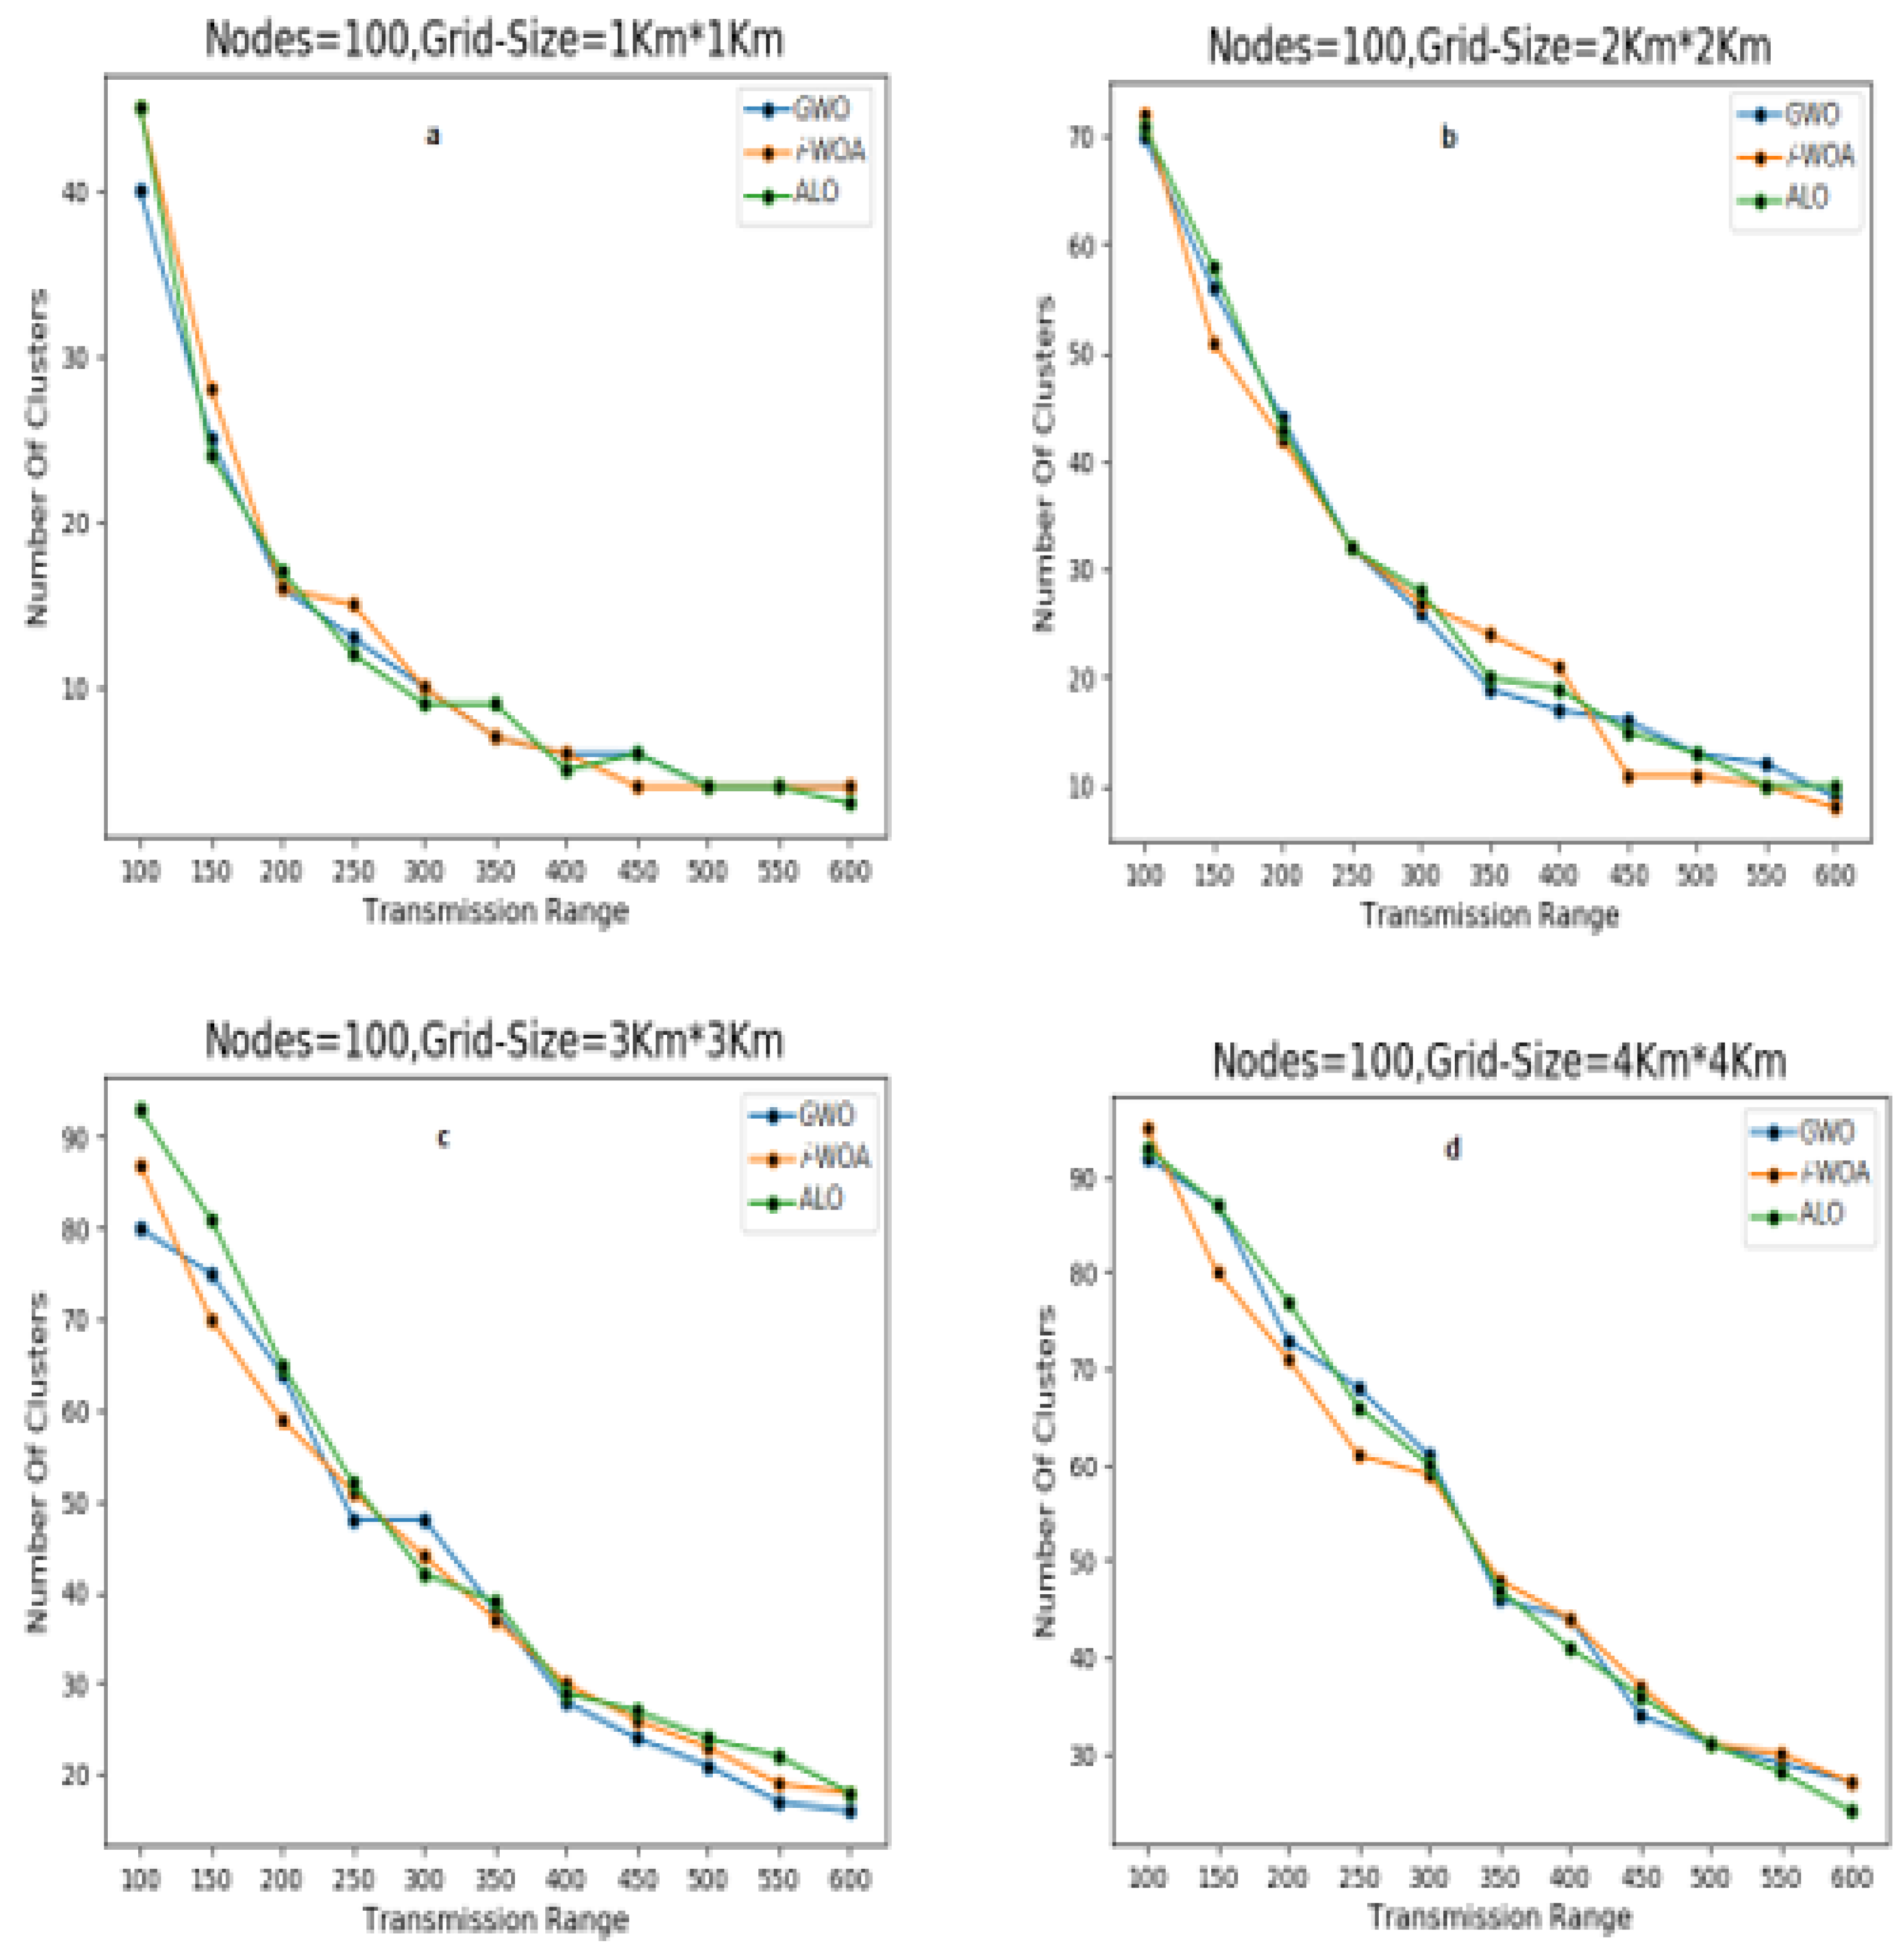
A variety of experiments were carried out with varying parameters, such as increasing the number of nodes to 100, reducing the communication range to 100–600 m, and extending the grid size from 1 km × 1 km to 4 km × 4 km, to identify the boundaries of the developed p-WOA. In Figure 4, we see the wide variety of clusters that form when the number of nodes is fixed at 100 but the communication distance between them is changed (from 100 m to 600 m).
Taking a transmission range of 100 to 600 m and a total of 100 nodes, a 1 km × 1 km grid is depicted in the Figure 4a. When compared to other state-of-the-art approaches such as ALO [38] and GWO [22], it is clear that the suggested p-WOA had the lowest overall cost. Using the same constraints as in (a), but with a grid size of 2 km × 2km, we obtained (b) in Figure 4. As the range of the transmission grew, the number of clusters reduced, and vice versa. The smaller the clusters that were generated, the less effort was expended by the network. Although the other settings in Figure 4c remain the same, the grid size was fixed at 3 km × 3 km. Compared to the other two approaches, the number of clusters created using the developed p-WOA was much smaller. An enhanced packet delivery ratio and reduced hop count will result from using these findings. To see how p-WOA performs in comparison to the previously described techniques, see Figure 4d, which depicts the final scene with a grid size of 4 km × 4 km. More clusters are needed to accommodate vehicles that are geographically separated in a larger grid size, which is evident when the grid size is raised. The result is an increase in routing costs and a deterioration in the lifespan of the network. It can be observed from Figure 4 that, as the transmission range increased, the number of clusters decreased. However, it is observed that the developed p-WOA produced a relevantly lesser number of clusters compared to other bio-inspired algorithms (ALO and GWO).
B. Grid Size vs. Number of Clusters
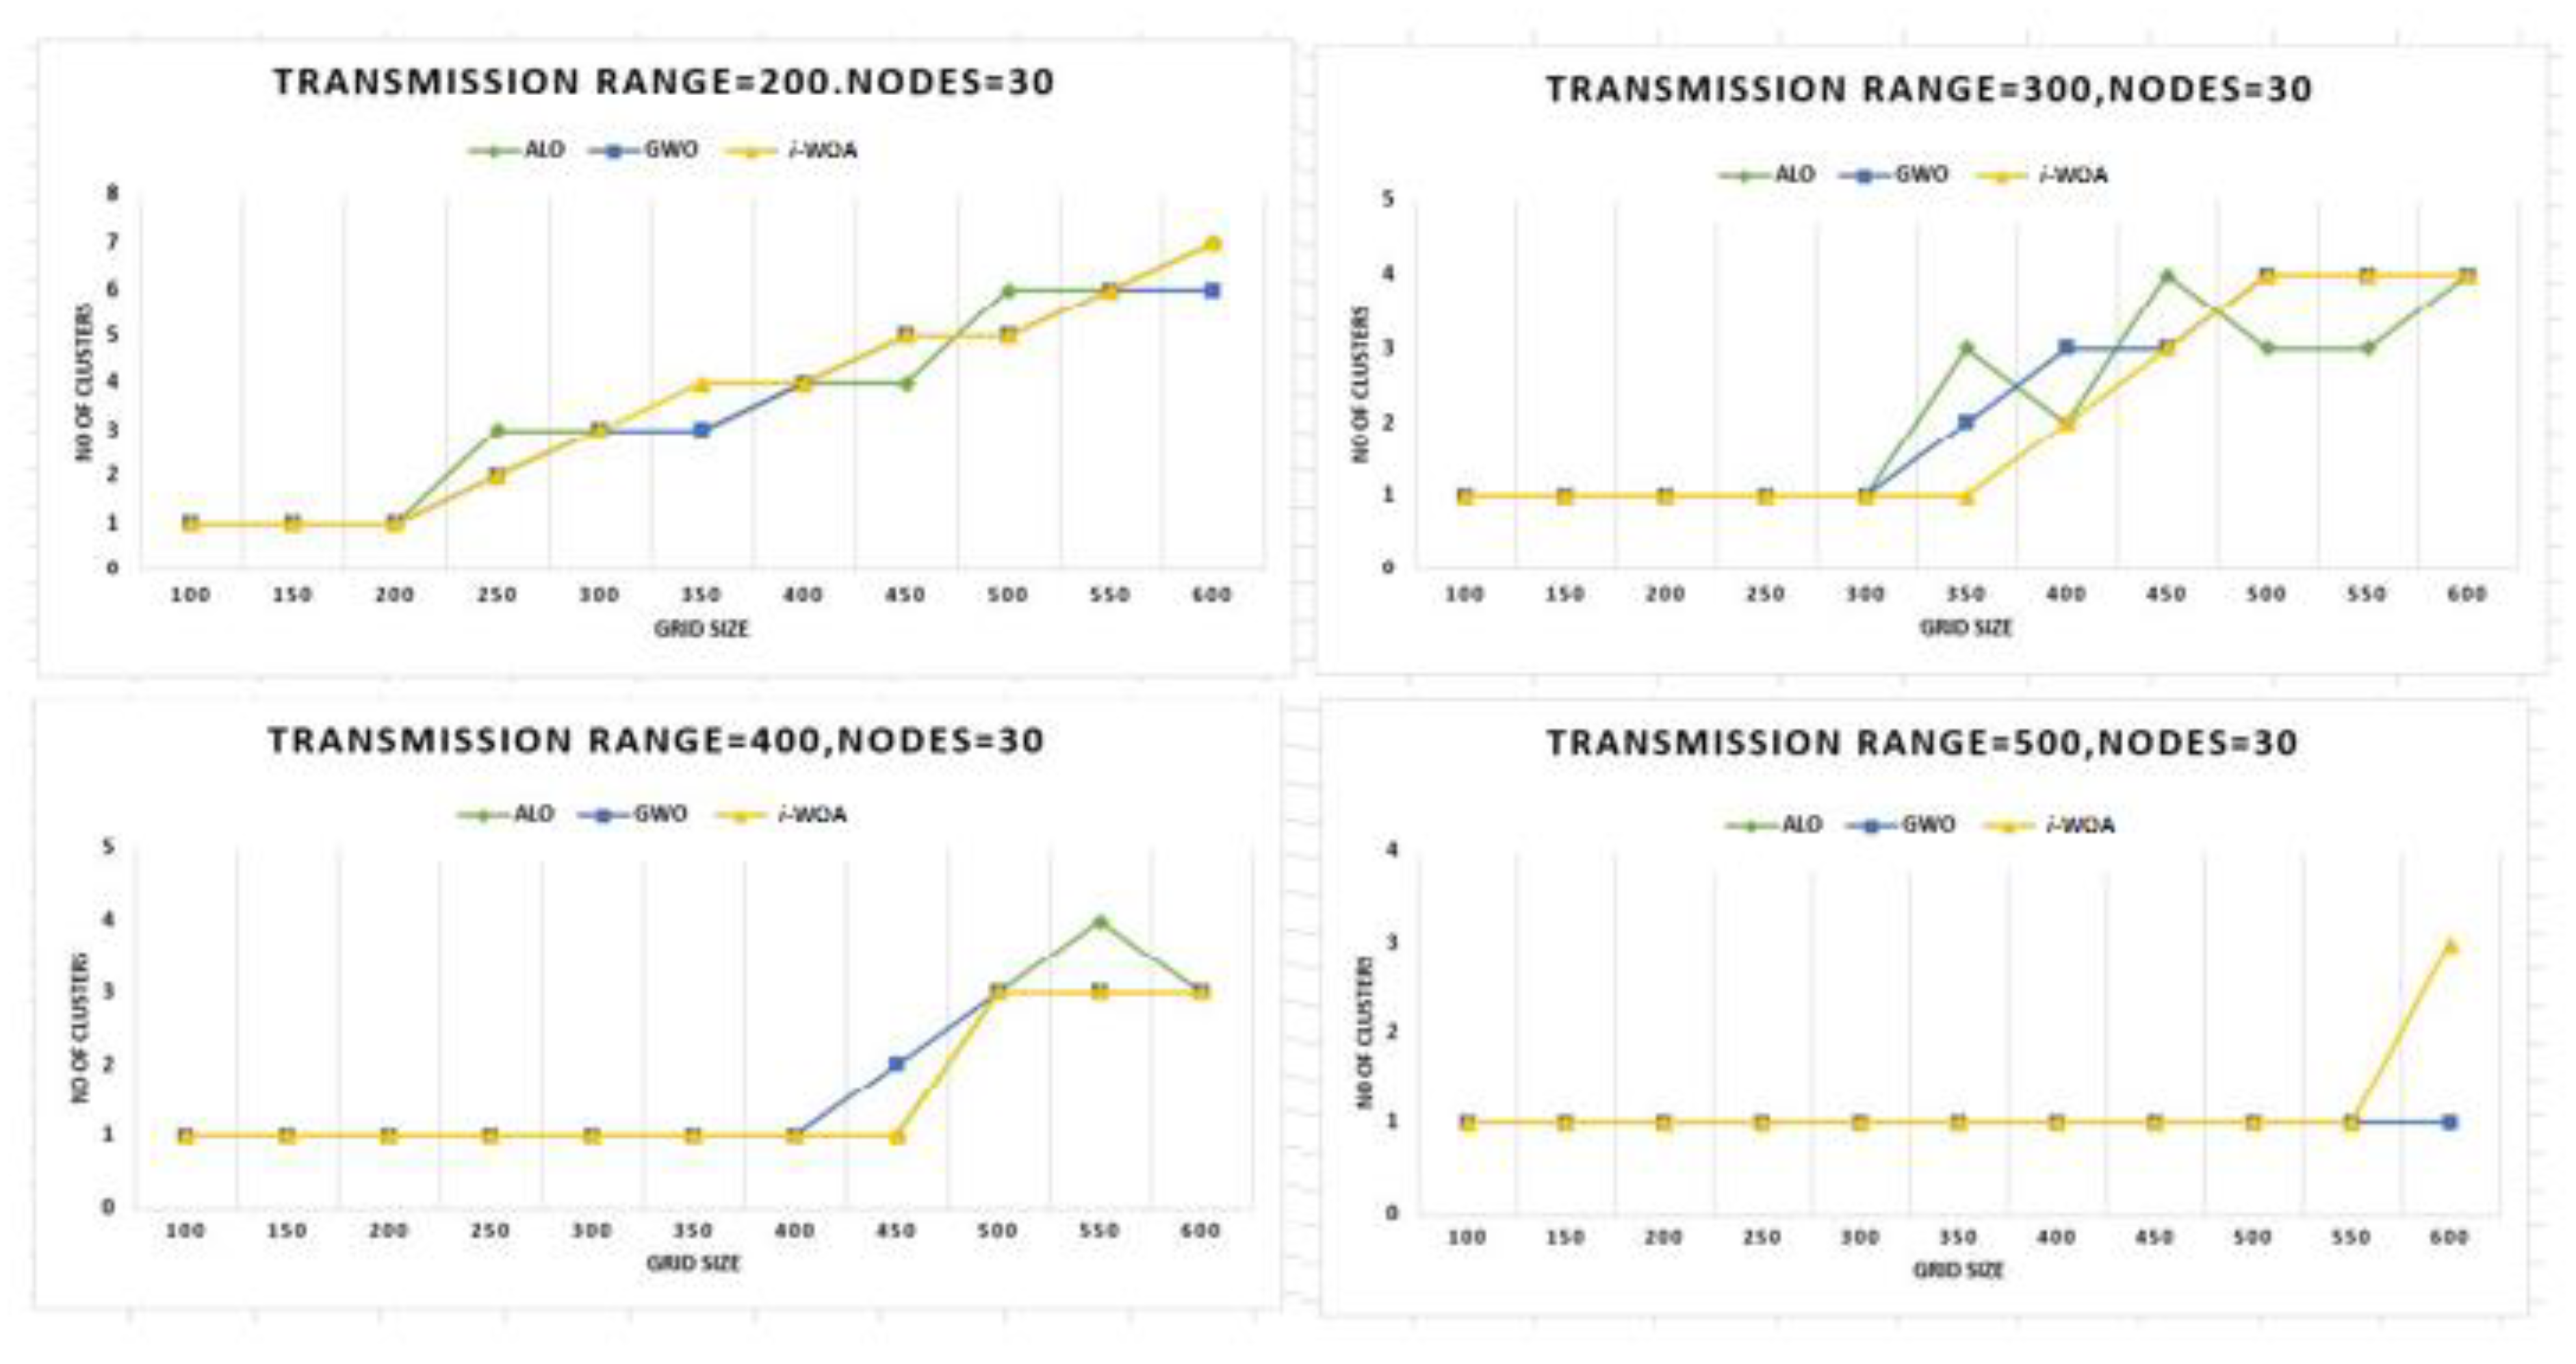
Next, to confirm the advantage of utilizing p-WOA over other bio-inspired algorithms, a new angle was tested by creating multiple clusters to compare with varying grid sizes and transmission distances. Figure 5 shows the results of maintaining a fixed number of nodes (30) while increasing the transmission range from 200 m to 500 m. The y-axis shows the number of clusters, and the x-axis represents the dynamic grid sizes. It was found that there was a clear correlation between the grid size and the number of clusters, which in turn directly affected the routing cost, packet delay, and, ultimately, the network’s lifetime.
As can be seen in Figure 6, the number of nodes was increased for the continuation of the experiments. P-WOA outperformed competing approaches when compared in aggregate. In some phases, p-WOA overlapped with those of other approaches due to the randomness of the algorithms; however, this may be readily fixed by adopting a probabilistic approach and applying intelligent self-adaptation weights during the succeeding iteration.
C. Packet Delivery Ratio
The average packet delivery ratio shows how many packets were sent from the source and how many were received at the destination. Because it allows us to evaluate the efficacy of any given network, it is an essential metric [38]. Using Equation (11), we can determine that a network with a higher average packet delivery ratio is more reliable than one with a lower ratio:
A v e r a g e   P D R =   Σ   N u m b e r   o f   p a c k e t s   r e c e i v e d Σ   N u m b e r   o f   p a c k e t s   s e n t
Comparing p-WOA’s PDR to that of other conventional approaches, as shown in Figure 7, it can be seen that p-WOA performed better than ALO and GWO.
D. Latency
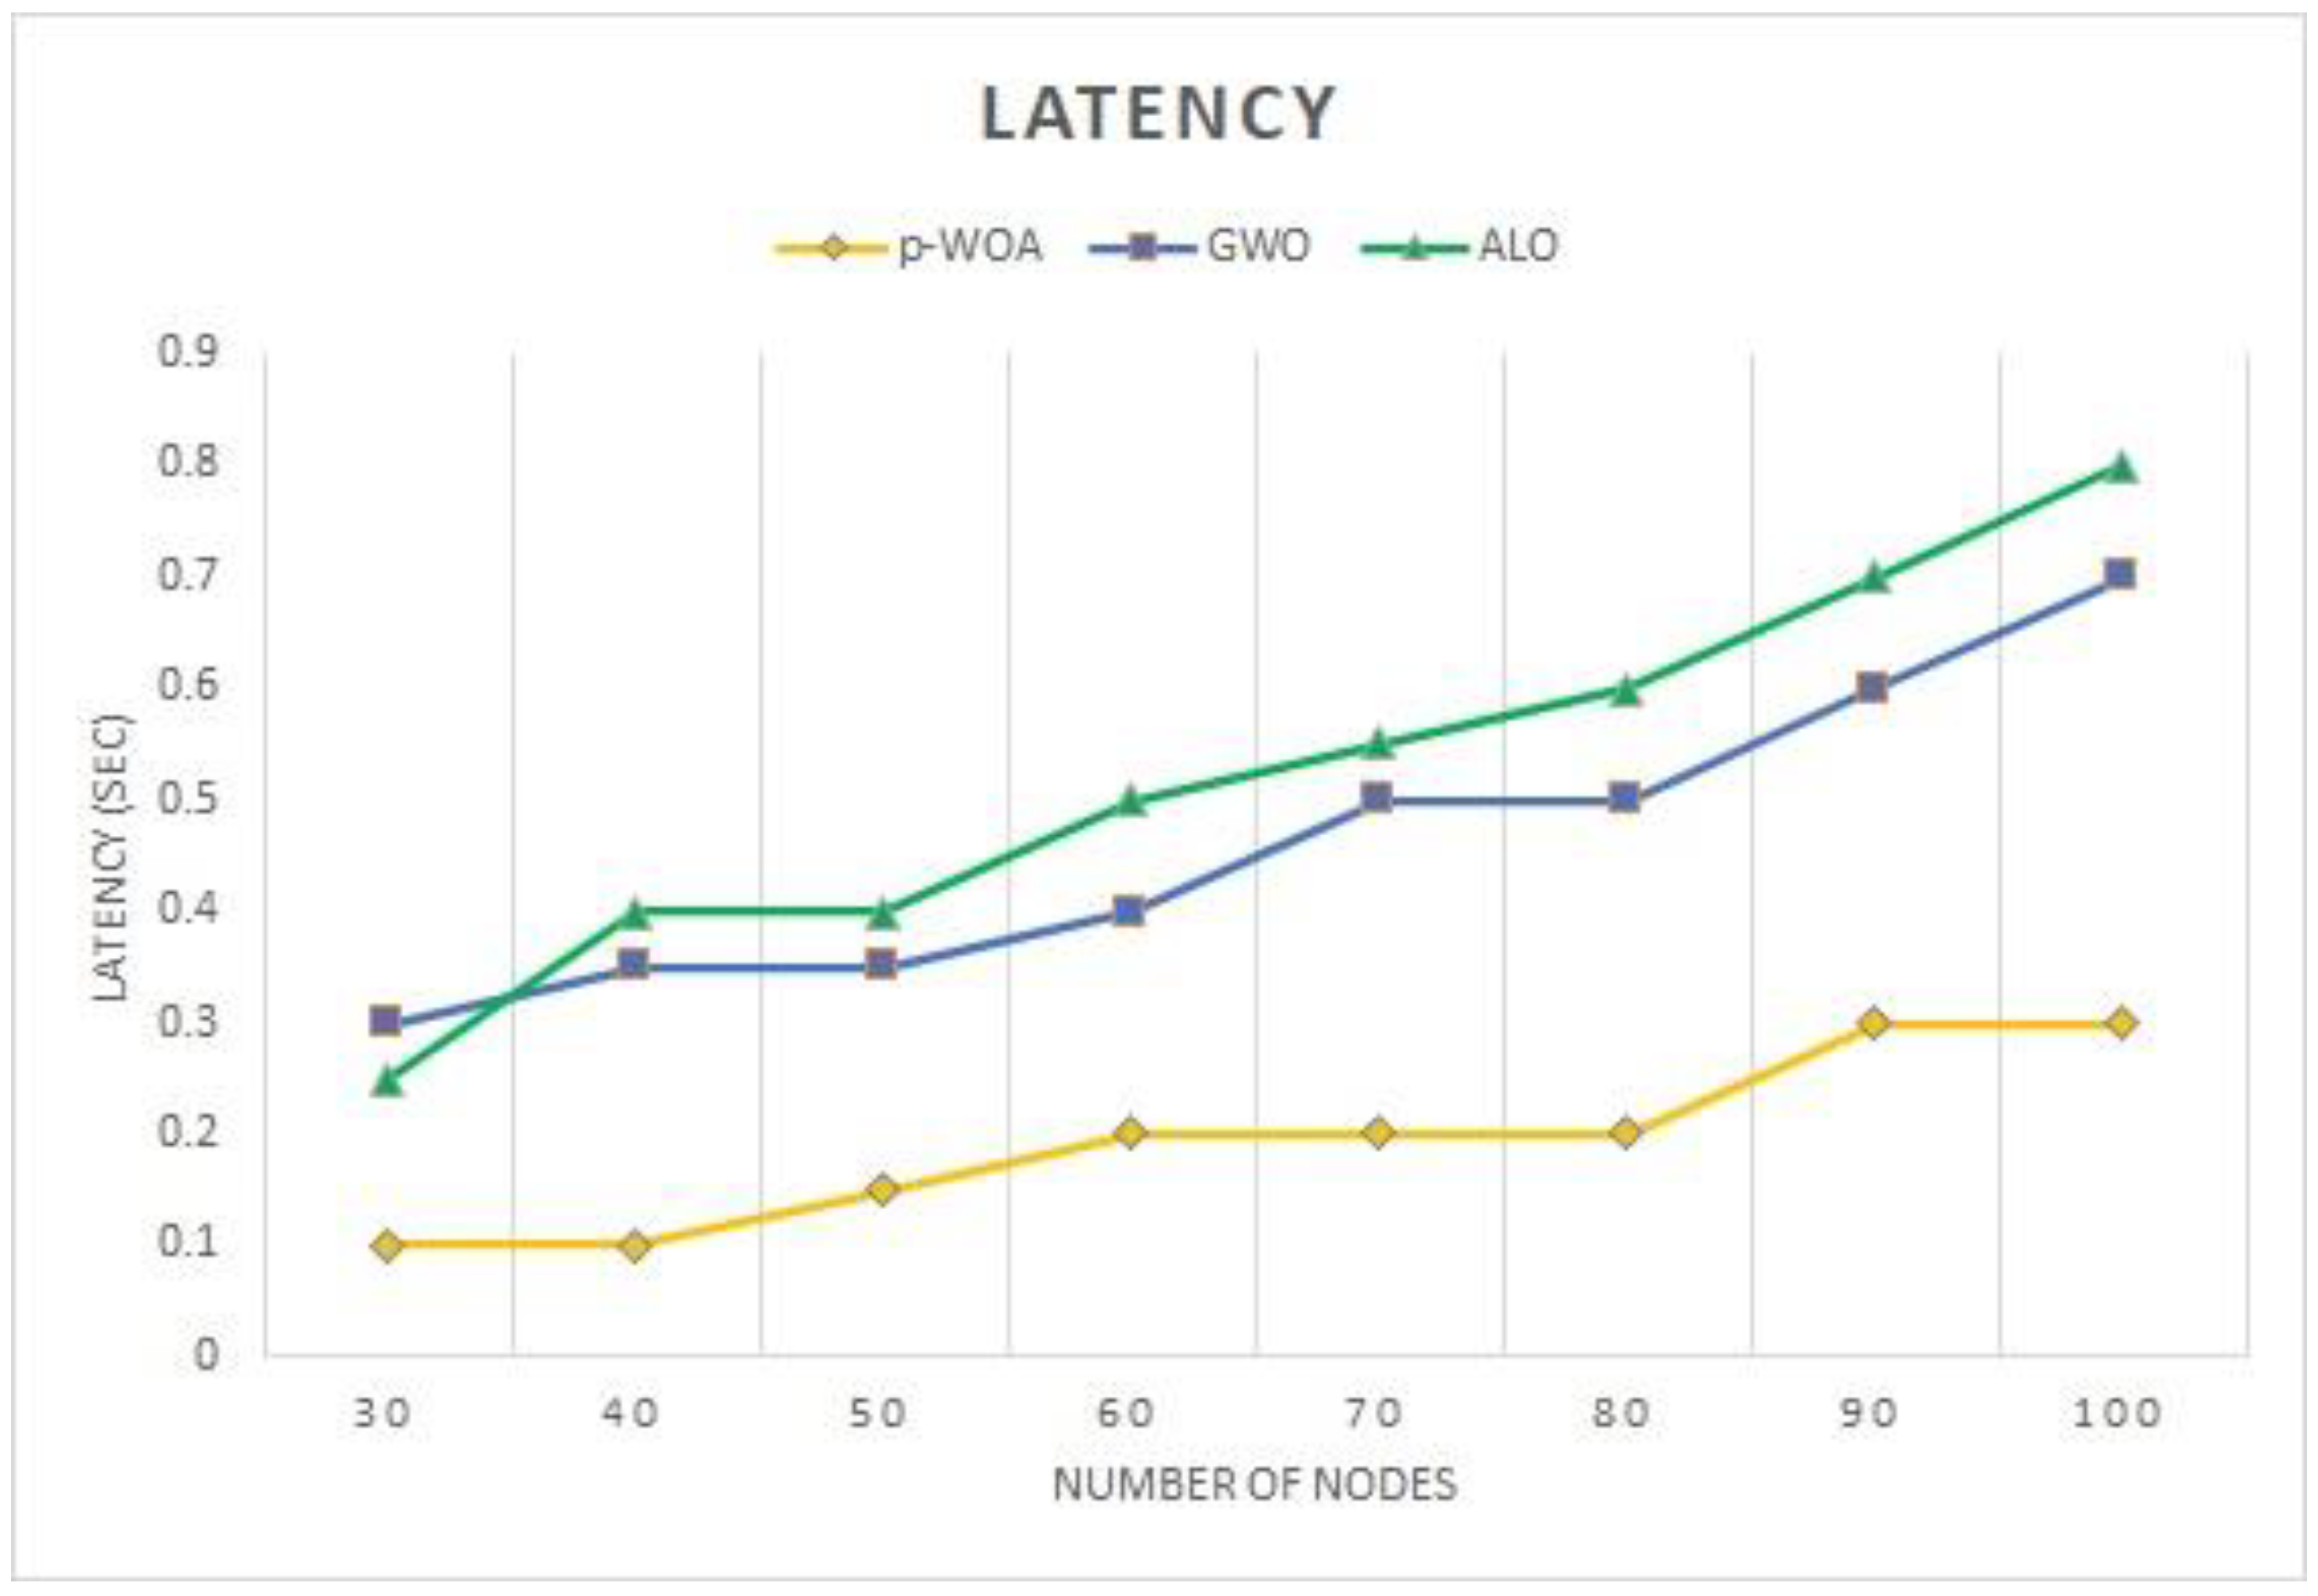
Transferring a data packet requires some processing time, which is referred to as “latency” (packet). The term “latency” is used to describe the delay experienced by data as they travel over a network. The time it takes for a datum to travel from its origin to its destination and back again is often referred to as the “round trip delay.” When 30–100 cars are taken into account, as shown in Figure 8, the average delay was about one minute. In comparison to other approaches, the figure demonstrates that p-WOA had the lowest latency [39].
E. Average Throughput
The average throughput is the rate at which data are transported between the source and the destination. We know that a higher throughput number [40] will boost our network’s performance. Equation (12) allows for its determination:
T h r o u g h p u t =   Σ ( n o .   o f   p a c k e t s ) * ( p a c k e t   s i z e ) ( t r a n s m i s s i o n   t i m e )
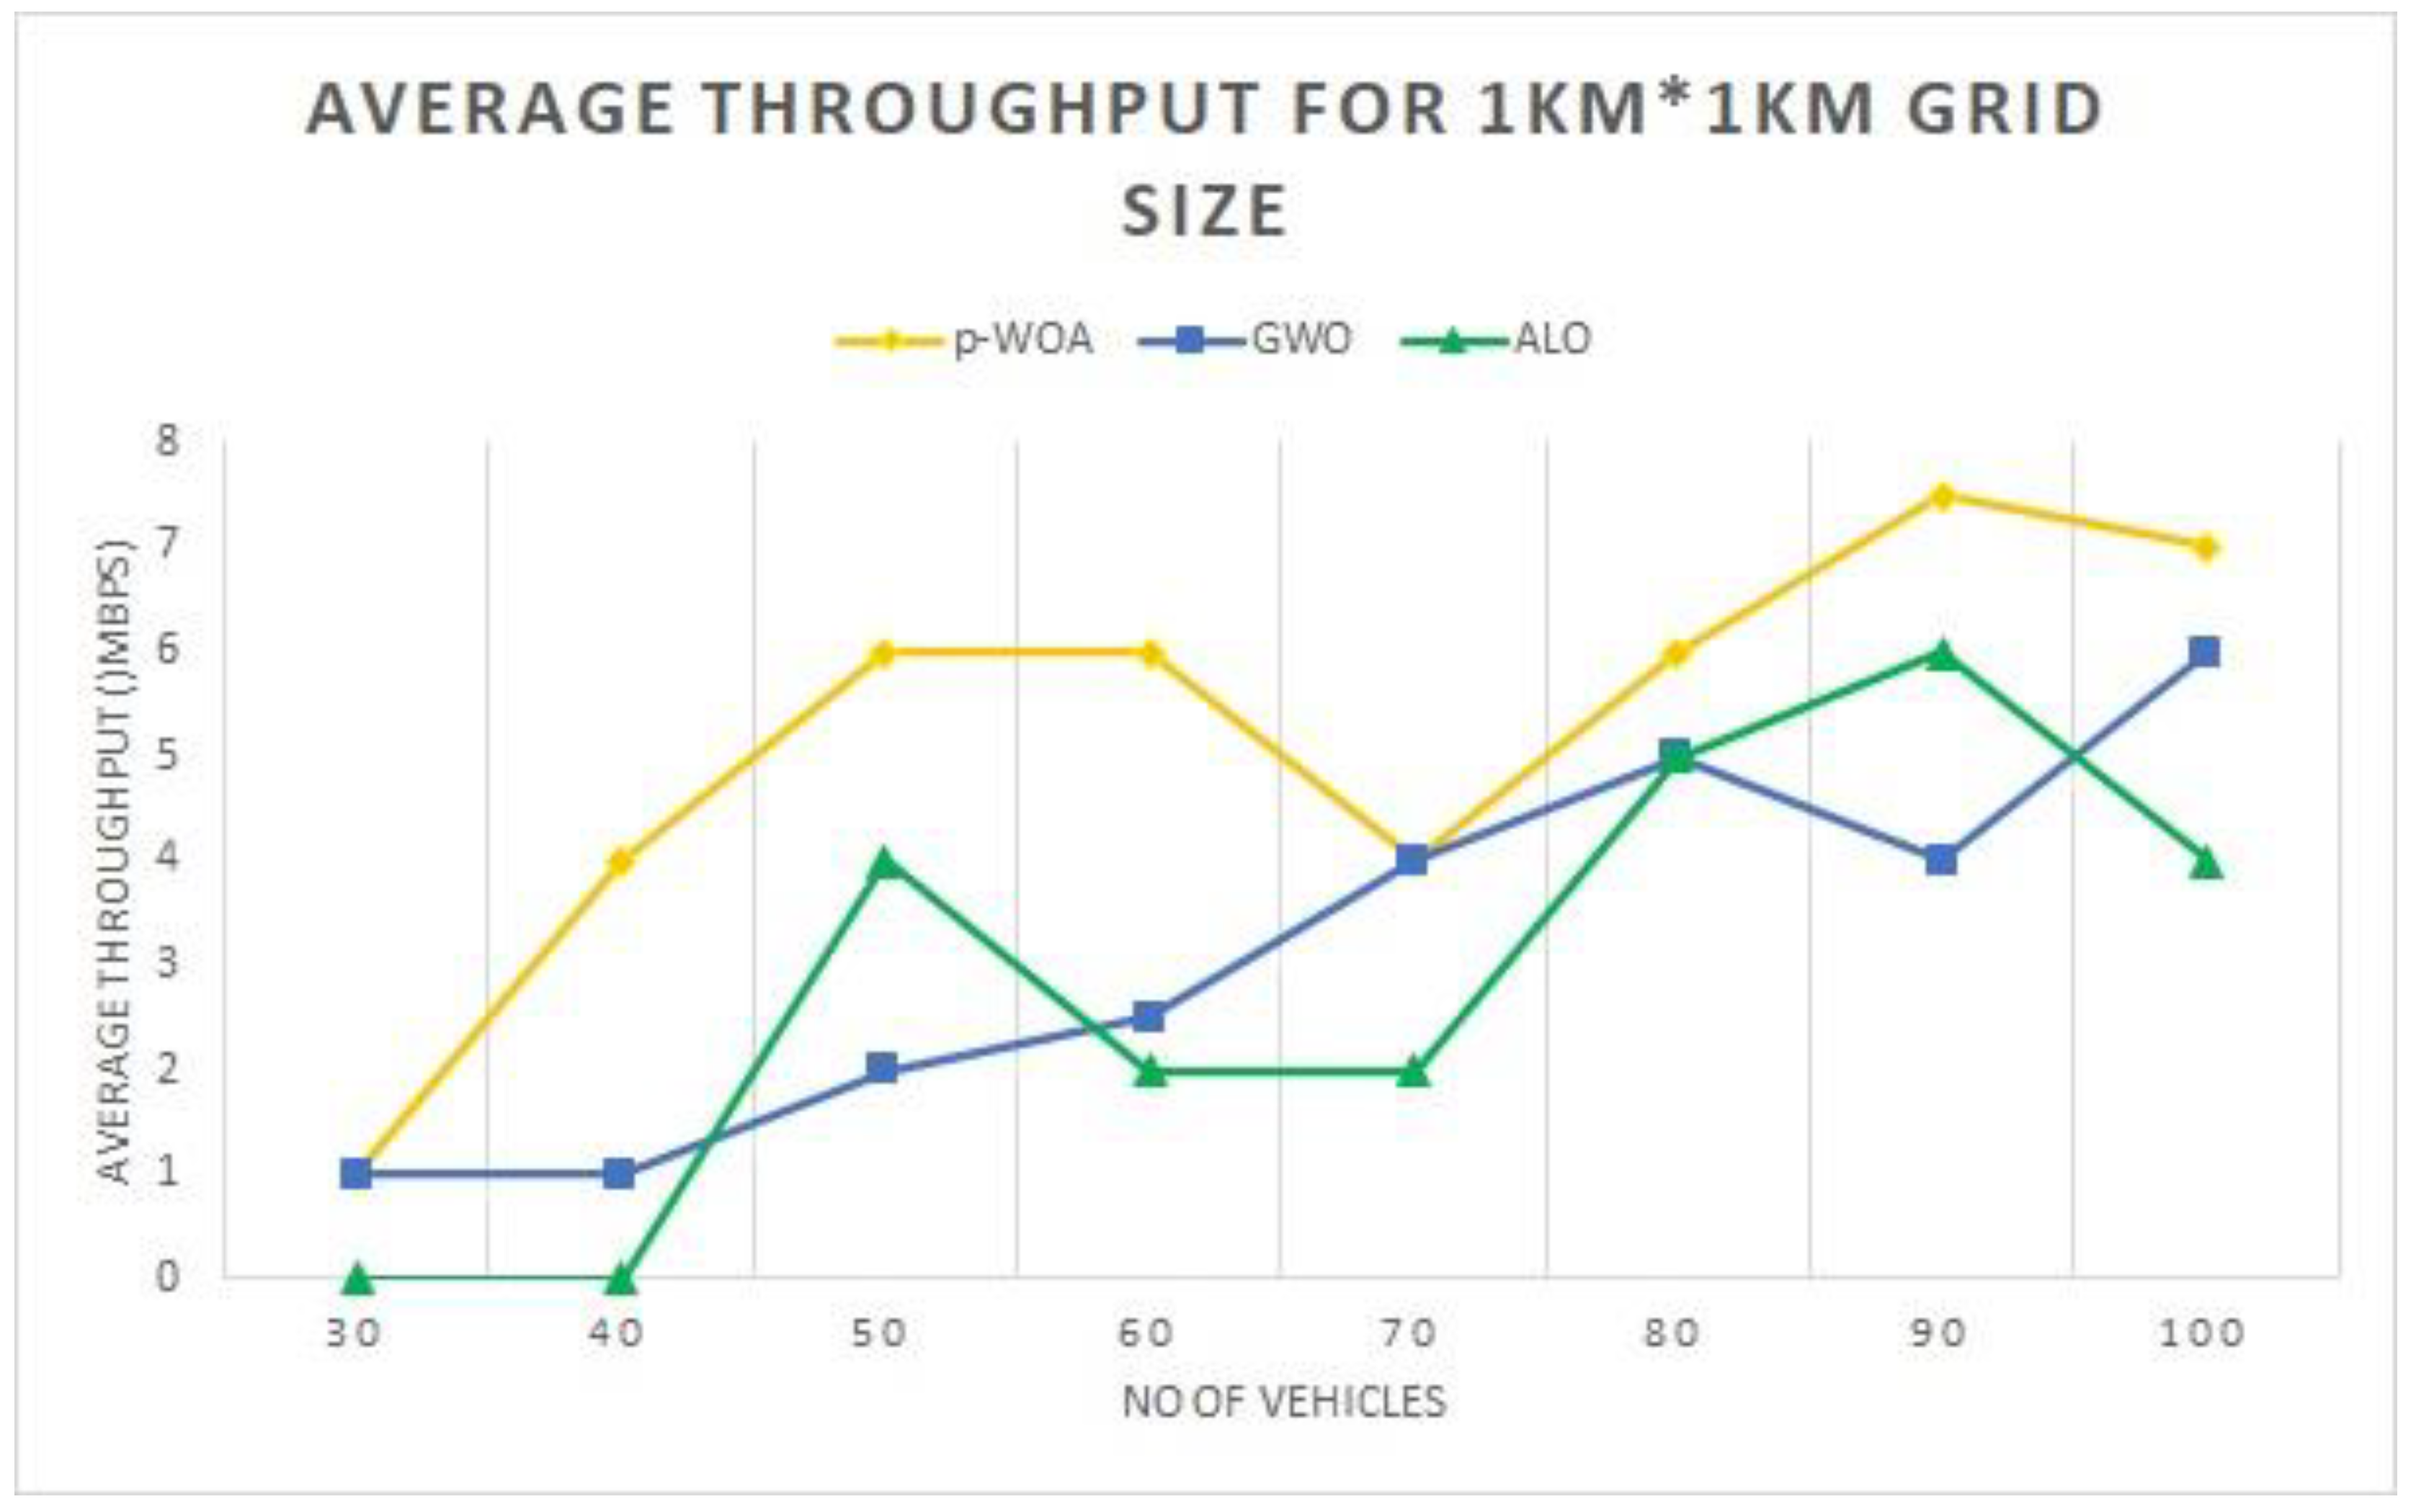
For 100 nodes and a grid size of 1 km × 1 km, Figure 9 displays that the maximum throughput attained with p-WOA was 7 Mpbs, whereas the average throughputs of GWO and ALO were 6 Mpbs and 4 Mpbs, respectively.
E. F. Load Balance Factor (LBF)
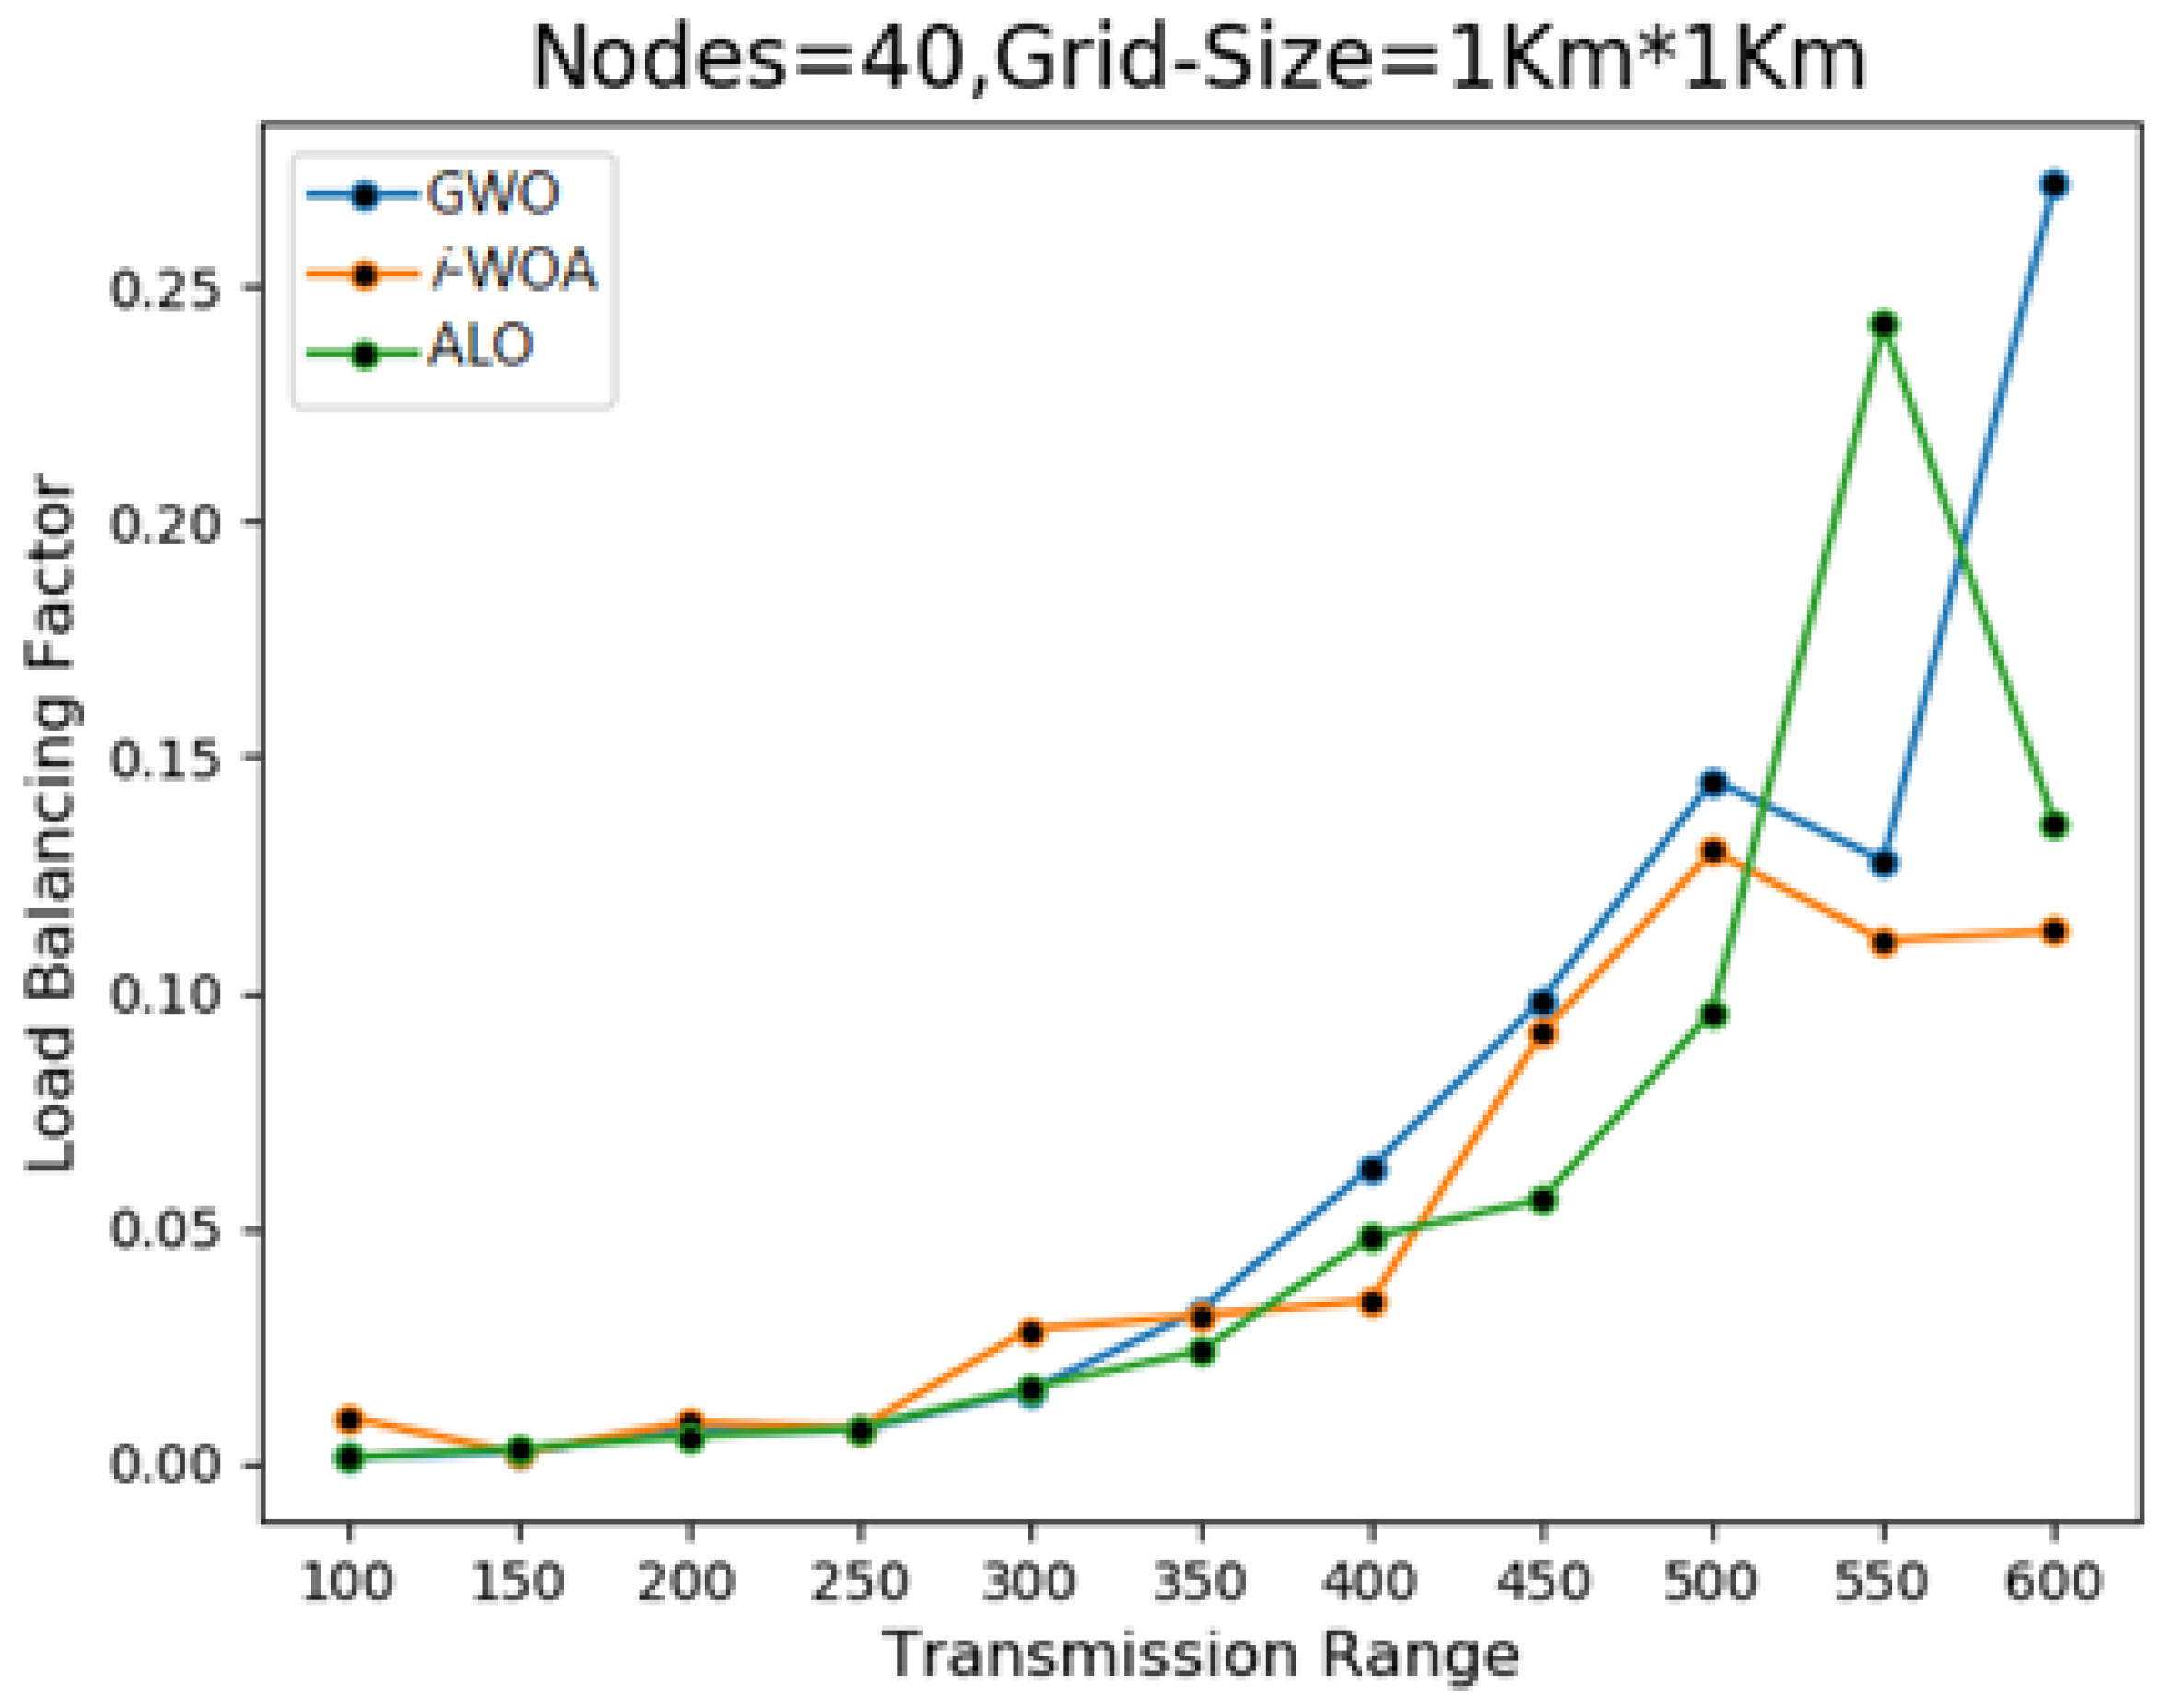
LBF is often used as a performance metric in research. Therefore, LBF was used in this study to assess the efficacy of the created method in comparison to other established methods. With LBF, the workload on the network is distributed evenly across all cluster heads (CHs). To maximize the longevity of both the cluster head and the network as a whole, the ideal situation is for CH to manage an equal number of nodes. When a node in a cluster moves in or out, the LBF makes sure CH is updated accordingly. Figure 10 shows that when the number of nearby vehicles was near its maximum value, p-WOA outperformed GWO and ALO in terms of tuning the network load. The proposed approach, p-WOA, was tested against existing methods, and the results are compared here to determine its efficacy.
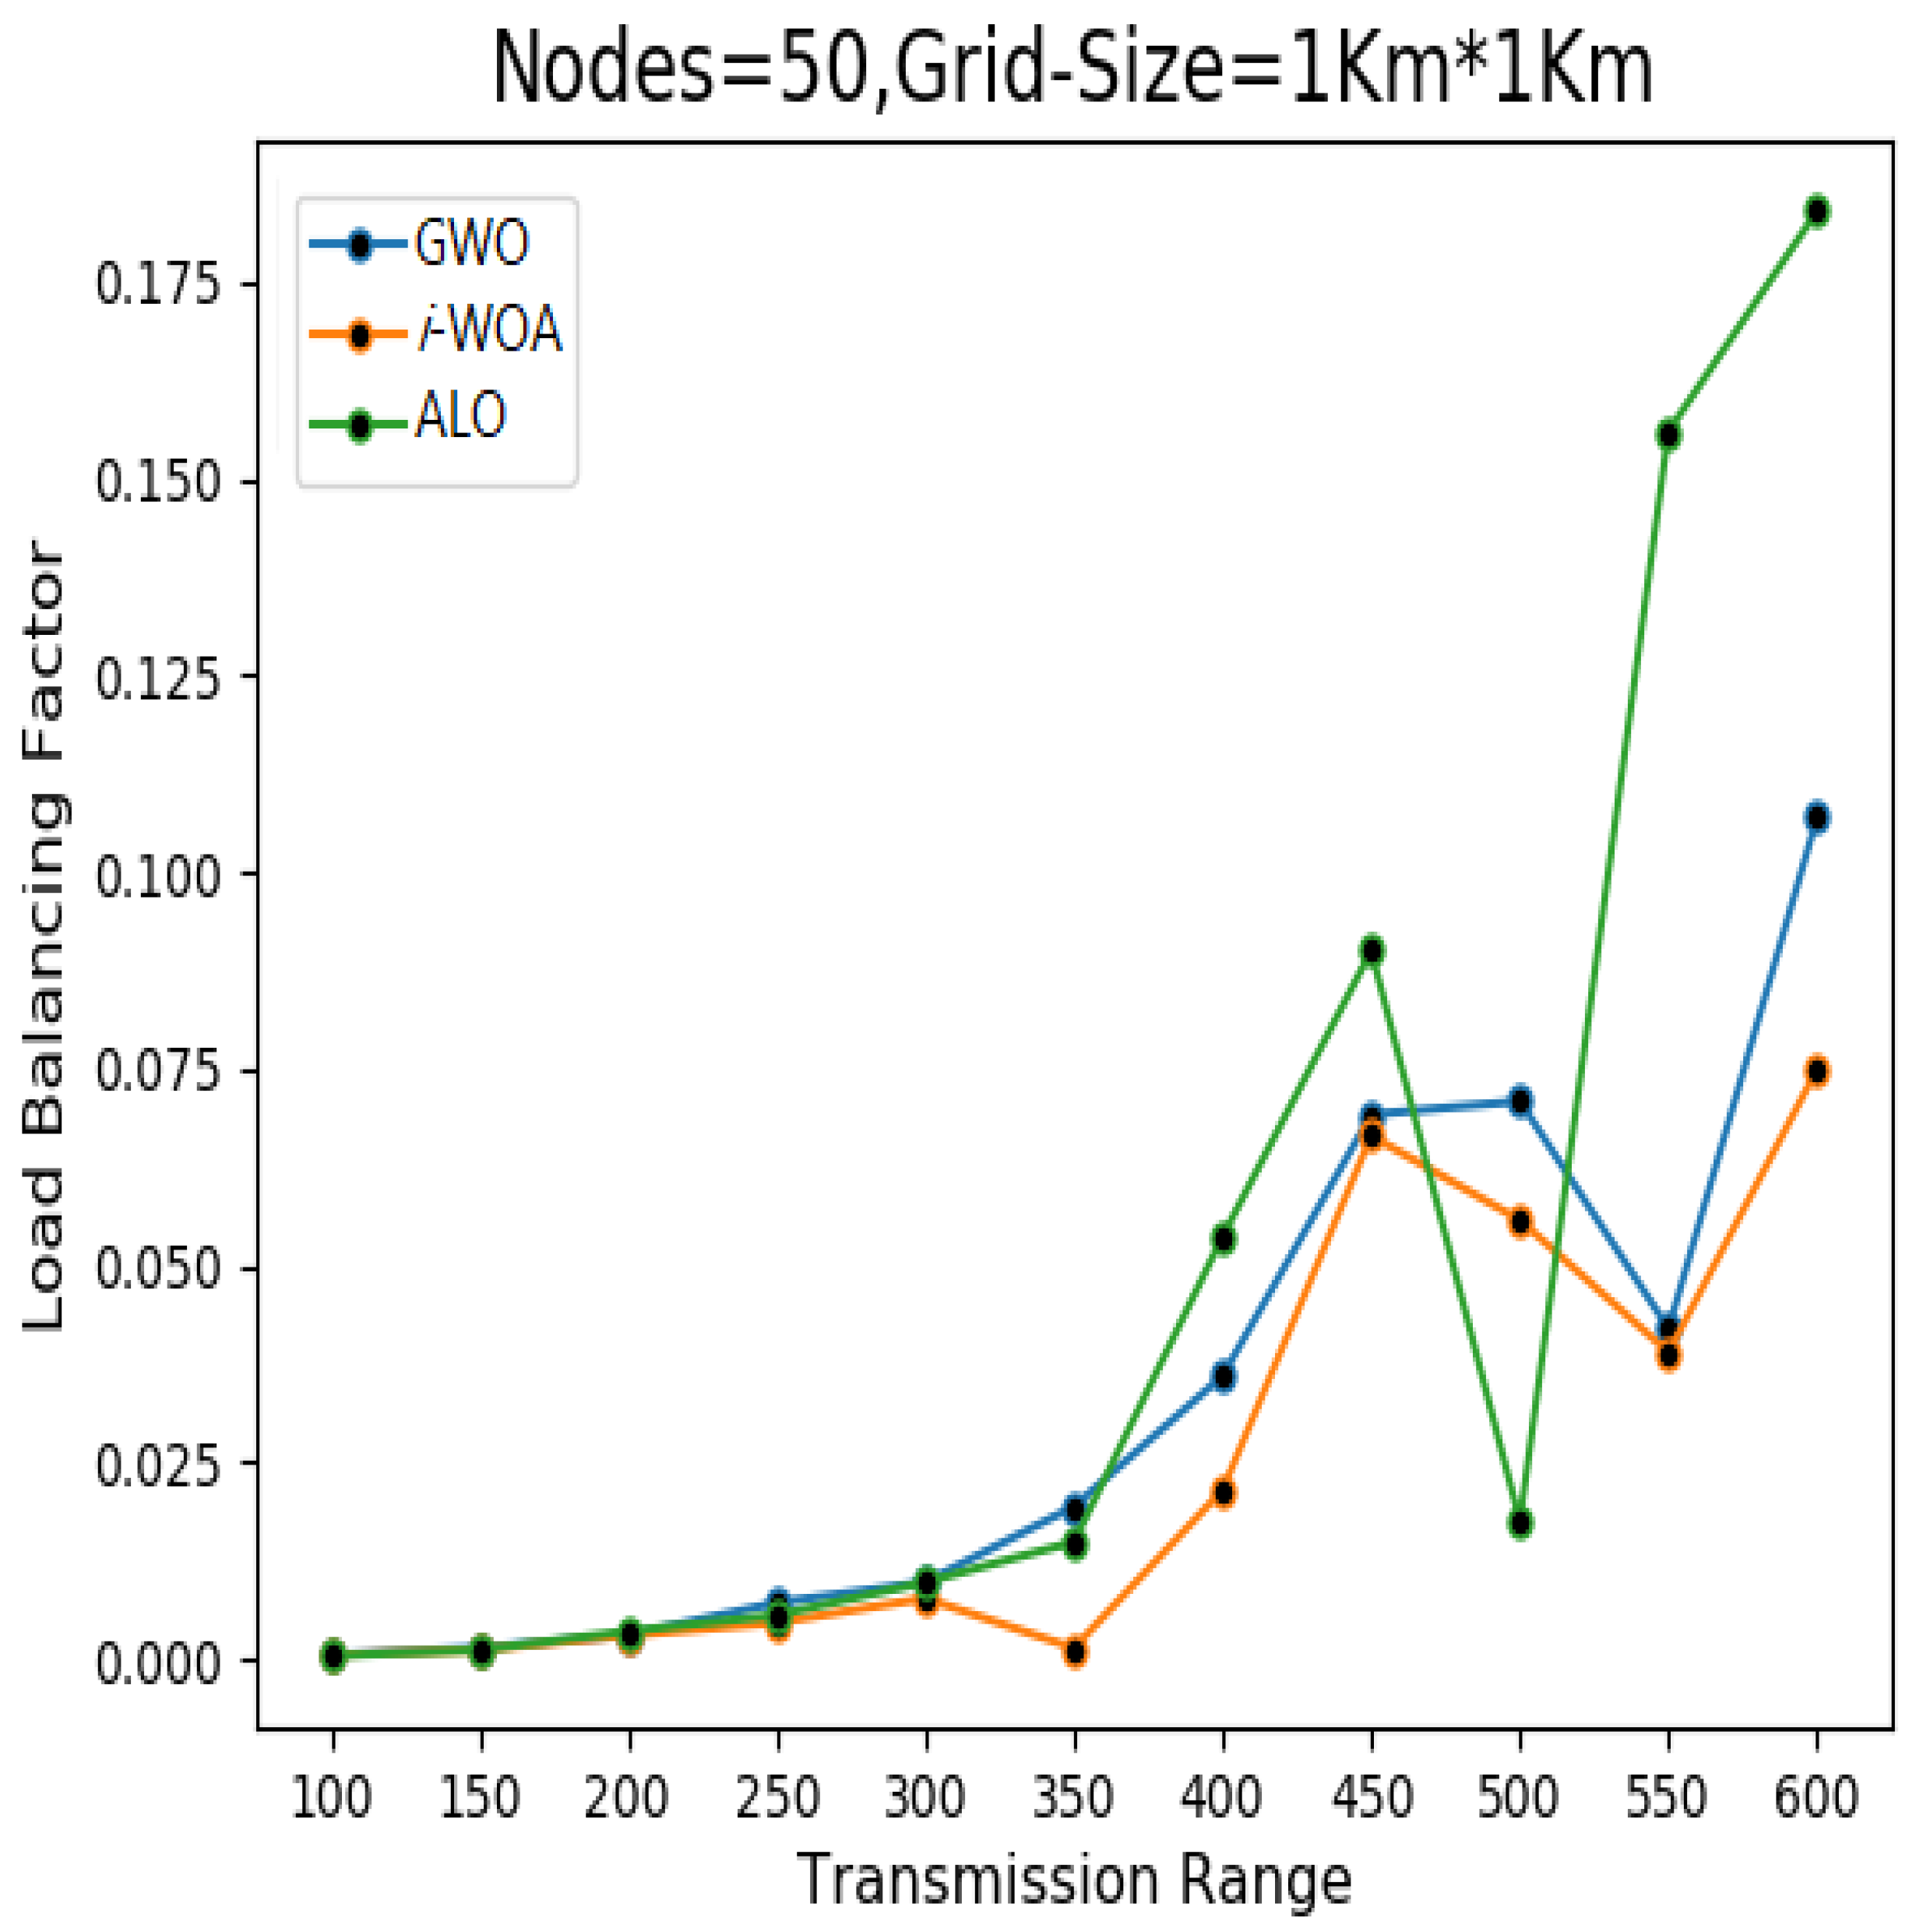
The new method was put through its paces in a series of additional experiments. By raising the number of network nodes to 50 while keeping the grid size at 1 km × 1 km, Figure 11 compares p-WOA to other possible solutions. The new scheme, p-WOA, was better than the older ones in distributing the workload evenly among a cluster’s nodes.
F. G. Evaluation-related statistical tests and analyses
Fully Modified Least Squares (FMOLS) statistical tests, including the p-test, regression analysis, R-squared, and analysis of variance, were applied to the results to gauge the performance of the created p-WOA (ANOVA).
Table 2 demonstrates how clusters were affected by communication distance.
The transmission range (TR) is the independent (predictor) variable.
No. of clusters is the dependent (outcome) variable.
The findings of a regression study comparing the number of clusters with the communication range under ALO, p-WOA, and GWO are shown in Table 2. Here, it is claimed that the relationship between transmission range and the number of clusters obtained was inverse, with a larger transmission range value resulting in fewer cluster heads. According to the table, an increase in communication range of 1% resulted in a −0.04 reduction in the cluster head under ALO and GWO, with p values of less than 1% and 5%, respectively. On the other hand, under p-WOA, a 1% increase in transmission range caused a significant drop of 0.039. According to the adjusted R2 value for the specified transmission range, the independent variables (No. of clusters ALO, No. of clusters p-WOA, and No. of clusters GWO) adequately explain the variation. Their variations were 67.97%, 75.22%, and 66.94%, respectively, with ANOVA values of F (1 9) = 20.73 ***, 25.55 ***, and 22.81 ***, respectively.

4. Discussion

Keeping the number of nodes at 100 and the transmission range at 100–600 m, the findings in Figure 4 demonstrate that p-WOA generated 45 clusters for a grid size of 1 km × 1 km and 53 clusters for a grid size of 4 km × 4 km. According to the comprehensive evaluation, the created method outperformed the state-of-the-art alternatives. It also demonstrates that an increase in grid size results in a corresponding rise in clusters. There was a correlation between transmission range and cluster output in p-WOA, with more optimal clusters being generated as the range expanded. Figure 5 and Figure 6 show the results of the experiments in which the grid size was varied while the number of nodes was held constant at 30 and 40. Moreover, PDR, latency, and throughput were calculated and compared with other bio-inspired methods (ALO and GWO), exhibiting the superiority of the developed method. It was observed that by incorporating probability-based functions into the whale optimization algorithm, the randomness of vehicles at the time of initialization was significantly improved, and the convergence factor was increased.
The load balance factor was used to verify the results by comparing them to those obtained using a standard procedure. As shown in Figure 10 and Figure 11, p-WOA achieved superior results when compared to other benchmark algorithms by distributing the burden of overall cluster leaders. The LBF was utilized to evaluate the proposed method with other methods in terms of the ability of vehicles to stay in a cluster for a maximum length of time. Moreover, the LBF assures that each cluster has been assigned an equal number of nodes.
The typical range for the number of nodes in a published work is between twenty and one hundred and twenty [37,38]. In this analysis, we only evaluated clusters with up to 100 nodes because increasing the number of nodes affects the longevity of the cluster and the network, and thus, it raises the cost of the network. Because the nature-inspired algorithms were random, overlaps occurred during the experiments [39,40,41,42,43,44]. In the current study, we integrated self-adaptive weights via fitness function optimization to overcome this issue using a probabilistic intelligence technique. The developed technology has a wide range of possible uses, including enhancing the accuracy of maps generated using the global positioning system and employing media services to distribute news and other information via the internet.

5. Conclusions

This research, inspired by whale behavior, devised and implemented a probabilistic method for clustering nodes. The developed method commissioned p-WOA in order to determine the optimal number of VANETs clusters; hence, it reduced the overall amount of unpredictability in the network. The developed method was compared to two gold standard methods, ALO and GWO. When considering cluster heads, the suggested optimization approach outperformed the GWO and ALO regardless of variations in communication distance, network approximation, or the number of cars. Increasing the duration of clusters and optimizing them to be as close to optimal as possible reduced the system’s communication overhead. Reduced needs for infrastructure components in transportation networks are another benefit of these optimized clusters.
This study could be improved in the future by increasing the number of nodes to 200 and by deploying different network performance parameters, such as bandwidth efficiency, transmission error and packet loss, etc.—Cluster optimization research employing the Harris Hawks Optimization approach is currently underway.

Author Contributions

Conceptualization, G.H. and S.A.; methodology, G.H. and G.S.; software, A.A.; validation, S.L. and S.A.; formal analysis, G.H. and S.L.; investigation, G.H., S.A., G.S. and A.A.; resources, A.A. and S.L.; data curation, S.A. and S.L.; writing—G.H., S.A. and G.S.; writing—review and editing, S.A., A.A. and S.L.; visualization, A.A.; supervision, S.A.; project administration, S.L.; funding acquisition, S.L. All authors have read and agreed to the published version of the manuscript.

Funding

This work was supported by the National Research Foundation of Korea (NRF) grant funded by the Republic of Korea government (MSIT) (No. 2021R1F1A1063319).

Data Availability Statement

Not applicable.

Acknowledgments

Not applicable.

Conflicts of Interest

The authors declare no conflict of interest.

References

  1. Tambawal, A.B.; Noor, R.; Salleh, R.; Chembe, C.; Oche, M. Enhanced weight-based clustering algorithm to provide reliable delivery for VANET safety applications. PLoS ONE 2019, 14, e0214664. [Google Scholar] [CrossRef]
  2. Ren, M.; Zhang, J.; Khoukhi, L.; Labiod, H.; Vèque, V. A review of clustering algorithms in VANETs. Ann. Telecommun. 2021, 76, 581–603. [Google Scholar] [CrossRef]
  3. Kalita, C.S.; Barooah, M. Li-Fi Based Handoff Technique in VANET. In Proceedings of the 2020 International Conference on Computational Performance Evaluation (ComPE), Shillong, India, 2–4 July 2020; pp. 654–658. [Google Scholar] [CrossRef]
  4. Belmekki, S.; Wahl, M.; Sondi, P.; Gruyer, D.; Tatkeu, C. Toward the Integration of V2V Based Clusters in a Global Infrastructure Network for Vehicles. In Communication Technologies for Vehicles—Nets4Cars/Nets4Trains/Nets4Aircraft 2020; Lecture Notes in Computer Science; Springer: Cham, Switzerland, 2020; Volume 12574, pp. 113–122. [Google Scholar] [CrossRef]
  5. Qiu, T.; Wang, X.; Chen, C.; Atiquzzaman, M.; Liu, L. TMED: A Spider-Web-Like Transmission Mechanism for Emergency Data in Vehicular Ad Hoc Networks. IEEE Trans. Veh. Technol. 2018, 67, 8682–8694. [Google Scholar] [CrossRef]
  6. Husnain, G.; Anwar, S. An Intelligent Probabilistic Whale Optimization Algorithm (i-WOA) for Clustering in Vehicular Ad Hoc Networks. Int. J. Wirel. Inf. Networks 2022, 29, 143–156. [Google Scholar] [CrossRef]
  7. RITA|Intelligent Transportation Systems (ITS). Available online: https://www.its.dot.gov/itspac/advisory_memo.htm (accessed on 16 June 2022).
  8. Bhatia, T.K.; Ramachandran, R.K.; Doss, R.; Pan, L. Data congestion in VANETs: Research directions and new trends through a bibliometric analysis. J. Supercomput. 2021, 77, 6586–6628. [Google Scholar] [CrossRef]
  9. Zaidi, S.; Bitam, S.; Mellouk, A. Enhanced user datagram protocol for video streaming in VANET. In Proceedings of the 2017 IEEE International Conference on Communications (ICC), Paris, France, 21–25 May 2017; pp. 1–6. [Google Scholar] [CrossRef]
  10. Magaia, N.; Sheng, Z. ReFIoV: A Novel Reputation Framework for Information-Centric Vehicular Applications. IEEE Trans. Veh. Technol. 2018, 68, 1810–1823. [Google Scholar] [CrossRef]
  11. Senouci, O.; Zibouda, A.; Harous, S. Survey: Routing protocols in vehicular ad hoc networks. In Proceeding of the AWICT 2017: Proceedings of the Second International Conference on Advanced Wireless Information, Data, and Communication Technologies, Paris, France, 13–14 November 2017; pp. 1–6. [CrossRef]
  12. Hu, L.; Wang, H.; Zhao, Y. Performance Analysis of DSRC-Based Vehicular Safety Communication in Imperfect Channels. IEEE Access 2020, 8, 107399–107408. [Google Scholar] [CrossRef]
  13. Cao, Y.; Wang, Z.-C.; Liu, F.; Li, P.; Xie, G. Bio-Inspired Speed Curve Optimization and Sliding Mode Tracking Control for Subway Trains. IEEE Trans. Veh. Technol. 2019, 68, 6331–6342. [Google Scholar] [CrossRef]
  14. Mirjalili, S.; Lewis, A. The Whale Optimization Algorithm. Adv. Eng. Softw. 2016, 95, 51–67. [Google Scholar] [CrossRef]
  15. Husnain, G.; Anwar, S.; Shahzad, F.; Sikander, G.; Tariq, R.; Bakhtyar, M.; Lim, S. An Intelligent Harris Hawks Optimization Based Cluster Optimization Scheme for VANETs. J. Sens. 2022, 2022, 6790082. [Google Scholar] [CrossRef]
  16. Husnain, G.; Anwar, S. An intelligent cluster optimization algorithm based on Whale Optimization Algorithm for VANETs (WOACNET). PLoS ONE 2021, 16, e0250271. [Google Scholar] [CrossRef]
  17. Woeginger, G.J. Exact Algorithms for NP-Hard Problems: A Survey. In Combinatorial Optimization—Eureka, You Shrink! Jünger, M., Reinelt, G., Rinaldi, G., Eds.; Lecture Notes in Computer, Science; Springer: Berlin/Heidelberg, Germany, 2003; Volume 2570, pp. 185–207. [Google Scholar] [CrossRef]
  18. Satyajeet, D.; Deshmukh, A.R.; Dorle, S.S. Heterogeneous Approaches for Cluster based Routing Protocol in Vehicular Ad Hoc Network (VANET). Int. J. Comput. Appl. 2016, 134, 1–8. [Google Scholar]
  19. Amudhavel, J.; Kumar, K.P.; Narmatha, T.; Sampathkumar, S.; Jaiganesh, S.; Vengattaraman, T. Multi-Objective Clustering Methodologies and its Applications in VANET. In Proceedings of the ICARCSET ‘15: Proceedings of the 2015 International Conference on Advanced Research in Computer Science Engineering & Technology (ICARCSET 2015); Unnao, India, 6–7 March 2015. [CrossRef]
  20. Ayyub, M.; Oracevic, A.; Hussain, R.; Khan, A.A.; Zhang, Z. A comprehensive survey on clustering in vehicular networks: Current solutions and future challenges. Ad Hoc Netw. 2021, 124, 102729. [Google Scholar] [CrossRef]
  21. Khakpour, S. Cluster-Based Target Tracking in Vehicular Ad Hoc Networks. Master’s Thesis, University of Ontario Institute of Technology, Oshawa, ON, Canada, 2015. [Google Scholar]
  22. Fahad, M.; Aadil, F.; Rehman, Z.; Khan, S.; Shah, P.A.; Muhammad, K.; Lloret, J.; Wang, H.; Lee, J.W.; Mehmood, I. Grey wolf optimization based clustering algorithm for vehicular ad-hoc networks. Comput. Electr. Eng. 2018, 70, 853–870. [Google Scholar] [CrossRef]
  23. Yao, P.; Wang, H. Dynamic Adaptive Ant Lion Optimizer applied to route planning for unmanned aerial vehicle. Soft Comput. 2017, 21, 5475–5488. [Google Scholar] [CrossRef]
  24. Wagh, M.B.; Gomathi, N. Route discovery for vehicular ad hoc networks using modified lion algorithm. Alex. Eng. J. 2018, 57, 3075–3087. [Google Scholar] [CrossRef]
  25. Azzoug, Y.; Boukra, A. Bio-inspired VANET routing optimization: An overview—A taxonomy of notable VANET routing problems, overview, advancement state, and future perspective under the bio-inspired optimization approaches. Artif. Intell. Rev. 2021, 54, 1005–1062. [Google Scholar] [CrossRef]
  26. Wagh, M.B.; Gomathi, N. Water wave optimization-based routing protocol for vehicular adhoc networks. Int. J. Model. Simul. Sci. Comput. 2018, 9, 1850047. [Google Scholar] [CrossRef]
  27. Al Balas, F.; Almomani, O.; Abu Jazoh, R.M.; Khamayseh, Y.M.; Saaidah, A. An Enhanced End to End Route Discovery in AODV using Multi-Objectives Genetic Algorithm. In Proceedings of the IEEE Jordan International Joint Conference on Electrical Engineering and Information Technology (JEEIT), Amman, Jordan, 9–11 April 2019; pp. 209–214. [Google Scholar] [CrossRef]
  28. Bitam, S.; Mellouk, A. Bee life-based multi constraints multicast routing optimization for vehicular ad hoc networks. J. Netw. Comput. Appl. 2013, 36, 981–991. [Google Scholar] [CrossRef]
  29. Aadil, F.; Bajwa, K.B.; Khan, S.; Chaudary, N.M.; Akram, A. CACONET: Ant Colony Optimization (ACO) Based Clustering Algorithm for VANET. PLoS ONE 2016, 11, e0154080. [Google Scholar] [CrossRef]
  30. Shah, Y.A.; Habib, H.A.; Aadil, F.; Khan, M.F.; Maqsood, M.; Nawaz, T. CAMONET: Moth-Flame Optimization (MFO) Based Clustering Algorithm for VANETs. IEEE Access 2018, 6, 48611–48624. [Google Scholar] [CrossRef]
  31. Husnain, G.; Anwar, S.; Shahzad, F. Performance evaluation of CLPSO and MOPSO routing algorithms for optimized clustering in Vehicular Ad Hoc Networks. In Proceedings of the 14th International Bhurban Conference on Applied Sciences and Technology (IBCAST), Islamabad, Pakistan, 10–14 January 2017; pp. 772–778. [Google Scholar]
  32. Joshua, C.J.; Duraisamy, R.; Varadarajan, V. A Reputation based Weighted Clustering Protocol in VANET: A Multi-objective Firefly Approach. Mob. Netw. Appl. 2019, 24, 1199–1209. [Google Scholar] [CrossRef]
  33. Lee, U.; Magistretti, E.; Gerla, M.; Bellavista, P.; Lió, P.; Lee, K.-W. Bio-inspired multi-agent data harvesting in a proactive urban monitoring environment. Ad Hoc Netw. 2009, 7, 725–741. [Google Scholar] [CrossRef]
  34. Yarinezhad, R.; Sarabi, A. A New Routing Algorithm for Vehicular Ad-hoc Networks based on Glowworm Swarm Optimization Algorithm. J. AI Data Min. 2019, 7, 69–76. [Google Scholar] [CrossRef]
  35. Harrabi, S.; Ben Jaafar, I.; Ghedira, K. Message Dissemination in Vehicular Networks on the Basis of Agent Technology. Wirel. Pers. Commun. 2017, 96, 6129–6146. [Google Scholar] [CrossRef]
  36. Fathian, M.; Jafarian-Moghaddam, A.R. New clustering algorithms for vehicular ad-hoc network in a highway communication environment. Wirel. Netw. 2015, 21, 2765–2780. [Google Scholar] [CrossRef]
  37. Chowdhary, N.; Kaur, P.D. Dynamic Route Optimization Using Nature-Inspired Algorithms in IoV. In Proceedings of First International Conference on Smart System, Innovations and Computing; Smart Innovation, Systems and Technologies; Springer: Singapore, 2018; Volume 79, pp. 495–504. [Google Scholar] [CrossRef]
  38. Mirjalili, S. The Ant Lion Optimizer. Adv. Eng. Softw. 2015, 83, 80–98. [Google Scholar] [CrossRef]
  39. Afzal, K.; Tariq, R.; Aadil, F.; Iqbal, Z.; Ali, N.; Sajid, M. An Optimized and Efficient Routing Protocol Application for IoV. Math. Probl. Eng. 2021, 2021, 9977252. [Google Scholar] [CrossRef]
  40. Assila, B.; Kobbane, A. Improving Latency and Bandwidth for Intelligent Transport Services Exploiting Caching Technology. In Proceedings of the International Conference on Wireless Networks and Mobile Communications (WINCOM), Fez, Morocco, 29 October–1 November 2019; pp. 1–6. [Google Scholar] [CrossRef]
  41. Houmer, M.; Hasnaoui, M.L. A Qualitative Assessment of VANET Routing Protocols Under Different Mobility Models. J. Comput. Sci. 2019, 15, 161–170. [Google Scholar] [CrossRef]
  42. Ahsan, W.; Khan, M.F.; Aadil, F.; Maqsood, M.; Ashraf, S.; Nam, Y.; Rho, S. Optimized Node Clustering in VANETs by Using Meta-Heuristic Algorithms. Electronics 2020, 9, 394. [Google Scholar] [CrossRef]
  43. Aadil, F.; Ahsan, W.; Rehman, Z.U.; Shah, P.A.; Rho, S.; Mehmood, I. Clustering algorithm for internet of vehicles (IoV) based on dragonfly optimizer (CAVDO). J. Supercomput. 2018, 74, 4542–4567. [Google Scholar] [CrossRef]
  44. Wang, J.; Wang, Y.; Gu, X.; Chen, L.; Wan, J. ClusterRep: A cluster-based reputation framework for balancing privacy and trust in vehicular participatory sensing. Int. J. Distrib. Sens. Netw. 2018, 14, 1550147718803299. [Google Scholar] [CrossRef] [Green Version]
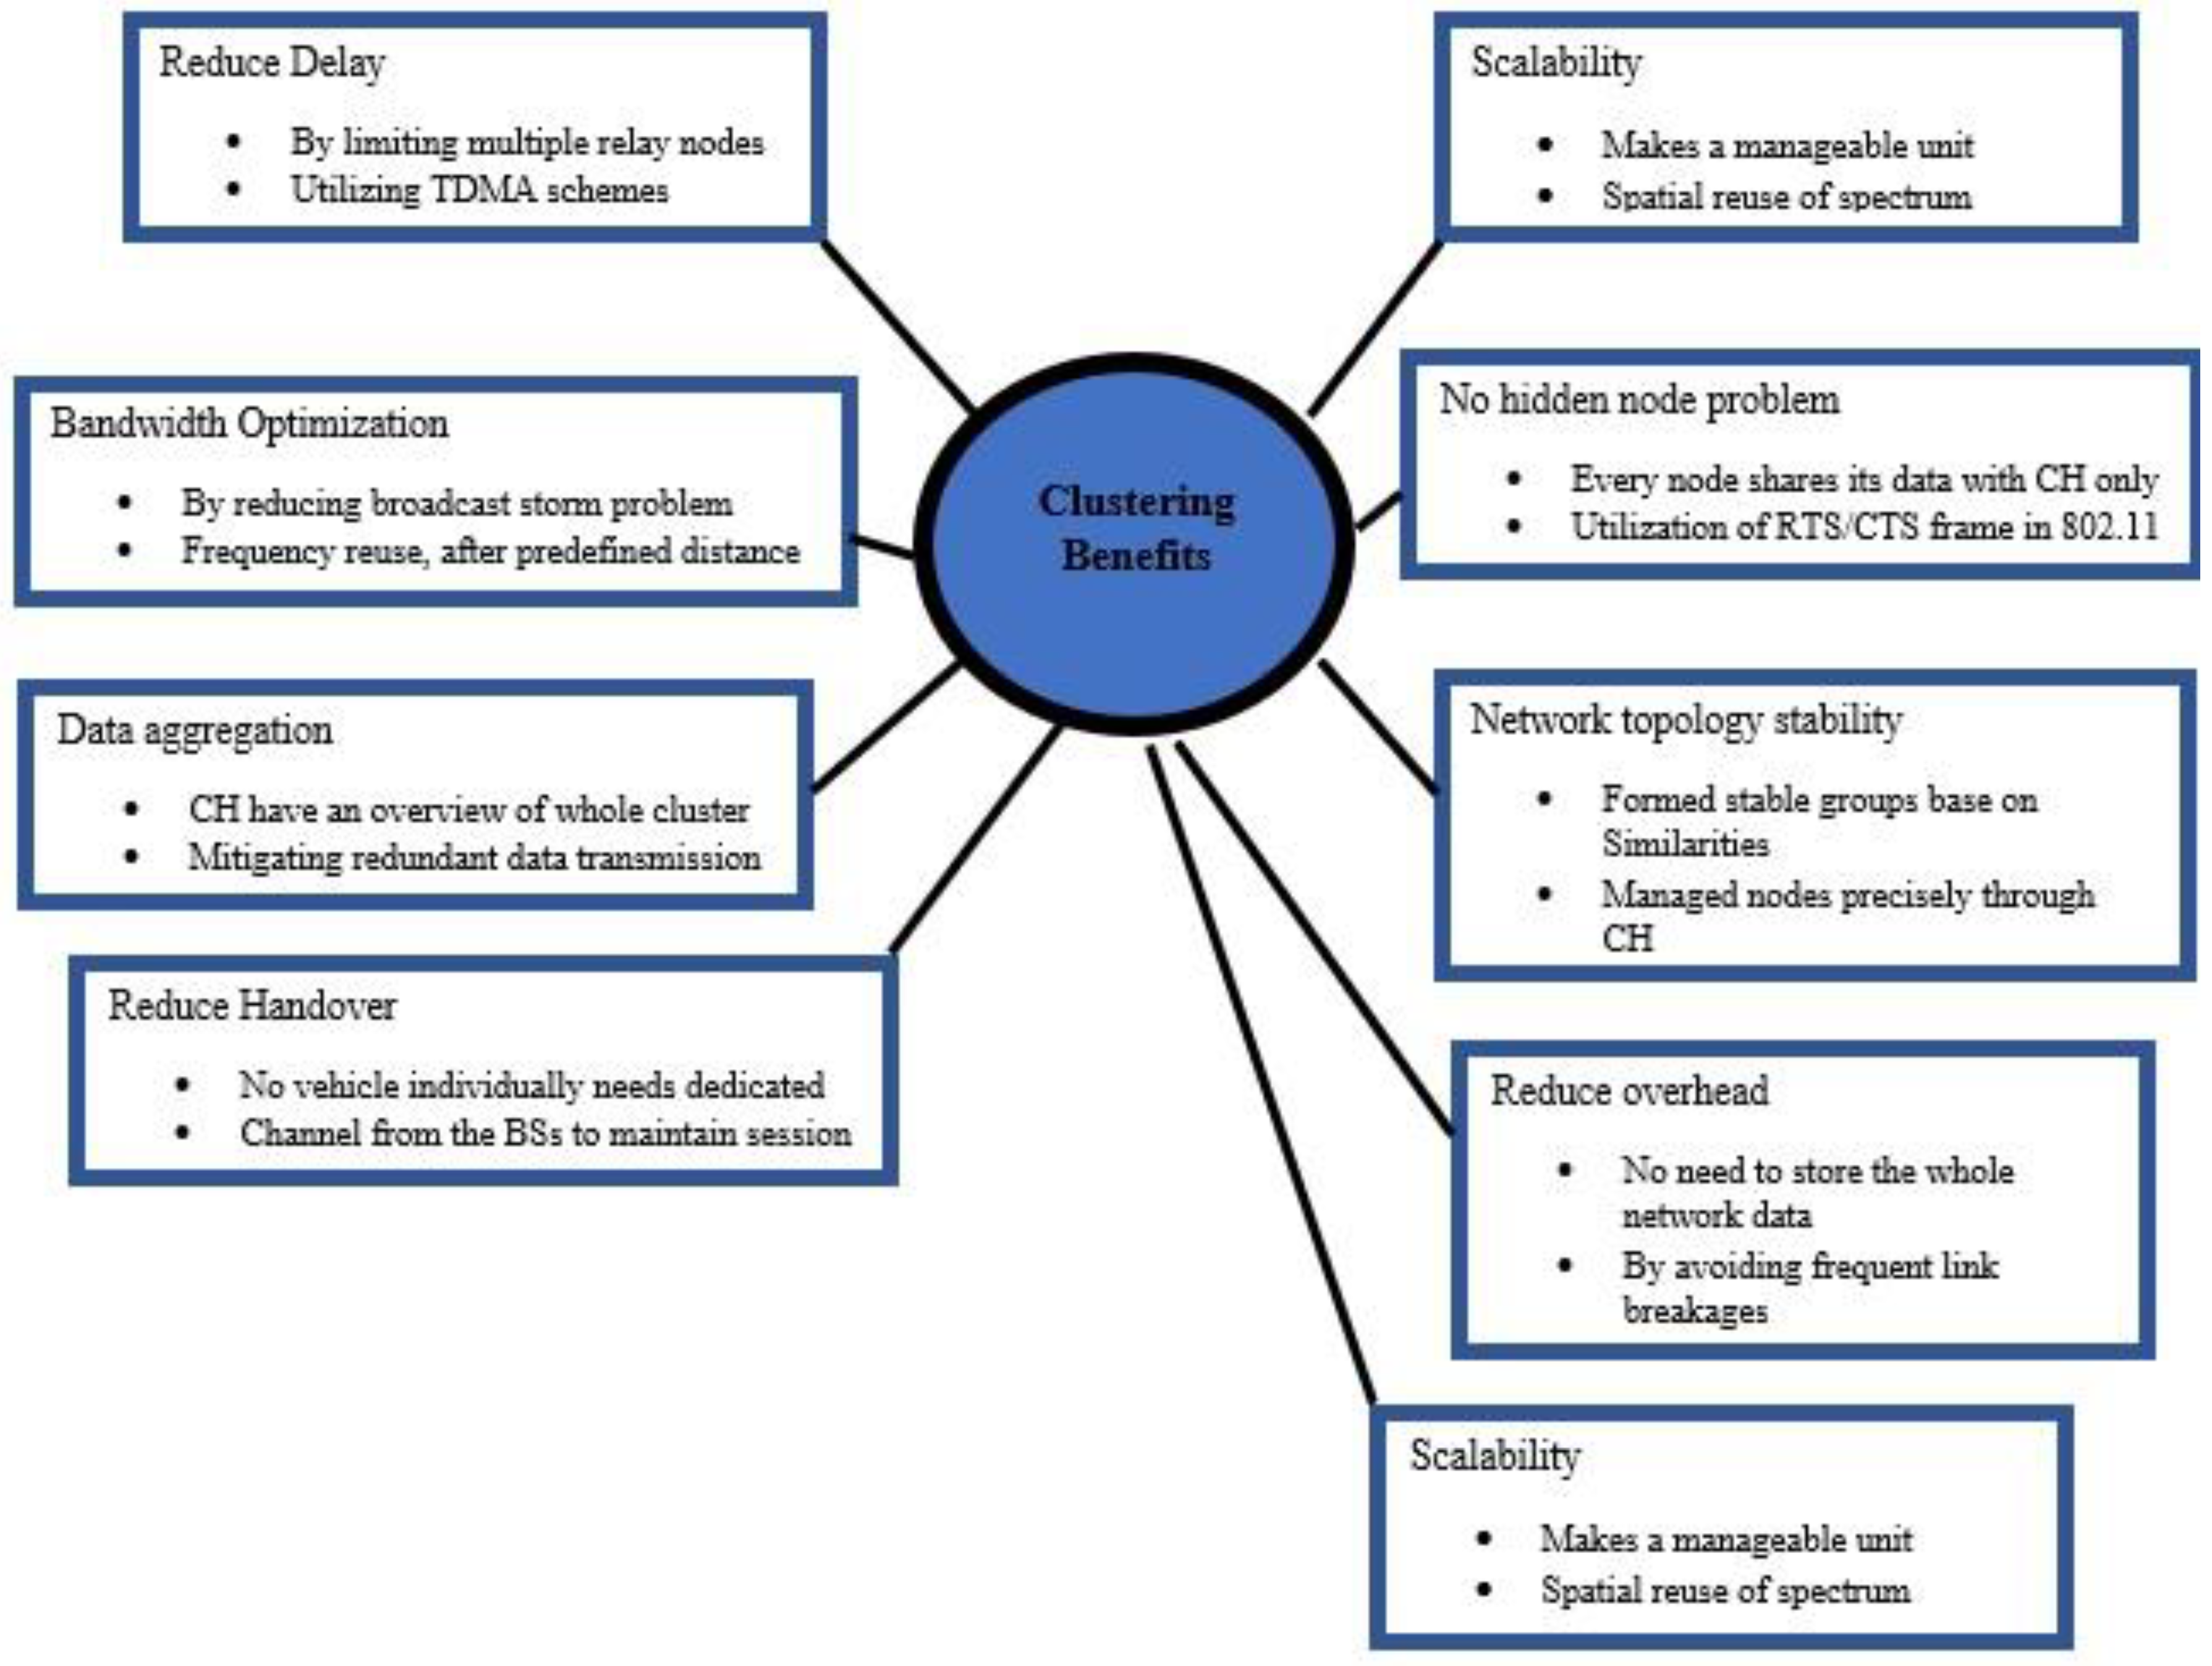
Figure 1. Cluster Optimization Advantages in VANETs [19].
Energies 16 01456 g001
Figure 2. Clustering in VANETs [21].
Energies 16 01456 g002
Figure 3. Framework for the developed method.
Energies 16 01456 g003
Figure 4. Transmission range vs. CHs for Nodes 100 and Grid Size 1 km × 1 km, 2 km × 2 km, 3 km × 3 km, and 4 km × 4 km. (a) Nodes = 100, Grid-Size = 1 km × 1 km; (b) Nodes = 100, Grid-Size = 2 km × 2 km; (c) Nodes = 100, Grid-Size = 3 km × 3 km; (d) Nodes = 100, Grid-Size = 4 km × 4 km.
Energies 16 01456 g004
Figure 5. Comparison of 30 Nodes on a Grid with Different Numbers of Clusters.
Energies 16 01456 g005
Figure 6. Comparison of 40 Nodes on a Grid with Different Numbers of Clusters.
Energies 16 01456 g006
Figure 7. Packet Delivery Ratio for 30–100 Nodes.
Energies 16 01456 g007
Figure 8. Latency for 30–100 Nodes.
Energies 16 01456 g008
Figure 9. Average Throughput for 30–100 Nodes by taking 1 km × × 1 km Grid Size.
Energies 16 01456 g009
Figure 10. Load balance factor for 40 Nodes at the Grid size of 1 km × 1 km.
Energies 16 01456 g010
Figure 11. Load balance factor for 50 Nodes at the Grid size of 1 km × 1 km.
Energies 16 01456 g011
Table 1. Simulation Parameters.
ParametersValues
Number of vehicles (Particles)100
Epoch350
Vehicle Speed22–30 m/s
Grid size (Area of Network)1 km × 1 km to 4 km × 4 km
Communication Range100–600 m
Mobility ModelFreeway Mobility Model
Number of Simulations10
Weights0.5
Convergence Factor0.001
ProcessorAMD Radeon™ RX 5700 XT
Memory8 GB
Table 2. Transmission Regression Coefficients Under Fully Modified Least-Squares (FMOLS) Approaches Vary Depending on the Number of Clusters.
Dependent VariablesVariableCoefficientProb.R-SquaredAdjusted R-SquaredANOVA
NO OF CLUSTERS ALO [38]TR0.0420880.00970.7153760.679798F(1 9) = 20.73 ***
C27.732940.0005
NO OF CLUSTERS GWO [22]TR0.0400380.01240.7062130.669490F(1 9) = 22.81 ***
C27.155280.0006
NO OF CLUSTERS p-WOATR0.0392560.00920.7797480.752216F(1 9) = 25.55 ***
C27.004850.0004
*** p < 0.01 or 1%.
Disclaimer/Publisher’s Note: The statements, opinions and data contained in all publications are solely those of the individual author(s) and contributor(s) and not of MDPI and/or the editor(s). MDPI and/or the editor(s) disclaim responsibility for any injury to people or property resulting from any ideas, methods, instructions or products referred to in the content.