Article

Financial and Economic Stability of Energy Sector Enterprises as a Condition for Poland’s Energy Security—Legal and Economic Aspects

1
Department of Finance, Institute of Economics and Finance, Cardinal Stefan Wyszyński University, 01-815 Warszawa, Poland
2
Department of Finance, Warsaw University of Life Sciences—WULS, 02-787 Warszawa, Poland
3
Faculty of Law in Warsaw, SWPS University of Social Sciences and Humanities, 03-815 Warszawa, Poland
*
Authors to whom correspondence should be addressed.
Energies 2023, 16(3), 1442; https://doi.org/10.3390/en16031442
Submission received: 22 December 2022 / Revised: 23 January 2023 / Accepted: 27 January 2023 / Published: 1 February 2023

Abstract

:
The energy security of each country is one of the main factors of its proper functioning. Currently, in the era of problems related to energy security resulting from, among other things, the war in Ukraine, this topic is particularly important. This article presents issues related to Poland’s energy security, understood as the financial and economic stability of enterprises operating in the energy industry. This stability is considered in two aspects: macroeconomic, where the focus is mainly on the aspect of state intervention in market processes; and microeconomic, where factors determining the financial security of energy enterprises were identified, including internal and external factors affecting the functioning of these entities. In order to achieve the assumed research goals, the analysis of the indicated problems was based on non-reactive research, consisting in the assessment of the available information. It included studies of normative acts, official statistical data, industry reports and analyses, as well as data obtained in the form of a public information request. Two basic research methods were used in the work—dogmatic–legal and comparative analyses. The identification of factors affecting the security of companies in the sector was carried out on the basis of data on the entire energy sector in Poland for the years 2015–2021 on a semi-annual basis. Vector-autoregressive models were used for the analysis. As a result of the analyses, it was established that market failures and public safety are the premises justifying the public financing of enterprises in the electricity generation, transmission, distribution and trade sectors. At the same time, the conducted research showed that the level of financial security of energy enterprises in Poland was affected by the ratio of the value of goods and materials sold to net sales revenue, as well as the level of EBIT (earnings before deducting interest and taxes) margin, and among external factors, the level of GDP (gross domestic product), CPI (consumer price index) and Crude Oil were important.

1. Introduction

The energy security of each country is one of the main factors of its proper functioning. This is due to its impact on the functioning of the entire economy, in the context of the economy’s dependence on energy supplies, as well as the living needs of the population. Due to the energy security of the state, pursuant to is understood as “the state of the economy enabling the coverage of the current and prospective demand of consumers for fuels and energy in in a technically and economically justified manner, while maintaining the requirements of environmental protection” [1]. However, it should be remembered that the entities ensuring energy security are companies from the electricity generation, transmission, distribution and trade sectors. Energy companies operate in a specific sector of the economy. They can operate under market conditions, but in many cases, these enterprises operate on the basis of a natural monopoly (network enterprises), as a result of which they are not subjected to direct market mechanisms. This also translates into the legal form of their operation: they can operate both as commercial law companies and be units of the public finance sector [2]. In many cases, supervisory authorities conduct activities aimed at introducing a substitute for competition in the sector in order to improve the efficiency of companies in the sector. On the other hand, the energy transformation and the development of the energy sector require significant investment outlays, which often exceed the capabilities of enterprises and would be impossible to implement under market conditions. That, in turn, forces you to intervene in market processes, disturbing them at the same time.
In the social market economy, state intervention in market processes through public support for selected groups of enterprises may take place only in justified circumstances and must meet certain conditions. It is assumed that state expenditure in this respect should, in particular, take into account the applicable provisions of law, be justified by the socioeconomic policy of the state, be rational by using appropriate planning methods and be effective [3]. Therefore, when assessing the admissibility of public support for selected groups of enterprises, it is necessary to determine whether there is a justification for state intervention in this area. Such a factor may be strengthening the country’s energy security, for example.
Contemporary energy companies are forced to operate in a specific external environment [4]. This environment opens up certain opportunities and opportunities for them, but at the same time, it imposes requirements and limitations on them. This is due to the fact that the environment in which modern enterprises operate is becoming more and more complex and changeable. In addition, the number of business entities and institutions that affect the functioning of these entities is increasing, and the scope of links between enterprises and the environment is constantly expanding: from the technical and economic sphere, it extends to the sphere of social, political and cultural problems. Therefore, modern enterprises have less and less opportunities to influence the environment in which they operate. In addition, the dependence of companies on external operating conditions is increasing to a greater extent. Each enterprise, in order to survive in the market and maintain a competitive advantage, must adapt to changes in the environment. For this reason, today there is an orientation of enterprises to subordinate to the changes taking place in the internal and external sphere, which is not only a requirement for the survival of companies, but also an important factor in their development [5]. Additionally, adaptation and development processes affect the increase in the efficiency of enterprises, directly determining the pace of creating their value. Therefore, companies operating in this way will be able to multiply the value of the company’s capital and thus achieve one of the most important goals of its owners, that is, to maximize the market value, which, in the long run, gives greater opportunities to maximize profit [6,7].
The conditions for the development of enterprises that affect their economic condition and competitiveness can be divided into two main groups [8]:
  • Macroeconomic conditions, i.e., economic situation, inflation, demand, supply, legal regulations, economic growth dynamics, sociocultural factors, technical and technological development, tax system, financial system, currency stability, etc.;
  • Microeconomic conditions, i.e., production profile, fixed assets, amount of capital, product quality, sales profitability, cooperation links, implementation of scientific and technical progress, skills of employees and management, level of technology, trademark, entrepreneurship of the staff, resource management, etc.
External factors, which have their source in the company’s environment and are independent of it, are largely a derivative of the policy of state authorities and market regulation mechanisms, and they are also influenced by both the general condition and economic situation in a given country, as well as the global economic situation. In turn, internal factors are related to the activities undertaken by a company and are closely related to its financial condition, material resources, intellectual capital, organizational structure, adopted development strategy, management methods, entrepreneurship, innovation and the quality of products and services [9]. As can be seen, many macroeconomic factors can be distinguished among the external conditions of enterprise management.
Internal factors include those resources and conditions that remain in the possession of a single entity or are under its control. This group includes tangible capital assets, cash resources, semi-finished products, and materials, as well as knowledge and qualifications of employees and creditworthiness. The research conducted provides a comprehensive overview of issues related to the financial security of energy companies in Poland. The research carried out takes into account both legal and financial aspects, which, together, determine the functioning of these entities, but are also of key importance for the energy security of Poland. This is particularly important in view of the current situation related to the war in Ukraine and the resulting problems in the energy market around the world. In addition, the results of the study point to key issues related to the financial management of these companies, which have an impact on ensuring Poland’s energy security. To date, such a comprehensive study has not been conducted in relation to the energy sector and the results obtained can be successfully used by managers of energy companies, as well as legislators, to determine the legal conditions defining the framework for the operation of these enterprises and the country’s energy security.

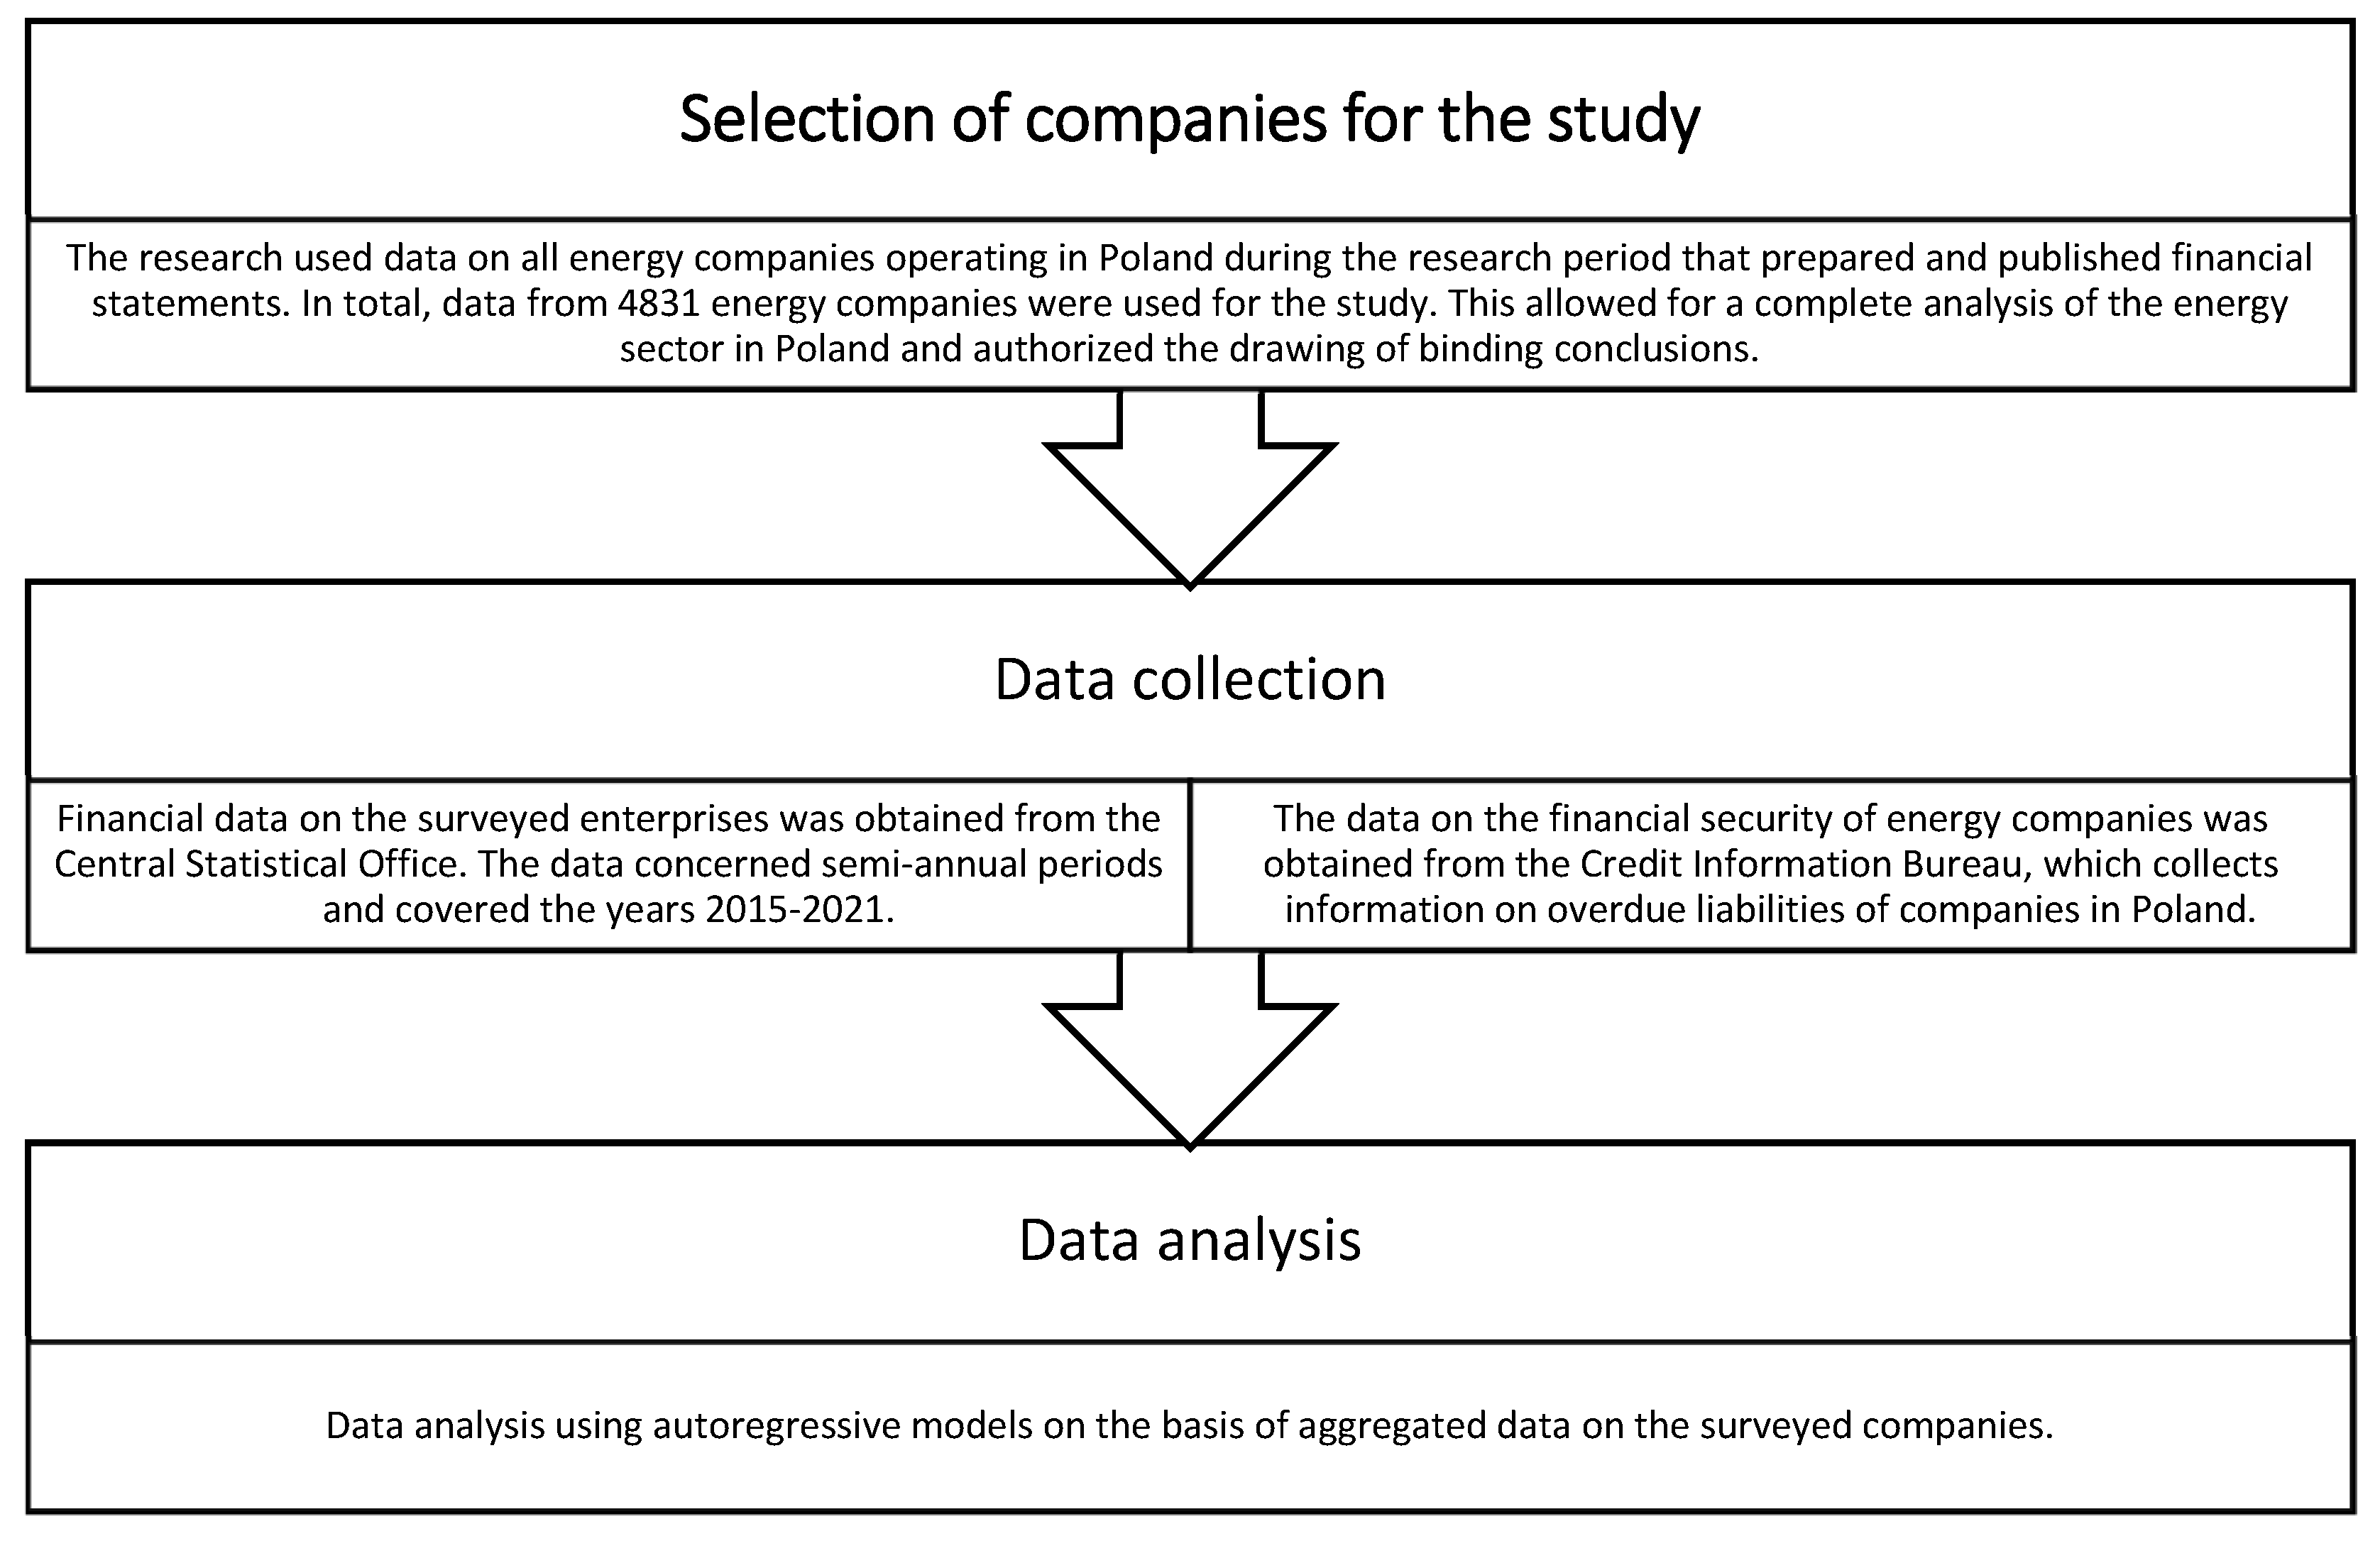
2. Materials and Methods

In order to achieve the assumed research goals, the analysis of the indicated problems was based on non-reactive research, consisting in the assessment of the available information. Two basic research methods were used in the work—dogmatic–legal and comparative analyses. The subject of the dogmatic–legal method was the analysis of the content of normative acts, both at the national and EU level, regulating the rules of admissibility of financing market entities from public funds. Statistical analysis was also applied by using vector-autoregressive (VAR) models, which were developed as an alternative to the structural approach to multi-equation modeling [10,11].
The analysis of factors determining the financial security of energy companies was carried out on the basis of data on the entire energy sector in Poland for the years 2015–2021 on a semi-annual basis. The data collected for analysis came from financial statements published by energy companies and from information collected by the Credit Information Bureau. In addition, macroeconomic data published by the Central Statistical Office and commodity market quotations on commodity exchanges were used. A detailed analysis of the data is presented in Appendix A. A great advantage of the conducted research is the size of the research sample, which exceeded 48 thousand enterprises at the end of 2021. This allowed us to draw binding conclusions for the entire population of energy companies in Poland.
The research was conducted by taking into account groups of internal factors grouped according to an area:
  • Resultant: Earnings Before Deducting Interest and Taxes (EBIT) margin, Return on Equity (ROE), return on invested capital (ROIC) and Return on Assets (ROA);
  • Cost: depreciation to net sales revenues, materials to net sales revenues, energy to net sales revenues, third-party services to net sales revenues, costs of salaries and overheads to net sales revenues, value of goods and materials sold to revenues net sales, and other costs to net sales revenues;
  • Balance-sheet structure: fixed assets, current assets, equity, long-term liabilities, short-term liabilities, interest-bearing debt (excluding other financial liabilities;
  • Debt: EBITDA × A/(long-term liabilities + short-term liabilities), interest coverage ratio, debt under loans, borrowings and securities issues/equity, (long-term liabilities + short-term liabilities)/total assets equity/total assets and equity/fixed assets coverage of fixed assets with fixed capital;
  • Liquidity: current liquidity ratio, increased liquidity ratio and cash liquidity ratio;
  • Operational efficiency: rotation of trade receivables in days, rotation of inventories in days, rotation of trade payables in days and cash conversion cycle.
Additionally, there were included external factors determining the following:
  • Economic situation: gross domestic product (GDP), Retail Sales and Consumer Price Index (CPI);
  • Situation on the market of energy resources (WTI Oil, Gas (Netherlands) and Coal (Newcastle)).
To determine the level of financial security of energy enterprises, the following indicators were used:
  • Share of unprofitable companies in the energy sector;
  • Share of companies with delays in repayment of credits and loans exceeding 90 days.
The method of calculating the indicators is presented in the annexes to this article.
The classic form of the vector-autoregressive model proposed by Sims is as follows:
Z t = i = 1 k A i Z t 1 + ε t  
where t = 1, 2, …, n; Z t is the vector of observations of the current values of all n variables of the model; A i is the matrix of autoregressive operators of individual processes, in which a priori no-zero elements are assumed; ε t is the vector of residual processes, for which it is assumed that individual components are simultaneously correlated with each other but do not contain autocorrelation; and kVAR is the model order.
It is a multi-equation econometric model, consisting of k equations. Importantly, there is no interdependence, and the set of explanatory variables consists only of processes delayed in time. In addition, VAR models assume that the delay order is the same in all processes and equals p.
The first step was to select the lag order of the variables. The choice of lags of variables in the vector-autoregressive model is a very important element of modeling, because too many lags lead to excessive complexity of the model, and too few lags may cause the autocorrelation of random components. The choice of the lag order of the variables can be made on the basis of several criteria indicating the best lag order. The most popular of them are the information criterion AIC (Akaike Information Criterion) or SBC (BIC) (Schwarz–Bayesian Criterion). These statistics have the following forms:
A I C l = l θ ˜ k
S B C l = l θ ˜ 1 2 k   l o g T
where l θ ˜ is the maximum value of the logarithm of the likelihood function of the model in which θ ˜ is the maximum likelihood estimator, k is the number of estimated parameters and T is the number of observations.
For a linear model, the maximum value of the log-likelihood function can be determined by the following formula:
L L K M N K = T 2 1 + log 2 π σ ˜ 2
where σ ˜ 2 is the MNW estimator of the variance of the random component.
To test the length of delays in the model using the statistic A I C l or S B C l , select the model for which the values of the corresponding statistic are the largest.
After determining the length of the delays, the parameters of the VAR model are estimated by using the classic method of least squares (LSM). After estimating the model, an important step is its verification in terms of the autocorrelation of random components and residual distribution.
The analysis was conducted on the basis of semi-annual historical data defining the financial situation of energy companies in Poland and selected macroeconomic data for the period of 2015–2021.
The statistical analysis followed the procedure described above, consisting of the following:
  • Analysis of normative acts, official statistical data, industry reports and analyses, as well as and data obtained through a public information request.
  • Analysis of statistical data on the Polish energy sector.
  • Selection of variables determining the level of financial security of energy companies and variables that can affect it, divided into internal variables and external variables.
  • Conducting statistical analysis using autoregressive models:
    Selection of the lag order of the variables,
    Estimation of VAR model parameters using the classical method of least squares.
The method of the study is shown in the diagram below (Figure 1).
This allows us to define all key areas of activity of energy companies, such as efficiency, cost-intensiveness, debt, liquidity, and operational efficiency, as well as data defining the macroeconomic situation in Poland, and quotations of key energy resources were taken into account in the analysis.

3. Results

3.1. Limits of State Intervention in Market Processes

Supporting public enterprises (e.g., financial support or reliefs in the repayment of public law liabilities) is an unobvious form of activity of the state and its authorities. This is due to the fact that it is related to the intervention of the state apparatus in economic relations, which, in the current socioeconomic system, are regulated by market forces. The presented thesis results from both the general principles of the Constitution of the Republic of Poland (in particular, Articles 20 and 22) and normative solutions at the level of EU law—Art. 107 of the Treaty on the Functioning of the European Union, according to which aid granted by a Member State or through state resources in any form which distorts or threatens to distort competition by favoring certain undertakings is, in principle, incompatible with the internal market to the extent that it affects trade between Member States [12]. Before 2020, exceptions to the abovementioned rule of non-intervention of the state in market processes most often resulted from the legitimacy of supporting selected types of enterprises in connection with the occurrence of certain market failures. An example of this is supporting enterprises from the sector of micro-, small- and medium-sized enterprises (as those that have limited access to capital due to limited creditworthiness resulting from the scale of their operations). Another example is aid for research, development and innovation activities (as particularly important from the point of view of the economy of the European Union). The admissibility of this intervention was explicitly expressed in Articles 17–24 and 25–30 of Commission Regulation (EU) No 651/2014 of 17 June 2014 declaring certain types of aid compatible with the internal market pursuant to Art. 107 and 108 of the Treaty [13].
Since 2020, the mechanisms allowing public support for enterprises have been dynamically modified, first in connection with the outbreak of the COVID-19 pandemic and then the outbreak of the war in Ukraine. Examples of solutions in this area are Communication from the Commission—Temporary Framework for State aid measures to support the economy in the current COVID-19 outbreak (2020/C 91 I/01) of 20.3.2020 and Communication from the Commission Temporary Crisis Framework for State Aid measures to support the economy following the aggression against Ukraine by Russia (2022/C 131 I/01) of 24.3.2022. The modification of the rules concerning state intervention in market processes resulted from profound changes in the economic environment which resulted from the effects of the indicated events. These effects include, for example, the disturbance of the demand–supply balance for goods and services, limiting the mobility of the population, limiting the supply caused by the disruption of supply chains and the absence of employees at the workplace, deterioration of the financial liquidity of enterprises or drastic increases in the prices of energy carriers.

3.2. Energy Security as a Prerequisite for Public Financing

Taking into account the presented assumptions related to the importance of the state’s energy security, it is reasonable to determine the admissibility of state intervention in this area on a normative basis—this issue is part of a broader problem relating to the relationship between the state (including public administration bodies) and business entities [14]. Pursuant to Art. 22 of the Constitution of the Republic of Poland, the limitation of the freedom of economic activity is allowed only by statute and only for important public interest. Arbitrary state intervention in a selected sector of the economy, e.g., by providing financial support, violates market mechanisms and, consequently, affects economic freedom—by creating unequal rules of competition. Therefore, it should be determined whether, in the case of public support for enterprises from the energy sector, the energy security of the state meets the condition of important public interest and justifies such an intervention?
The concept of the public interest has occupied a special place in the dogma of law (especially administrative law) for a long time. Due to its meaning, at least several types of concepts (often different) of understanding this term have been developed. Signaling only this issue, it is worth noting that one of the types of concepts assumes that the public interest is linked to values (axiological concepts). According to them, “[...] the notion of public interest is a normative duty guideline that defines the scope and content of values recognized by a given community as worthy of protection, regardless of the individual beliefs of individuals”. It is also the limit of admissible interference of public authorities in social and economic relations and in the freedom of citizens, and from the point of view of citizens, it is the limit of freedom of individual activity [15]. Another type of concept of public interest relates to goals (praxeological concepts). Within them, the basis for specifying the interest is the category of the goal. Another type of concept, on the other hand, links public interest with needs; an interest can be based on a need or a set of needs [5].
On the basis of all the indicated concepts, it is necessary to determine the premise which is the point of reference when determining the occurrence of the public interest. Considering the above, for the purpose of analyzing the admissibility of public support for enterprises from the energy sector, it is necessary to determine what may be of public interest as part of financing these enterprises—in terms of values, goals and needs.
To determine this premise, one should refer to the characteristics of companies from the energy sector. It should be noted that the discussed enterprises are active in market conditions, but they operate in a strategic sector from the point of view of the state’s economic policy. The energy industry affects not only other enterprises or individuals, but also translates and ensures the security of the entire state—limiting access to the use of energy resources would certainly lead to its paralysis. The normative confirmation of the above are the regulations of the Act of April 10, 1997—Energy Law. Pursuant to this act, energy security was defined directly as the condition of the economy that enables covering the current and prospective demand of consumers for fuels and energy in a technically and economically justified manner, while maintaining the requirements of environmental protection. In addition, the legislator clarified the concepts of security of electricity supply and security of operation of the power grid. The security of electricity supply has been defined as the ability of the power system to ensure the security of the operation of the power grid and to balance the supply of electricity with the demand for this energy. On the other hand, the security of the operation of the power grid has been defined as uninterrupted operation of the power grid, as well as meeting the requirements for the quality parameters of electricity and quality standards of customer service, including admissible interruptions in the supply of electricity to end users, under foreseeable operating conditions of this network.
The premise that may affect energy security, security of electricity supply and security of operation of the power grid is therefore the economic stability of enterprises in the electricity generation, transmission, distribution and trade industries. Bankruptcy or liquidation of these enterprises would generate significant economic risk, which would be contrary to the public interest. Considering the above, it should be assumed that, on the normative basis, public support for enterprises from the energy sector is acceptable and justified.

3.3. Factors Determining the Financial Security of Energy Companies

In the next step, the lag order of the variables was determined by using the AIC and BIC information criteria (see Table 1). As a result of the analyses carried out, according to the AIC, BIC and HQC criteria, the best level of delays is one; due to the nature of the analysis, the level of delays was assumed to be one, which indicates a row of delays of 6 months.
Next, the VAR model was estimated for variables determining the level of financial security of energy companies, using all variables, and in the next steps, variables that were not significant were eliminated until a set of significant variables was obtained, enabling the estimation of the level of security of energy companies. The model estimation results are presented in Table 2 and Table 3.
The conducted research showed that the level of financial security of energy enterprises in Poland was affected by the ratio of the value of goods and materials sold to net sales revenue (Model 1 and Model 2), as well as the EBIT margin (Model 1), GDP, CPI and Crude Oil. These results indicate that energy companies should strive to increase the share of revenues from the sale of energy in total revenues, which is indicated by the negative regression coefficient for the variable determining the value of goods and materials sold to net revenues from sales, as the sale of goods and materials has a negative impact on both the profitability of energy companies and the risk of their insolvency. Moreover, the factor that energy companies should pay special attention to is the level of EBIT margin, the increase of which contributed to the improvement of their financial security, which results from the fact that companies with high levels of this margin could accumulate an appropriate safety buffer as a result of cumulation financial results and cash flows.
In addition, the research showed that the security of energy companies depended on the macroeconomic situation in the country. In Model 1, the level of GDP was important, the increase of which contributed to the increase in the financial security of energy companies, as the increase in GDP was associated with increased production and consumption, which translated into higher energy consumption in the economy and thus contributed to improving the situation of these entities. Additionally, among the macroeconomic factors, the CPI level turned out to be important, the increase of which increased the risk of a decrease in the financial security of energy companies, which resulted from the fact that a high level of inflation had a negative impact on the economic situation and could contribute to a decrease in demand for energy produced by the surveyed entities.
Model 2 also included a variable determining the price of the raw material used for energy production, i.e., crude oil, the increase of which significantly affected the financial security of energy companies, which resulted from the cost-generating nature of this factor. Considering the above, it can be concluded that the security of energy companies depends on the sources of their revenues, which should be generated from the sale of energy directly produced by these companies, as well as an appropriate level of EBIT margin, which allows a company from this sector to operate safely. In addition, the financial security of energy companies was affected by macroeconomic factors that indicate the state of the economic situation, which may indicate the need for intervention by the state in order to ensure energy security in Poland. The cost of purchasing raw materials for energy production was also significant, which forces energy companies to take actions that can stabilize their level by applying strategies to hedge the related market risk.

4. Discussion

The subject of the article was an analysis of issues related to Poland’s energy security, understood as the financial and economic stability of enterprises operating in the energy industry. Stability was considered in regard to two aspects: macroeconomic and microeconomic. From the macroeconomic point of view, the basic point of reference was the analysis related to the admissibility of state intervention in the economy. It was established that, in the case of energy enterprises operating on market principles, the admissibility of state aid is significantly limited. The condition for such aid is the identification of a premise constituting an important public interest, allowing, by way of exception, aid for these enterprises. As has been shown, the energy security of the state is important; therefore, in order to ensure the financial and economic stability of these enterprises, it is reasonable to allow the state intervention in this area. The presented analysis offers a new look at Poland’s energy security through the prism of the security of enterprises in this sector. In the authors’ opinion, this security may be increased by creating optimal conditions for companies from the energy sector to function in the conditions of a market economy. In addition, the authors identified internal factors determining the security of the functioning of these enterprises [16]. It should be emphasized that this issue in the presented aspect was not the subject of comprehensive scientific research, taking into account the current economic conditions. The main research in this area concerned the general economic and geopolitical factors affecting the security of the state [5,7,17,18].
The particular value of this research is the fact that it deals with topics that have not been extensively studied in the doctrine so far. This is due to the fact that the issues of energy security of the countries of Central and Eastern Europe have radically changed in the context of the outbreak of war in Ukraine. It should also be emphasized that the research area covers the dynamically changing economic environment. The theses put forward will be verified in economic practice. The authors will conduct further research in this area, and this article is a starting point for further research. An important aspect and novelty of this research is its comprehensiveness, resulting from a combination of legal analysis, assessment of the macroeconomic and financial situation of energy companies. In addition, an important aspect of the research is the possibility of its practical use by managers of energy companies and politicians.

Author Contributions

Conceptualization, A.Z., R.B. and D.K.; methodology, A.Z., R.B.; formal analysis, A.Z., R.B. and D.K.; investigation, A.Z., R.B. and D.K.; writing—original draft preparation, A.Z., R.B. and D.K.; writing—review and editing, A.Z., R.B. and D.K.; supervision, A.Z.; project administration, R.B. All authors have read and agreed to the published version of the manuscript.

Funding

This research received no external funding.

Data Availability Statement

Data available upon request.

Conflicts of Interest

The authors declare no conflict of interest.

Appendix A. Selected Financial Data Characterizing the Surveyed Energy Companies in Poland

General InformationCalculation FormulaUnit1H 20152H 20151H 20162H 20161H 20172H 20171H 20182H 20181H 20192H 20191H 20202H 20201H 20212H 2021
Number of companies reportingNumber of companies that have submitted a reportpcs.48,73252,39549,09152,71148,72952,06046,67950,48146,24050,78345,29949,60043,78448,341
Working in the sectorNumber of employees in the sectorpersons5,061,1725,202,6765,203,4315,371,3705,339,5195,503,1755,398,1665,556,9315,399,9965,588,7365,318,7415,493,0165,363,8015,555,250
Company resultsCalculation formulaunit1H 20152H 20151H 20162H 20161H 20172H 20171H 20182H 20181H 20192H 20191H 20202H 20201H 20212H 2021
Total revenueNet sales revenue + other operating revenue + financial revenuemln PLN1,483,5741,632,5881,525,4871,727,8721,670,0871,804,1851,752,4881,938,3971,864,5002,019,8151,763,7402,063,5152,090,9282,601,563
Year-on-year change in total revenue [%]Total revenue/year-to-date total revenue%bdbd2.80%5.80%9.50%4.40%4.90%7.40%6.40%4.20%−5.40%2.20%18.60%26.10%
Net sales revenueNet sales revenuemln PLN1,436,0691,579,4021,471,1721,673,5361,611,0661,745,1571,696,6691,889,0971,810,1631,968,1671,706,3391,994,7142,018,8222,512,652
Year-on-year change in net revenue [%]Net sales revenue/year to date net sales revenue%bdbd2.40%6.00%9.50%4.30%5.30%8.20%6.70%4.20%−5.70%1.30%18.30%26.00%
Net revenue in the countryNet revenue—net revenue from sales treated as exportsmln PLN1,126,5971,258,7681,142,8781,318,1711,241,4921,359,5211,311,8551,487,5761,389,4561,531,8901,330,1761,537,1071,535,6901,954,500
Net export revenuesNet sales revenues treated as exportsmln PLN309,473320,634328,294355,365369,574385,636384,813401,522420,707436,277376,164457,607483,132558,152
Sales profitSales profitmln PLN71,27971,02972,68784,47676,10888,49484,15887,67083,73096,36478,142106,170116,231147,127
Sales profit marginProfit (loss) on sales/revenue from sales%5.00%4.50%4.90%5.00%4.70%5.10%5.00%4.60%4.60%4.90%4.60%5.30%5.80%5.90%
EBITOperating profitmln PLN77,74575,12180,95888,65883,60891,89691,53287,62190,64198,28587,305111,135137,628170,069
EBIT marginEBIT/net sales revenue%5.40%4.80%5.50%5.30%5.20%5.30%5.40%4.60%5.00%5.00%5.10%5.60%6.80%6.80%
EBITDAEBIT + amortizationmln PLN124,862134,530130,405141,374135,391147,947145,302146,506149,905163,786151,102178,666203,818243,316
EBITDA marginEBITDA/net sales revenue%8.70%8.50%8.90%8.40%8.40%8.50%8.60%7.80%8.30%8.30%8.90%9.00%10.10%9.70%
Net profitNet profitmln PLN68,80751,81873,45366,14379,08575,70075,69968,32779,11575,06765,19383,671123,261145,491
Net profit marginNet profit/net sales revenue%4.80%3.30%5.00%4.00%4.90%4.30%4.50%3.60%4.40%3.80%3.80%4.20%6.10%5.80%
ROENet profit/equity capital%10.30%7.40%10.60%9.20%11.00%9.90%10.00%8.60%10.00%9.10%8.00%9.80%14.10%15.40%
ROICEBIT/fixed capital%8.40%7.80%8.40%8.80%8.30%8.70%8.70%8.00%8.20%8.30%7.30%8.90%10.90%12.70%
ROANet profit/total assets%5.20%3.70%5.20%4.50%5.40%4.90%4.80%4.20%4.80%4.30%3.70%4.60%6.50%7.00%
CostsWzórunit1H 20152H 20151H 20162H 20161H 20172H 20171H 20182H 20181H 20192H 20191H 20202H 20201H 20212H 2021
Depreciation to net sales revenueDepreciation/net sales revenue%3.30%3.80%3.40%3.10%3.20%3.20%3.20%3.10%3.30%3.30%3.70%3.40%3.30%2.90%
Materials to net sales revenueMaterials/net sales revenue%25.20%24.00%24.60%23.20%24.80%24.50%25.30%24.20%24.80%23.50%22.70%23.10%24.40%24.70%
Energy to net sales revenueEnergy/net sales revenue%1.60%1.50%1.50%1.40%1.40%1.30%1.40%1.20%1.50%1.30%1.60%1.40%1.60%1.40%
Third-party services to net sales revenueThird-party services/net sales revenue%14.10%15.60%14.40%15.30%14.10%15.60%14.20%15.60%14.10%15.90%14.90%15.40%14.10%14.80%
Costs of salaries and surcharges to net sales revenueCosts of salaries and surcharges/net sales revenue%11.10%11.00%11.60%11.20%11.50%11.50%11.80%11.70%12.00%12.00%12.90%12.50%12.00%11.40%
Value of goods and materials sold to net sales revenueValue of goods and materials sold/net sales revenue%34.80%34.90%34.60%35.40%35.40%34.70%34.40%34.70%34.80%34.50%34.40%34.40%33.90%34.20%
Other costs to net sales revenueOther costs/net sales revenue%4.90%4.80%5.10%5.20%4.80%4.20%4.80%4.90%4.90%4.60%5.10%4.60%5.00%4.70%
Balance sheetCalculation formulaunit1H 20152H 20151H 20162H 20161H 20172H 20171H 20182H 20181H 20192H 20191H 20202H 20201H 20212H 2021
Fixed assetsFixed assetsmln PLN1,633,0521,719,0121,718,7681,784,8841,780,9501,860,3371,867,6041,946,2221,977,7032,095,0052,114,5012,197,8612,175,1412,283,354
Current assetsCurrent assetsmln PLN1,038,9921,070,7531,096,1201,151,9151,159,5681,242,8101,263,7681,318,9761,336,4891,401,4981,387,7291,474,3131,611,8941,864,970
Equity capitalEquity capitalmln PLN1,340,9011,396,7801,384,3391,436,9001,437,7291,530,3291,518,6971,584,5541,583,3201,656,7111,639,7151,710,8161,746,0921,891,006
Long-term liabilitiesLong-term liabilitiesmln PLN413,681437,434449,075473,884467,295479,567492,900497,317523,482562,324628,099644,477645,746675,111
Short-term liabilitiesShort-term liabilitiesmln PLN692,060715,870735,707776,289785,899833,932861,741908,902927,207971,887925,303982,0581,055,2371,217,107
Interest-bearing debt (excluding items of other financial liabilities)Interest-bearing debt (excluding items of other financial liabilities)mln PLN547,817582,553591,274620,217622,368623,688645,364669,741687,418725,909784,463791,804794,714858,227
Debt ratiosCalculation formulaunit1H 20152H 20151H 20162H 20161H 20172H 20171H 20182H 20181H 20192H 20191H 20202H 20201H 20212H 2021
EBITDA/(long-term liabilities + short-term liabilities)EBITDA/(long-term liabilities + short-term liabilities)0.230.230.220.230.220.230.210.210.210.210.190.220.240.26
Interest service coverage ratio(Net income + depreciation and amortization + income tax + interest)/interests11.89.912.7111312.212.412.613.411.412.514.822.620.6
Financing structure indicatorsCalculation formulaunit1H 20152H 20151H 20162H 20161H 20172H 20171H 20182H 20181H 20192H 20191H 20202H 20201H 20212H 2021
Debt from loans, borrowings and securities issues/shareholders’ equityDebt from loans, borrowings and securities issues/shareholders’ equity%40.90%41.70%42.70%43.20%43.30%40.80%42.50%42.30%43.40%43.80%47.80%46.30%45.50%45.40%
(long-term liabilities + short-term liabilities)/total assets(Long-term liabilities + short-term liabilities)/total assets%41.40%41.30%42.10%42.60%42.60%42.30%43.30%43.10%43.80%43.90%44.40%44.30%44.90%45.60%
Equity capital/total assetsEquity capital/total assets%50.20%50.10%49.20%48.90%48.90%49.30%48.50%48.50%47.80%47.40%46.80%46.60%46.10%45.60%
Equity capital/fixed assetsEquity capital/fixed assets%82.10%81.30%80.50%80.50%80.70%82.30%81.30%81.40%80.10%79.10%77.50%77.80%80.30%82.80%
Coverage of fixed assets with fixed capital(Equity capital + non-current liabilities)/fixed assets%107.40%106.70%106.70%107.10%107.00%108.00%107.70%107.00%106.50%105.90%107.30%107.20%110.00%112.40%
Liquidity ratiosCalculation formulaunit1H 20152H 20151H 20162H 20161H 20172H 20171H 20182H 20181H 20192H 20191H 20202H 20201H 20212H 2021
Current ratioCurrent assets/current liabilities1.51.51.491.481.481.491.471.451.441.441.51.51.531.53
Increased liquidity ratio(Current assets/inventories)/current liabilities1.111.11.111.11.091.11.081.061.051.051.111.111.141.13
Cash flow ratioCash and cash equivalents/current liabilities0.280.30.280.30.270.290.260.260.250.270.320.320.290.29
Working capital turnover ratiosCalculation formulaunit1H 20152H 20151H 20162H 20161H 20172H 20171H 20182H 20181H 20192H 20191H 20202H 20201H 20212H 2021
Trade receivables turnover in daysTrade receivables/net sales revenuedays47.543.148.844.546.645.547.644.147.443.94742.445.741.2
Inventory turnover in daysInventory/net sales revenuedays34.132.134.232.134.133.535.634.235.734.538.434.736.635.3
Trade payables turnover in daysTrade payables/net sales revenuedays43.741.144.742.943.844.945.742.944.243.143.842.544.242.5
Cash conversion cycleInventory turnover in days + receivables turnover in days—payables turnover in daysdays3834.238.333.836.834.137.535.338.935.341.634.738.234
Investment cycleCalculation formulaunit1H 20152H 20151H 20162H 20161H 20172H 20171H 20182H 20181H 20192H 20191H 20202H 20201H 20212H 2021
Capital expendituresCapital expendituresmln PLN627701014495991485706587339358864712104297768171124357168910417179254120710
Investment expenditures on average per companyCapital expenditures/number of companies that reportedmln PLN1.291.941.221.631.211.81.392.071.662.211.582.11.812.5
Labor productivity (Net income from sales of products + net income from sales of goods and materials)/employmentmln PLN0.280.3020.280.3090.2990.3150.310.3370.3310.3490.3180.3610.3720.447
Import and exportCalculation formulaunit1H 20152H 20151H 20162H 20161H 20172H 20171H 20182H 20181H 20192H 20191H 20202H 20201H 20212H 2021
Share of exports in total revenue Export sales/total revenues%20.90%19.60%21.50%20.60%22.10%21.40%22.00%20.70%22.60%21.60%21.30%22.20%23.10%21.50%
Share of imports in operating expensesValue of import purchases/total revenues%21.60%20.80%22.00%21.00%22.40%22.50%22.30%22.30%22.70%21.10%19.90%20.60%22.50%23.00%
Economic situationCalculation formulaunit1H 20152H 20151H 20162H 20161H 20172H 20171H 20182H 20181H 20192H 20191H 20202H 20201H 20212H 2021
PKBGDP%0.70%1.20%1.30%2.20%0.90%1.70%1.30%0.90%0.80%0.50%−9.10%0.10%2.20%1.60%
Sprzedaż detalicznaRetail sales%4.70%5.70%4.30%7.40%7.40%8.80%6.10%6.90%5.60%5.20%−7.70%−5.30%13.90%12.10%
CPICPI%−0.80%−0.50%−0.80%0.80%1.50%2.10%2.00%1.10%2.60%3.40%3.30%2.40%4.40%8.60%
Price of raw materialsCalculation formulaunit1H 20152H 20151H 20162H 20161H 20172H 20171H 20182H 20181H 20192H 20191H 20202H 20201H 20212H 2021
WTI crude oil Market quotationsUSD59.7937.1448.4152.6742.9858.166.745.3955.9361.5539.0647.7573.2873.31
Gas (Netherlands) Market quotationsUSD20.51514.66714.80517.83314.75119.95621.59422.60810.4112.5585.56517.9231.767134.526
Coal (Newcastle) Market quotationsUSD60.2451.9153.1286.8180.65100.24114.47101.6370.7666.8153.0681.26127.7169.38
Measures of financial securityCalculation formulaunit1H 20152H 20151H 20162H 20161H 20172H 20171H 20182H 20181H 20192H 20191H 20202H 20201H 20212H 2021
Share of unprofitable companies in the energy sectorNumber of unprofitable companies/number of companies that have reported%28.70%28.70%29.00%29.00%30.10%30.10%28.30%28.30%28.20%28.20%29.00%29.00%26.50%26.50%
Share of companies with delays in repayment of credits and loans exceeding 90 daysNumber of companies with delays of more than 90 in repayment of loans and credits/number of companies that have loans and credits %5.00%5.60%7.70%8.30%10.90%13.00%12.70%13.30%11.60%11.90%13.30%12.10%11.30%11.50%

References

  1. Mara, D.; Nate, S.; Stavytskyy, A.; Kharlamova, G. The Place of Energy Security in the National Security Framework: An Assessment Approach. Energies 2022, 15, 658. [Google Scholar] [CrossRef]
  2. Igliński, B.; Iglińska, A.; Koziński, G.; Skrzatek, M.; Buczkowski, R. Wind energy in Poland—History, current state, surveys, Renewable Energy Sources Act, SWOT analysis. Renew. Sustain. Energy Rev. 2016, 64, 19–33. [Google Scholar] [CrossRef]
  3. Foley, D.K. State expenditure from a Marxist perspective. J. Public Econ. 1978, 9, 221–238. [Google Scholar] [CrossRef]
  4. Šliogerienė, J.; Kaklauskas, A.; Zavadskas, E.K.; Bivainis, J.; Seniut, M. Environment factors of energy companies and their effect on value: Analysis model and applied method. Technol. Econ. Dev. Econ. 2009, 15, 490–521. [Google Scholar] [CrossRef]
  5. Gasser, P. A review on energy security indices to compare country performances. Energy Policy 2020, 139, 111339. [Google Scholar] [CrossRef]
  6. Fayerweather, J. International Business Management: A Conceptual Framework; McGraw-Hill: New York, NY, USA, 1968; Volume 1. [Google Scholar]
  7. Dźwigoł, H.; Dźwigoł, M.; Zhyvko, Z.; Miśkiewicz, R.; Pushak, H. Evaluation of the energy security as a component of national security of the country. J. Secur. Sustain. 2019, 8, 307–317. [Google Scholar] [CrossRef] [PubMed]
  8. Rusu, V.D.; Roman, A. An empirical analysis of factors affecting competitiveness of C.E.E. countries. Econ. Res. Istraživanja 2018, 31, 2044–2059. [Google Scholar] [CrossRef]
  9. Gibb, A.A. Entrepreneurship and Small Business Management: Can We Afford to Neglect Them in the Twenty-first Century Business School? Br. J. Manag. 1996, 7, 309–321. [Google Scholar] [CrossRef]
  10. Lütkepohl, H. Vector autoregressive models. In Handbook of Research Methods and Applications in Empirical Macroeconomics; Edward Elgar Publishing: Glos, UK, 2021; pp. 139–164. [Google Scholar] [CrossRef]
  11. Kokoszka, P.; Reimherr, M. Determining the order of the functional autoregressive model. J. Time Ser. Anal. 2013, 34, 116–129. [Google Scholar] [CrossRef]
  12. Crocioni, P. Can State Aid Policy Become more Economic Friendly? World Compet. 2006, 29, 89–108. [Google Scholar] [CrossRef]
  13. Jakimowicz, A.; Rzeczkowski, D. Do barriers to innovation impact changes in innovation activities of firms during business cycle? The effect of the Polish green island. Equilibrium 2019, 14, 631–676. [Google Scholar] [CrossRef]
  14. Lawton, A.; Doig, A. Researching Ethics for Public Service Organizations: The View From Europe. Public Integr. 2006, 8, 11–33. [Google Scholar] [CrossRef]
  15. Bompard, E.; Carpignano, A.; Erriquez, M.; Grosso, D.; Pession, M.; Profumo, F. National energy security assessment in a geopolitical perspective. Energy 2017, 130, 144–154. [Google Scholar] [CrossRef]
  16. Kruyt, B.; van Vuuren, D.P.; de Vries, H.J.M.; Groenenberg, H. Indicators for energy security. Energy Policy 2009, 37, 2166–2181. [Google Scholar] [CrossRef]
  17. Rokicki, T.; Perkowska, A. Changes in Energy Supplies in the Countries of the Visegrad Group. Sustainability 2020, 12, 7916. [Google Scholar] [CrossRef]
  18. Augutis, J.; Krikštolaitis, R.; Martišauskas, L.; Pečiulytė, S.; Žutautaitė, I. Integrated energy security assessment. Energy 2017, 138, 890–901. [Google Scholar] [CrossRef]
Figure 1. The method of the study.
Energies 16 01442 g001
Table 1. ADF test statistics for the set of variables under consideration.
Delaysp(LR)AICBICHQC
1------−7.445717 *−7.233908 *−7.678072 *
20.000498.462832−8.220764−8.728380
30.03527−8.706015−8.433688−9.004757
An asterisk (*) indicates the best (i.e., minimum) value for the respective information criteria; AIC = Akaike criterion, BIC = Schwartz–Bayesian criterion and HQC = Hannan–Quinn criterion.
Table 2. VAR model estimation results for the share of unprofitable companies (Model 1).
SpecificationFactorStandard ErrorStudent’s t p-Value Significance
Constant−0.9502970.239601−3.9660.0041***
Share of unprofitable companies_10.8245500.1270446.4900.0002***
The value of goods and materials sold to net sales revenue_12.610340.5927424.4040.0023***
EBIT margin_1−1.302580.558907−2.3310.0481**
PKB_1−0.1974810.0413729−4.7730.0014***
The arithmetic mean of the dependent variable: 0.110228; The standard deviation of the dependent variable: 0.023690; Sum of Squared Residuals: 0.000491; Standard Error of Residuals: 0.007835; Coefficient of determination R-square: 0.927078; Corrected R-square: 0.890617; F (4, 8): 60.87720; p-value for F-test: 0.000499; Autocorrelation residue—rho1: −0.525588; Durbin–Watson Statistic: 2.817909; Significance level at: ** 5%, *** 1%.
Table 3. VAR model estimation results for the share of companies with delays in repayment of loans and credits for more than 90 days (Model 2).
SpecificationFactorStandard ErrorStudent’s tp-ValueSignificance
Constant−0.8201250.262679−3.1220.0142**
Share of companies with delays in repayment of credits and loans exceeding 90 days_10.6194600.1336004.6370.0017***
The value of goods and materials sold to net sales revenue_12.426120.7383813.2860.0111**
Oil WT_10.0002895090.0002613961.91080.08002*
CPI_10.4971240.2623201.8950.0947*
The arithmetic mean of the dependent variable: 0.110228; The standard deviation of the dependent variable: 0.023690; Sum of Squared Residuals: 0.000521; Standard Error of Residuals: 0.008066; Coefficient of determination R-square: 0.922711; Corrected R-square: 0.884066; F (4, 8): 23.87686; p-value for F-test: 0.000167; Autocorrelation residue—rho1: −0.330471; Durbin–Watson Statistic: 2.393321; Significance level at: * 10%, ** 5%, *** 1%.
Disclaimer/Publisher’s Note: The statements, opinions and data contained in all publications are solely those of the individual author(s) and contributor(s) and not of MDPI and/or the editor(s). MDPI and/or the editor(s) disclaim responsibility for any injury to people or property resulting from any ideas, methods, instructions or products referred to in the content.

