Abstract
Due to the complex mesostructure and components of composite active layers in lithium-ion battery (LIB) electrodes, coupled with the concentration-dependent material properties and eigenstrains, efficiently estimating the effective modulus of the active layers remains a great challenge. In this work, the classic Mori–Tanaka method is found to be unable to estimate the modulus of the active layer. By realizing the importance of the mesostructure feature, a rod-rod model is proposed. The resulting modulus is expressed analytically. It is shown that the rod-rod model can accurately estimate the modulus evolution of the active layer if the material properties of the components and the evolution of volume fractions are known in advance. Moreover, a simplified rod-rod model is also developed to reduce the complexity of the proposed method. By knowing the volume fractions at two arbitrary states of charge and subsequently determining two constants, the simplified model can estimate the modulus efficiently. Considering both its accuracy and its simplicity, the simplified rod-rod model is the most suitable for the estimation. Thus, the methods developed in this work provide a new perspective for analyzing the material properties of composite active layers in LIB electrodes.
1. Introduction
In the past decade, the coupled mechanical–electrochemical behavior of LIBs has attracted significant attention, owing to its critical effects on the cycling performance, lifetime, and safety of the batteries [1,2,3,4,5,6]. However, as one of the bases of the coupling analysis of multiple-level failure and battery degradation, the determination of the mechanical properties of the composite electrodes, especially the modulus of the active layers, remains challenging [7]. A typical LIB electrode consists of a current collector and active layers on one/both sides of the current collector. The active layer is commonly a composite composed of active particles (APs), binders, conductive carbon, and pores. The APs store/release lithium ions and undergo deformation during electrochemical cycling [8]. The binder and conductive carbon are responsible for structural stability and electrical conductivity, respectively, and are commonly compounded into carbon-binder domains (CBDs) [9,10]. Due to the high fractions of particles and pores but the extremely low fraction of CBDs [11,12,13], coupled with the presence of eigenstrains and concentration-dependent properties [14,15,16], active layers are therefore quite different to traditional structural composites [17].
Although the direct uniaxial tension/compression of a free-standing active layer is the straightforward approach, the preparation of such layers remains a great challenge [18]. Alternatively, some special battery systems/structures have been designed to conduct the mechanical measurement of active layers [19]. For instance, a multi-beam optical sensor system [20] and a bilayer electrode system [7,21] were developed for the in-situ measurement of the mechanical properties of composite electrodes. In both methods, the modulus of the active layers was converted from the structural curvature of an asymmetric electrode. Additionally, an environmental nanoindentation method was proposed to evaluate the modulus of composite active layers [13,18]. However, a critical problem is that it is difficult to generalize the obtained modulus for the infinite variety of electrode formulations in these relatively complicated experimental methods.
Thus, modeling the mechanical properties of active layers is necessary. Recently, the mechanical behavior of composite active layers has been intensively evaluated by numerical modeling, such as discrete element methods [22,23] and finite element methods [24,25]. No longer limited by electrode preparation, free-standing active layers are preferred in most modeling studies [26]. Multiple mechanisms for the modulus variation of the active layer, including mesostructure change and component property change, have been systematically revealed [27]. Decreasing CBD volume fraction and silicon softening jointly result in a decrease in the effective modulus, whereas an increase in the silicon volume fraction, along with a decrease in porosity, has the opposite impact. However, there is still an obvious gap between the simulation data and a general description of the modulus of the active layer. Ideally, a general description of modulus can be framed in terms of the given electrode formulation, lithium concentration, and some measurable macroscopic/mesoscopic quantities. Because of the considerable difference between active layers and traditional composites, the question of whether the modulus of the active layer can be estimated using traditional methods remains open.
In general, for the feasibility of further mechanical–electrochemical analysis, it is desirable to obtain an analytical formula of the material properties instead of several sets of discrete data. To this end, we focus on deducing a general and analytical expression of the modulus of the composite active layer, and the estimation approaches are developed. These methods and results provide a new perspective for analyzing the modulus of composites with high inclusion fractions and the presence of eigenstrain and multiphysics-dependent properties.
2. The Inclusion Model and the Ball-Rod Model
Considering the fact that the active material is mostly in the form of spherical particles, while the CBD is interspersed between the active material and pores [18,23,28,29,30], a representative volume element (RVE) of a porous active layer containing spherical APs, CBDs, and pores is developed, as shown in Figure 1. The uniformly sized particles are connected by uniformly sized cylindrical CBD bridges [31,32]. According to the common volume fractions of the active layer, a bridged face-centered-cubic (bridged FCC) model, which is a validated and widely used model to study the mechanical behavior of the active layer [24,27], is developed here, as shown in Figure 1. For the bridged FCC structure, the volume fraction of APs can be up to 74%. Hence, this structure can meet the requirements of the volume fractions of general electrode components [13,20,21].
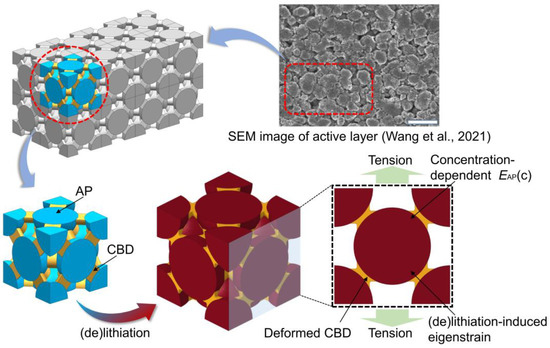
Figure 1.
Illustration of the RVE for composite active layers [23].
Upon (de)lithiation, it has been revealed that there are multiple mechanisms, such as concentration-dependent material properties and the (de)lithiation-induced eigenstrain of APs, affecting the modulus of the active layer [27]. The effect of the former mechanism is straightforward and obvious. The latter further causes mesostructure changes (such as CBD deformation) and the variation of volume fractions in each phase.
Nevertheless, considering the fact that the active layer has certain similarities to the particle-reinforced composite, the Mori–Tanaka method is employed to estimate the modulus of the active layer first [33]. It should be noted that the composite active layer is a three-phase composite composed of APs, CBDs, and pores. Thus, to employ the Mori–Tanaka method, two hypothetical steps of the composite process are proposed, as shown in Figure 2. A model with two steps of inclusion is denoted by model MT-A. In the first step, one of the phases (denoted by “0”) is selected as the matrix, with another phase (denoted by “1”) as the inclusion. Subsequently, in the second step, the two-phase composite (denoted by “01”) obtained by the first step is considered the matrix, the remaining phase (denoted by “2”) is the inclusion, and a three-phase composite (denoted by “012”) is obtained.
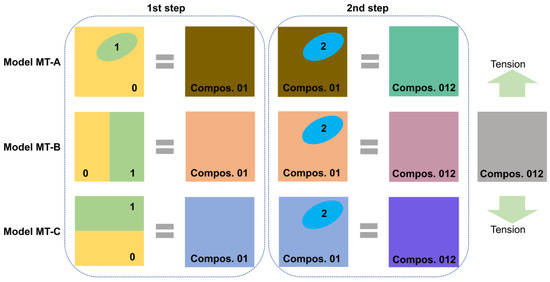
Figure 2.
Illustration of the two-step composite process and the inclusion model. In the 1st step, the phase “0” is the matrix, while the phase “1” is the inclusion. In the 2nd step, the two-phase composite “01” obtained by the 1st step is the matrix, the remaining phase “2” is the inclusion, and a three-phase composite “012” is obtained.
Here, we denote the bulk modulus, shear modulus, Young’s modulus, and volume fraction as , , , and , respectively, where i represents the specific phase or composite. For model MT-A, the effective Young’s modulus of the active layer can be given by [34]
where
In general, the particle phase in the particle-reinforced composite is considered as the inclusion instead of the matrix. The pore phase obviously cannot be the matrix. Meanwhile, the experimentally measured elastic property of the active layer is relatively close to that of CBDs rather than APs [21,35]. Thus, the matrix phase “0” is chosen as the CBD phase for model MT-A, and there are only two possible composite processes for model MT-A, namely, models MT-A1 and MT-A2. In model MT-A1, the first inclusion phase “1” is the pore, and the second inclusion “2” is the AP phase. In model MT-A2, the inclusions are in reverse order.
Meanwhile, according to the bridged FCC model (Figure 1), both the CBD and AP phases are discretely distributed, leading to potential deviation caused by the description of the inclusion. Thus, parallel and series models are also introduced in the first step. The former is denoted by model MT-B and the latter by model MT-C. The second step of models MT-B and MT-C is still performed using the Mori–Tanaka method. For model MT-B, the effective modulus can also be expressed by Equations (1)–(3) if Equations (4) and (5) are replaced by
Because the experimentally measured modulus of the active layer is close to that of CBDs [21,35], the AP phase should not be involved in the first composite step. Therefore, for model MT-B, phases 0, 1, and 2 represent CBDs, pores, and APs, respectively. For model MT-C, Equations (1)–(3) can also describe the effective modulus if Equations (4) and (5) are replaced by
The first step of model MT-C can only involve CBDs and APs. In this case, phases 0, 1, and 2 represent CBDs, APs, and pores, respectively. It is worth noting that the volume fractions are concentration-dependent, as well as the material property of APs [14,27].
Furthermore, considering the connection between phases in the bridged FCC model, a ball-rod model, denoted by model BR, is also developed, as shown in Figure 3. Because the modulus of the AP phase is commonly much higher than that of the CBD phase [14,35,36,37], the deformation of the active layer upon mechanical loading is assumed to be caused only by the deformation and motion of CBDs. By using the equilibrium relationship and the compatibility of deformation, the Young’s modulus of the composite reads as [27]
where is the AP radius, is the initial AP radius, is the dimensionless expansion coefficient, is the dimensionless concentration variation, is the saturation concentration, r represents the equivalent cross-section radius of CBDs, and l represents the length of CBDs. r and l can be determined by the volume fractions as follows:
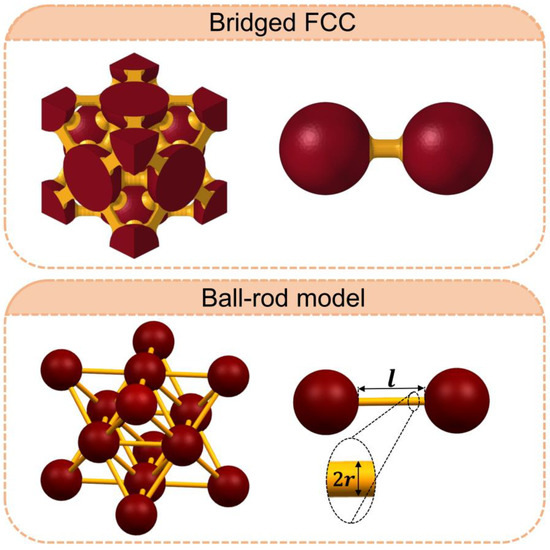
Figure 3.
Illustration of model BR: A ball-rod model.
In model BR, the AP and CBD are assumed to remain spherical and cylindrical upon (de)lithiation, respectively, although and (as well as R, r, and l) are functions of . According to Equations (14) and (15) and the relationship of , there are two independent and measurable parameters, namely the component ratio and the initial porosity , to determine the initial structure of the RVE.
For demonstration, a case of composite silicon electrodes with and is selected to evaluate the models developed above. For silicon APs, [38], (except for model BR) [14], and the Poisson’s ratio is fixed to 0.22 [15]. The CBD phase adopts polyvinylidene fluoride (PVDF), whose Young’s modulus and Poisson’s ratio are chosen as 2 GPa and 0.3, respectively [36,37]. The silicon–PVDF active layer is very commonly seen in the development of silicon-based electrodes [7,13,18,21], and is therefore employed here for demonstration. The finite element method (FEM) is also employed to perform uniaxial tension of the RVE presented in Figure 1 and calculate the concentration-dependent effective Young’s modulus. Periodic boundary conditions are applied to the RVE in the FEM calculation. It is worth mentioning that the applicability of such an RVE model has been comprehensively discussed, and its comparability to experimental results has been clarified in our previous work [27]. The order of magnitude of the calculated modulus agrees well with that of the experimental results [13,18]. The calculated FEM E is considered the benchmark for evaluating the estimation results of the inclusion models and of model BR. Meanwhile, to avoid accumulating errors, the calculation of these models adopts the FEM calculated . In this way, the effective Young’s modulus for each model can be obtained.
A comparison of FEM calculations for the inclusion models and model BR is demonstrated in Figure 4. Clearly, model BR shows a much better estimation than the other models. In fact, similar failures of classic inclusion methods, such as the self-consistent method [39], also appear, but these negative results will not be repeatedly discussed here. This evidently indicates that the modulus of the active layer is difficult to estimate using classic inclusion methods. In other words, the high fractions of the particles and pores but extremely low fraction of the CBDs indeed cause the failure of the inclusion models. On the other hand, the better estimation of model BR indicates that a description of the mesostructure should be introduced. However, although the estimation of model BR is quite acceptable at the beginning of lithiation, deviation continuously increases during the lithiation process. Thus, further modification of model BR is necessary.
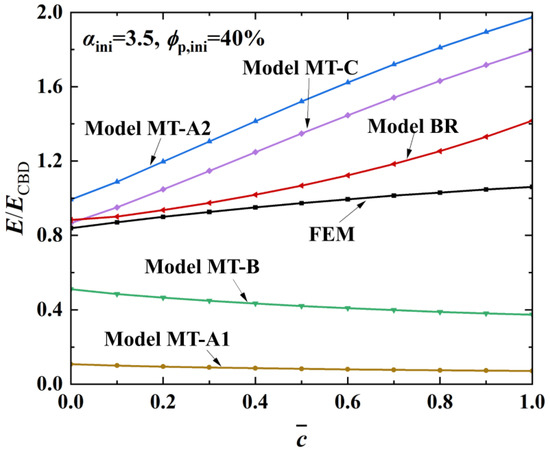
Figure 4.
Estimation of concentration-dependent effective Young’s moduli of active layers through comparison of FEM calculations and the results of the inclusion models and of model BR.
3. The Rod-Rod Model
It should be noted that the deformation of APs during tension is ignored in model BR. In other words, for silicon APs that show obvious lithiation-induced softening, the gradually decreasing AP modulus is very likely the cause of the increasing deviation in model BR. Thus, a further modification of model BR, denoted by model RR, is developed to introduce the impact of APs, as shown in Figure 5a. We first consider a basic ball-rod-ball combination and equate the hemisphere AP to a trapezoidal cylinder. The maximum and minimum radii of the trapezoidal cylinder are the radii of the AP and the CBD, respectively. This describes the part of the AP that transmits the mechanical load and deforms. Moreover, by considering the equivalent stiffness upon uniaxial tension, the trapezoidal cylinder is further equated to a cylinder (radius Req) with a known modulus EAP(c). Thus, model RR can be considered an equivalent rod-rod model. Meanwhile, the FEM calculation is also used to carry out uniaxial stretching of the structures, demonstrated in Figure 5b, in which and d is the displacement of the uniaxial stretch. It can be seen that such equivalence is valid. Thus, the effective Young’s modulus for model RR can be expressed as
where , , , , and . and can be determined by and by using Equations (14) and (15). By comparing Equation (16) with Equation (13), a relation between the estimations of models BR and RR can be easily found, i.e., . By assuming , model RR can degenerate to model BR.
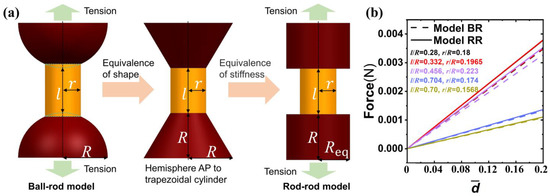
Figure 5.
(a) Illustration of model RR, (b) comparison of models BR and RR.
As shown in Figure 6a, model RR shows a much better estimation of the concentration-dependent effective modulus compared to model BR (for the same parameters set in Figure 4). Further, more cases with different key parameters are evaluated, as shown in Figure 6b, and it can be seen that model RR always shows considerably improved accuracy when compared to model BR. A quantitative demonstration of the deviation can be found in Figure 6c. Clearly, the deviation for most cases is less than 10%. The deviation at a high concentration () is still relatively high. This is possibly caused by ignorance of the detailed local deformation of the CBDs, i.e., the assumption of CBDs remaining cylinder-like. Nevertheless, except for high concentration, the error is generally less than 5%.
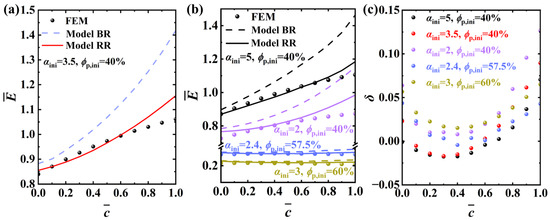
Figure 6.
Estimation of concentration-dependent effective Young’s moduli of active layers by model RR: (a) comparison of models BR and RR, (b) universality verification of model RR, and (c) illustration of deviation .
In conclusion, an analytical method to estimate the modulus evolution of composite active layers in LIB electrodes is developed in model RR. To employ model RR, the material system needs to be known in advance, and the volume fractions of components also need to be obtained. In other words, EAP(c), ECBD, and , which are relatively easy to measure, should be known.
It is also worth mentioning that, as another critical mechanical property for such a material, the Poisson’s ratio is also evaluated for all presented cases. Although the Poisson’s ratios slightly decrease upon lithiation, all are very close to 0.23, regardless of electrode formulation. Thus, discussion of the Poisson’s ratio is not a focus here. Meanwhile, since the global deformation is mainly contributed to by CBDs, the global mechanical response of the composite should not be greatly affected when there are multi-size APs [32,40].
4. The Simplified Rod-Rod Model
Although model RR, as developed in the previous section, can accurately estimate the modulus evolution of composite active layers, there is an inconvenient problem in that the volume fractions need to be obtained continuously or repeatedly, which inevitably increases the complexity of this method. Meanwhile, as demonstrated in Equation (16), the modulus can also be directly determined by the length and radius of the CBDs, both of which change during lithiation owing to the expansion of APs. Because the radius of APs increases linearly during lithiation, it is a reasonable assumption that the length and radius of CBDs also increase linearly with , namely and . and are the initial length and radius of the CBDs, respectively, and can be determined by and . Such a linear assumption can be verified directly in the FEM calculation, as shown in Figure 7. In this case, if only the two dimensionless constants (namely kl and kr) are known, the concentration-dependent effective Young’s modulus of the active layer can be given directly using Equation (16). This model can be considered a modification of model RR, and thus is denoted by model s-RR.
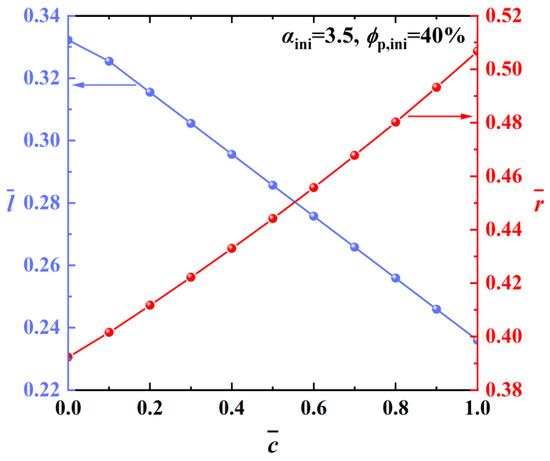
Figure 7.
The variation of and in the lithiation process.
It should be noted that the volume fractions at are generally easily obtained. Thus, to determine kl and kr, the volume fractions of the active layer at any one of the non-zero concentration states are needed. Such a dimensionless concentration for characterization is denoted by . By obtaining the corresponding volume fractions and substituting them into Equations (14) and (15), the corresponding and can be calculated. According to and , kl and kr can be also determined. Subsequently, the concentration-dependent effective modulus of the active layer can be estimated using model s-RR.
For demonstration, the case of and is also selected. Different values of are employed to determine kl and kr, and the estimation of modulus by model s-RR is conducted. The results are illustrated in Figure 8a. Although the estimation is acceptable in most states, it must be admitted that model s-RR slightly sacrifices accuracy in some cases, for instance, at = 0.2 and 1. Further, the deviation is introduced to quantitatively evaluate the estimation of model s-RR. As shown in Figure 8b, a low value of (for instance, ) leads to a relatively high deviation (~5%) for most values of . This means that the fitting goodness of and to the actual evolution of and is insufficient. This is because is to too small, consequently meaning that and are also too close to and , respectively, and an enlarged error of and . On the other hand, a high value of (for instance, = 1) can lead to a deviation higher than 5% for high depths of lithiation. This is also possibly induced by ignorance of the detailed local deformation of CBDs, while the employment of data for high enlarges the deviation caused by this assumption. Thus, value that is too high or too low should be avoided when using model s-RR. These results also imply that there may be an optimal value of to ensure the minimum overall error of the estimation.
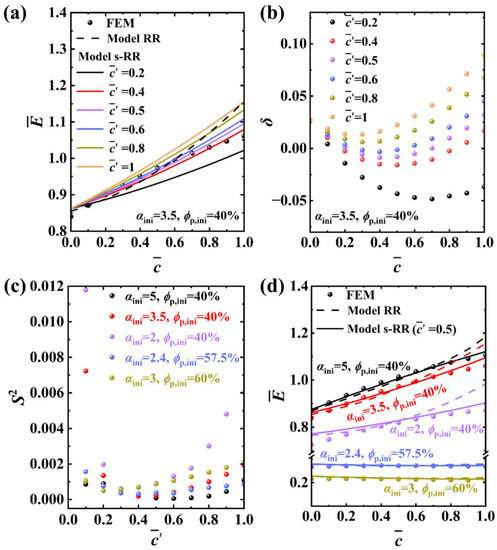
Figure 8.
Estimation of concentration-dependent effective Young’s moduli of active layers by model s-RR: (a) comparison of models RR and s-RR with different , (b) illustration of deviation , (c) illustration of variance , and (d) estimation by model s-RR when .
To evaluate the overall error, the variance is introduced, as plotted in Figure 8c. For demonstration, n = 11 is chosen, since 11 values of are presented in Figure 8a,b. Regardless of specific cases, the variance always falls and then rises with , taking a minimum value near . Thus, is selected. Following the procedure of model s-RR presented above, modulus estimation can be conducted, and the results are illustrated in Figure 8d. Model s-RR for is found to have quite high accuracy in all cases, which is not necessarily worse than model RR.
Moreover, by deducing the dimensionless formula, the present model can also be generalized to other material systems. To demonstrate the generality of the model developed in this work, some other commonly seen binders in silicon electrodes, i.e., sodium alginate (ECBD = 12 GPa) and carboxymethyl cellulose (ECBD = 4 GPa) [20], are employed for calculation and verification. As shown in Figure 9, model s-RR also works quite well in these cases.
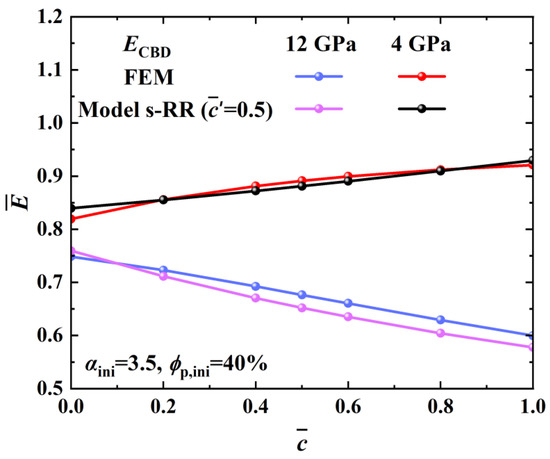
Figure 9.
Comparison of model s-RR and FEM calculations for different ECBD.
Hence, as a modification of model RR, model s-RR provides an efficient way to estimate the concentration-dependent effective Young’s modulus of composite active layers. To employ model s-RR, the material system also needs to be known in advance, i.e., EAP(c) and ECBD should be given. Meanwhile, the volume fractions at two arbitrary states of charge ( and are suggested) need to be obtained.
It is worth mentioning that theoretically, the evolution of volume fractions upon (de)lithiation can also be determined by a given value of concentration once the system of the active layer is known. Thus, kl and kr should also be two functions of the structure and material parameters of active layers, in theory. In other words, models RR and s-RR still have room for further development, although there are considerable theoretical difficulties. On the other hand, since some non-ideal mechanisms, such as multiple-level damage within electrodes, bending-induced gradient mesoscopic structures, etc. [7,41], may exist in these experimental methods [7,13,18,21] but were not considered here. A quantitative comparison between these contradictory experimental data and the modeling results in this work is still difficult. Nevertheless, it has to be stated that the validation of the present model is still potentially possible owing to the continuous development of preparation methods for free-standing composite active layers [42,43,44].
5. Conclusions
An inclusion model, ball-rod model, and rod-rod model have been developed in this work to estimate the modulus evolution of composite active layers in LIB electrodes. First, it was verified that the Mori–Tanaka method (the inclusion models) has obvious shortcomings in evaluating the modulus of active layers. On the other hand, the ball-rod model (model BR), inspired by the connection between the AP and CBD phases, was proved to provide a considerable improvement in modulus estimation. Further, by introducing the impact of APs, a rod-rod model (model RR) was proposed, whose estimation deviation for most cases is less than 10%. To employ model RR, the AP Young’s modulus EAP(c), CBD Young’s modulus ECBD, AP volume fraction , and CBD volume fraction should be known in advance. Moreover, in order to reduce the complexity of the repeated measurement of volume fractions in model RR, a simplified rod-rod model (model s-RR) was developed. It was also proved that model s-RR can provide an efficient and accurate approach to estimating the concentration-dependent effective Young’s modulus of composite active layers. To employ model s-RR, EAP(c), and ECBD need to be known in advance, and the volume fractions at two arbitrary states of charge also need to be obtained. By considering accuracy and simplicity in combination, model s-RR is suggested for the modulus estimation of the composite active layers in LIB electrodes.
Author Contributions
Conceptualization, B.L. and K.S.; methodology, B.L. and Y.H.; software, K.S. and Y.S.; validation, B.L. and K.S.; formal analysis, B.L. and Y.H.; investigation, B.L. and K.S.; resources, B.L. and Y.H.; data curation, K.S.; writing—original draft preparation, B.L. and K.S.; writing—review and editing, B.L. and Y.H.; visualization, K.S.; supervision, B.L. and Y.H.; project administration, B.L. and J.Z.; funding acquisition, B.L. All authors have read and agreed to the published version of the manuscript.
Funding
This work was supported by the National Natural Science Foundation of China (Grant Nos. 12072183, 11872236, and 12172205).
Data Availability Statement
The data that support the findings of this study are available on request from the corresponding authors upon reasonable request.
Conflicts of Interest
The authors declare no conflict of interest.
References
- Zhang, K.; Zhang, Y.W.; Zhou, J.W.; Li, Y.; Zheng, B.L.; Yang, F.Q.; Kai, Y. A stress-based charging protocol for silicon anode in lithium-ion battery: Theoretical and experimental studies. J. Energy Storage 2020, 32, 101765. [Google Scholar] [CrossRef]
- Lu, B.; Ning, C.Q.; Shi, D.X.; Zhao, Y.F.; Zhang, J.Q. Review on electrode-level fracture in lithium-ion batteries. Chin. Phys. B 2020, 29, 026201. [Google Scholar] [CrossRef]
- Wang, Z.H.; Jiang, W.J.; Zhao, Y.Z.; Hu, L.Z.; Wang, Y.; Ma, Z.S. Chemo-mechanical coupling phase-field modeling of lithium dendrite growth within solid electrolyte. J. Solid State Electrochem. 2023, 27, 245–253. [Google Scholar] [CrossRef]
- Xu, Y.C.; Zheng, B.L.; Zhang, K.; Peng, Y.Z.; Wang, F. Effect of combining local velocity and chemical reaction on the interaction between diffusion and stresses in large deformed electrodes. AIP Adv. 2019, 9, 105103. [Google Scholar] [CrossRef]
- Jiang, W.J.; Zhou, Q.; Lu, F.; Chen, Y.F.; Ma, Z.S. A thermal-electrochemical-mechanical coupled model based on non-equilibrium thermodynamics of Li-ion batteries. J. Energy Storage 2022, 55, 105655. [Google Scholar] [CrossRef]
- Liu, B.H.; Jia, Y.K.; Yuan, C.H.; Wang, L.B.; Gao, X.; Yin, S.; Xu, J. Safety issues and mechanisms of lithium-ion battery cell upon mechanical abusive loading: A review. Energy Storage Mater. 2020, 24, 85–112. [Google Scholar] [CrossRef]
- Li, D.W.; Wang, Y.K.; Hu, J.Z.; Lu, B.; Dang, D.Y.; Zhang, J.Q.; Cheng, Y.T. Role of polymeric binders on mechanical behavior and cracking resistance of silicon composite electrodes during electrochemical cycling. J. Power Sources 2018, 387, 9–15. [Google Scholar] [CrossRef]
- Qian, Y.; Lu, B.; Bao, Y.; Zhao, Y.; Song, Y.; Zhang, J. Prelithiation design for suppressing delamination in lithium-ion battery electrodes. Appl. Math. Mech. 2021, 42, 1703–1716. [Google Scholar] [CrossRef]
- Hein, S.; Danner, T.; Westhoff, D.; Prifling, B.; Scurtu, R.; Kremer, L.; Hoffmann, A.; Hilger, A.; Osenberg, M.; Manke, I.; et al. Influence of Conductive Additives and Binder on the Impedance of Lithium-Ion Battery Electrodes: Effect of Morphology. J. Electrochem. Soc. 2020, 167, 013546. [Google Scholar] [CrossRef]
- Morelly, S.L.; Gelb, J.; Iacoviello, F.; Shearing, P.R.; Harris, S.J.; Alvarez, N.J.; Tang, M.H. Three-Dimensional Visualization of Conductive Domains in Battery Electrodes with Contrast-Enhancing Nanoparticles. ACS Appl. Energy Mater. 2018, 1, 4479–4484. [Google Scholar] [CrossRef]
- Froboese, L.; Titscher, P.; Westphal, B.; Haselrieder, W.; Kwade, A. Mercury intrusion for ion- and conversion-based battery electrodes—Structure and diffusion coefficient determination. Mater. Charact. 2017, 133, 102–111. [Google Scholar] [CrossRef]
- Sangrós Giménez, C.; Finke, B.; Nowak, C.; Schilde, C.; Kwade, A. Structural and mechanical characterization of lithium-ion battery electrodes via DEM simulations. Adv. Powder Technol. 2018, 29, 2312–2321. [Google Scholar] [CrossRef]
- Wang, Y.K.; Dang, D.Y.; Li, D.W.; Hu, J.Z.; Cheng, Y.T. Influence of polymeric binders on mechanical properties and microstructure evolution of silicon composite electrodes during electrochemical cycling. J. Power Sources 2019, 425, 170–178. [Google Scholar] [CrossRef]
- Yang, B.; He, Y.P.; Irsa, J.; Lundgren, C.A.; Ratchford, J.B.; Zhao, Y.P. Effects of composition-dependent modulus, finite concentration and boundary constraint on Li-ion diffusion and stresses in a bilayer Cu-coated Si nano-anode. J. Power Sources 2012, 204, 168–176. [Google Scholar] [CrossRef]
- Shenoy, V.B.; Johari, P.; Qi, Y. Elastic softening of amorphous and crystalline Li–Si Phases with increasing Li concentration: A first-principles study. J. Power Sources 2010, 195, 6825–6830. [Google Scholar] [CrossRef]
- Zhang, Y.W.; Zhan, S.Y.; Zhang, K.; Zheng, B.; Lyu, L. Buckling behavior of a wire-like electrode with a concentration-dependent elastic modulus based on a deformed configuration. Eur. J. Mech.-A/Solids 2021, 85, 104111. [Google Scholar] [CrossRef]
- Su, Y.S.; Ouyang, Q.; Zhang, W.L.; Li, Z.Q.; Guo, Q.; Fan, G.L.; Zhang, D. Composite structure modeling and mechanical behavior of particle reinforced metal matrix composites. Mater. Sci. Eng. A 2014, 597, 359–369. [Google Scholar] [CrossRef]
- Wang, Y.K.; Zhang, Q.L.; Li, D.W.; Hu, J.Z.; Xu, J.G.; Dang, D.Y.; Xiao, X.C.; Cheng, Y.T. Mechanical Property Evolution of Silicon Composite Electrodes Studied by Environmental Nanoindentation. Adv. Energy Mater. 2018, 8, 1702578. [Google Scholar] [CrossRef]
- Lu, B.; Yuan, Y.N.; Bao, Y.H.; Zhao, Y.; Song, Y.C.; Zhang, J.Q. Mechanics-based design of lithium-ion batteries: A perspective. Phys. Chem. Chem. Phys. 2022, 24, 29279–29297. [Google Scholar] [CrossRef]
- Kumar, R.; Woo, J.H.; Xiao, X.C.; Sheldon, B.W. Internal Microstructural Changes and Stress Evolution in Silicon Nanoparticle Based Composite Electrodes. J. Electrochem. Soc. 2017, 164, A3750–A3765. [Google Scholar] [CrossRef]
- Li, D.W.; Wang, Y.K.; Hu, J.Z.; Lu, B.; Cheng, Y.T.; Zhang, J.Q. In situ measurement of mechanical property and stress evolution in a composite silicon electrode. J. Power Sources 2017, 366, 80–85. [Google Scholar] [CrossRef]
- Sangrós Giménez, C.; Finke, B.; Schilde, C.; Froböse, L.; Kwade, A. Numerical simulation of the behavior of lithium-ion battery electrodes during the calendaring process via the discrete element method. Powder Technol. 2019, 349, 1–11. [Google Scholar] [CrossRef]
- Wang, Z.H.; Yang, L.; Zhu, S.X.; Song, W.L.; Chen, H.S. Exploring mechanical failure of porous electrode meso structure using the discrete element method. Extrem. Mech. Lett. 2021, 46, 101252. [Google Scholar] [CrossRef]
- Üçel, İ.B.; Gudmundson, P. A statistical RVE model for effective mechanical properties and contact forces in lithium-ion porous electrodes. Int. J. Solids Struct. 2022, 244, 111602. [Google Scholar] [CrossRef]
- Trembacki, B.L.; Noble, D.R.; Brunini, V.E.; Ferraro, M.E.; Roberts, S.A. Mesoscale Effective Property Simulations Incorporating Conductive Binder. J. Electrochem. Soc. 2017, 164, E3613–E3626. [Google Scholar] [CrossRef]
- Li, X.J.; Zhao, Y.F.; Song, Y.C.; Zhang, J.Q.; Lu, B. Macroscopic Architecture Design of Lithium Metal Electrodes: Impacts of Millimeter-Size Hollows on Economization, Cyclability, and Utilization. J. Electrochem. Energy Convers. Storage 2023, 20, 021005. [Google Scholar] [CrossRef]
- Sun, B.W.; Zhao, Y.F.; Song, Y.C.; Zhang, J.Q.; Lu, B. Understanding Modulus Variation of the Active Layers of Silicon Composite Electrodes. Acta Mech. Solida Sin. 2022, 35, 987–995. [Google Scholar] [CrossRef]
- Jaiser, S.; Kumberg, J.; Klaver, J.; Urai, J.L.; Schabel, W.; Schmatz, J.; Scharfer, P. Microstructure formation of lithium-ion battery electrodes during drying—An ex-situ study using cryogenic broad ion beam slope-cutting and scanning electron microscopy (Cryo-BIB-SEM). J. Power Sources 2017, 345, 97–107. [Google Scholar] [CrossRef]
- Lu, B.; Zhao, Y.F.; Feng, J.M.; Song, Y.C.; Zhang, J.Q. Mechanical contact in composite electrodes of lithium-ion batteries. J. Power Sources 2019, 440, 227115. [Google Scholar] [CrossRef]
- Zhang, K.; Li, Y.; Zheng, B.L. Modeling of diffusion-induced stresses of spherical composition-gradient electrodes in lithium-ion batteries. Eur. Phys. J. Appl. Phys. 2015, 70, 10404. [Google Scholar] [CrossRef]
- Chen, J.C.; Liu, J.Y.; Qi, Y.; Sun, T.; Li, X.D. Unveiling the Roles of Binder in the Mechanical Integrity of Electrodes for Lithium-Ion Batteries. J. Electrochem. Soc. 2013, 160, A1502–A1509. [Google Scholar] [CrossRef]
- Rahani, E.K.; Shenoy, V.B. Role of Plastic Deformation of Binder on Stress Evolution during Charging and Discharging in Lithium-Ion Battery Negative Electrodes. J. Electrochem. Soc. 2013, 160, A1153–A1162. [Google Scholar] [CrossRef]
- Mori, T.; Tanaka, K. Average stress in matrix and average elastic energy of materials with misfitting inclusions. Acta Metall. 1973, 21, 571–574. [Google Scholar] [CrossRef]
- Jia, C.L.; Chen, Y.Q.; Huang, Z.P. New micromechanics model for saturated porous media with connected pores. Arch. Appl. Mech. 2016, 86, 1579–1590. [Google Scholar] [CrossRef]
- Üçel, İ.B.; Gupta, P.; Gudmundson, P. Experimental determination of the constitutive properties of a graphite anode layer in lithium-ion batteries using a bending test method. J. Energy Storage 2022, 46, 103845. [Google Scholar] [CrossRef]
- Sethuraman, V.A.; Nguyen, A.; Chon, M.J.; Nadimpalli, S.P.V.; Wang, H.; Abraham, D.P.; Bower, A.F.; Shenoy, V.B.; Guduru, P.R. Stress Evolution in Composite Silicon Electrodes during Lithiation/Delithiation. J. Electrochem. Soc. 2013, 160, A739–A746. [Google Scholar] [CrossRef]
- Porter, D.A.; Hoang, T.V.T.; Berfield, T.A. Effects of in-situ poling and process parameters on fused filament fabrication printed PVDF sheet mechanical and electrical properties. Addit. Manuf. 2017, 13, 81–92. [Google Scholar] [CrossRef]
- Song, Y.C.; Soh, A.K.; Zhang, J.Q. On stress-induced voltage hysteresis in lithium ion batteries: Impacts of material property, charge rate and particle size. J. Mater. Sci. 2016, 51, 9902–9911. [Google Scholar] [CrossRef]
- Hill, R. A self-consistent mechanics of composite materials. J. Mech. Phys. Solids 1965, 13, 213–222. [Google Scholar] [CrossRef]
- Ali, Y.; Iqbal, N.; Lee, S. Inhomogeneous stress development at the multiparticle electrode of lithium-ion batteries. Int. J. Energy Res. 2021, 45, 14788–14803. [Google Scholar] [CrossRef]
- Chandrasekaran, R.; Fuller, T.F. Analysis of the Lithium-Ion Insertion Silicon Composite Electrode/Separator/Lithium Foil Cell. J. Electrochem. Soc. 2011, 158, A859–A871. [Google Scholar] [CrossRef]
- Song, X.R.; Wang, H.B.; Wu, H.L.; Zou, J.Z.; Zhao, F.L.; Wu, H.J.; Zeng, X.R. Free-standing hollow carbon nanofibers scaffold with spherical nanocavities and lithiophilic N/ZnO heteroatoms as stable dendrite-free lithium metal anode. Appl. Surf. Sci. 2021, 565, 150589. [Google Scholar] [CrossRef]
- Mao, W.G.; Wang, Z.; Li, C.S.; Zhu, X.X.; Dai, C.Y.; Yang, H.Y.; Chen, X.; Fang, D.N. In-situ characterizations of chemo-mechanical behavior of free-standing vanadium pentoxide cathode for lithium-ion batteries during discharge-charge cycling using digital image correlation. J. Power Sources 2018, 402, 272–280. [Google Scholar] [CrossRef]
- Jiang, H.; Zhou, X.; Liu, G.G.; Zhou, Y.H.; Ye, H.; Liu, Y.; Han, K. Free-Standing Si/Graphene Paper Using Si Nanoparticles Synthesized by Acid-Etching Al-Si Alloy Powder for High-Stability Li-Ion Battery Anodes. Electrochim. Acta 2016, 188, 777–784. [Google Scholar] [CrossRef]
Disclaimer/Publisher’s Note: The statements, opinions and data contained in all publications are solely those of the individual author(s) and contributor(s) and not of MDPI and/or the editor(s). MDPI and/or the editor(s) disclaim responsibility for any injury to people or property resulting from any ideas, methods, instructions or products referred to in the content. |
© 2023 by the authors. Licensee MDPI, Basel, Switzerland. This article is an open access article distributed under the terms and conditions of the Creative Commons Attribution (CC BY) license (https://creativecommons.org/licenses/by/4.0/).