1. Introduction
Polypropylene (PP) based thermoplastic cable insulation has garnered great interest because of its high operation temperature range and excellent recyclability [
1,
2]. However, different from traditional cross-linked polyethylene (XLPE) cable insulation, PP-based insulation has worse thermal oxygen stability due to the large number of highly reactive tertiary carbon atoms in the PP molecular chain [
3,
4,
5,
6]. In the mixing process of insulation materials and the extrusion process of cable insulation, materials will be subjected to shear stress under high temperatures for a long time. During this process, the aggregation structure of PP will change irreversibly with the shear action, and these changes will affect the mechanical properties, aging properties and electrical properties of the insulation material.
Some researchers have found a greater impact on the morphology of PP when the shear is applied to material. Zhou et al. [
7] investigated the effect of different shear modes on the morphology and mechanical properties of PP and discovered that it will alter the global mechanical characteristics of PP. Some studies suggested that different shear methods change the toughness and tensile strength of PP [
8,
9,
10]. Additionally, some researchers studied the relationship between shear action and crystalline morphology. Some studies have demonstrated that shear action can considerably alter crystallization efficiency and drive the development of shish-kebab and β-crystal [
11,
12,
13,
14,
15,
16]. Baig et al. [
17] simulated the conformation of polymer molecular chains under shear action by computer, and proved that there is an orientation arrangement and disentanglement under shear action. Tang et al. [
18] investigated the isothermal crystallization of iPP at 130 °C using wide-angle X-ray diffraction and small-angle X-ray scattering and discovered that the increase in shear rate facilitated the production of β crystals within a particular range. Simultaneously, it is found that the microstructural modifications can result in alterations in DC performance [
19,
20,
21,
22]. Nath et al. studied PP after a certain proportion of stretching and discovered that the stretched sample’s trap density increased [
23]. Peng et al. studied the effect of different mechanical stresses on the DC partial discharge of PP film and discovered that the insulation performance of PP worsens when subjected to stress, as evidenced by a reduction in the initial discharge voltage of DC partial discharge and an increase in the discharge amount [
24]. Moreover, in actual production and processing, the inclusion of an antioxidant will prevent the degradation of PP in the mixing process by scavenging free radicals, which will subsequently influence the DC electrical characteristics of PP after shear action. However, the relationship between shear action and the electrical and mechanical properties of PP has not been reported in other research so far. The effect of shear on the mechanical properties, aging properties and electrical properties of PP is still unclear.
In this paper, PP with different shear time and temperatures was prepared to simulate the blending process in cable manufacture, and the role the antioxidant played in materials was investigated. The effect of shear action on crystallization and mechanical properties was investigated. Furthermore, the DC insulation properties of PP with different shear actions were tested. Finally, it concludes with the effects of shear action and antioxidant on the crystalline morphology and mechanical and electrical properties of PP, which can provide theoretical guidance for the PP cable processing process.
2. Materials and Method
2.1. Materials
PP, T30S produced by Sinopec was selected. The antioxidant Irganox 1010 was purchased from BASF (Ludwigshafen, Germany). Rheometer RM-200C manufactured by Harper Electric Technology Co., Ltd. (Norco, CA, USA) was employed. The flat tablet press FR-1418 was produced by Shanghai Farui Equipment Co., Ltd. (Shanghai, China).
The temperatures of the torque rheometer were set to 190 °C and 220 °C. In the torque rheometer, original PP was placed. The entire blending procedure lasted 5 min, 15 min, and 45 min. The PP was then placed in a torque rheometer, and after approximately one and a half minutes of smooth torque it was blended with 2% mass fraction of Irganox 1010 to obtain stable material performance [
25]. The blending procedure lasted 5 min, 15 min, and 45 min, respectively. After mixing, the torque rheological curve was obtained. As a control, the unsheared PP in this study is labeled as Original, while the sheared PP is labeled as shear time-shear temperature. Antioxidant-containing samples are distinguished by the addition of -a. The samples obtained are shown in
Table 1.
2.2. Material Property Test
A NicoletiS5 spectrometer (Madison, WI, USA) was used to measure the infrared spectra of PP after different shear effects to observe the effect of different degrees of shear on the carbonyl content of PP. The measurement range was 400–4000 cm−1 with a resolution of 4 cm−1 and a total of 32 scans.
The oxidation induction time (OIT) was investigated using a differential scanning calorimeter. The samples were placed in a nitrogen flow of 50 mL/min at 25 °C for 5 min; the nitrogen flow rate was kept constant, and the temperature rose to 220 °C at a rate of 20 °C per minute for 5 min. The nitrogen in the sample chamber was then replaced with oxygen at 50 mL/min. The time of oxygen flow is taken as the start time of the oxidation induction period. When the curve changes sharply to the direction of exothermic heat, it represents that the polymer has been oxidized, and this time is recorded as the end time of the oxidation induction period. The difference between the end time and the start time is recorded as the oxidation induction period [
26].
2.3. Material Crystallization Characteristic and Mechanical Property Test
The differential scanning calorimeter used was a Mettler-Toledo DSC822e, Switzerland. Before the experiment, 5–10 mg of the sample to be tested was weighed using a high-precision electronic balance, loaded into a closed aluminum crucible and placed in a designated area in the sample chamber of the measuring instrument. The entire melting crystallization process was carried out under the protection of a nitrogen atmosphere. The crystallization curve was taken for experimental analysis with the second melting curve [
27].
Thermal elongation was tested following IEC 60811-2-1-2001 [
28].
The universal testing machine WDW-10C was used to test the tensile properties of materials with reference to IEC 60811-512: 2012 [
29].
The dynamic thermomechanical analyzer model was performed by DMAQ800. The test temperature was first lowered to −80 °C with liquid nitrogen, and then increased from −80 °C to 100 °C with a temperature increase rate of 3 °C/min. The data related to storage modulus and loss factor were obtained for analysis.
2.4. Material Electrical Properties Test
The distribution characteristics of space charge were measured by the electroacoustic pulse method (PEA). The samples were selected from a circular sheet sample with a diameter of 50 mm and a thickness of 0.3 mm. A field intensity of 3 kV/mm was first applied to the samples at room temperature of 25 °C and pressurized for 5 min for reference measurements. Then, an electric field of 40 kV/mm was applied to the samples and a polarization process of 1800 s was performed to obtain the space charge distribution of each sample at this field strength.
The conductance was measured by a three-electrode measuring system. The samples required for the experiments were circular samples of 0.2 mm thickness and 8 cm diameter. The samples and electrodes were placed in an oven at room temperature of 25 °C before the experiment started. The electric field applied to the samples was 5, 10, 15, 20, 25, 30, 35, 40 kV/mm, 8 sequentially increasing field strengths, and the field strengths were converted to the corresponding voltages in the test. In this paper, the J-E double logarithmic coordinate form is used to make a graph and analyze the test results of current density.
The breakdown test temperature was chosen to be room temperature (about 25 °C). Each sample was tested 11 times and the Weibull distribution was used to analyze the experimental results.
3. Experimental Results and Discussion
3.1. Characterization of Rheological Properties
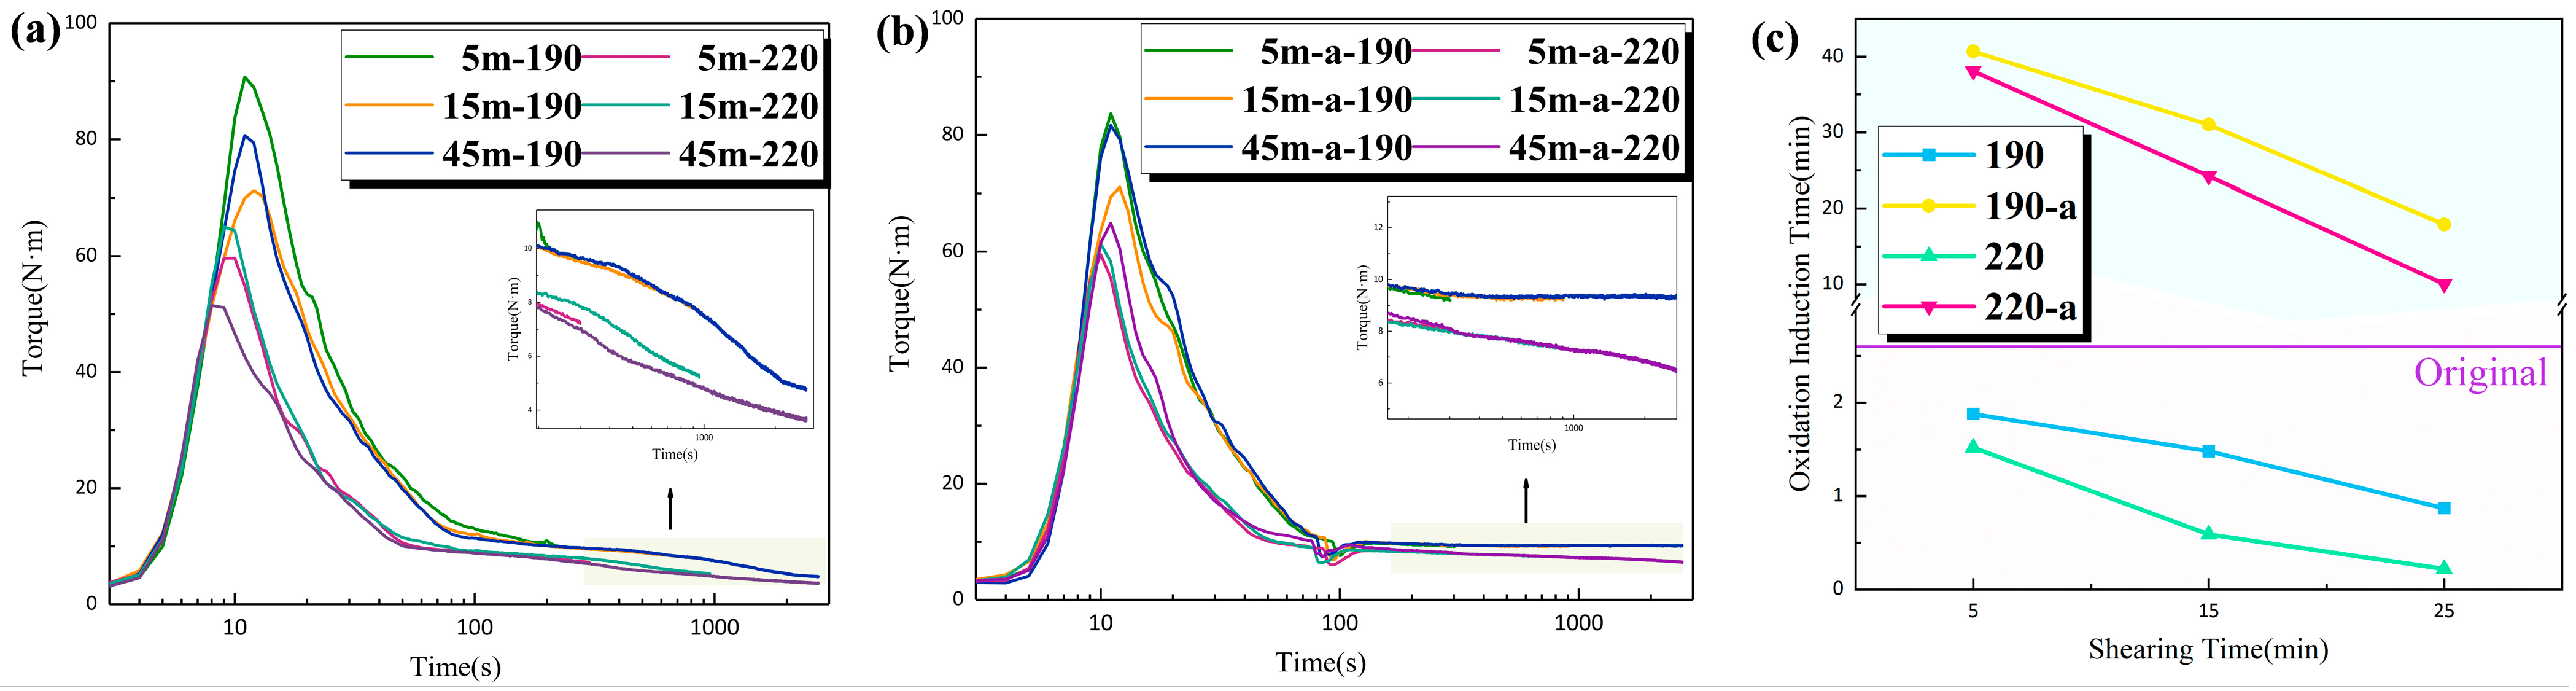
The change in torque value in the rheogram (torque-time curve) of PP can reflect the change in viscosity of the molten samples in the mixing chamber. The torque-time curves and balance torque for each sample are shown in
Figure 1. The torque increased sharply with time, and then decreases, and eventually reaches equilibrium.
As shown in
Figure 1, as the shear time increases, both the torque and viscosity of the material decreased significantly. With the same shear time, the equilibrium torque and viscosity decreased with increasing shear temperature. Under the action of shearing, on the one hand, the original entanglement points of the PP molecular chain were opened, resulting in a decrease in the concentration of entanglement points, and on the other hand, the molecular chains were oriented along the direction of the shear field, resulting in a decrease in the viscosity of the PP melt as the shear time increased. The increase in shear temperature accelerated the thermal motion of PP molecules and enhanced their capacity for molecular transition, while the elevated temperature widened the distance between molecular chains, resulting in an increasing free volume within the molecules and a reducing melt viscosity of PP. After 45 min of shear action, the equilibrium torque decreased significantly. Long-term shear stress and thermomechanical action will cause PP macromolecules to fracture and degrade, resulting in a decrease in molecular weight and easier movement of molecular segments. Consequently, the viscosity was drastically reduced. The addition of the antioxidant effectively prevented the oxidative degradation of PP, resulting in an improvement in equilibrium torque.
3.2. Fourier Infrared Spectrum
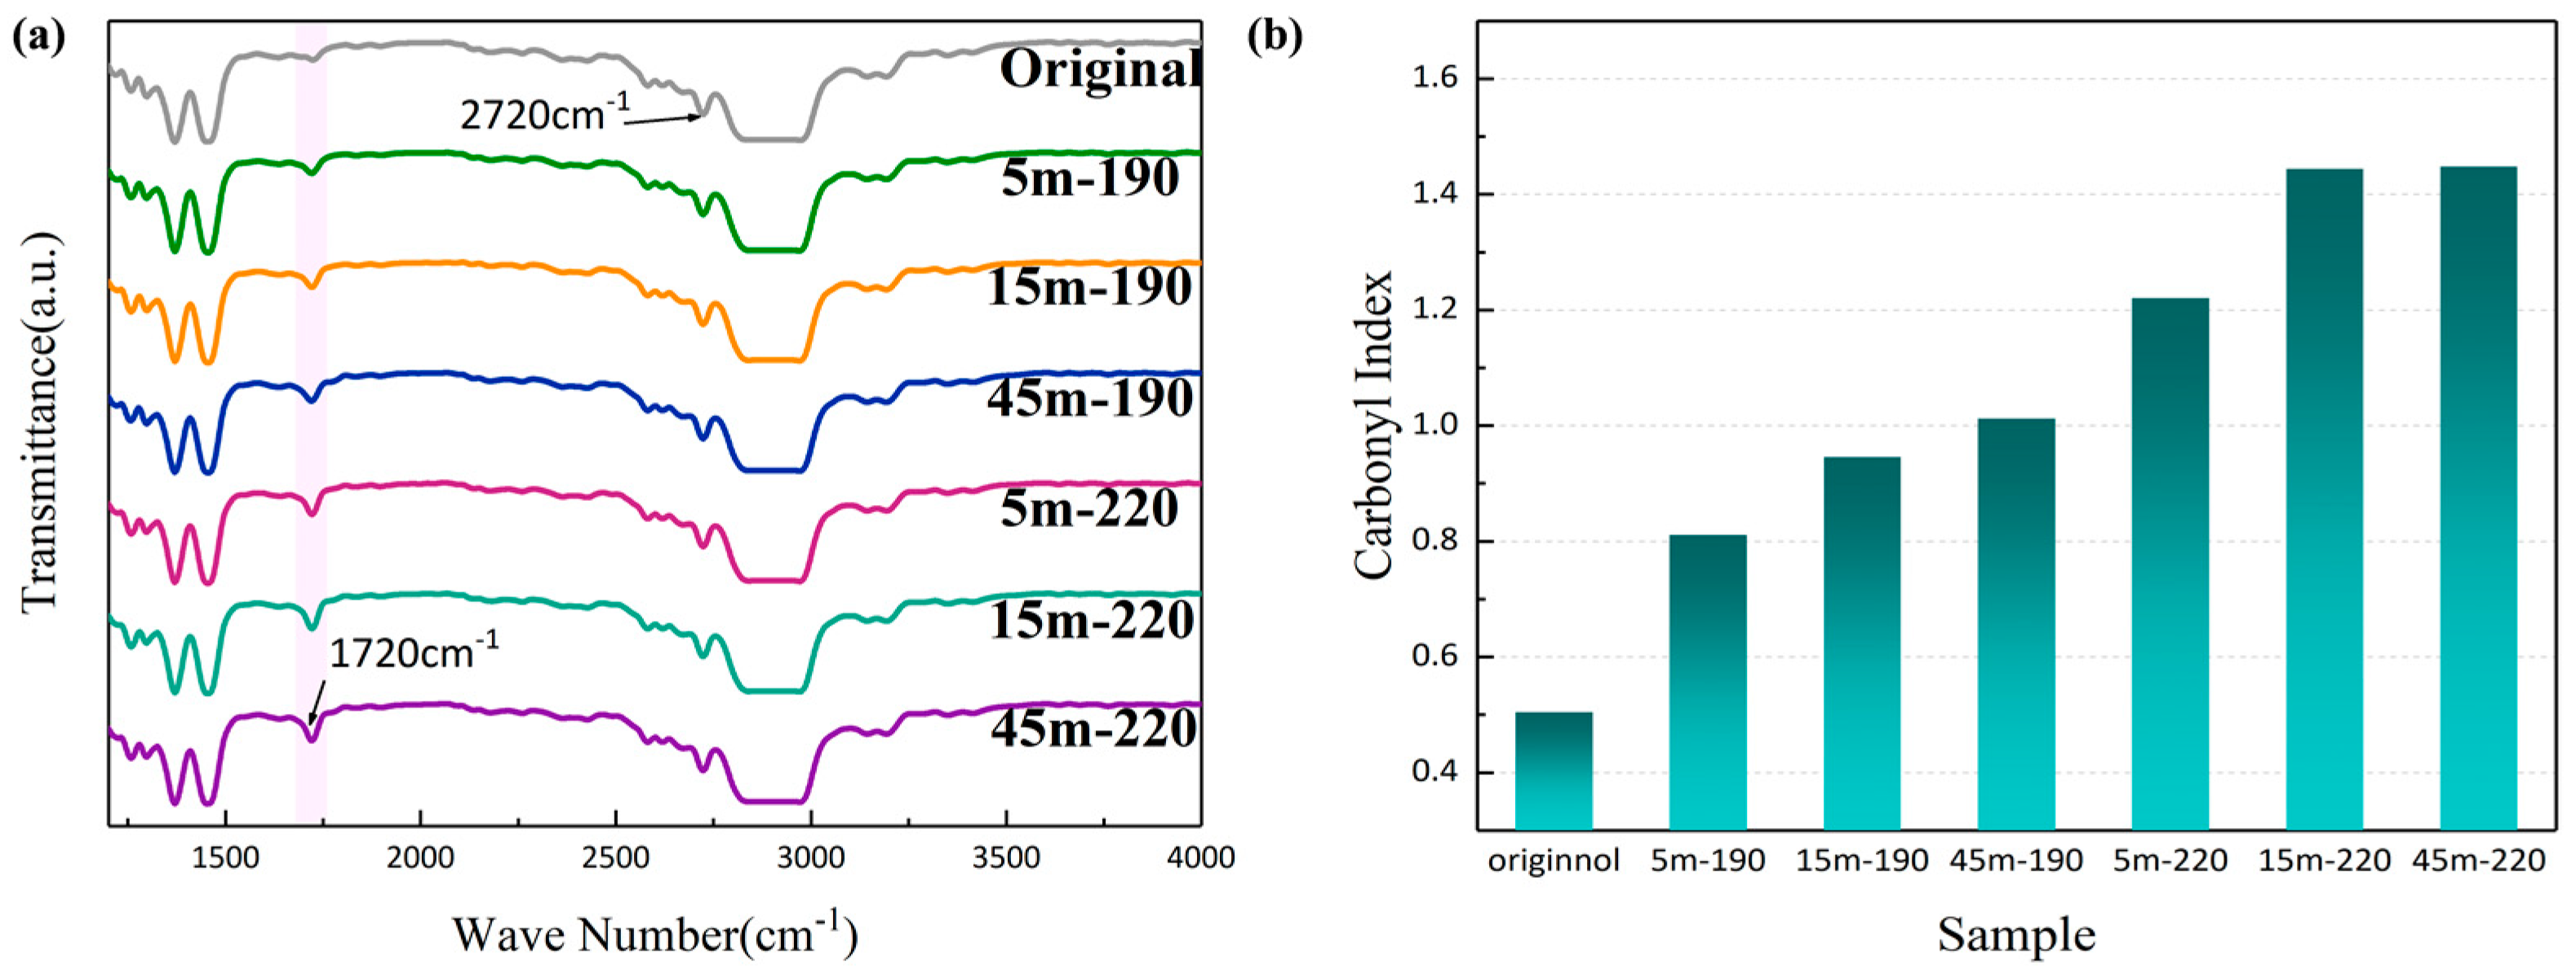
The internal causes of degradation during the processing of PP materials are related to their molecular arrangement. Carbonyl content is commonly employed to characterize the degree of thermo-oxidative degradation of PP. The carbonyl content (
CI) is calculated by Equation (1) [
30].
where
and
are the integrated areas of the carbonyl peak (1715 cm
−1) and the reference peak (2720 cm
−1) [
30], respectively.
Figure 2 shows the infrared spectra (IR) and carbonyl index of each specimen after different degrees of shearing. The transmittance is the percentage of auxiliary light that passes through the sample material. The absorption peak at 1720 cm
−1 corresponds to the (C=O) stretching vibration peak, indicating that (C=O) was generated by oxidative degradation.
Figure 2b reveals that the carbonyl index increases gradually with increasing shear time and temperature, and the degradation reached the maximum degree in 45 m-220, which was sheared at 220 °C for 45 min. The result indicates that when shear is continuously applied to a material, the thermomechanical action will break the PP molecular chains and cause oxidative degradation.
3.3. Oxidative Induction Time Test
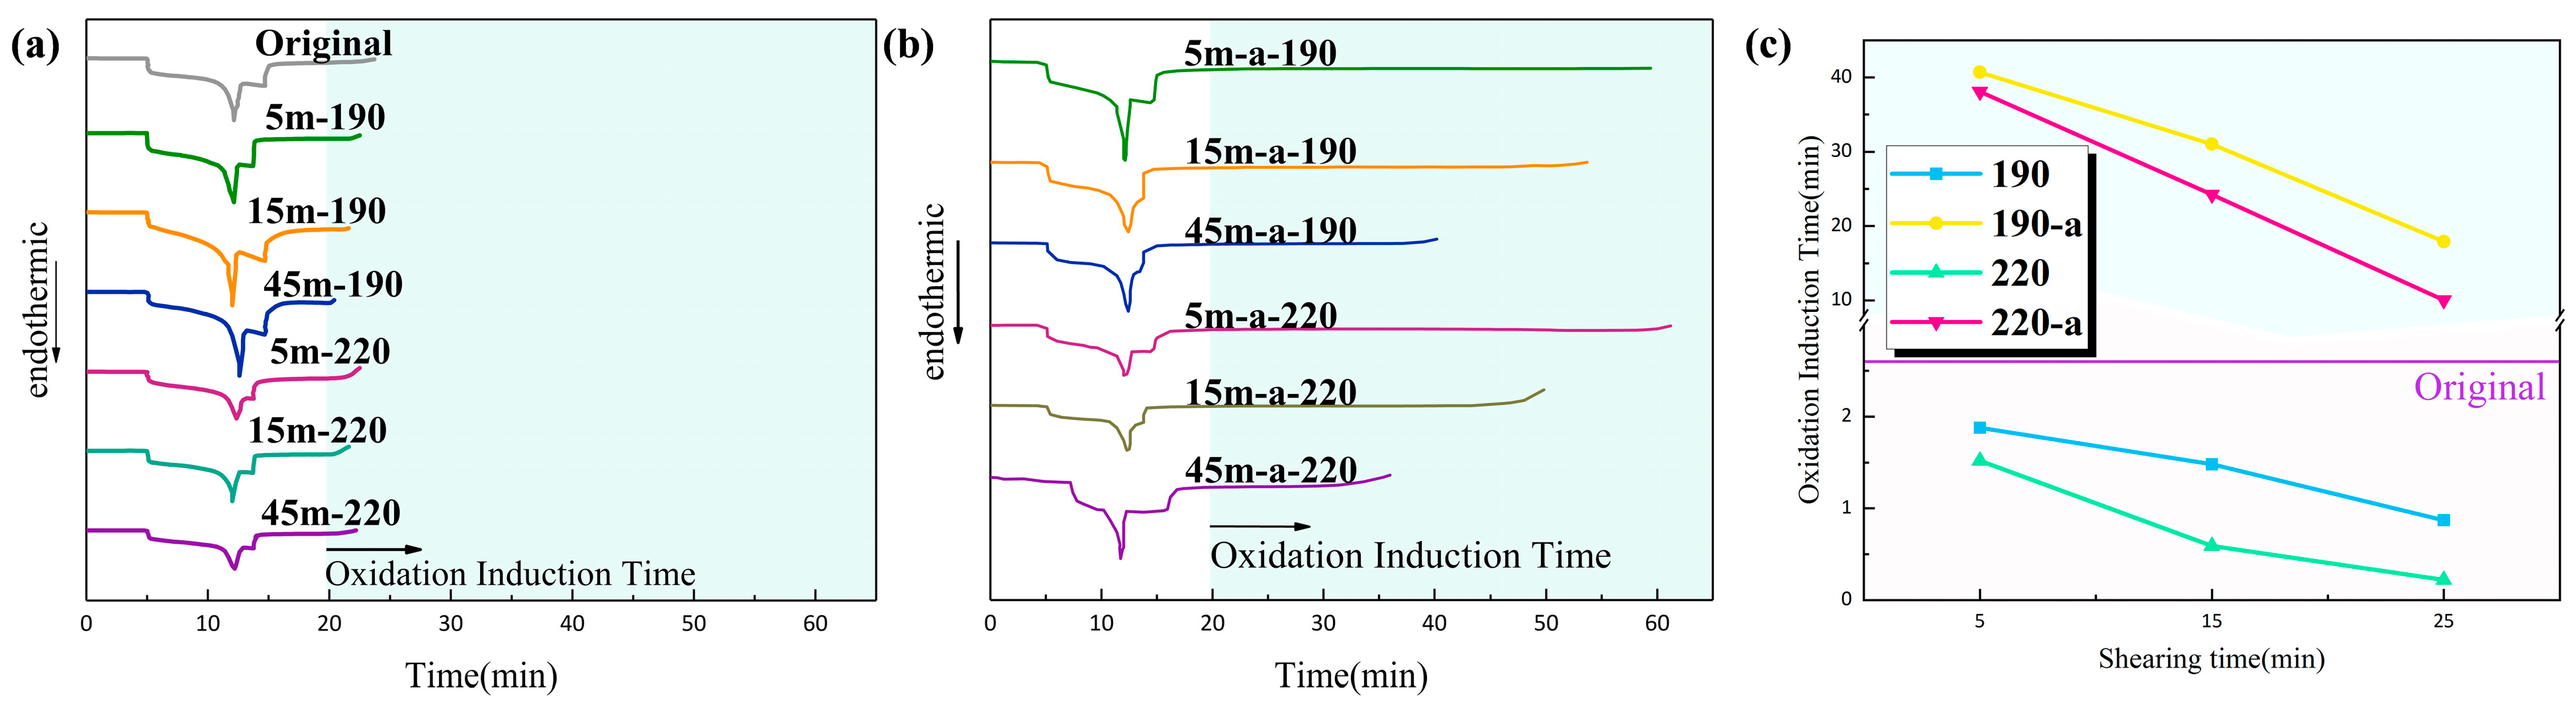
OIT is the period of time between the stable form and the oxidation reaction of a polymer at high temperature. It is commonly used to measure the thermal oxygen degradation ability of polymers.
Figure 3 shows the oxidation induction curves and oxidation induction times for each T30S sample subjected to various shear actions.
The results show that the oxidation induction time of sheared samples is significantly shorter than that of unsheared samples, and that the oxidation induction time decreases as shear time and temperature increases. During the high-temperature mix process, with the increase of shear time, the probability of molecular chain breaking in the material increases and free radicals are generated, while the chemical activity of the material is enhanced and the material is easier to oxidize. Therefore, after the high-temperature shear force was applied, the anti-aging ability of PP material declined. After the antioxidant was added to PP, the OIT of materials was prolonged significantly. This is because the antioxidant actively provided hydrogen atoms to prevent the subsequent chain reaction of PP molecular chains, thereby protecting PP macromolecules from the influence of chemical reactions and preventing the thermal oxidation degradation of materials.
3.4. Crystallinity Test
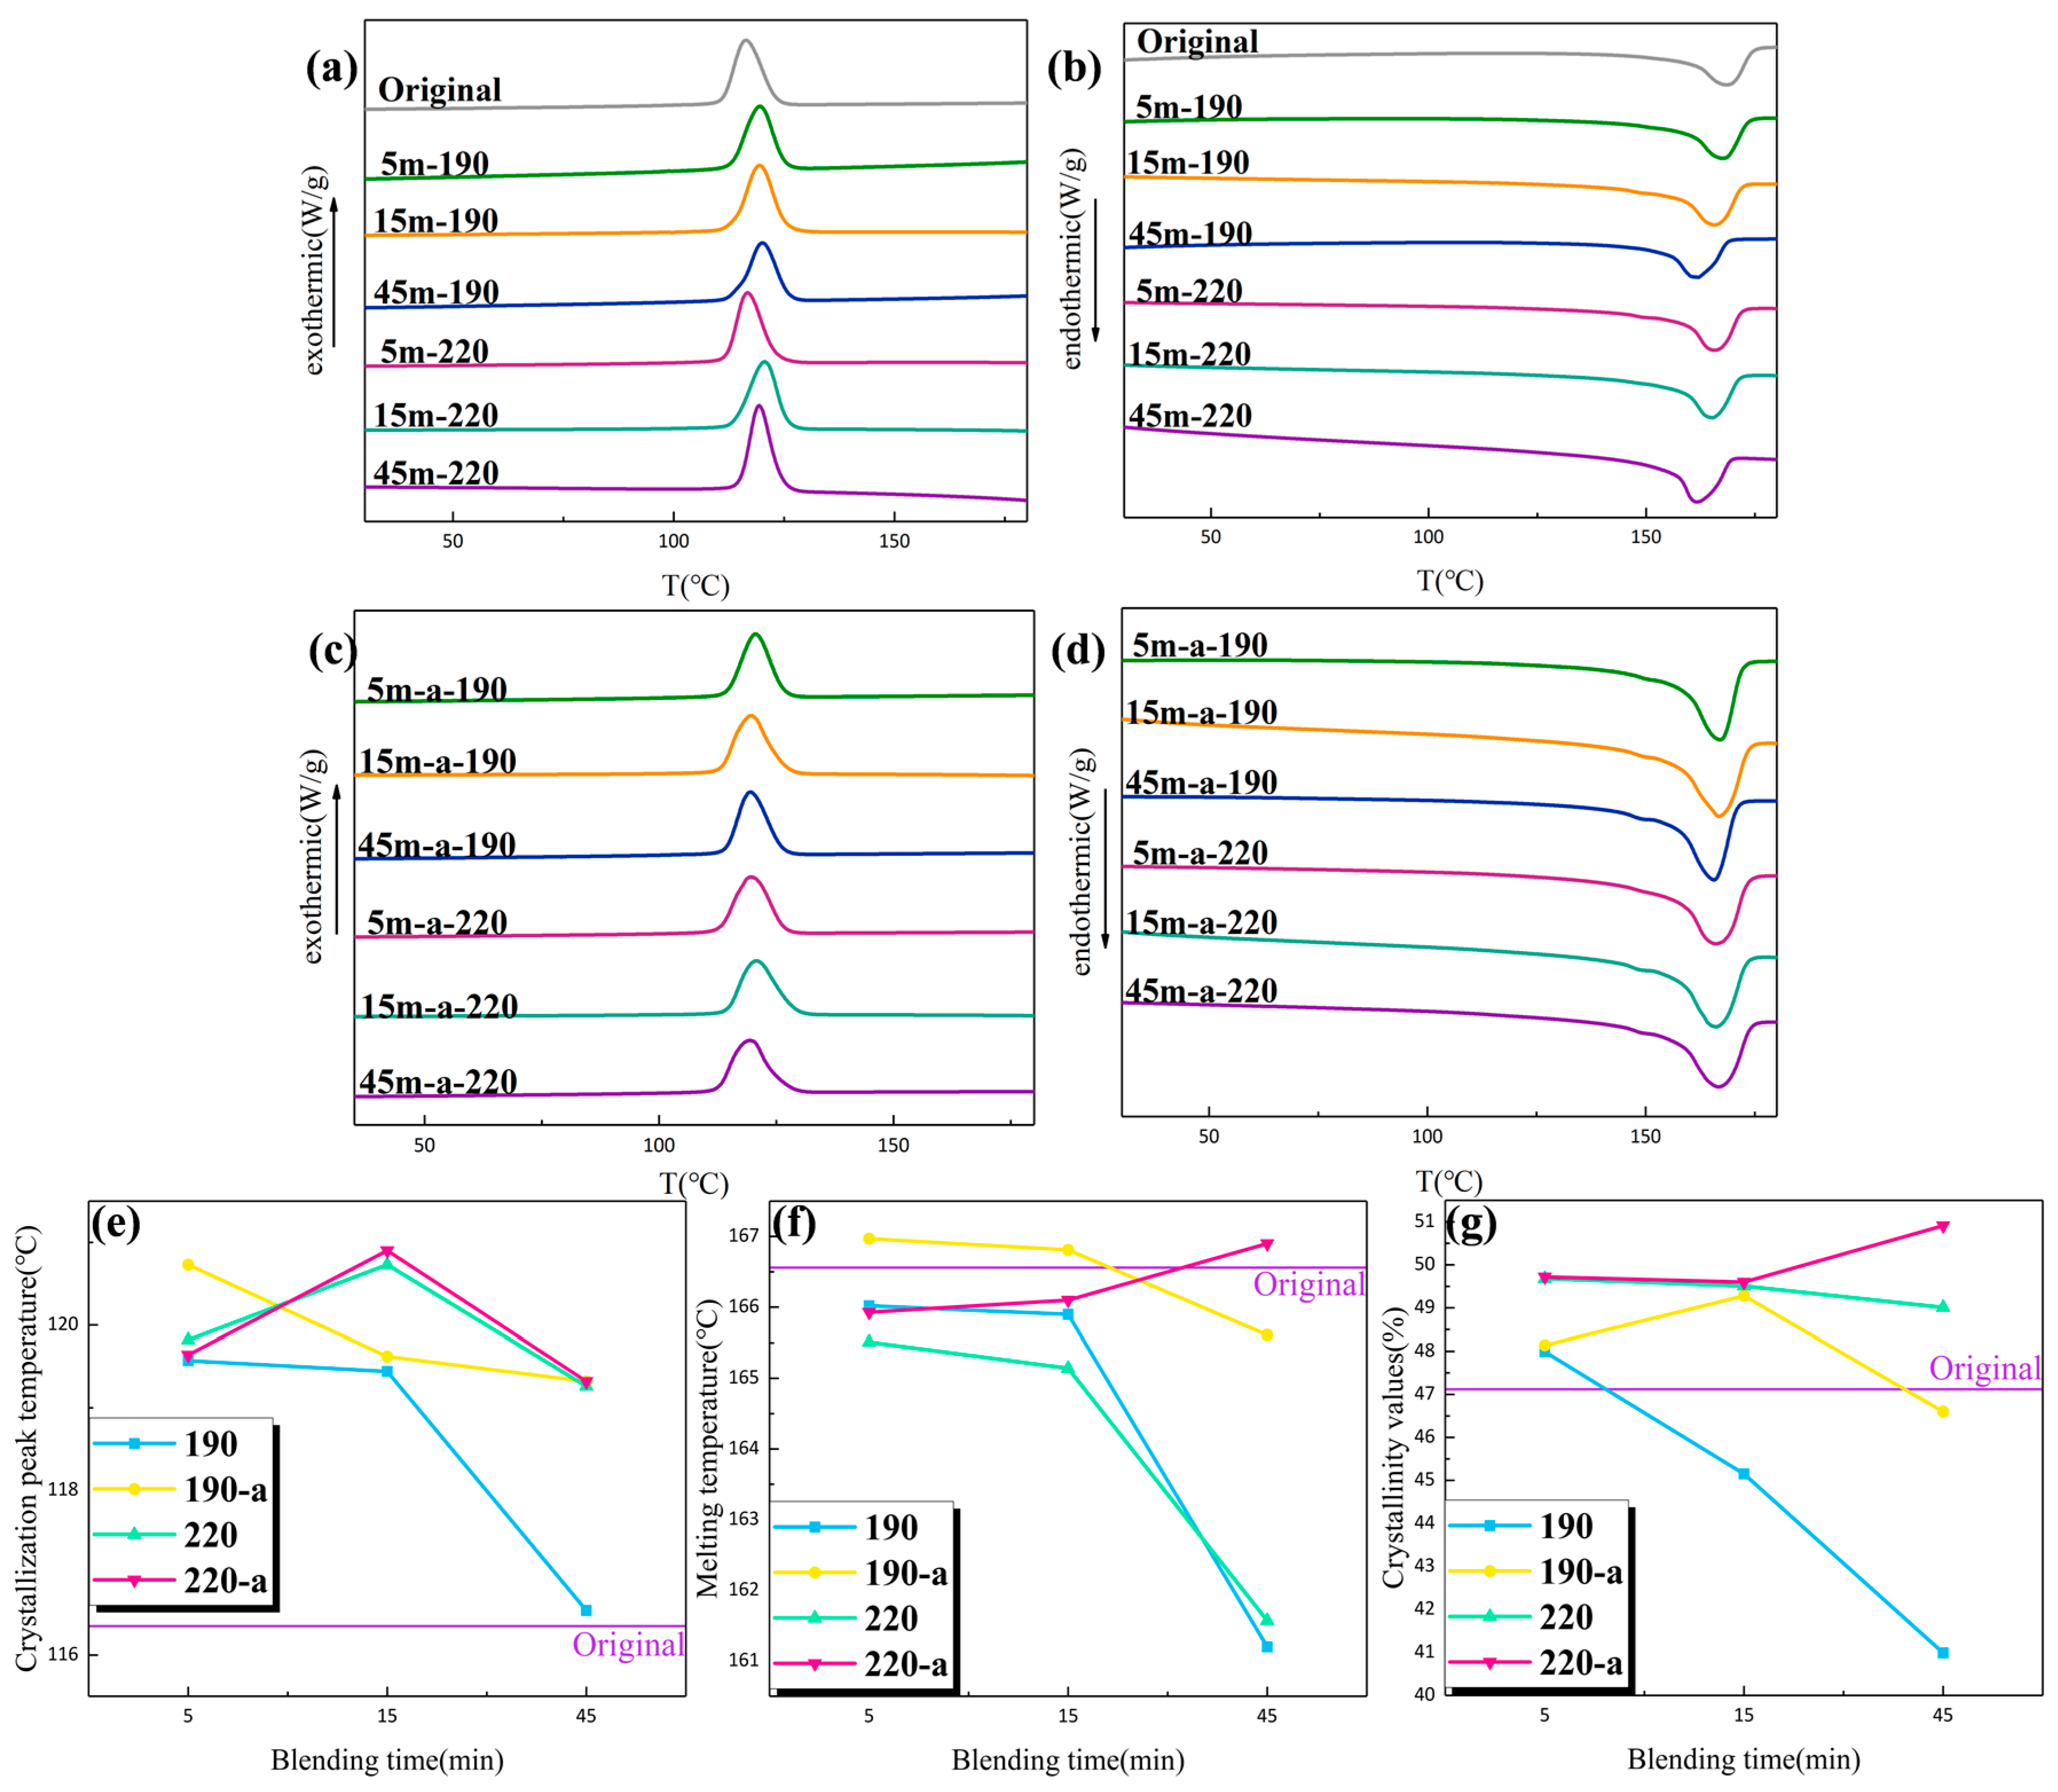
Differential Scanning Calorimetry (DSC) can determine the heat absorbed during the melting process and the heat released during the crystallization process. The crystallinity (
XC/%) was calculated from the DSC result by Equation (2) [
26].
where
(J/g) was the melting enthalpy,
(J/g) was theoretical melting heat at 100% crystallinity; the ∆H_100 of PP in this paper is taken as 209 J/g [
26].
Figure 4a–d show the DSC curves of PP materials, and
Figure 4e–g show the variation of DSC characteristic parameters with shear time. The results illustrate that the temperatures of melt peak and crystallization peak and the crystallinity degree show an overall decreasing trend with the increase of shear time. At the same shear temperature and shear time, the addition of antioxidant can effectively mitigate the change of melt crystallization behavior of the material. At the early stage of shear, the loosely oriented chain segments and un-sheared molecular chains tend to nucleate on parallel arranged structures and the nuclei grow into lamellar crystals, leading to an increase in the crystallinity degree. With the extension of shear time, the PP material melts completely, and excessive shear action increases the probability of breaking the macromolecular chains, on the one hand, making the molecular weight distribution uneven, while the oxidation reaction introduces oxygen atoms to the main chains and reduces the structural order, on the other hand, both of which lead to a decrease in the characteristic temperatures and crystallinity degree of the material. The increase in shear temperature will intensify the chain-breaking and oxidation reactions and cause crystallinity degree decreases. The addition of the antioxidant can act as a free radical cleaner to mitigate the cracking and oxidation of the material and reduce the effect of high temperature shearing on the crystalline properties of the material.
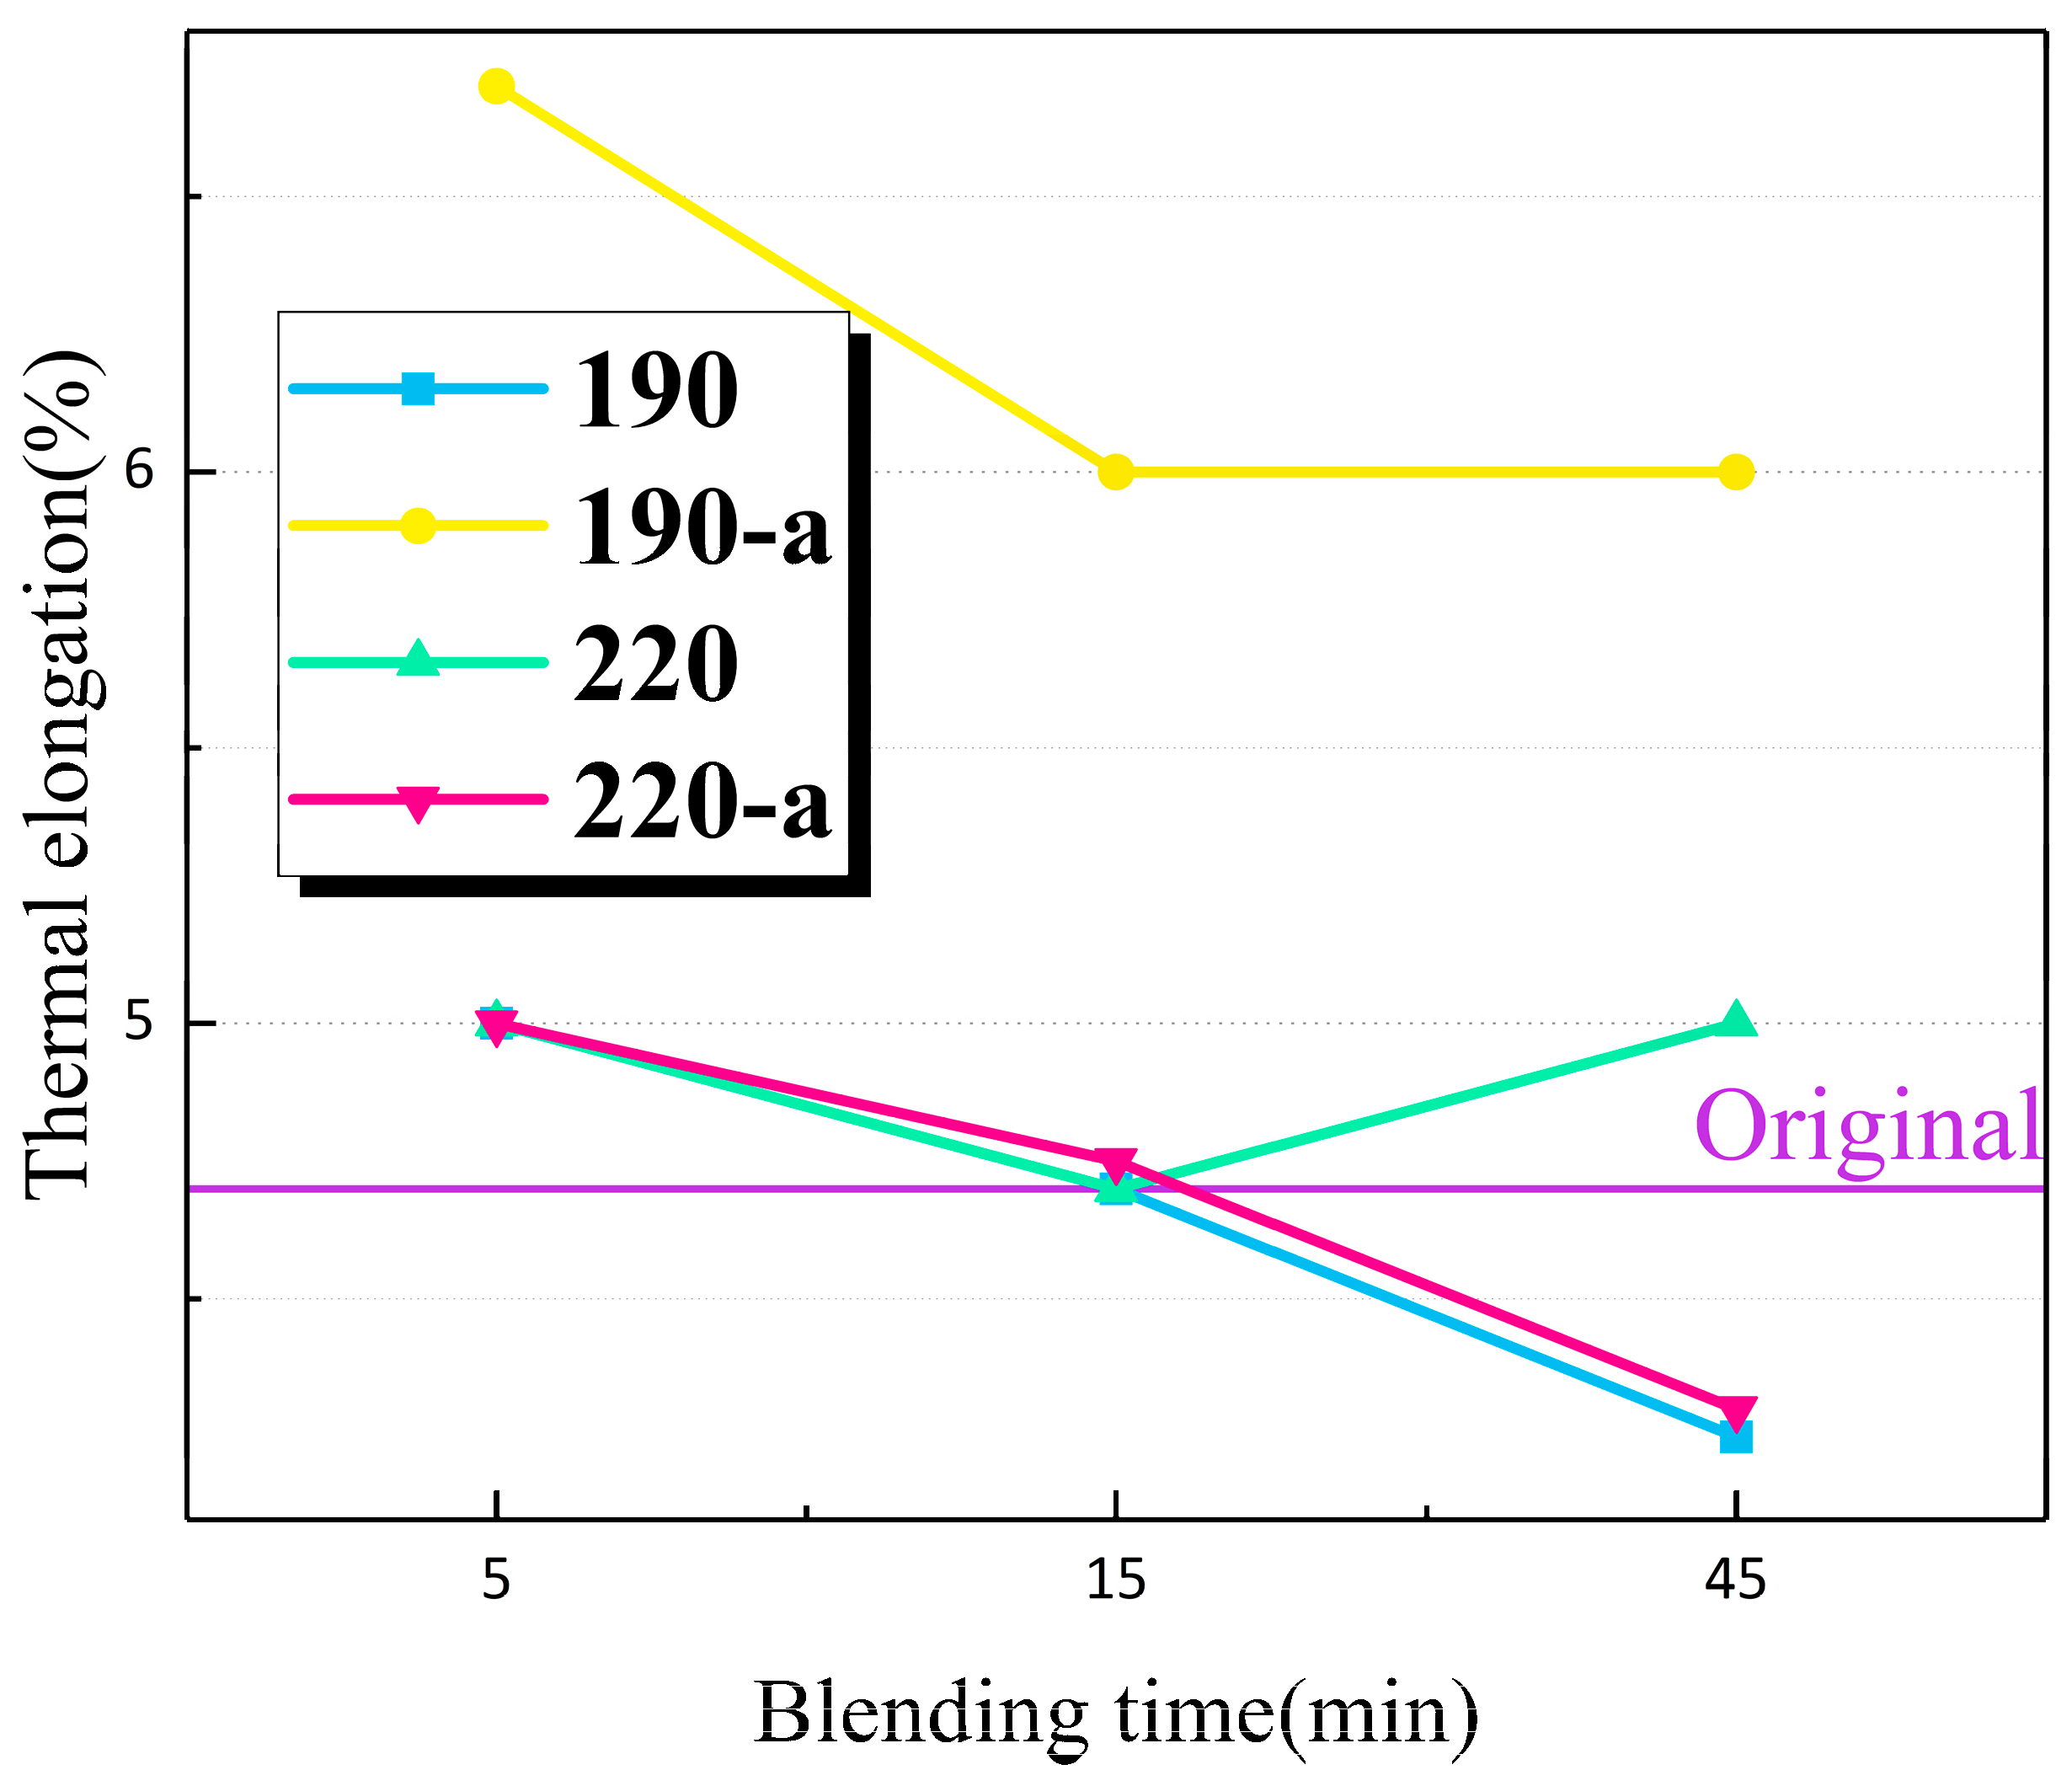
3.5. Thermal Elongation Test
The thermal elongation test is designed to determine whether the PP material retains a predetermined level of mechanical strength following shear deformation at the predetermined overload temperature.
Figure 5 shows the thermal elongation of each PP material at 150 degrees Celsius. The results were less than the maximum value of 175% specified by IEC 60811-2-1-2001, indicating that the sheared material retained its mechanical properties at elevated temperatures. This suggests that an increase in shear time and temperature has no discernible effect on thermal elongation; that is, the sheared material retains some degree of flexibility.
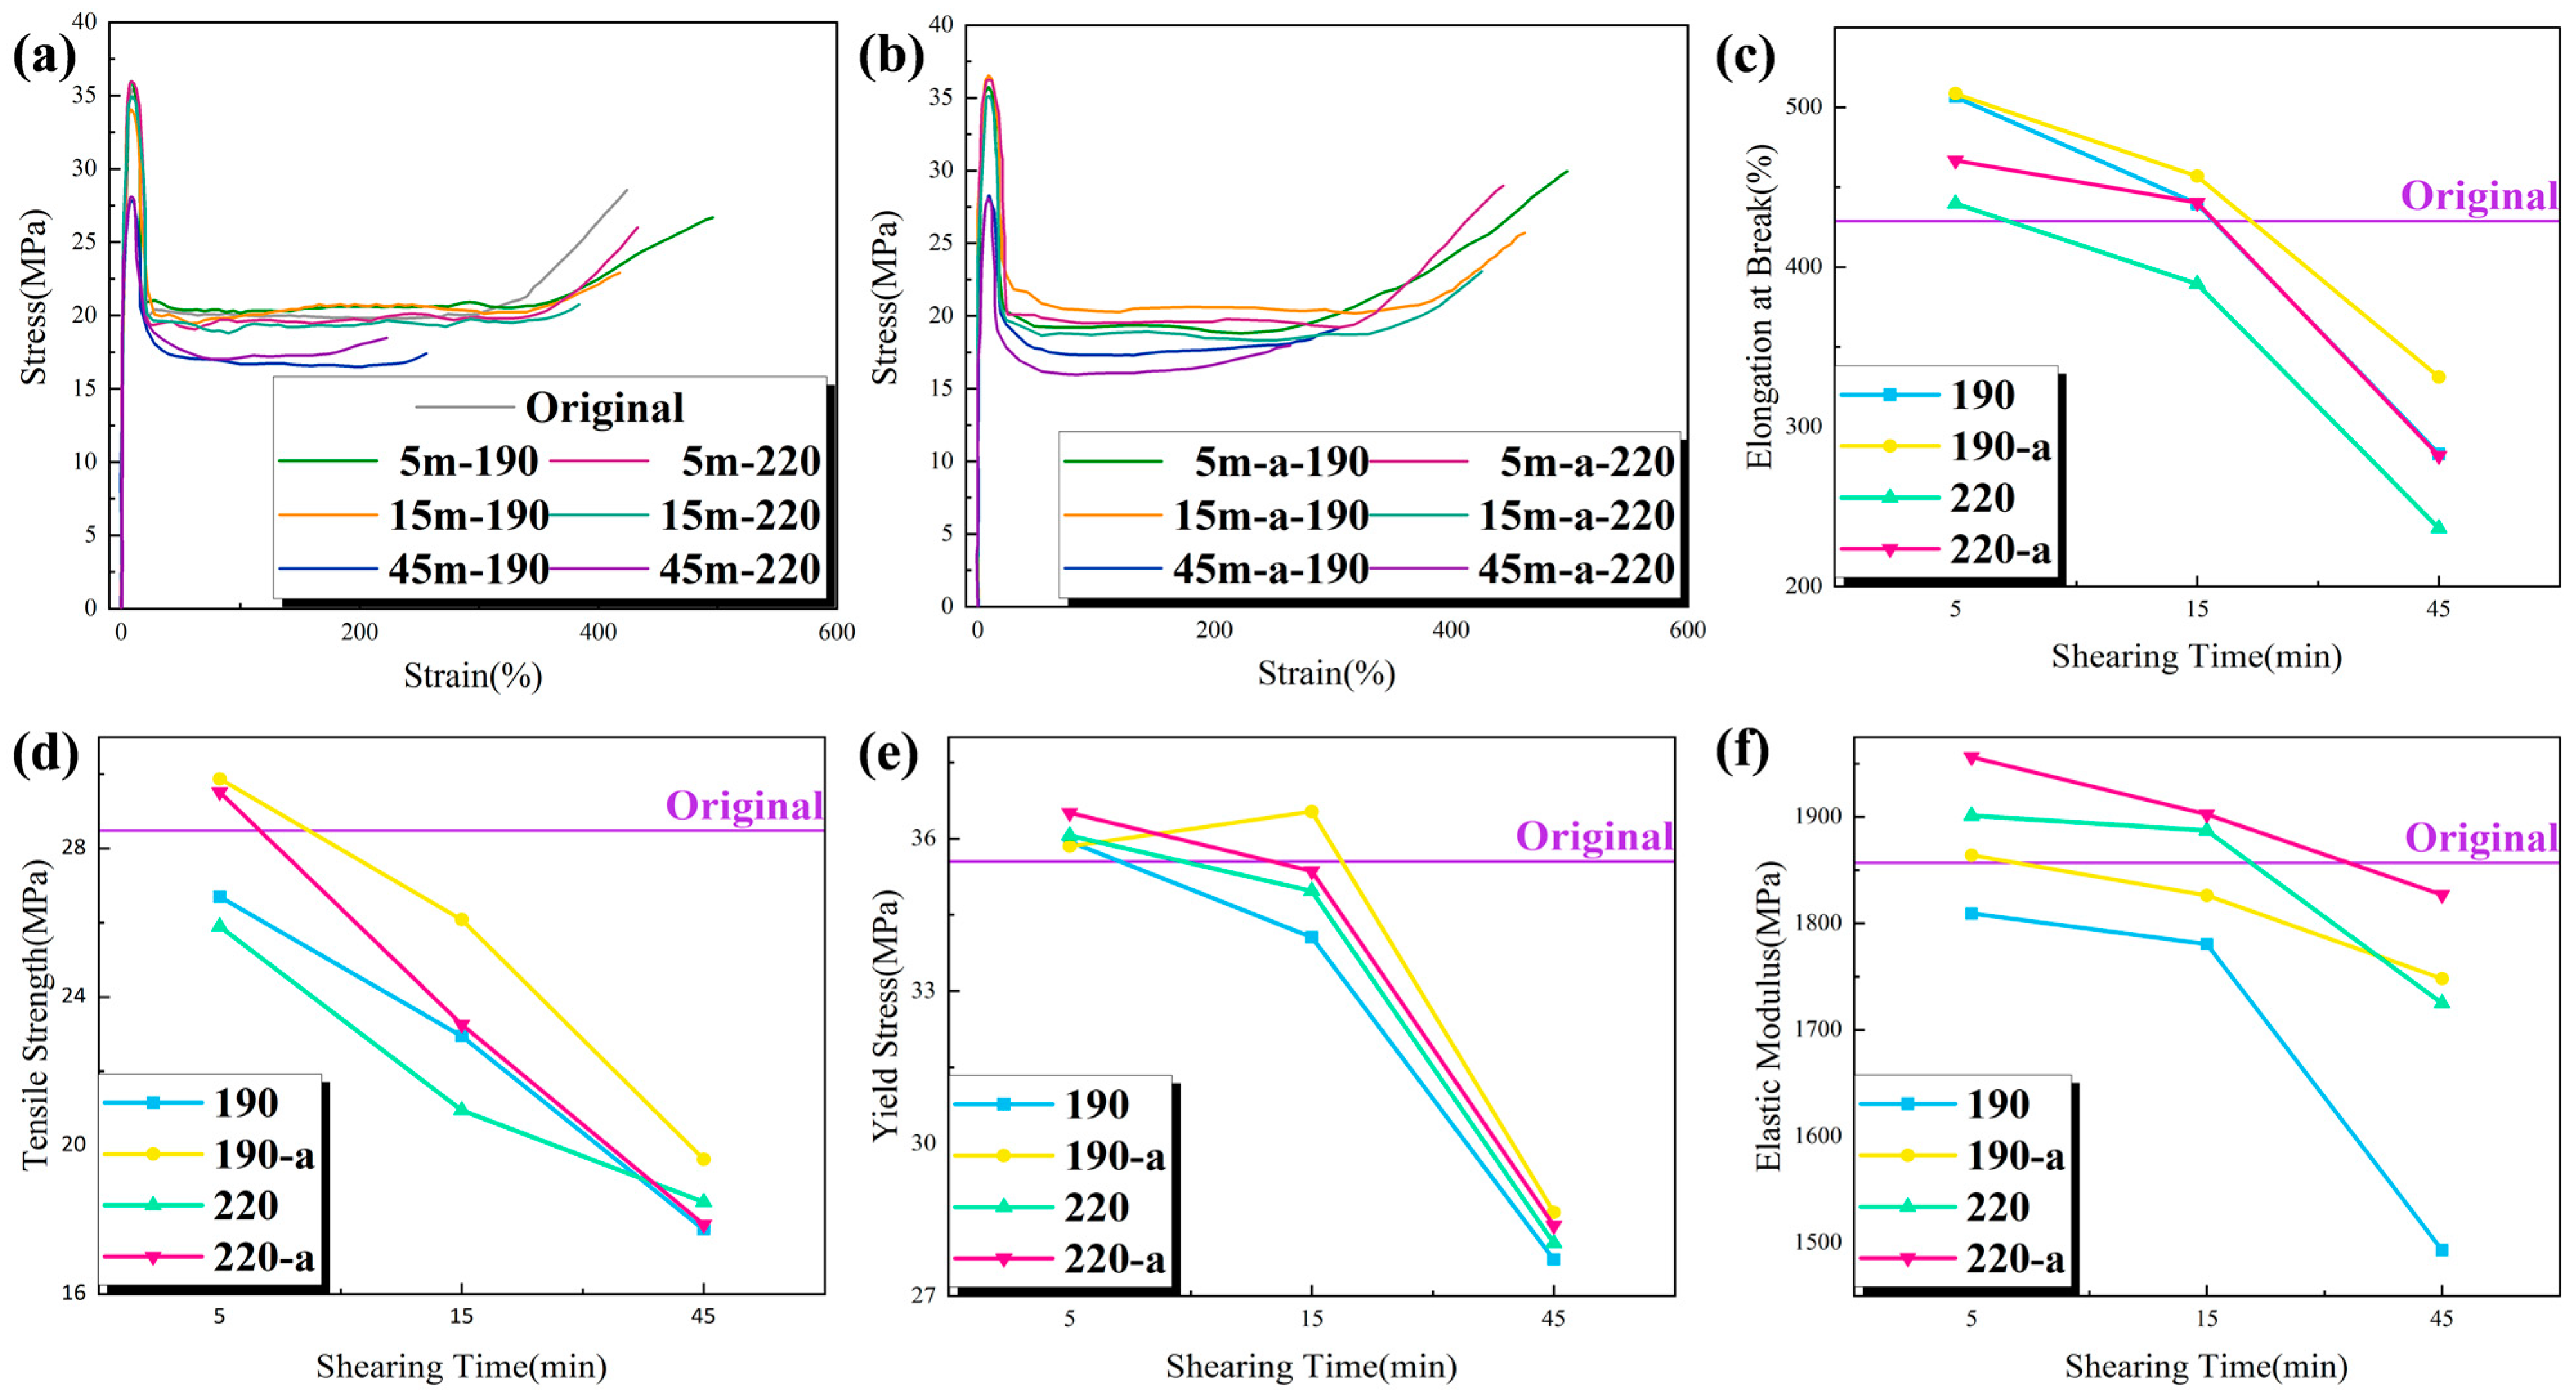
3.6. Tensile Property Test
In order to investigate the effect of shear action on the mechanical properties of PP, the stress–strain test curves of each group of samples are shown in
Figure 6a,b. Under specific loads, tensile tests are conducted to determine the mechanical properties of a material, such as elongation at break, tensile strength, yield stress, and elastic modulus.
Figure 6c–f show the relevant test results of each group of samples.
At 5 min of shearing, PP may have a small number of broken molecular chains, with large molecules predominating, and proper mixing can improve the uniformity of large and small molecules, thereby facilitating the orderly arrangement of molecules. This made the material more uniform during the necking phase of the stretching process and, as a result, its elongation at break, or toughness, was enhanced. The presence of a large number of small molecular chain segments within the material weakened the intermolecular interaction force, causing the elongation at break to decrease to some extent when the shear continued to be increased for 15–45 min or when the shear temperature was increased. While the oxidative degradation of the material introduced more carboxyl polar groups, which inhibited the movement of the molecular chains, the material’s flexibility deteriorated gradually, resulting in a decrease in elongation at break and poor toughness. In PP’s crystalline phase, the orderly and regular arrangement of molecular chains enabled the material to withstand greater loads. The higher the crystallinity, the greater the rigidity or elastic modulus. At 5 min of shearing, the crystallinity had improved slightly, so the change in elastic modulus was not significant; from 15 min to 45 min of shearing, the crystallinity decreased gradually, and the elastic modulus and yield stress of the material also decreased gradually. The material’s rigidity decreased as shear time increased; when the shear temperature was increased from 190 to 220 °C, the crystallinity increased. Therefore, both the modulus of elasticity and yield stress tended to increase. Comparing with the DSC data, it can be seen that the crystallinity of the material was improved after adding the antioxidant, which obviously improved the oxidative degradation of the material, so the mechanical indexes of the material, such as fracture growth rate, tensile strength, yield stress and elastic modulus, all tended to increase. Compared to the DSC data, it can be seen that the addition of the antioxidant improved the crystallinity of the material, which in turn improved the oxidative degradation of the material. As a result, the mechanical indexes of the material, including elongation at break, tensile strength, yield stress, and elastic modulus, tended to increase.
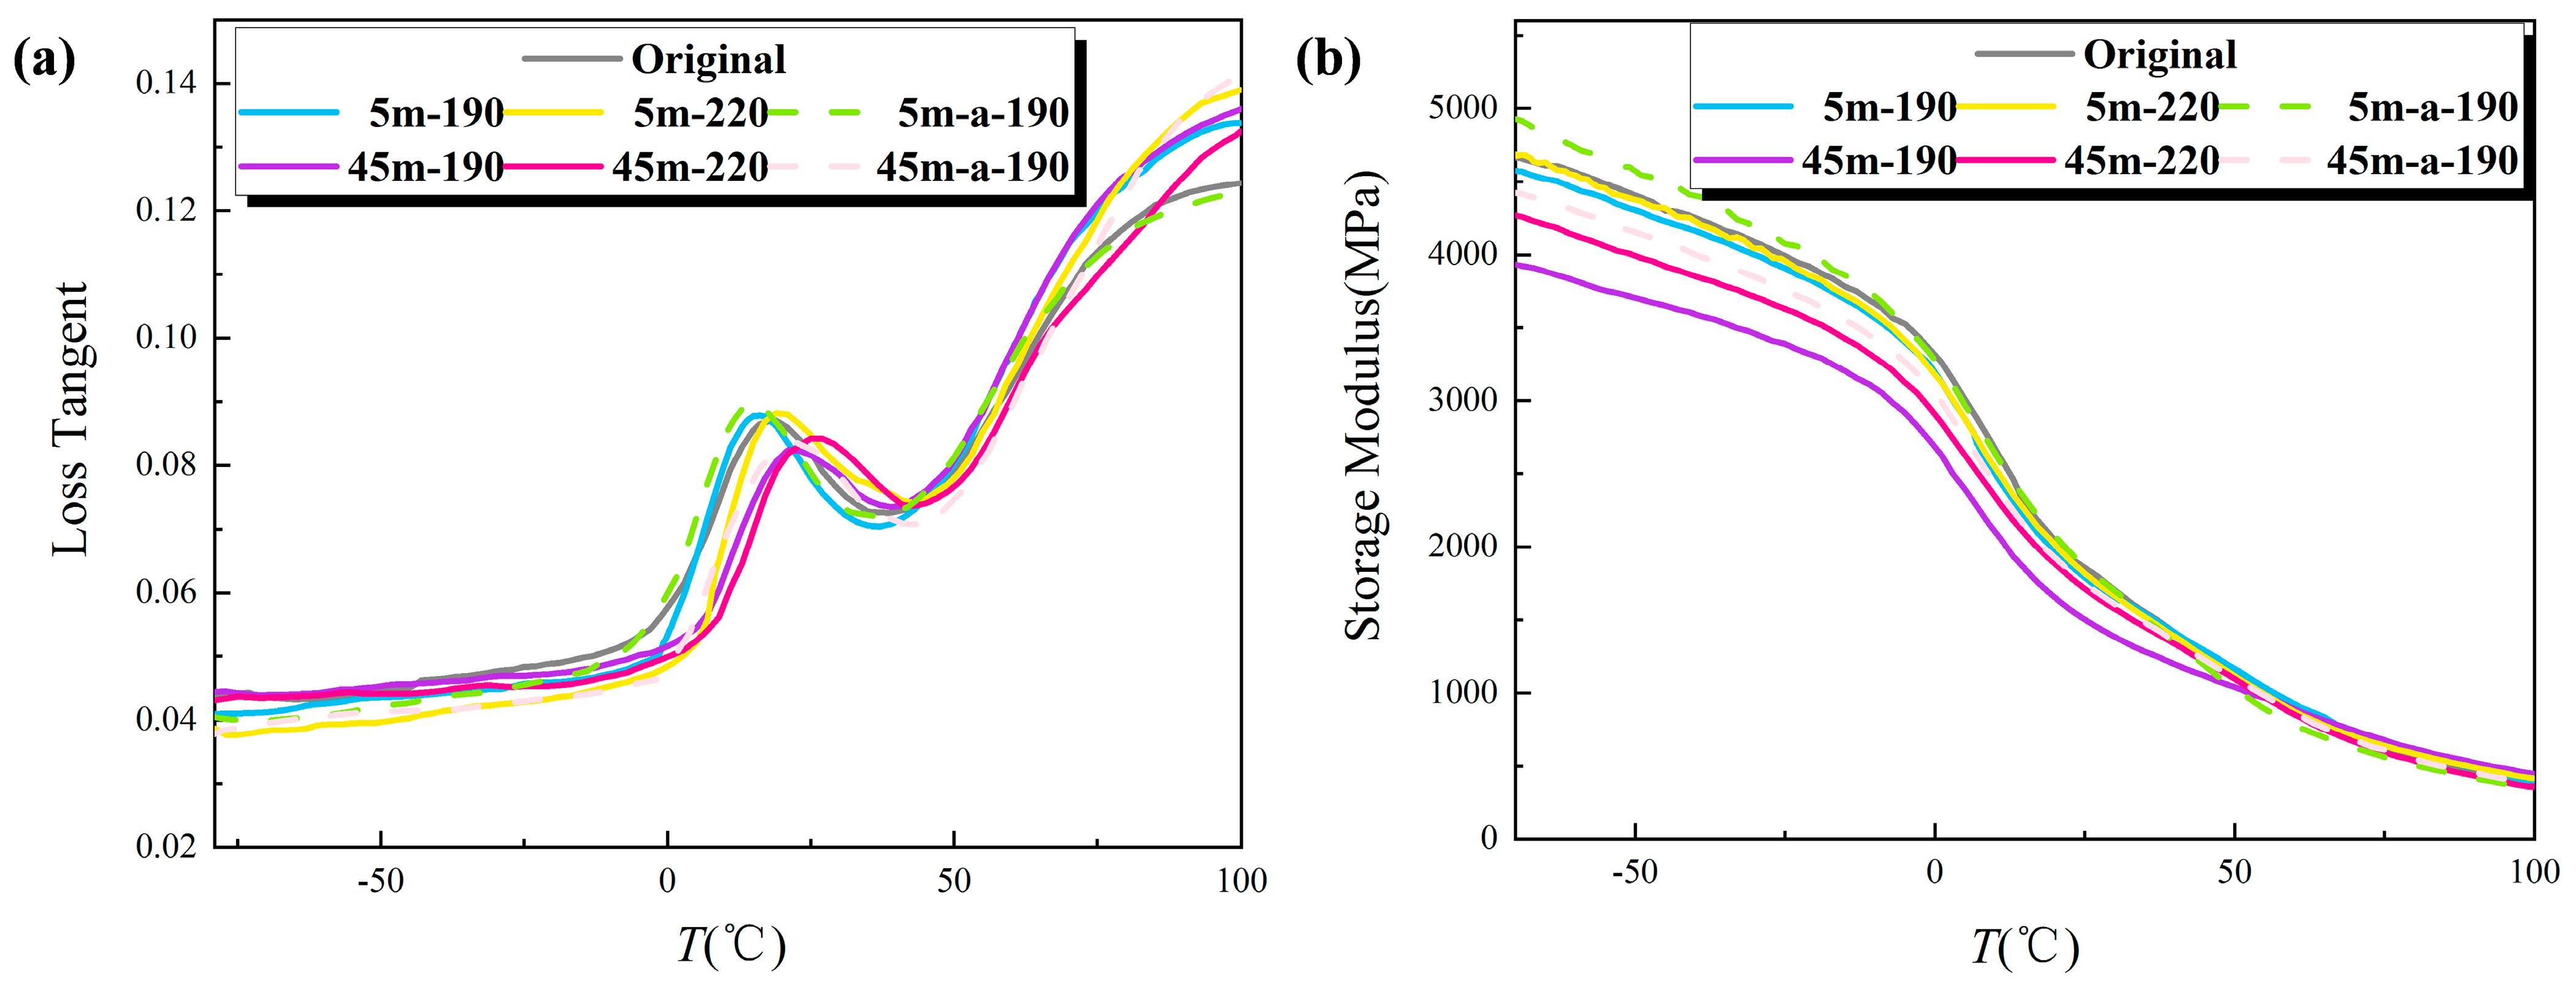
3.7. Dynamic Thermomechanical Test
Figure 7 contains graphs showing the change of loss factor and storage modulus with the temperature of T30S PP after different shear actions.
Figure 7a shows the loss factor profiles of PP at various shear states. The glass transition of PP and the relaxation of chain segments in the amorphous region of PP led to the appearance of the relaxation loss peak at a temperature of approximately 20 degrees Celsius. The graph reveals that the loss peak increased at a shear temperature of 190 °C and a shear time of 5 min. This is because, following the application of shearing, the molecular chains of PP were aligned in the direction of the flow field and the molecular structure became more compact, resulting in difficulties in the relaxation of its molecular chain segments and a consequent increase in the loss peak. However, with the increase of the shear time, the degree of oxidative degradation of the molecular chain increased, resulting in the decline of the crystallinity. With the addition of the relaxation movement of the chain segment, the loss peak went down. The boost in shear temperature increased the crystallinity and made the relaxation of molecular chains more difficult, leading to higher peak value. When the shear temperature was low and the mixing time was short, the molecular chains hardly broke and the mixing made the structure uniform and the molecular arrangement more orderly, so as to improve the molecular chain flexibility; the loss peak position was shifted to a low temperature compared with the unsheared PP. An increase in the mixing time or temperature will destroy the molecular chain structure. Simultaneously, the carbonyl polar groups introduced by oxidative degradation will reduce the flexibility of the molecular chain, and the loss peak will shift to higher temperatures.
Figure 7b shows the storage modulus map for each sample subjected to various shear conditions. According to the graph, the storage modulus of the samples at room temperature (approximately 25 °C) was essentially consistent with the elastic modulus measured in the tensile test. Without shearing, the material’s storage modulus was approximately 1900 MPa. After 5 min of shearing at 190 °C, the crystallinity of the sample did not change significantly, and neither did the storage modulus; however, as shear time increased, the crystallinity of the sample gradually decreased, and the storage modulus also decreased. When the shear time is 45 min, the sample’s crystallinity decreased significantly, and the oxidation caused a large number of carbonyl groups on the branched chains, which reduced the intermolecular force of the material and ultimately caused the sample’s storage modulus to decrease significantly. When the shear temperature reached 220 °C, the storage modulus of PP followed the same trend as when the shear temperature was 190 °C; however, the increase in shear temperature increased the crystallinity of the sample, so the higher the shear temperature, the greater the storage modulus.
When the antioxidant was added to the material, it enhanced the crystallinity and inhibited the oxidative degradation process, causing the loss peak to rise and the peak position to shift to a lower temperature. Additionally, the storage modulus did not vary with shear time or temperature, but during the shear process, the addition of antioxidants enhanced crystallinity, and the storage modulus of the sample exhibited an upward trend.
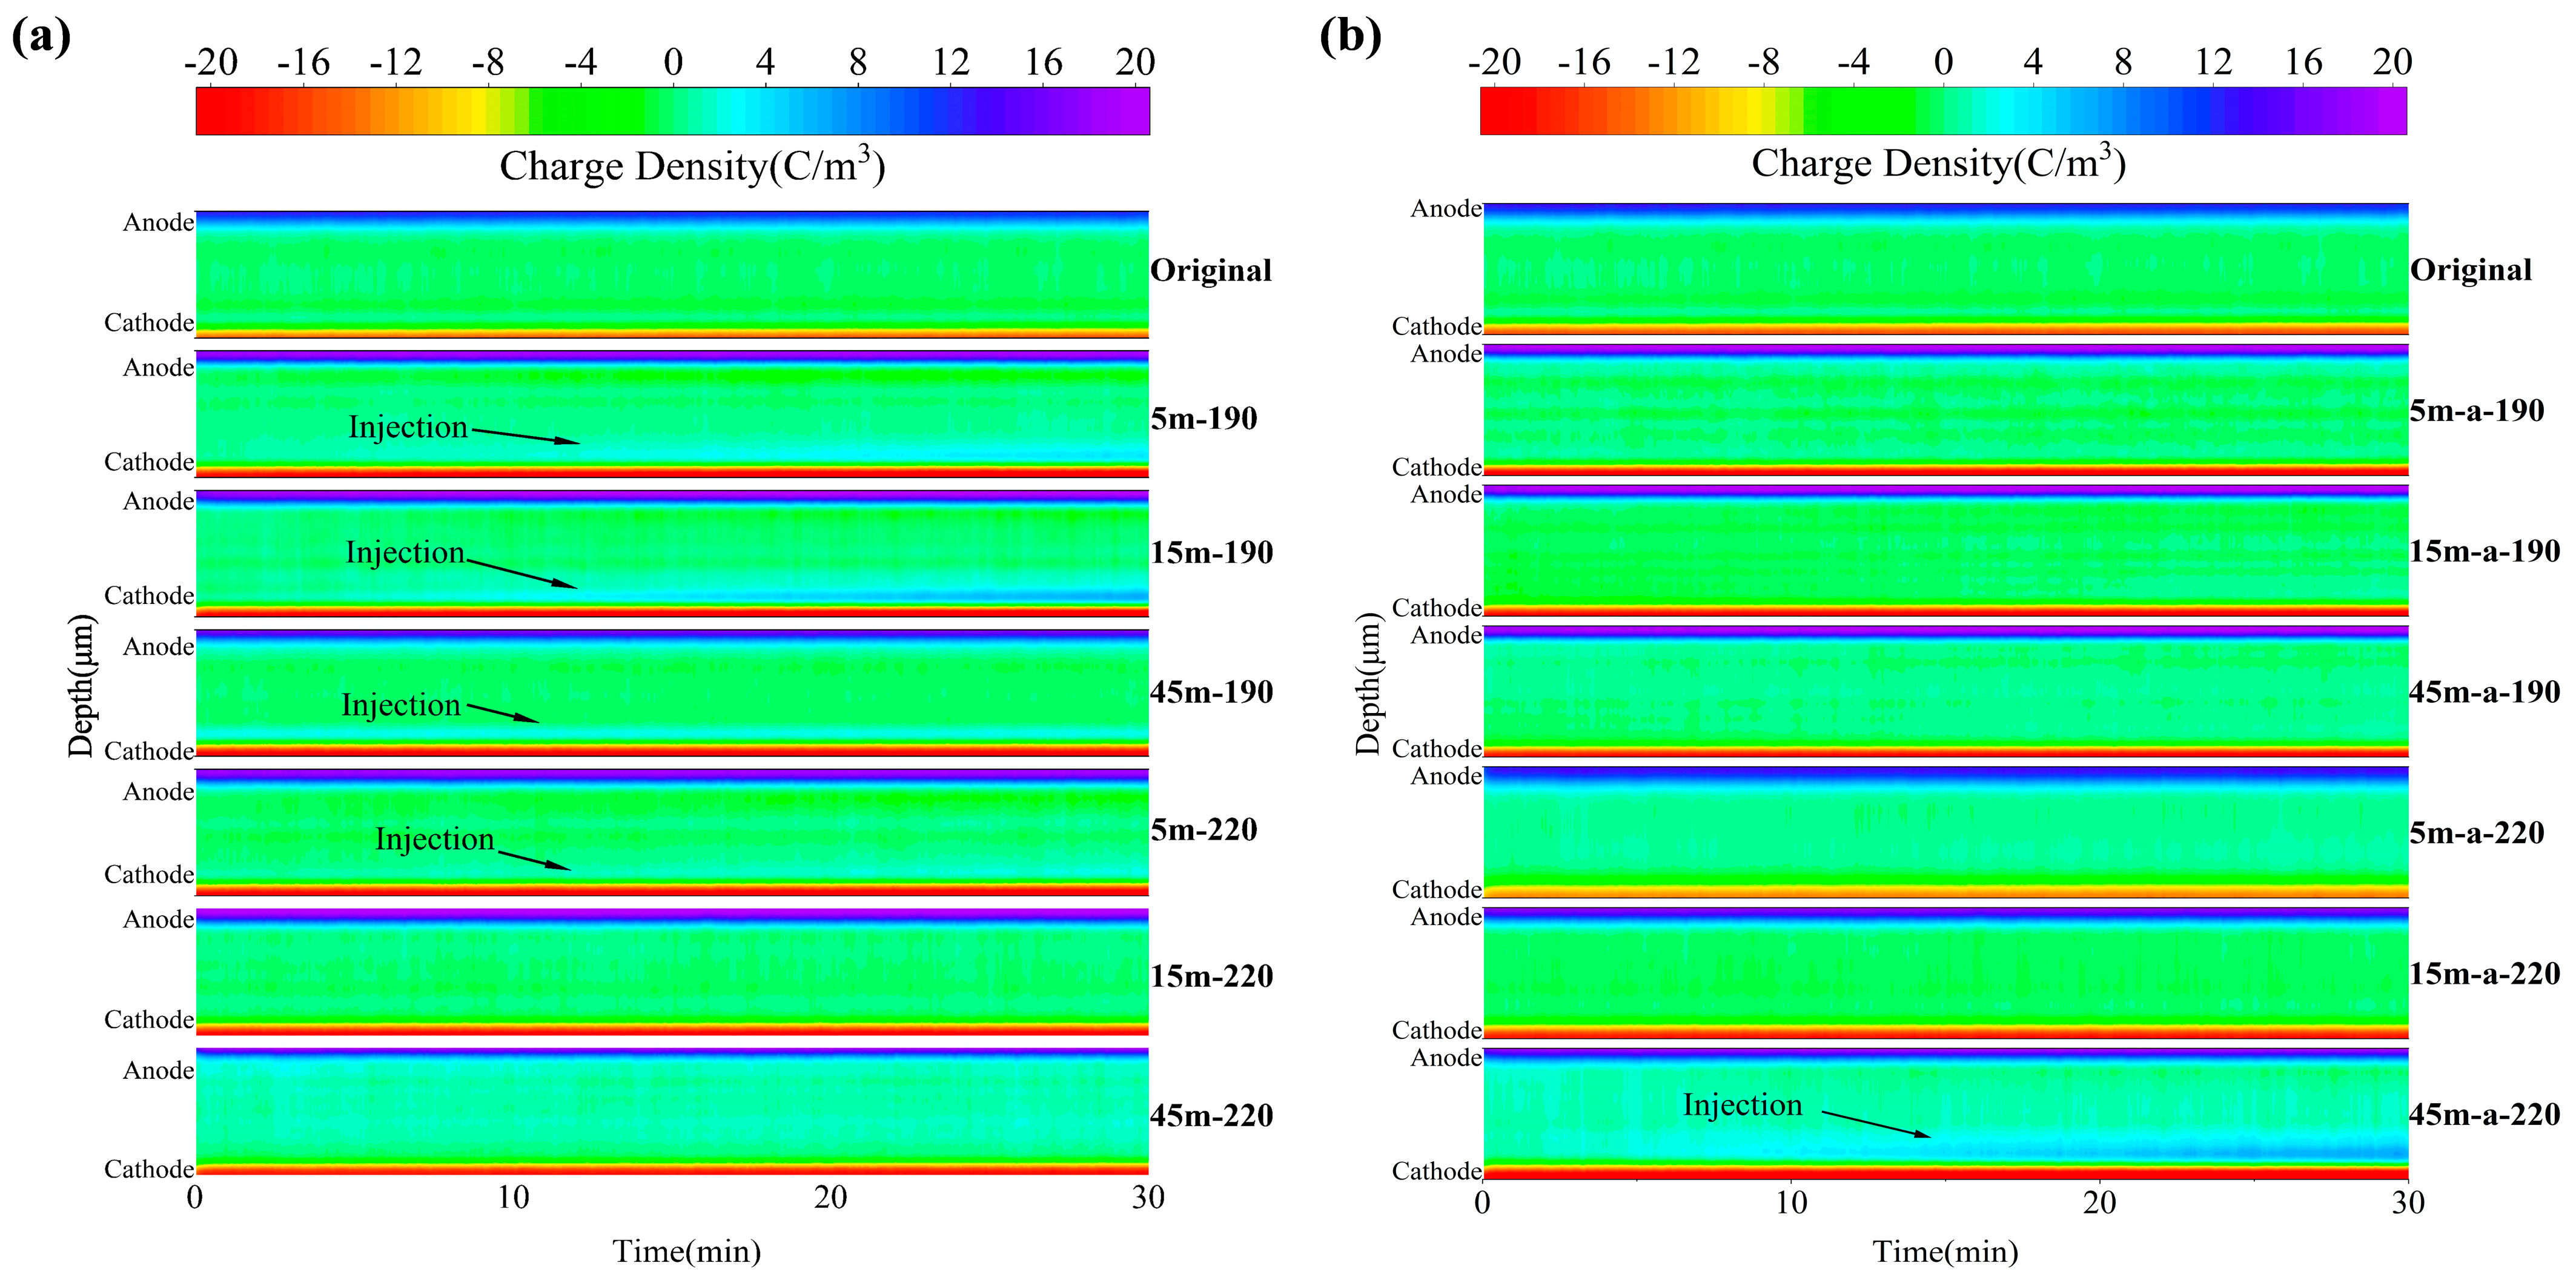
3.8. Space Charge Test
Through Schottky emission, space charge can be injected from the electrode into the insulation.
Figure 8 shows the distribution of space charges within the material.
As the polarization time increases for unsheared PP, the figures indicate that there is no obvious space charge injection phenomenon within the sample. With the increase of polarization time after 5 min of shearing, it is evident that a significant amount of hetero-charge injection occurred near the cathode of the sample. This is because the molecular chains were aligned along the direction of the shear field, and the molecular chains began to disentangle, increasing the distance between them. As a result, the free volume increased, making the migration of electrons and holes easier, resulting in an increase in the number of accumulated space charges. After 15 min of shear, the molecular chains within the material began to break, forming a large number of small molecules and broken chains, which may trap the charges and create traps. In addition, the crystallinity test revealed that the continuous application of shear reduced the crystallinity, which led to the formation of more crystal defect structures, and that the existence of defects destroyed the balance of positive and negative charges in the crystal structure, resulting in the accumulation of more space charge in the material. Under the influence of the DC electric field, the electrode injected a charge into the interior of the sample, and the charge migrated in the direction of the electric field and was captured by the traps along the path. When the outer layer’s traps were full, the charge continued to migrate to the interior of the sample until it was captured by the next trap. Positive and negative charges that may exist within the sample collided and recombined during the process of migration to the opposite electrode in the presence of an electric field. When the shear time was gradually increased, the number of trapped charges increased and the charge detrapping ability decreased. This phenomenon caused the number of free migrating charges in the material to decrease, which indirectly inhibited the recombination of positive and negative charges in the migration, resulting in the accumulation of more space charges and making the aforementioned phenomenon more apparent. When the PP material was sheared for 45 min, which can be considered long enough, the amount of injected charge decreased significantly compared to when the material was sheared for 15 min. This may be due to the fact that PP is a semi-crystalline polymer; when in contact with the electrode, there were both crystalline and amorphous regions. Although there were channels for charge transport in the crystalline region where the molecular chains were ordered, there were more channels for charge migration in the amorphous region than in the crystalline region, suggesting that it was easier for the electrode to inject charge into the amorphous region. From the crystallinity test, it can be seen that the crystallinity of the sample after shearing for 45 min has been significantly reduced, and the increase of the amorphous region made it easier for the electrode to inject charge into the amorphous region, and the charge accumulation in the amorphous region was also easier to dissipate, and the amount of space charge accumulation became less; on the other hand, the long-time shearing had degraded the material to a certain extent, and a large amount of a carbonyl group was produced. The carbonyl group as a polar group will introduce more deep traps in the material, which will trap more space charge and make it difficult to be de-trapped, and these traps will have a strong binding effect on the injected charge, limiting its migration to the interior of the material, thus reducing the amount of space charge inside the material. Therefore, in general, the long-term shear had the effect of inhibiting the accumulation of space charge. The depth of charge injected into the sample sheared at 220 °C for 5 min was shallower than that of the sample sheared at 190 °C for 5 min as the shear temperature increased. This is due to the fact that the increase in shear temperature increased the crystallinity of homopolymerized PP, decreased the free volume, and increased the potential barrier for carrier migration, resulting in a decrease in the space charge accumulation.
It can be observed that heterogeneous nucleation tended to occur at the interface of the amorphous and crystalline regions following the addition of the antioxidant, which had the capacity to trap traps. By DSC results, the crystallinity of the material improved after the addition of antioxidants, which can be explained by the increase in the number of heterogeneous nucleation, and it was further inferred that the area of the intersection of the two phases increased, thereby increasing the interface’s ability to capture traps, which was not conducive to the accumulation of internal space charge, resulting in a decrease in the accumulation of the space charge after the addition of antioxidants. At this time, the antioxidant was capable of suppressing space charges to some degree. However, the increase in space charge accumulation in the sample sheared for 45 min after the addition of antioxidant may be due to the introduction of new chemicals and impurities into the PP matrix after long-time shearing, increasing the concentration of carriers in the PP matrix, and the dissociation of impurities to form more charges, thereby causing the increase in space charge accumulation in the material after the addition of antioxidant.
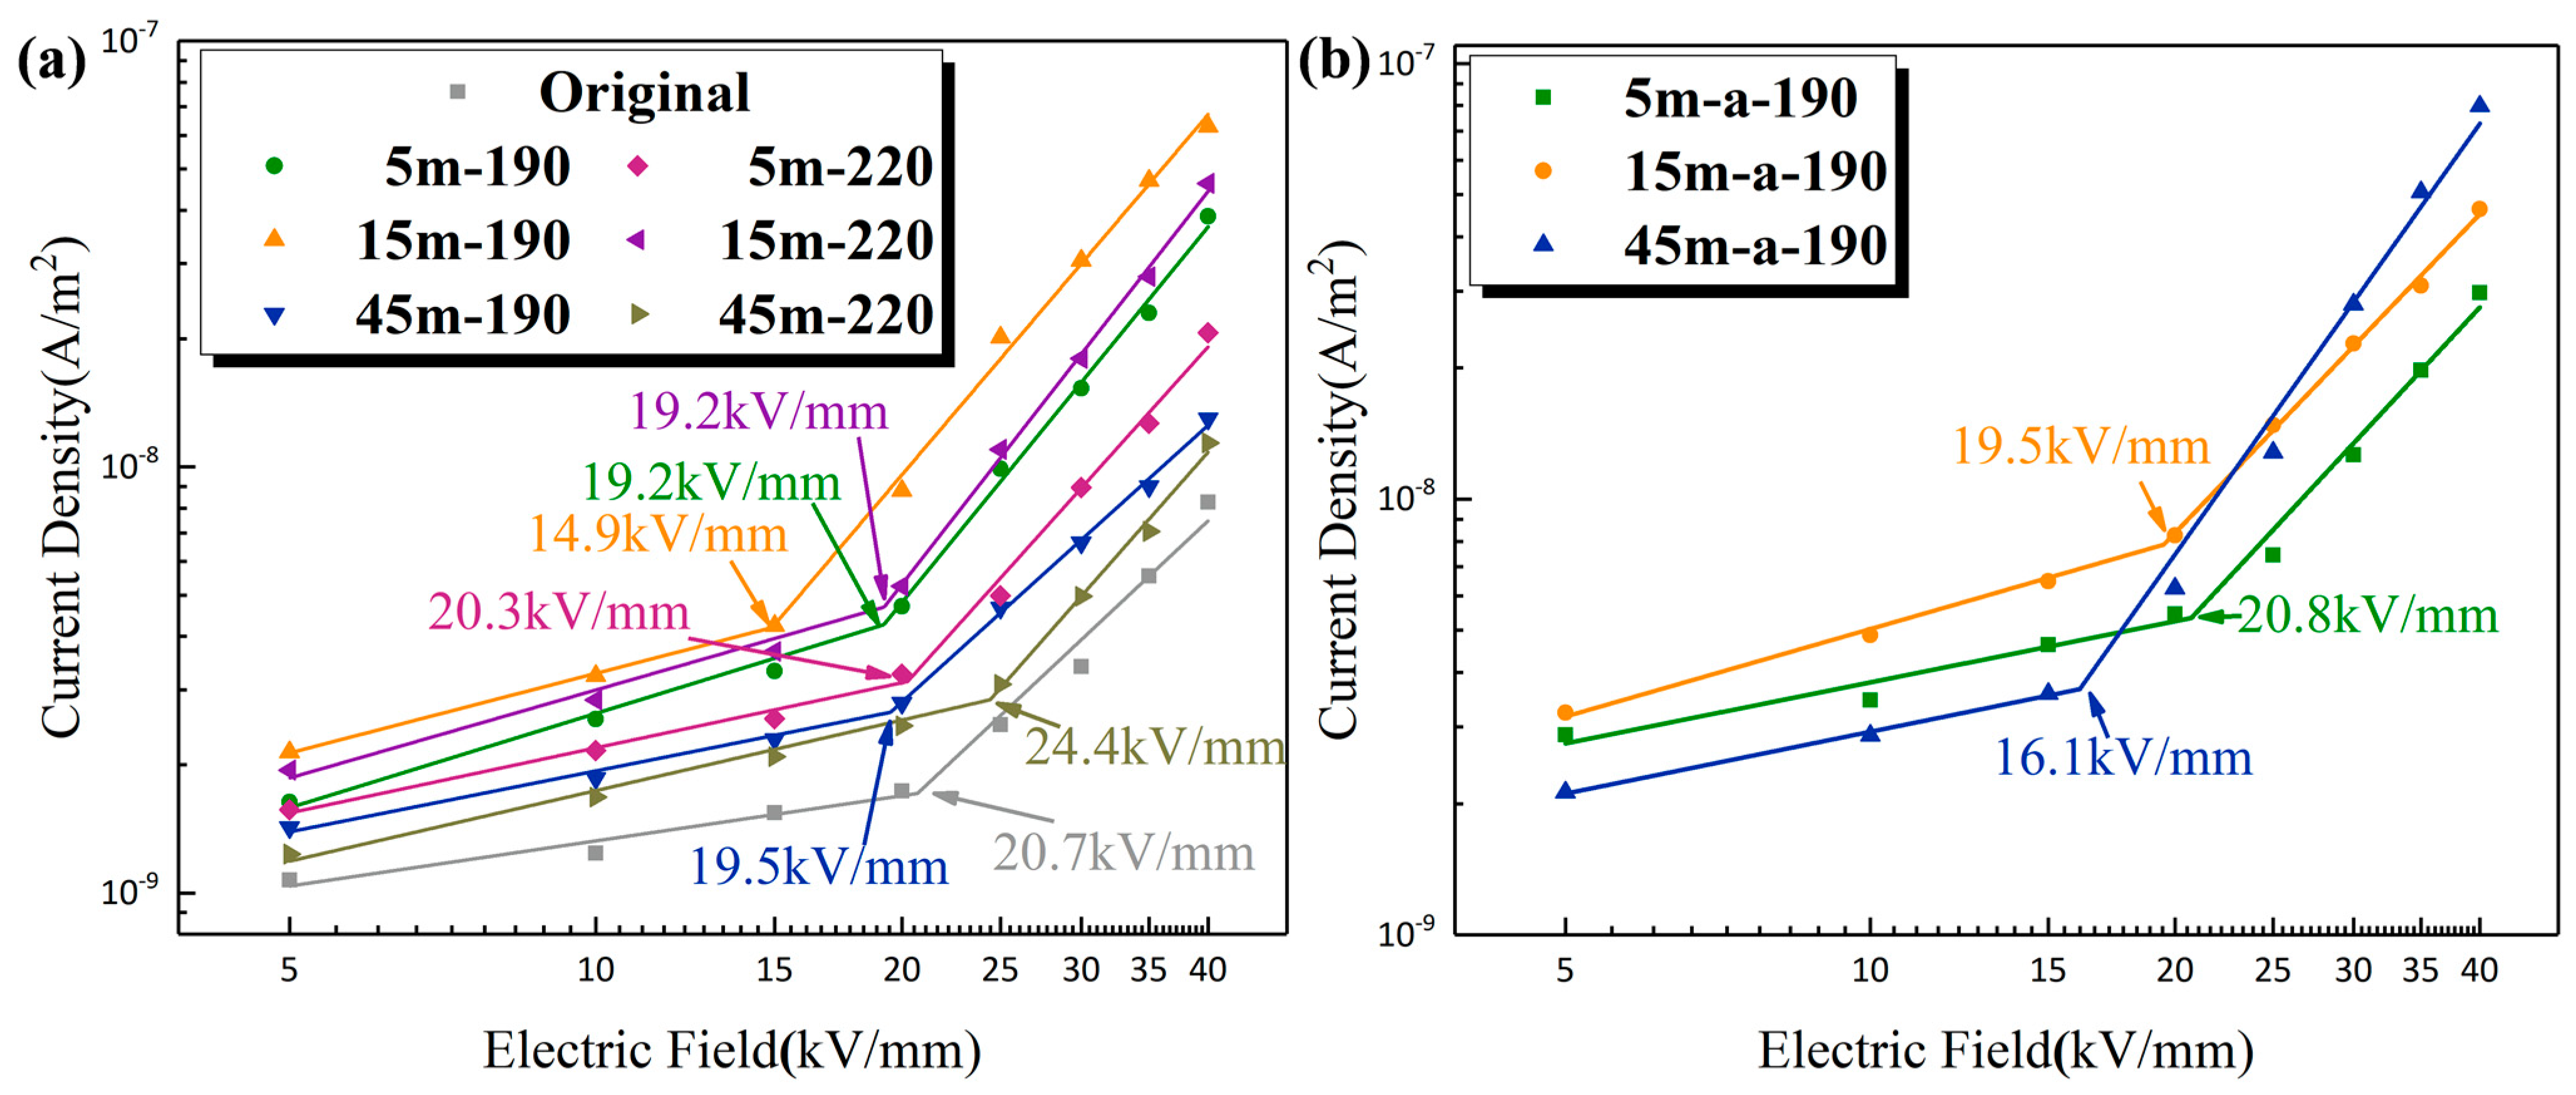
3.9. Conductance Characteristic Test
Figure 9 shows the current density test results of the materials at room temperature. The inflection point of the curve is called the nonlinear threshold electric field strength, and it is shown that the electric conductance in the material changes from ohmic region to space-charge-limited current.
According to the test results, the variation of current density was essentially consistent with the variation trend of the characteristics of space charge accumulation. The unsheared material had a lower current density and a higher nonlinear threshold field strength, reducing the likelihood of space charge accumulation in the material. During the initial stage of shearing, the molecular chains were ordered along the shear field’s direction. The gradual disentanglement of the molecular chains resulted in greater spacing between them, increased carrier mobility, and consequently a higher current density. Under the influence of a specific electric field, shearing for 15 min destroyed the regularity of the material’s molecular chains, reduced crystallinity, expanded the free volume, and increased the number of carrier transport channels, so that the current density continued to increase. Concurrently, the accumulation of space charge decreased the nonlinear threshold field strength. Due to oxidative degradation, the material sheared for 45 min produced a large number of carbonyl groups, and the carbonyl polar groups introduced a large number of deep traps into the material. The carriers were captured by the traps during the migration process, which decreased the carrier concentration and inhibited the carrier migration, resulting in a significant decrease in conduction current. As the accumulation of space charge decreased, the current density curve entered the current-limiting region for space charge when the field strength increased. After increasing the shear temperature, the sample crystallinity improved. Thus, the free volume decreased, the potential barrier for carrier migration increased, thereby impeding carrier migration to some degree, the current density decreased, and the nonlinear threshold field strength shifted to higher fields.
The addition of antioxidants facilitated heterogeneous nucleation in PP sheared for 5 and 15 min. The increase in the number of material grains led to an increase in the number of crystal interfaces, which enhanced the ability to trap charges at the interfaces and inhibited the migration of carriers, resulting in a shift of the nonlinear threshold field strength to higher fields. The addition of antioxidant to the sample sheared for 45 min decreased the threshold field strength compared to that before the addition of antioxidant. This is likely to be because the antioxidant introduced more impurity ions during the long shear time, which resulted in a slight increase in current density and a shift of the nonlinear threshold field strength to a lower field.
3.10. DC Breakdown Strength Test
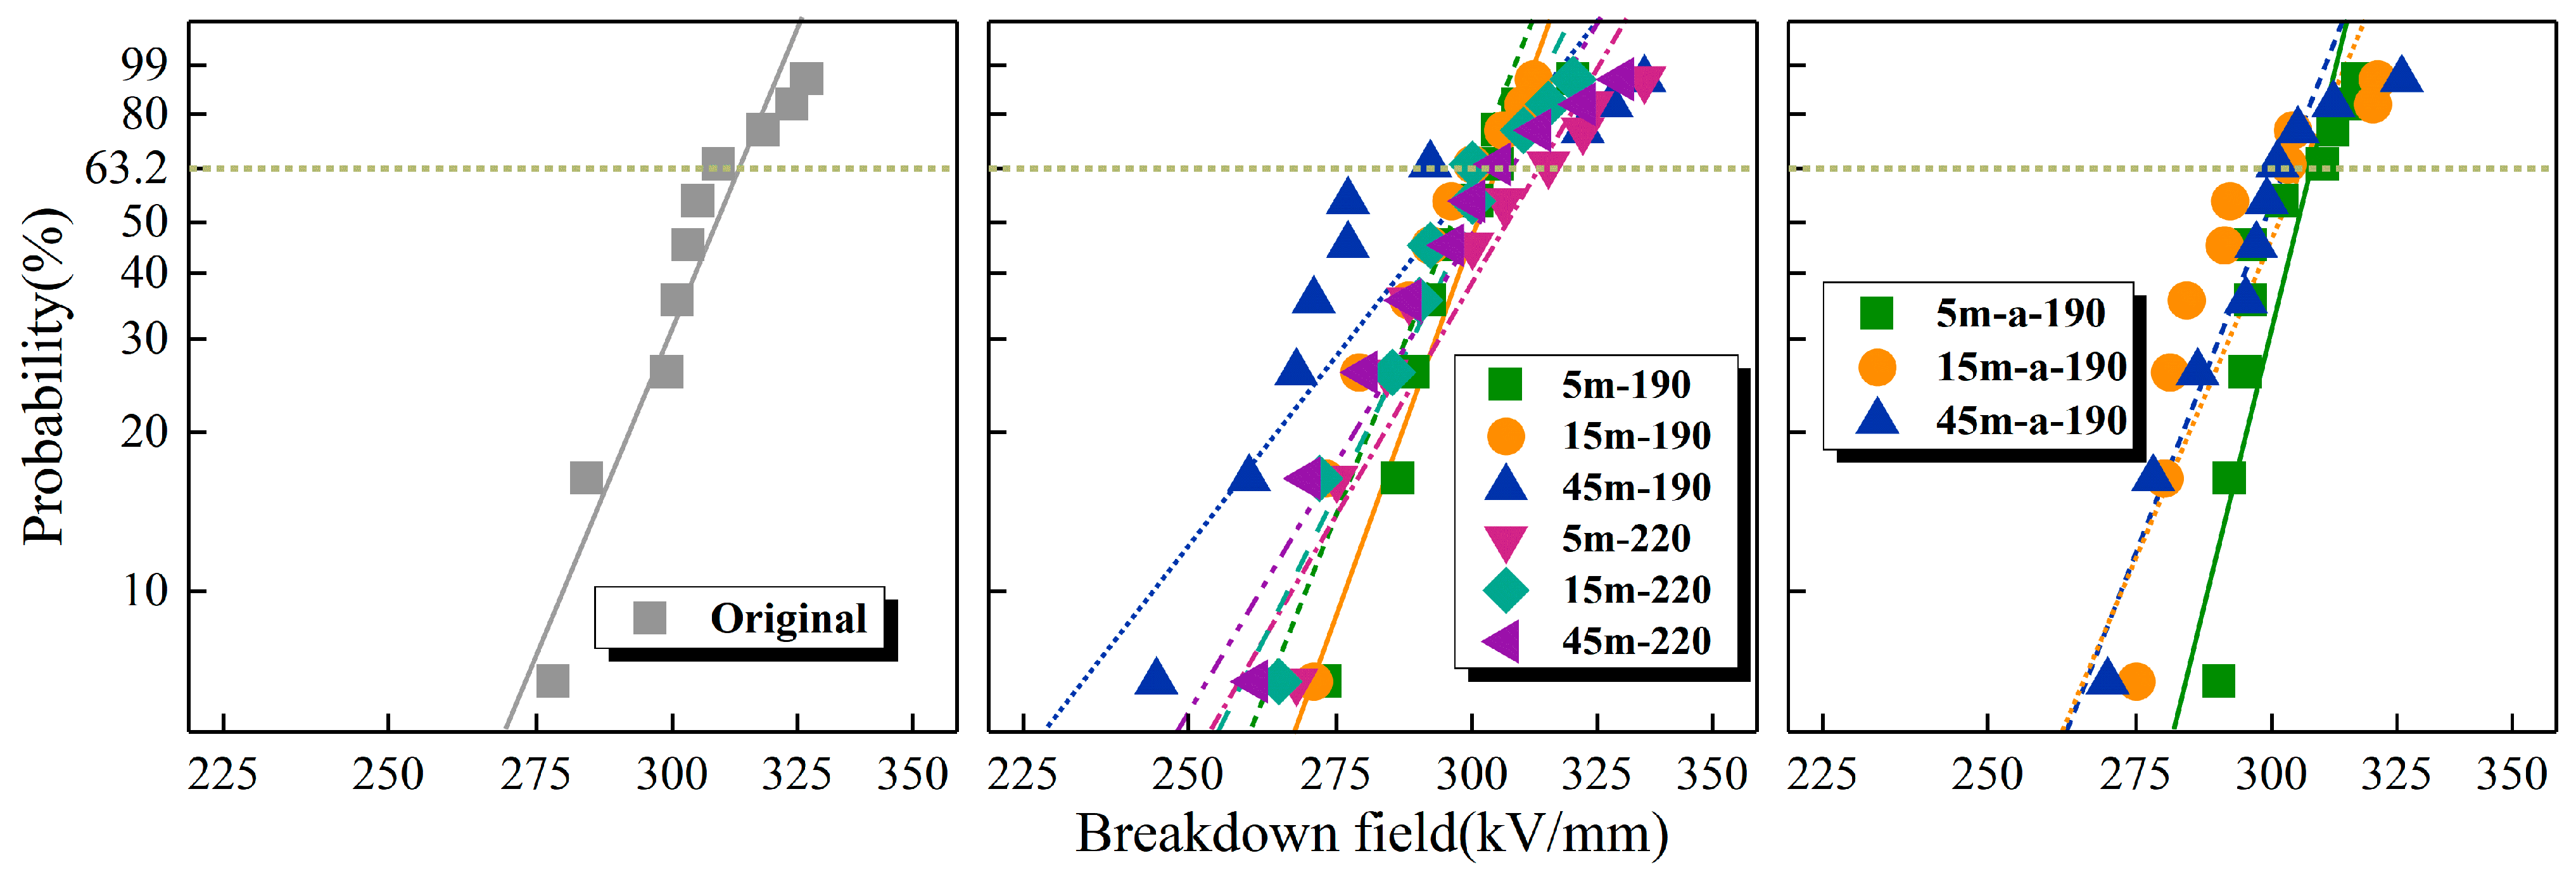
Figure 10 shows the DC breakdown strength Weibull distribution of each sample, respectively.
Table 2 shows the scale parameter (α) and shape parameter (β) of each sample, where the α is the breakdown voltage at 63.2% breakdown probability and the β reflects the degree of dispersion of breakdown voltage.
The DC breakdown strength at various temperatures is depicted in the graph. Sheared PP samples had a lower breakdown strength than original PP, and the breakdown strength initially decreased and then increased as shear time increased. Long-term shearing increased the electrical strength of the material by approximately 2%. With the increase in shear temperature, the breakdown strength of the samples improved to some degree. The internal crystalline structure of PP affected the material’s breakdown strength to some degree. The molecular chains in the crystalline region were regularly arranged, whereas those in the amorphous region were loosely arranged and disordered; consequently, the breakdown strength in the crystalline region was greater than that in the amorphous region. The DSC data showed that when materials were sheared for 5 min, the crystallinity improved slightly compared to original PP, but the breakdown strength decreased. This is likely due to the fact that as the crystallinity of the material improved, the free volume decreased and the kinetic energy obtained by the carriers moving against the molecular chains under the electric field decreased, which has a positive effect on the breakdown strength. For samples sheared for 5 min, the crystallinity was only slightly higher than that of the original PP, and the space charge distribution exhibited clear evidence of charge accumulation. At this time, the negative effect was greater than the positive effect, so the breakdown strength was diminished. At the 15 min shear time, the crystallinity of the samples continued to decrease, while the accumulation of space charge also increased, and both factors acted in concert to further reduce the samples’ breakdown strength. At 45 min of shearing, the crystallinity was still decreasing while the accumulation of space charge tended to decrease, as the positive effect of the decrease of space charge on the breakdown strength was greater than the negative effect of the crystallinity decreases. Consequently, the breakdown strength had strengthened. During the 45 min long shearing, a more severe oxidative degradation took place, and more carbonyl polar groups were introduced; the presence of these groups enhanced the electron scattering effect, which led to an increase in the DC breakdown field strength. In addition, as the shear temperature increased, the crystallinity increased, the accumulation of space charges decreased, and the breakdown strength increased.
With the addition of the antioxidant to the PP material, the samples’ breakdown strength increased significantly. The antioxidant promoted the heterogeneous nucleation of the PP material, and DSC experiments demonstrated that the addition of the antioxidant improves the crystallinity of the material. Furthermore, the antioxidant reduced the degree of oxidative degradation of the samples after long-term shearing and high-temperature shearing, resulting in an increase in the material’s DC breakdown field strength.


