Article

Research on State-of-Health Estimation for Lithium-Ion Batteries Based on the Charging Phase

1
Hubei Key Laboratory of Advanced Technology for Automotive Components, Wuhan University of Technology, Wuhan 430070, China
2
Foshan Xianhu Laboratory of the Advanced Energy Science and Technology Guangdong Laboratory, Foshan 528200, China
3
Hubei Research Center for New Energy & Intelligent Connected Vehicle, Wuhan University of Technology, Wuhan 430070, China
*
Author to whom correspondence should be addressed.
Energies 2023, 16(3), 1420; https://doi.org/10.3390/en16031420
Submission received: 4 January 2023 / Revised: 22 January 2023 / Accepted: 25 January 2023 / Published: 1 February 2023

Abstract

:
The lithium-ion battery state of health (SOH) estimation is an essential parameter to ensure the safety and stability of the life cycle of electric vehicles. Accurate SOH estimation has been an industry puzzle and a hot topic in academia. To solve the problem of low fitting accuracy of lithium-ion battery SOH estimation in a traditional neural network, a nonlinear autoregressive with exogenous input (NARX) neural network is proposed based on the charging stage. Firstly, six health factors related to the lithium-ion battery aging state are acquired at the charging stage because the charging process has better applicability and simplicity than the discharging process in actual operation. Then six health factors are pre-processed using the principal component analysis (PCA) method. The principal component of the input variable is selected as the input of the neural network, which reduces the dimension of input compared with the neural network model without principal component analysis. The correlation between the inputs is eliminated. To verify the rationality of the proposed algorithm, two public aging datasets are used to develop and validate it. Moreover, the proposed PCA-NARX method is compared with the other two neural networks. The simulation results show that the proposed method can achieve accurate SOH estimation for different types of lithium-ion batteries under different conditions. The average mean absolute error (MAE) and root mean square error (RMSE) are 0.68% and 0.94%, respectively. Compared with other neural networks, the prediction error is reduced by more than 50% on average, which demonstrates the effectiveness of the proposed SOH estimation method.

1. Introduction

With the rapid development of new energy technology, electric vehicles have been greatly improved in performance and efficiency. They have been widely recognized and their sales have shown a growing trend. Lithium-ion batteries are widely used in electric vehicles due to their high power-density, low-temperature performance, and long service life. However, owing to the complex and uncertain operating conditions of electric vehicles, the power battery system is working in a complex condition integrating chemical, electrical, and mechanical properties. In order to ensure the safe and reliable operation of the power battery system throughout the life cycle, the battery management system (BMS) is essential for electric vehicles. State estimation is the most critical function of the battery management system. Accurate estimation of lithium-ion battery state of health (SOH) is one of the most critical parameters to ensure electric vehicles’ reliability, safety, and stability. SOH estimation has become a hot and challenging research topic in BMS. However, there are still some problems in SOH estimation, such as low accuracy and poor practical applicability. Therefore, a robust and accurate SOH algorithm is needed to solve these challenges.
The output power and the maximum storage capacity of the lithium-ion battery will decrease with the aging degree of the battery [1]. SOH is an index used to evaluate the degree of the aging of power batteries. Internal reflections of battery aging include capacity decay, increased internal resistance, and power degradation. SOH estimation generally uses the ratio of the battery’s current capacity to the initial capacity, which reflects the current energy storage performance of the battery. It is commonly defined that the battery pack needs to be replaced when the SOH is below 80%.
Recently, SOH estimation methods can be broadly classified into direct measurement methods, model-based methods, and data-driven methods. Direct measurement methods are used to identify the cell capacity or internal resistance offline in the laboratory environment. Kong et al. [2] calculate the maximum releasable capacity by the coulomb counting method to obtain the battery SOH. This approach is simple in principle, but it is an open-loop measurement with poor estimation accuracy. Galeotti et al. [3] evaluated the SOH by the variation of the specific peak impedance spectrum in the experiment, which required the help of an electrochemical workstation to excite the battery device. The equivalent circuit model adaptively identifies the model parameters and completes the SOH calibration. Generally, two or more filters or observers are used to simultaneously estimate model parameters and state of charge (SOC). Direct measurement methods commonly use impedance measurement, ohm internal resistance method, and coulomb counting method. The coulomb counting method, under the condition of laboratory or another stable release maximum available, has capacity to evaluate [4]. The impedance analysis method is obtained by different frequencies of alternating current excitation batteries through electrochemical impedance spectroscopy (EIS). As explained in literature [5], the EIS of power battery is closely related to the aging state; the SOH can be obtained by obtaining the characteristic parameters of battery EIS, which depends on the complex test equipment. It is difficult to apply to actual battery modules, so relevant scholars have proposed methods based on measured voltage, which use small changes in the incremental capacity (IC) curve and the differential voltage (DV) curve to evaluate the aging mechanism of the battery through corresponding mathematical changes (differential). The changes in the shape, height, and position of the IC peaks in the IC curve reflect the battery’s aging. Similarly, the DV peak of the DV curve provides the corresponding aging information. Berecibar et al. [6] estimated the SOH by the change of each peak interval of the DV curve during the cycle, and Weng et al. [7] used the peak height of the IC curve to monitor the battery health. Li et al. [8] used a Gaussian filter to estimate SOH according to the linear regression relationship between the peak position of the IC curve and the battery capacity. Zhang et al. [9] combined ICA analysis with support vector regression (SVR) to construct an SOH estimation model. In addition, related scholars have used some additional devices to detect battery health status, similar to the IC/DV based analysis. Differential thermal voltammetry (DTV) analysis [10] combines IC analysis with high-precision temperature measurement. Cannarella et al. [11] used the thermodynamic information of measurement to get related aging information. The mechanical stress generated by the expansion of electrode material is considered the growth of solid electrolyte interface (SEI) film, and the SOH is estimated by establishing the differentiation of a cell strain and charge.
Based on the study of decay principles and internal structural properties, model-based methods use mathematical models or cell decay mechanism models to model cell decay properties and combine filtering techniques to predict SOH. The electrochemical degradation mechanism model requires an analysis of the electrochemical properties inside the cell, such as the electrolyte concentration and the lithium-ion diffusion rate, which is more detailed for the internal mechanisms of the cell. However, the number of parameters is too large to build a series of partial differential equations describing the internal reaction mechanism, and the calculations are highly complicated. Liu et al. [12] proposed a pseudo-two-dimensional (P2D) model for joint estimation of the SOC and SOH by predicting the average lithium concentration under charge and discharge cut-off voltage to achieve SOH estimation. Bhangu et al. [13] built an EKF algorithm with capacity as the state parameter to estimate the battery capacity in real-time to calculate SOH. Since the battery capacity is easily affected by environmental temperature and charging and discharging current, the accuracy of this method could be better. Empirical degradation models have great adaptability in the trade-off between accuracy and complexity. However, their applicability is limited to different types of battery degradation characteristics and operating conditions, and it is difficult to predict capacity regeneration phenomena during cell aging accurately. Han et al. [14] found that the Arrhenius dynamic equation is used to model the capacity aging.
The direct measurement method needs to take into account the internal chemical mechanisms of the battery, while the model-based method is difficult to describe the dynamical properties of the battery due to its uncertainty. With the development of big data and cloud platform computing, data-driven machine learning algorithms have gradually gained popularity in the field of SOH estimation. The data-driven approach has been used in different fields such as 3D printing [15,16] and focuses on extracting relationships between inputs and outputs data. It does not use any transparent mathematical model or extract the aging characteristics from the degradation process. Machine learning algorithms selection is the key to influence the method accuracy and applicability, related applications more method as a neural network [17,18], support vector machine (SVM) [19,20], extreme learning machine (ELM) [21,22], and gaussian process regression (GPR) [23,24]. Feature extraction is a key step, and accurate input data can achieve more accurate prediction and less computational burden. Yang et al. [25], based on battery model parameters (polarization capacitance) as input to train support vector machine algorithm, also need to use an electrical model based on online estimation to simulate battery characteristics. For batteries operating under time-varying operating conditions, the LSTM [26,27] can effectively predict battery degradation capacity. Chaoui et al. [28] adopted the input delay neural network (ITDNN) method for training. For feature extraction, Lin et al. [29] proposed a method to estimate battery SOH using random forest regression for constant current charging time (CCCT) as the characteristic value. This method has better accuracy and less input data than the method based on incremental capacity analysis. Several papers [30,31] used partial charge curve to estimate SOH, which has the advantages of high accuracy and robustness. Cui et al. [32] used a nonlinear autoregressive with exogenous input (NARX) to estimate SOH through feature extraction in charge and discharge stage, but health factor extraction in constant discharge stage was obviously inconsistent with the actual working condition.
The health status of lithium-ion batteries is a time series of continuous degradation. The corresponding scholars [33,34] adopt data-driven methods based on the traditional neuron network with only spatial clustering function, which cannot effectively simulate the cumulative effect of the health status formed with the time series. Therefore, when these neuron functions simulate complex nonlinear models (time series of lithium-ion battery state of health), the fitting effect still needs to be improved. Considering the need to choose a model with simple structure and reasonable prediction accuracy, NARX is a good choice. Meanwhile, considering that the complex variability of the discharge process in the actual operating condition is different from the simple constant current discharge in the laboratory, the estimation of the battery SOH in the constant current discharge stage is obviously not in line with the actual operating conditions of the electric vehicles. In the actual operation, charging process is more applicable, and the information in the charging stage of the dataset can be analyzed to obtain the relevant health characteristics, which can be mapped to the battery health state. Therefore, this paper proposes a NARX neural network for accurate and robust SOH estimation based on the charging stage; the main contributions are as follows:
(1)
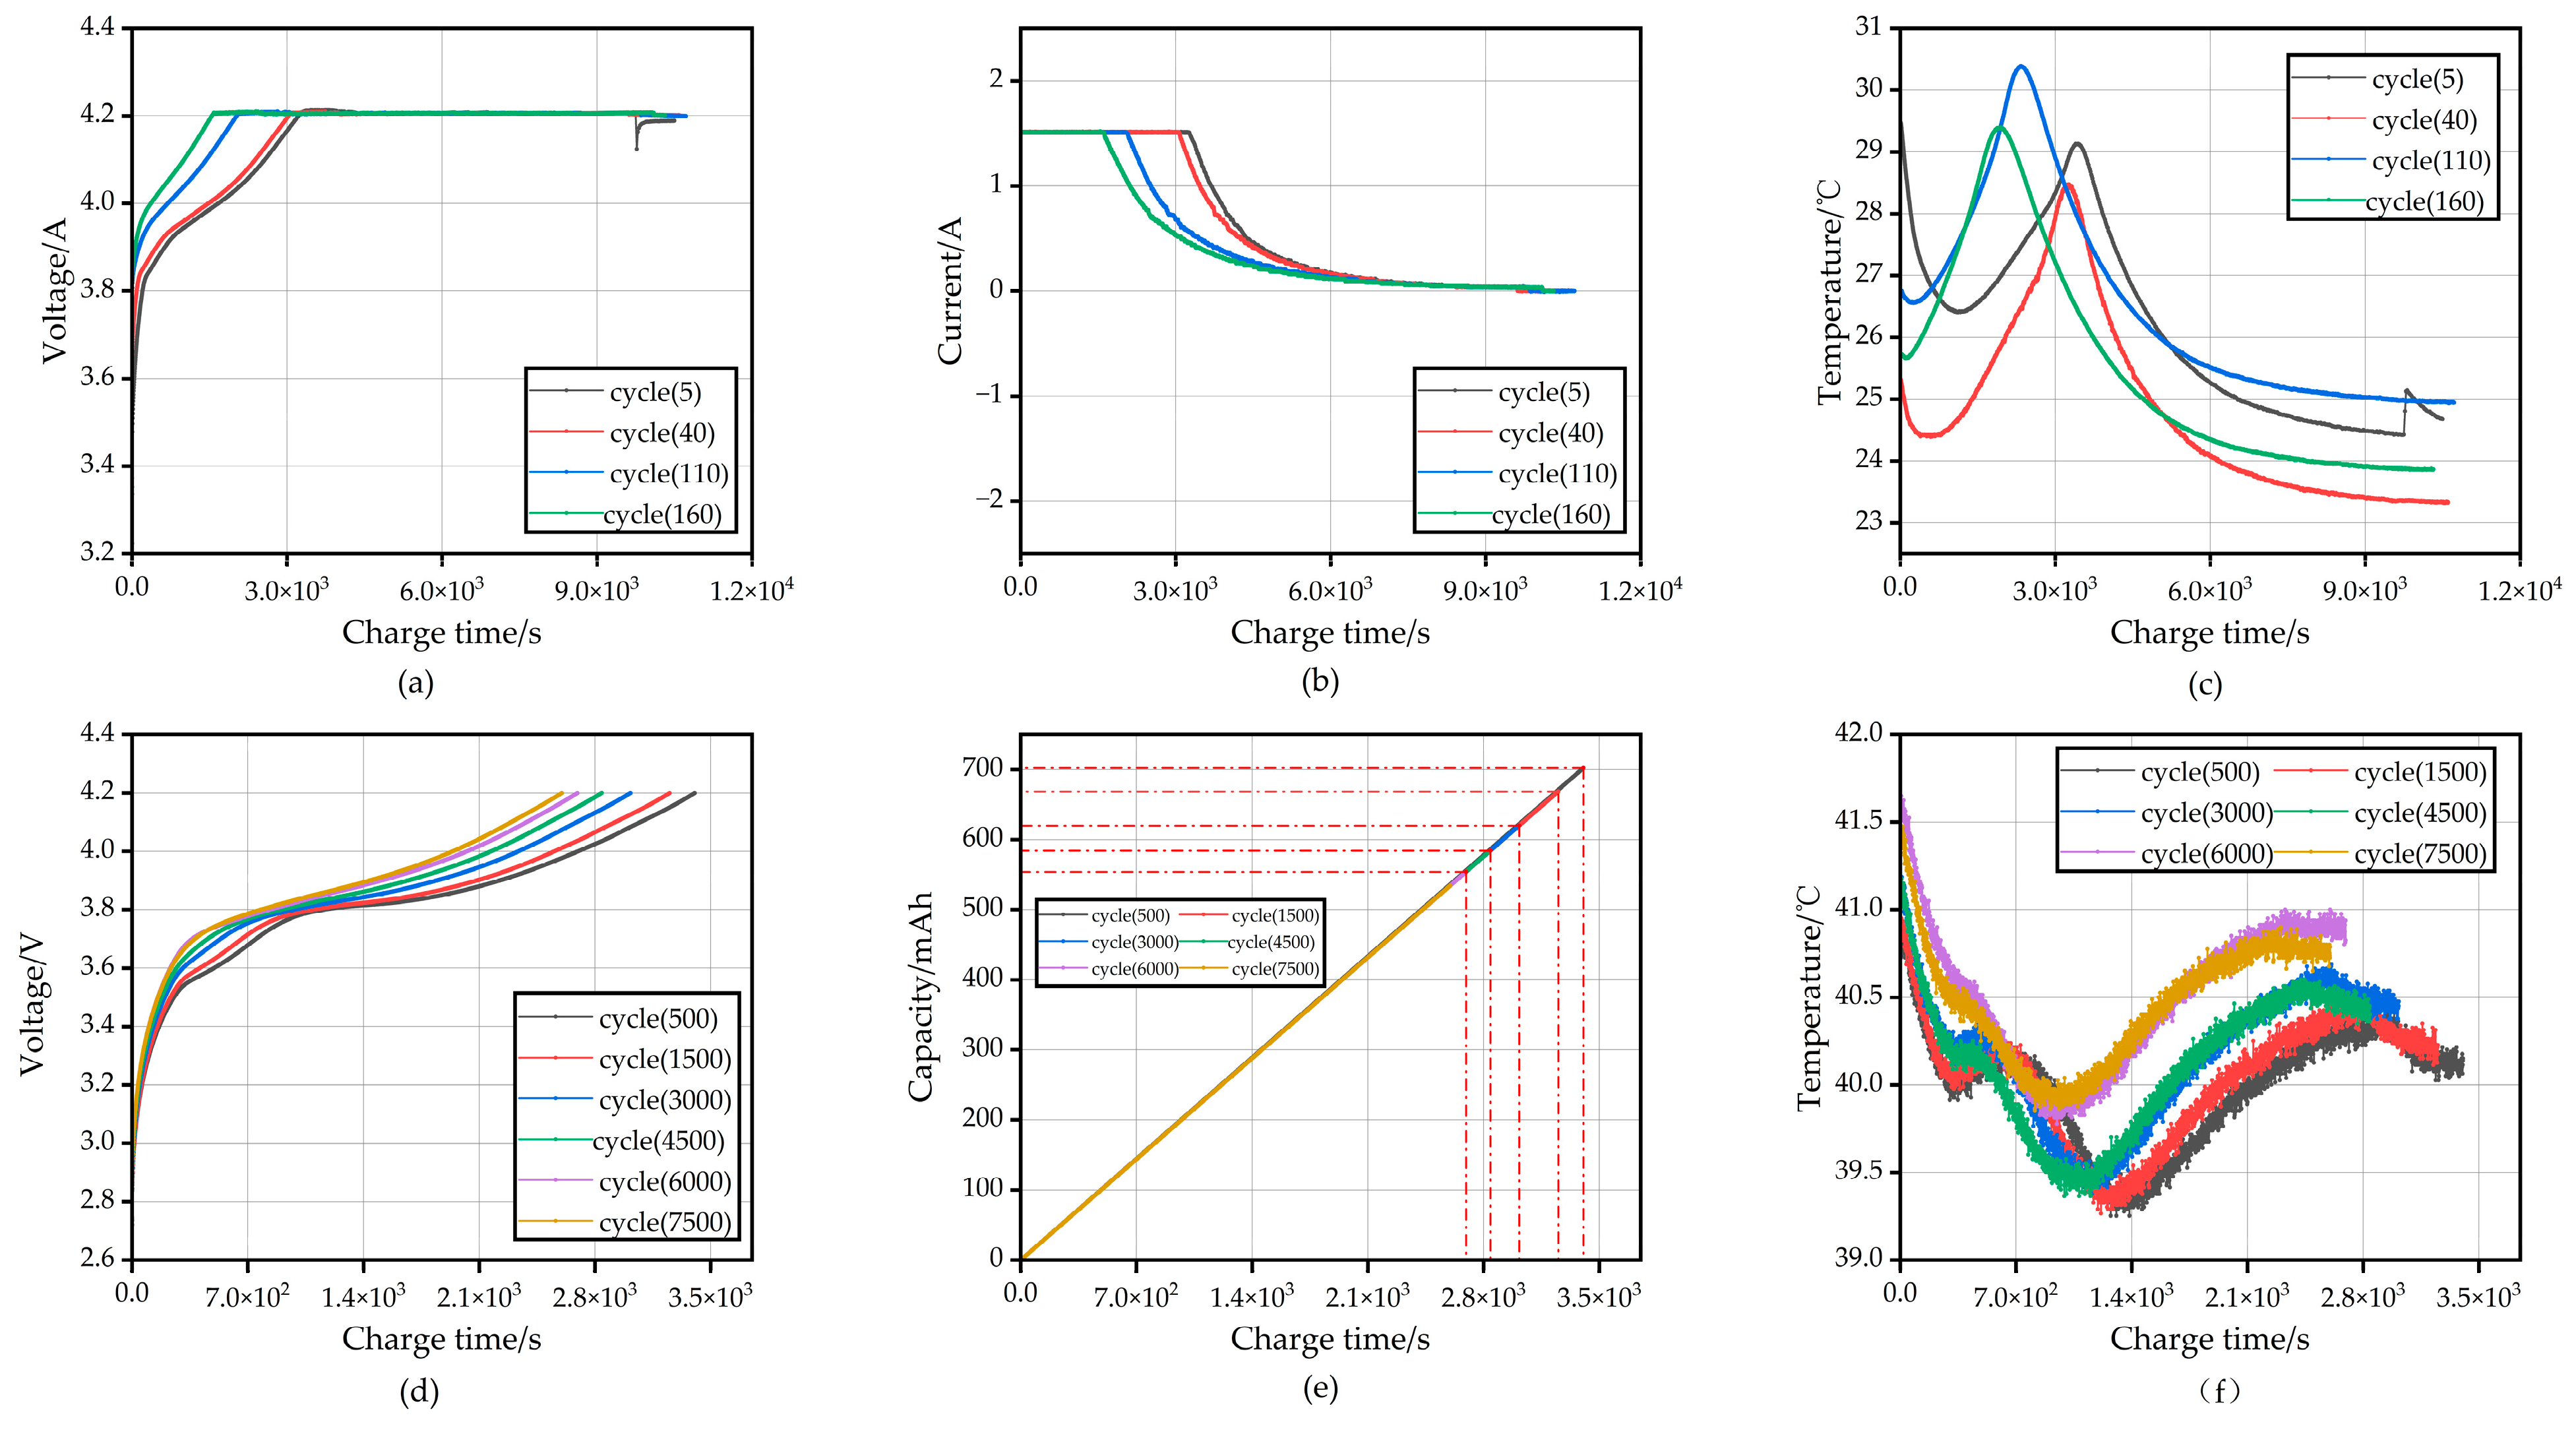
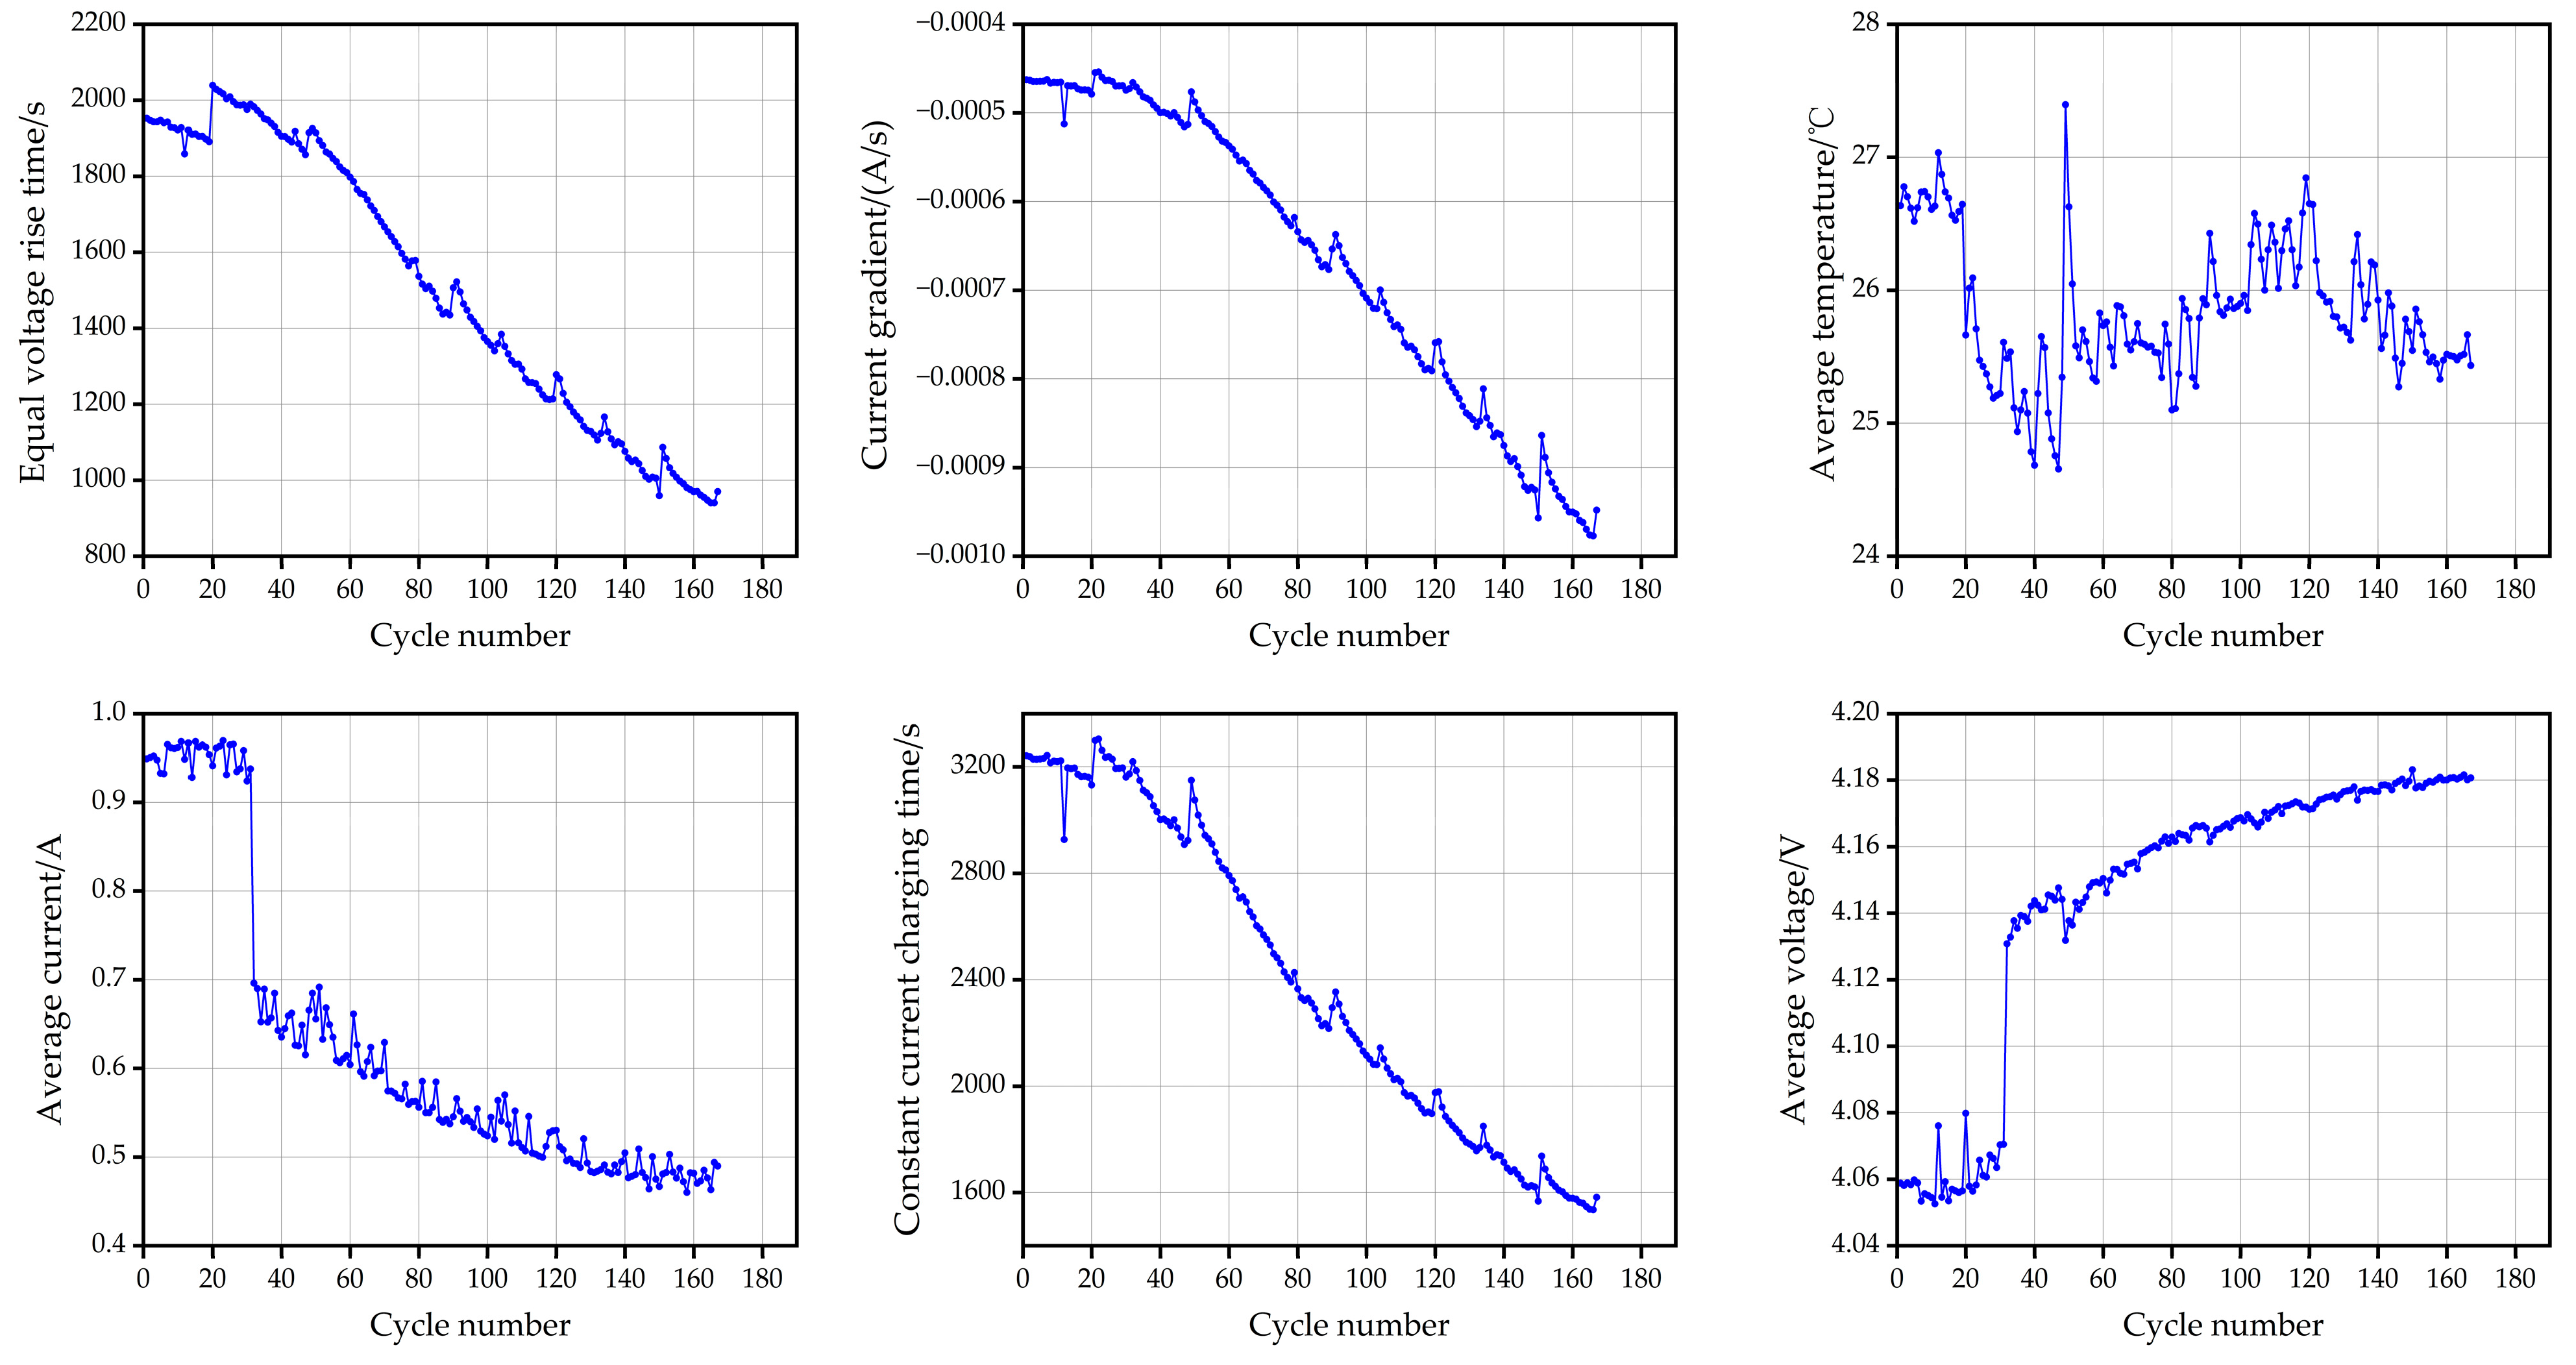
Considering that the charging stage is more applicable for the actual application of electric vehicles, six health factors related to the health status of lithium-ion batteries are extracted from the charging stage, the current, voltage, and temperature signals are extracted from the charging stage to fully describe battery aging characteristics.
(2)
PCA is used for dimensionality reduction which can eliminate the error influence of irrelevant variables on the model and the multiple correlations between health indicators (HIs) and reduced training time.
(3)
Considering the time characteristics of lithium-ion battery health state, a NARX model with simple structure, small amount of calculation, and reasonable prediction accuracy is proposed, which improves the generalization ability and simulation ability of the network.
The remainder of this paper is arranged as follows: Section 2 introduces how to extract six health factors from the charging phase of two public datasets, and how to extract the HIs using the principal component feature extraction method. Section 3 explains the NARX neural network. Section 4 discusses the results. Section 5 gives the conclusion.

2. Lithium Battery Dataset Analysis and Health Factor Extraction

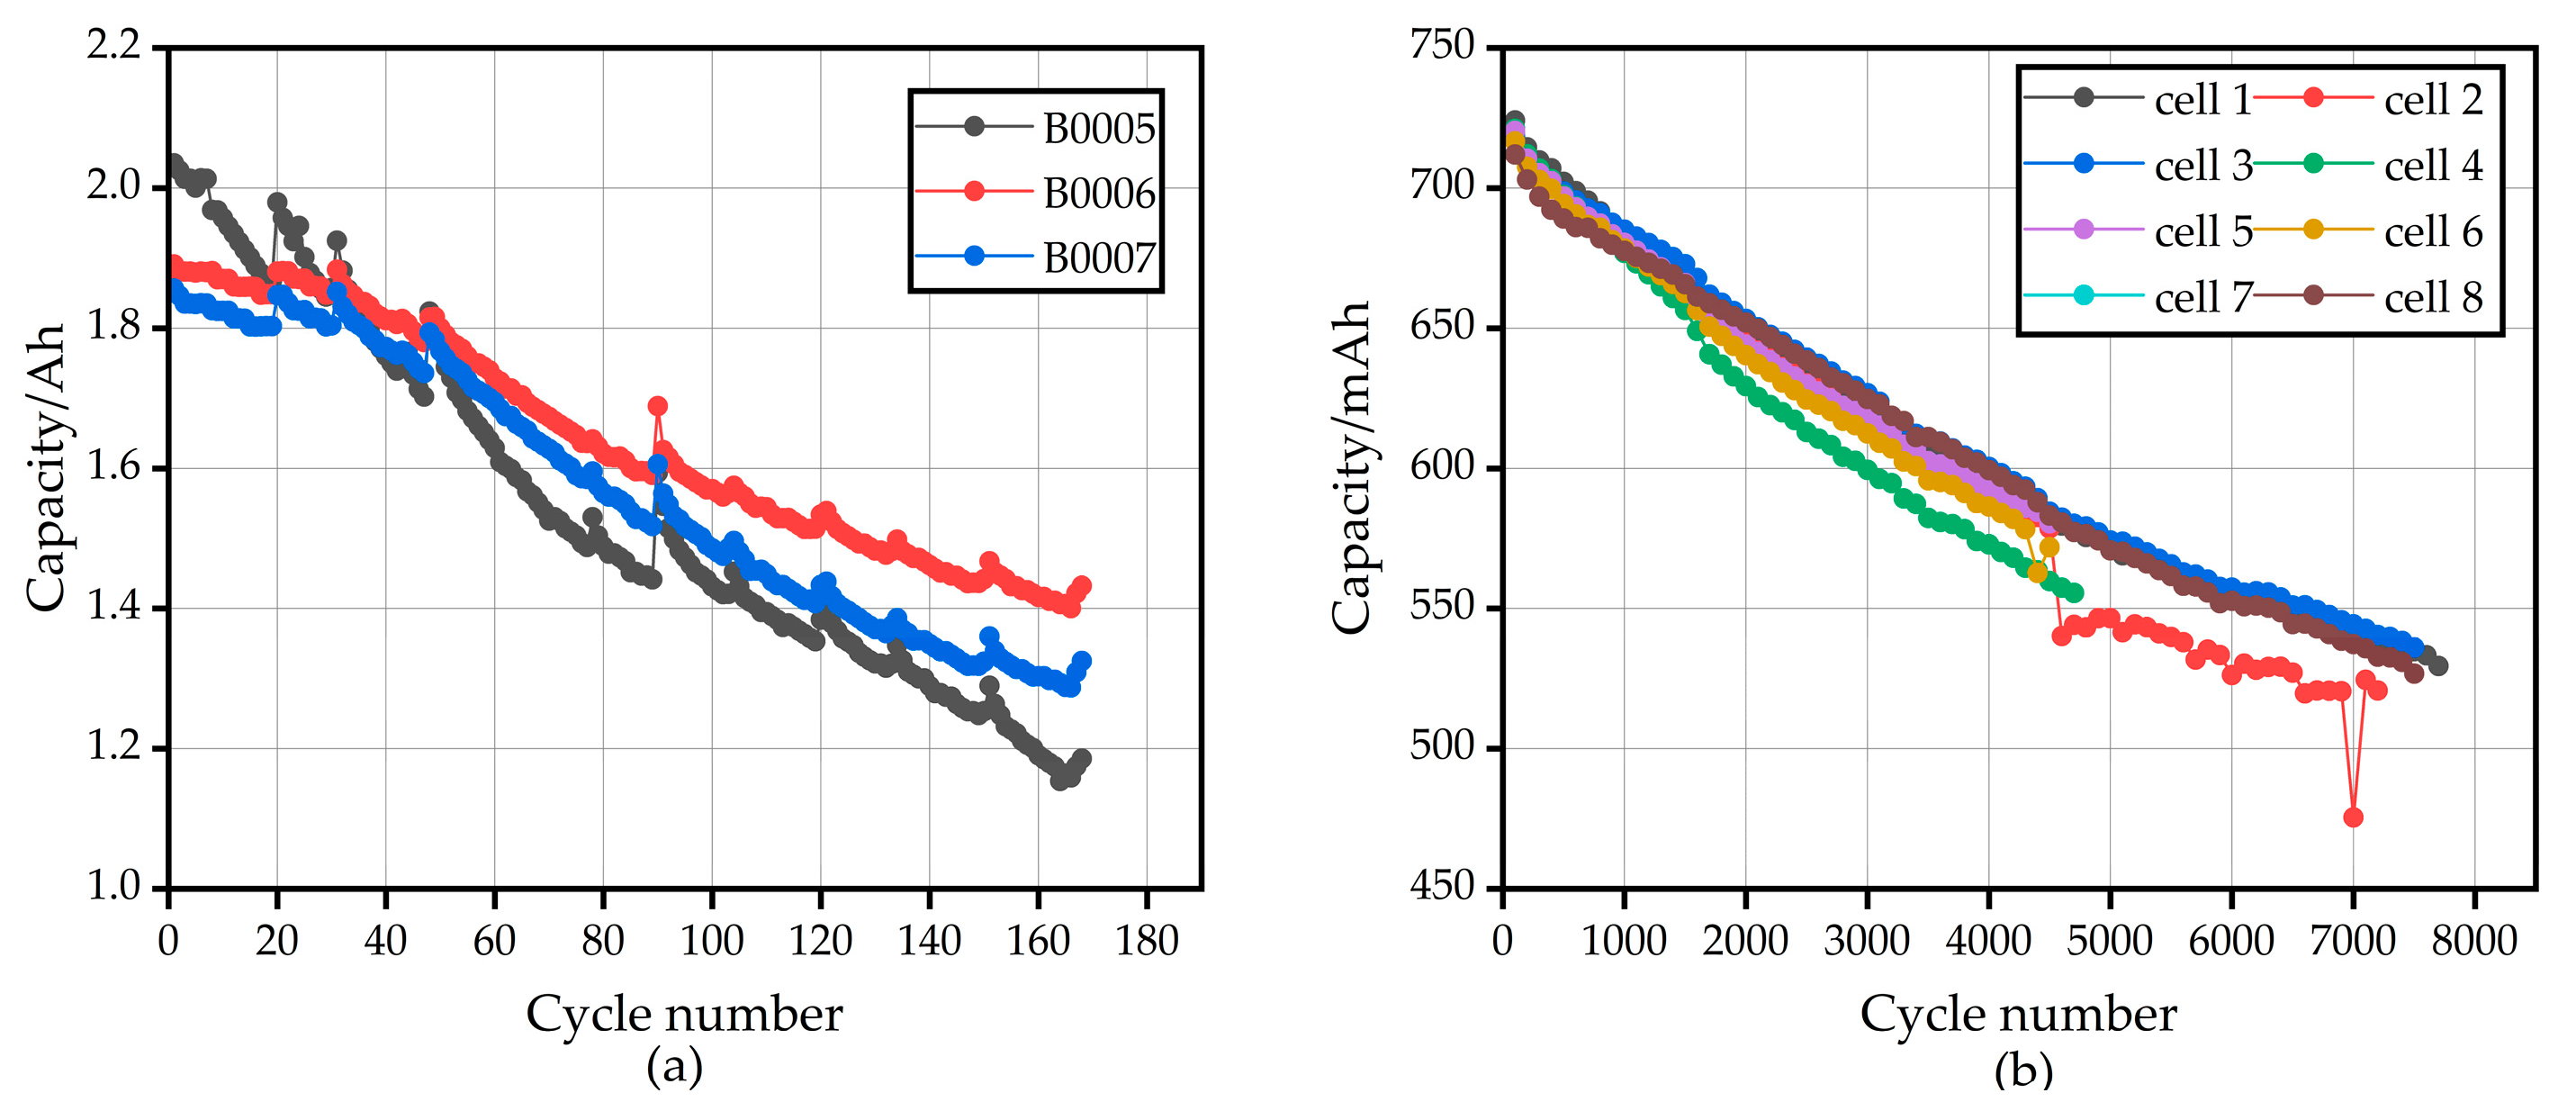
2.1. Acquisition of Lithium Battery Dataset

Two public datasets published by NASA PCoE and the University of Oxford, respectively, have been used to analyze aging properties and develop SOH estimation models for lithium-ion batteries. The 18650 cylindrical cells used in the NASA dataset are rated at 2 Ah and charged, discharged, and impedance tested at room temperature. The charging process uses a constant current of 1.5 A to 4.2 V, followed by a constant voltage of 4.2 V to continue charging until the charging current is less than 0.2 A. The discharge process uses 2 A for constant discharge so that the lithium-ion battery repeatedly accelerated aging until the battery reaches 30% of the initial capacity (EOL). The Oxford Battery degradation dataset uses 8 lithium-cobaltite bagged batteries with a rated capacity of 0.74 Ah. The batteries are repeatedly aged through constant current and constant voltage charging and discharge process in urban driving conditions of ARTEMIS at a constant ambient temperature of 40 °C. The two datasets include voltage, current, and temperature information during the charging and discharging process. As shown in Figure 1, the aging curves are inconsistent under the same aging test conditions for the batteries in the two datasets due to subtle differences in the internal materials and structures.

2.2. Selection of Health Factors

Health factors typically refer to characteristic quantities that can indirectly reflect the deteriorated state of the battery. It can be extracted from voltage, current, and temperature data. Processing historical data and selecting health factors is critical for developing battery SOH algorithm. During the actual operation, the lithium-ion battery cycle is particularly long, and the discharge state is complicated and variable. Therefore, this paper aims to estimate the SOH of a lithium-ion battery during a relatively stable charging process. The SOH estimation algorithm presented in this paper is validated using the NASA dataset (e.g., B0006) and the Oxford dataset (e.g., Cells 1). The voltage, current, and temperature curves of these two datasets are presented in Figure 2.
It is evident from Figure 2a,d that there is a clear difference in the moment when the voltage of different cycles reaches its peak (4.2 V) during the constant current charging phase. The higher the aging degree, the shorter the time required, which directly reflects the reduction of the available capacity of the battery at this time. As shown in Figure 2b, in the constant voltage charging process of B0006 battery, the initial current drops rapidly, and the gradient of the charging current drops sharply at this time, and then the gradient of the charging current drops slowly. With the increase of the cycle times, the gradient of the charging current drops more rapidly. It should be noted that the Oxford aging dataset battery only records the constant current charging phase. Therefore, we only extracted the CC charging stage for the Oxford dataset. As can be seen from Figure 2c,f, during the whole charging process, the peak temperature of the battery does not have an obvious rule but the average temperature increases with the increase of charging and discharging times, which also corresponds to the internal mechanism that the aging degree of the battery increases, its internal resistance increases, and the heating becomes more obvious. It can also be seen that the time when the battery reaches the peak temperature becomes earlier with the increased number of cycles. From the above analysis, six indicators can be selected as battery health factors: equal voltage rise time, constant current charging time, average charging current, peak temperature, current drop gradient at constant voltage stage, and average charging voltage. Considering the actual operating conditions, the charging time from 3.8 V to 4.1 V is selected as the constant voltage rise time. The average charging current and current drop gradient at the constant voltage stage are only extracted for the NASA dataset. Figure 3 shows the relationship between health factors and cycles after normalization of NASA dataset.

2.3. Feature Extraction of Health Indicators

PCA is a commonly used data analysis method to transform original data into linearly independent data by orthogonal transformation. The correlation between data can be reduced, and the principal feature quantity of data can be extracted to reduce the dimension of high-dimensional data to reduce the amount of computation while reducing the loss of information as much as possible. The algorithm steps of PCA are as follows [32]:
Before PCA, the original data needs to be normalized. In order to reduce the error caused by large data differences caused by dimensional differences of each dimension data, the original data are standardized. Suppose there are x 1 , x 2 , …, x k representing the properties of each object. In this paper, we refer to the time series data of HIs. If there are N objects, it can be represented as:
X N × k = x 11 x 1 k x N 1 x N k
The central standardization formula is as follows:
S j = 1 N 1 i = 1 N x i j x j ¯ 2 i = 1 , 2 , , k ;   j = 1 , 2 , , N
where S j and x j ¯ are the variance and mean of x j , respectively. Next,
X i j , = x i j x j ¯ S j
where X i j , is the normalized matrix data.
To establish correlation matrix R (covariance matrix);
R = X , T X , N 1
where X , is the normalized matrix and X , T is its transpose matrix. Then calculate the eigenvalues λ 1 ,   λ 2 , …, λ k (from small to large) and the corresponding eigenvectors p 1 , p 2 , …, p k   .
As can be seen from Table 1, the number of principal components is determined by calculating the variance contribution μ i and cumulative variance contribution σ Σ p . Usually, several principal components with cumulative contribution rate greater than 75% to 95% are selected as new input variables. As can be seen from Table 1, the cumulative contribution of the first two, three, and four principal components are 91%, 98.9%, and 99.9%, respectively. Therefore, the first three principal components are selected as new HIs to predict SOH.
μ i = λ i i k λ i σ Σ p = i p μ i

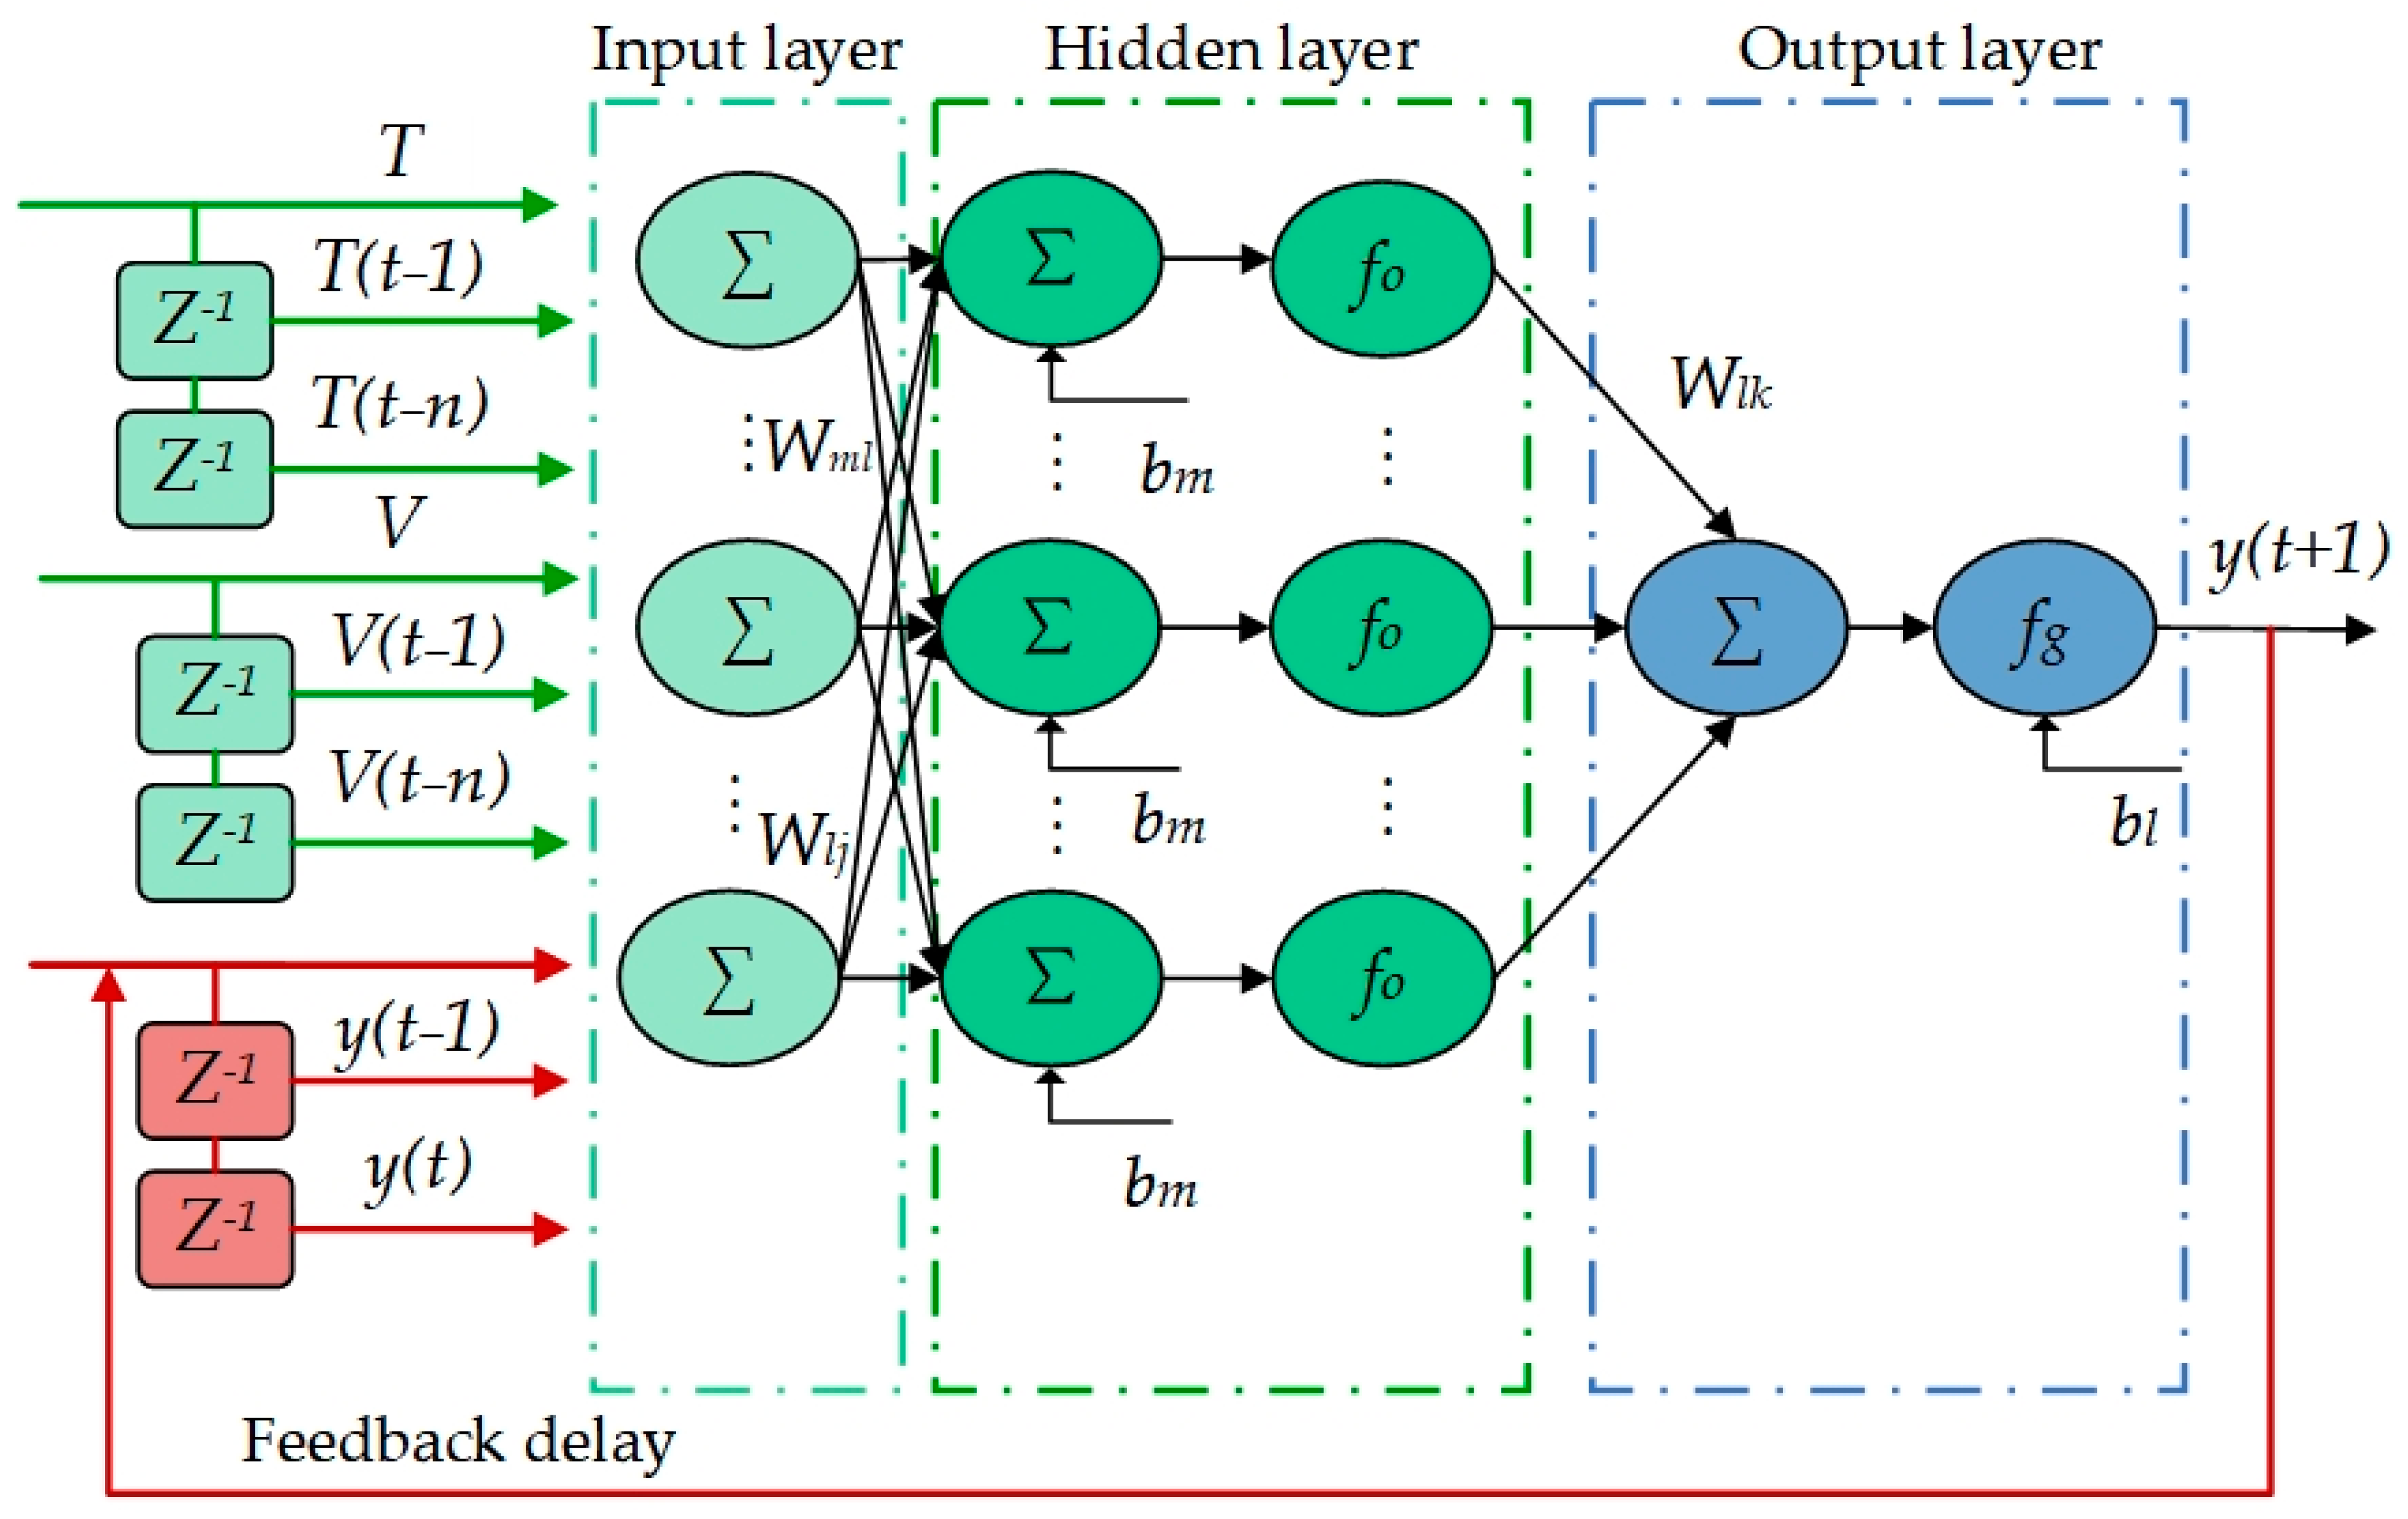
3. Nonlinear Autoregressive with Exogenous Input Neural Network

The NARX neural network consists of an input layer, a hidden layer, an output layer, and an input-output delay part. Hence, it has better performance for time series data. Compared with feedforward neural networks, NARX neural network introduces a delay and feedback mechanism, which can achieve better performance than total regression neural network. The weights of NARX layers are adjusted adaptively through RTRL (Real-time-recurrent-learning), which can better solve the problems of slow convergence and recurrent local extreme value in traditional neural networks. In general, the NARX neural network model can be expressed as:
y t + 1 = f o b m + w m l f g b l + w l k x k + w l j y n j
where f o · and f g · represent the activation functions of the output layer and the hidden layer respectively; w l k ,   w l j ,   w l j and b l ,   b m represent the weight and bias between the corresponding layers; i and j represent the input and output delay elements.
As shown in Figure 4 the estimated output value depends on the prior output values and the input value. NARX neural network is composed of static neurons and the output feedback of the network to form a dynamic neural network. The network retains the data at the previous moment, which is not only dynamic but also makes the information more complete.

4. Results and Discussion

Mean absolute error (MAE) and root mean square error (RMSE) are used to evaluate the estimation results. The formulas are as follows:
M A E X , h = 1 k i = 1 k h x i y i   i = 1 , 2 , , k
R M S E X , h = 1 k i = 1 k h x i y i 2   i = 1 , 2 , , k

4.1. Analysis of the Influence of PCA

In this section, the influence of PCA is analyzed first. The PCA-NARX and a simple NARX neural network are compared. For NASA dataset, B0005 is used to train the neural network and then B0006 and B0007 are used to test the trained model. Figure 5 shows the SOH prediction results of B0006 and B0007 using the PCA-NARX and NARX neural networks, respectively. The input of the PCA-NARX neural network are the first three principal components of Table 1, while the NARX neural network uses the original sequence of six health factors without PCA, and the output of both are battery SOH. In addition, Figure 6 shows the SOH prediction results of Cell 2 and 3 using the PCA-NARX and NARX neural networks. The MAE and RMSE are summarized in Table 2.
As shown in Figure 5 and Figure 6, it can be intuitively seen that the overall estimation performance of the PCA-NARX model is better than that of the NARX model, especially at the beginning of degradation. Figure 5 and Figure 6 show that the overall error of PCA is smaller than the error before PCA. Apart from some anomalous fluctuations, the relative error between the SOH estimation and the true value is less than 2%, and the overall trend is consistent with the actual trajectory. The maximum errors occur in the battery capacity regeneration stage and the initial stage. Similarly, it can be seen from Figure 7 that because there is not capacity regeneration phenomena in Cell 2 and Cell 3 during the aging cycle, the estimation errors of both cells are less than B0006 and B0007, and the relative errors are less than 3%. To be specific, the mean MAE and RMSE values of PCA-NARX method are less than 0.8 %, while the mean MAE and RMSE values of the NARX method exceed 2%. The mean MAE of the PCA-NARX model is 65.65% lower than that of the NARX model. The mean RMSE of the PCA-NARX model is 61.83% lower than that of the NARX model. As can be seen from Table 3, after PCA, the number of iterations and operation time of NARX model decreased by 36.9% and 42.2%, respectively. The principal component method can effectively remove irrelevant information and error variables, making predicted value of SOH closer to the actual value, and improving the estimation performance.

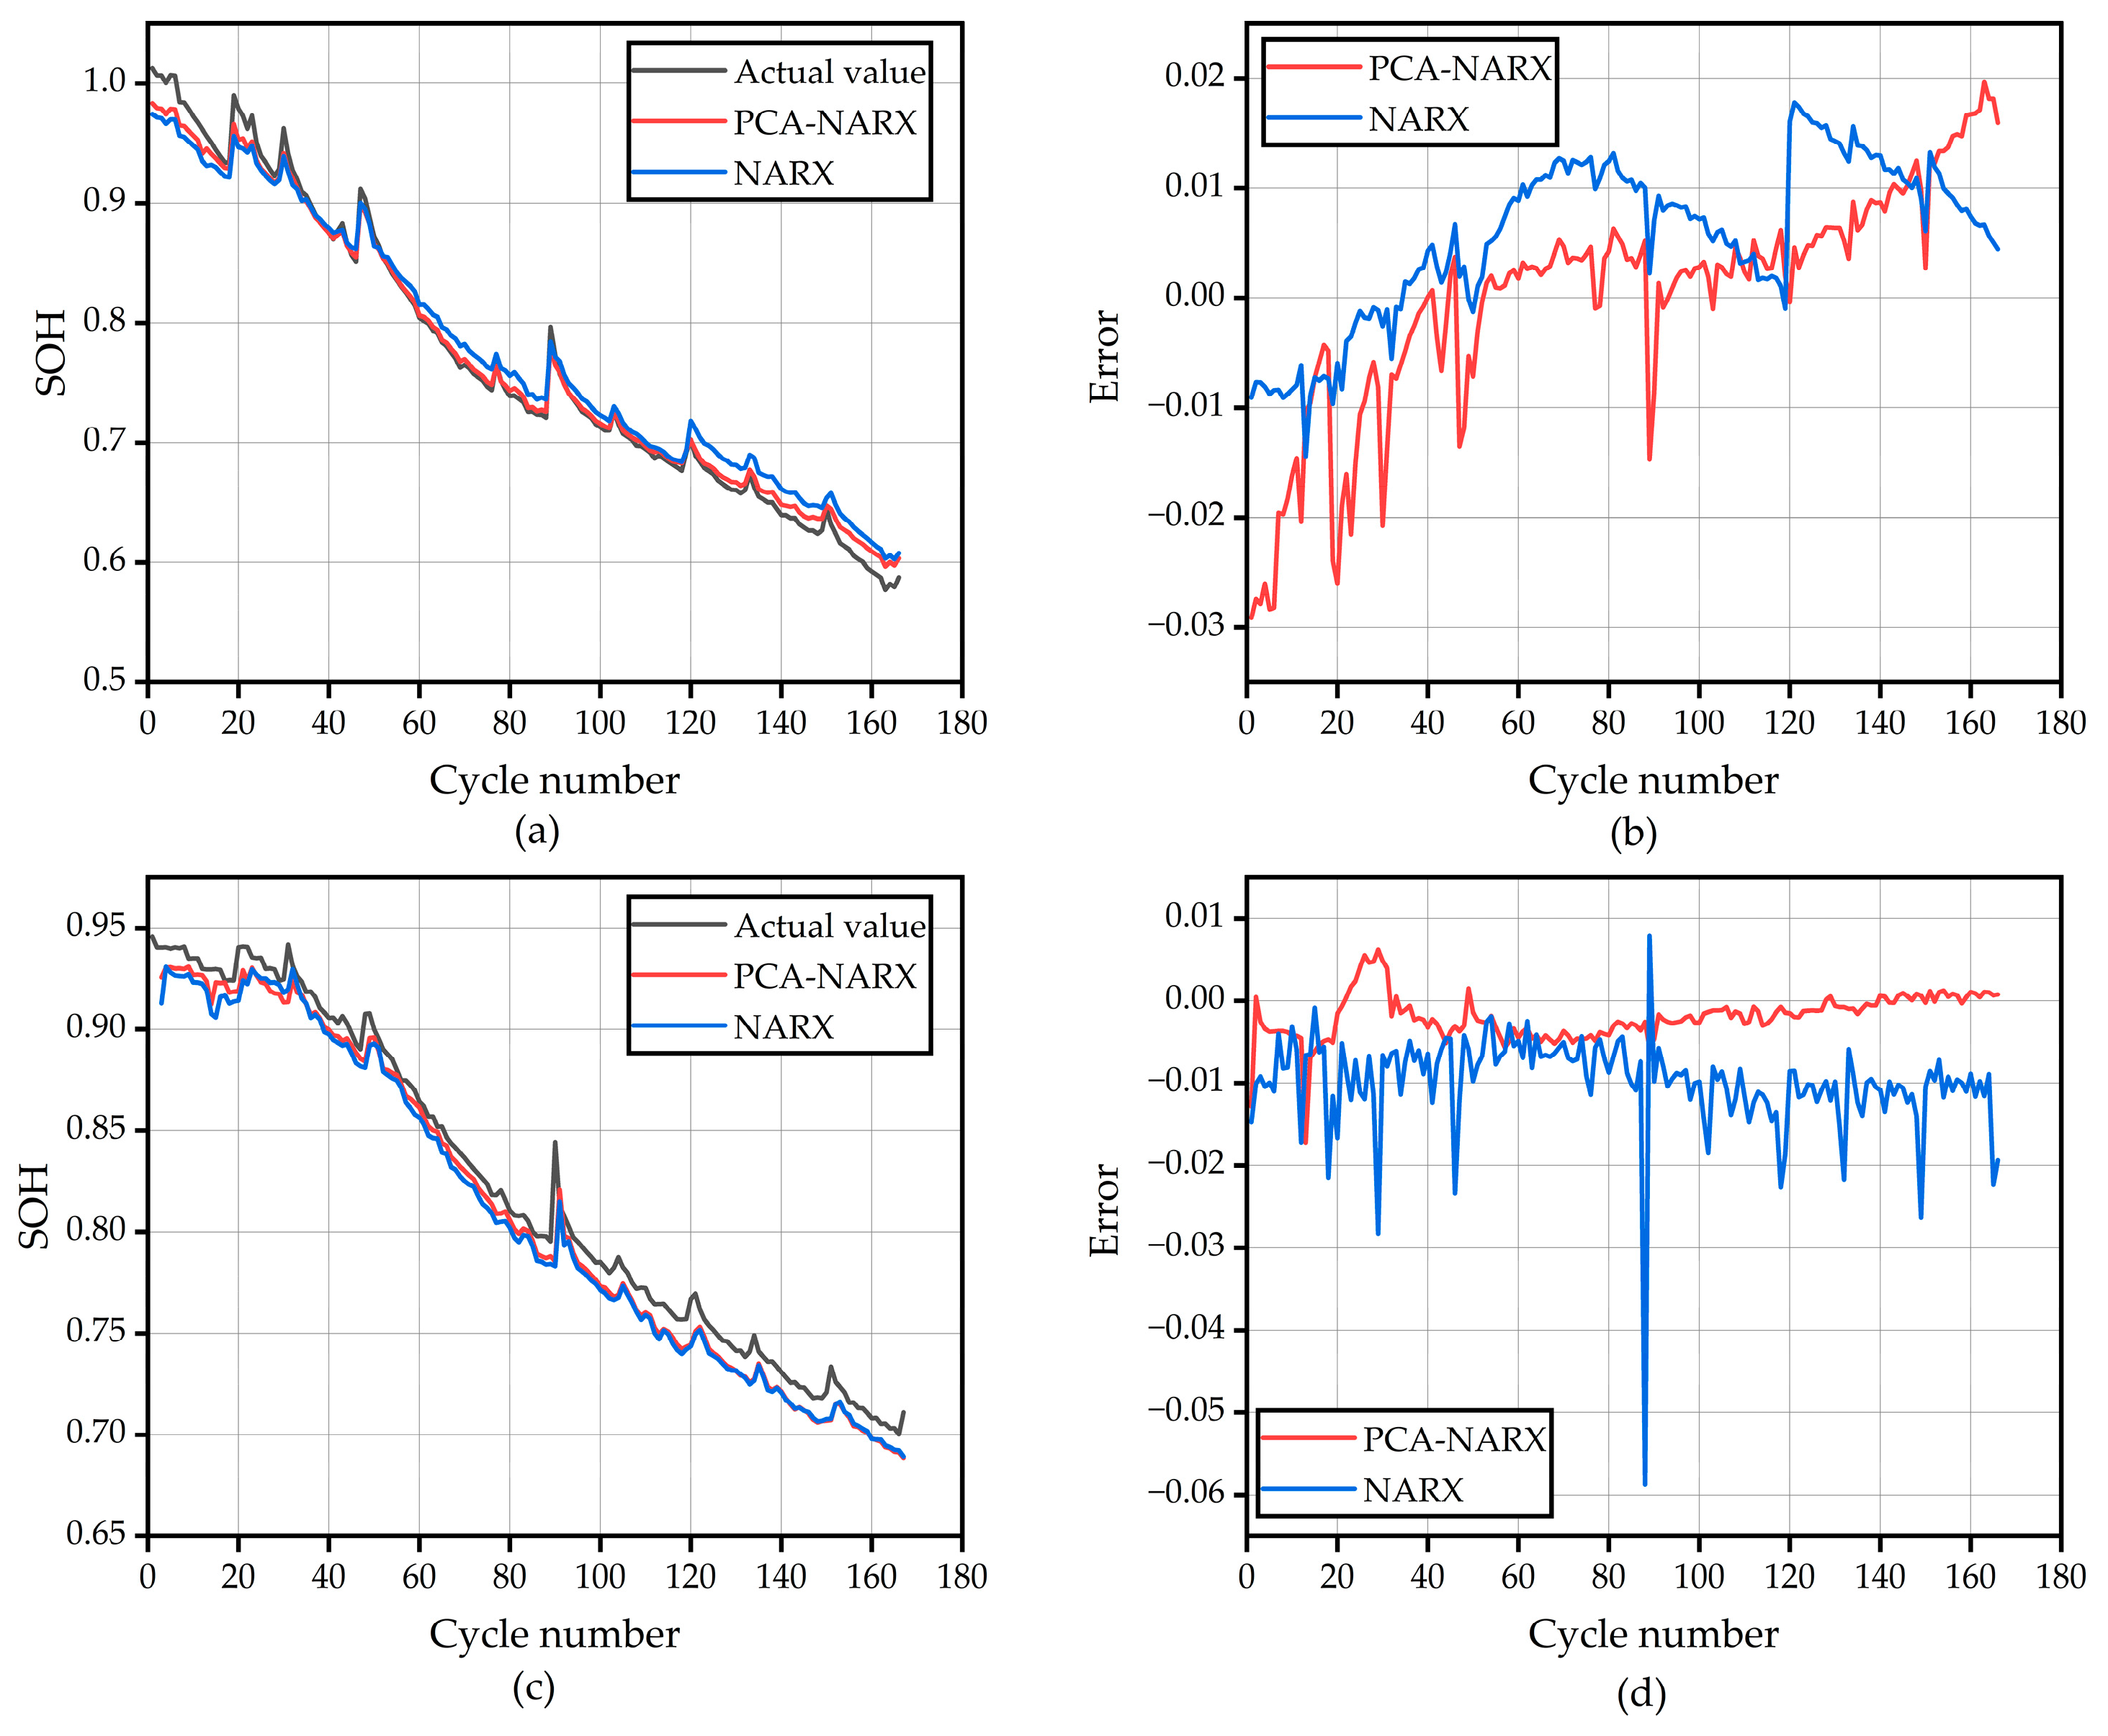
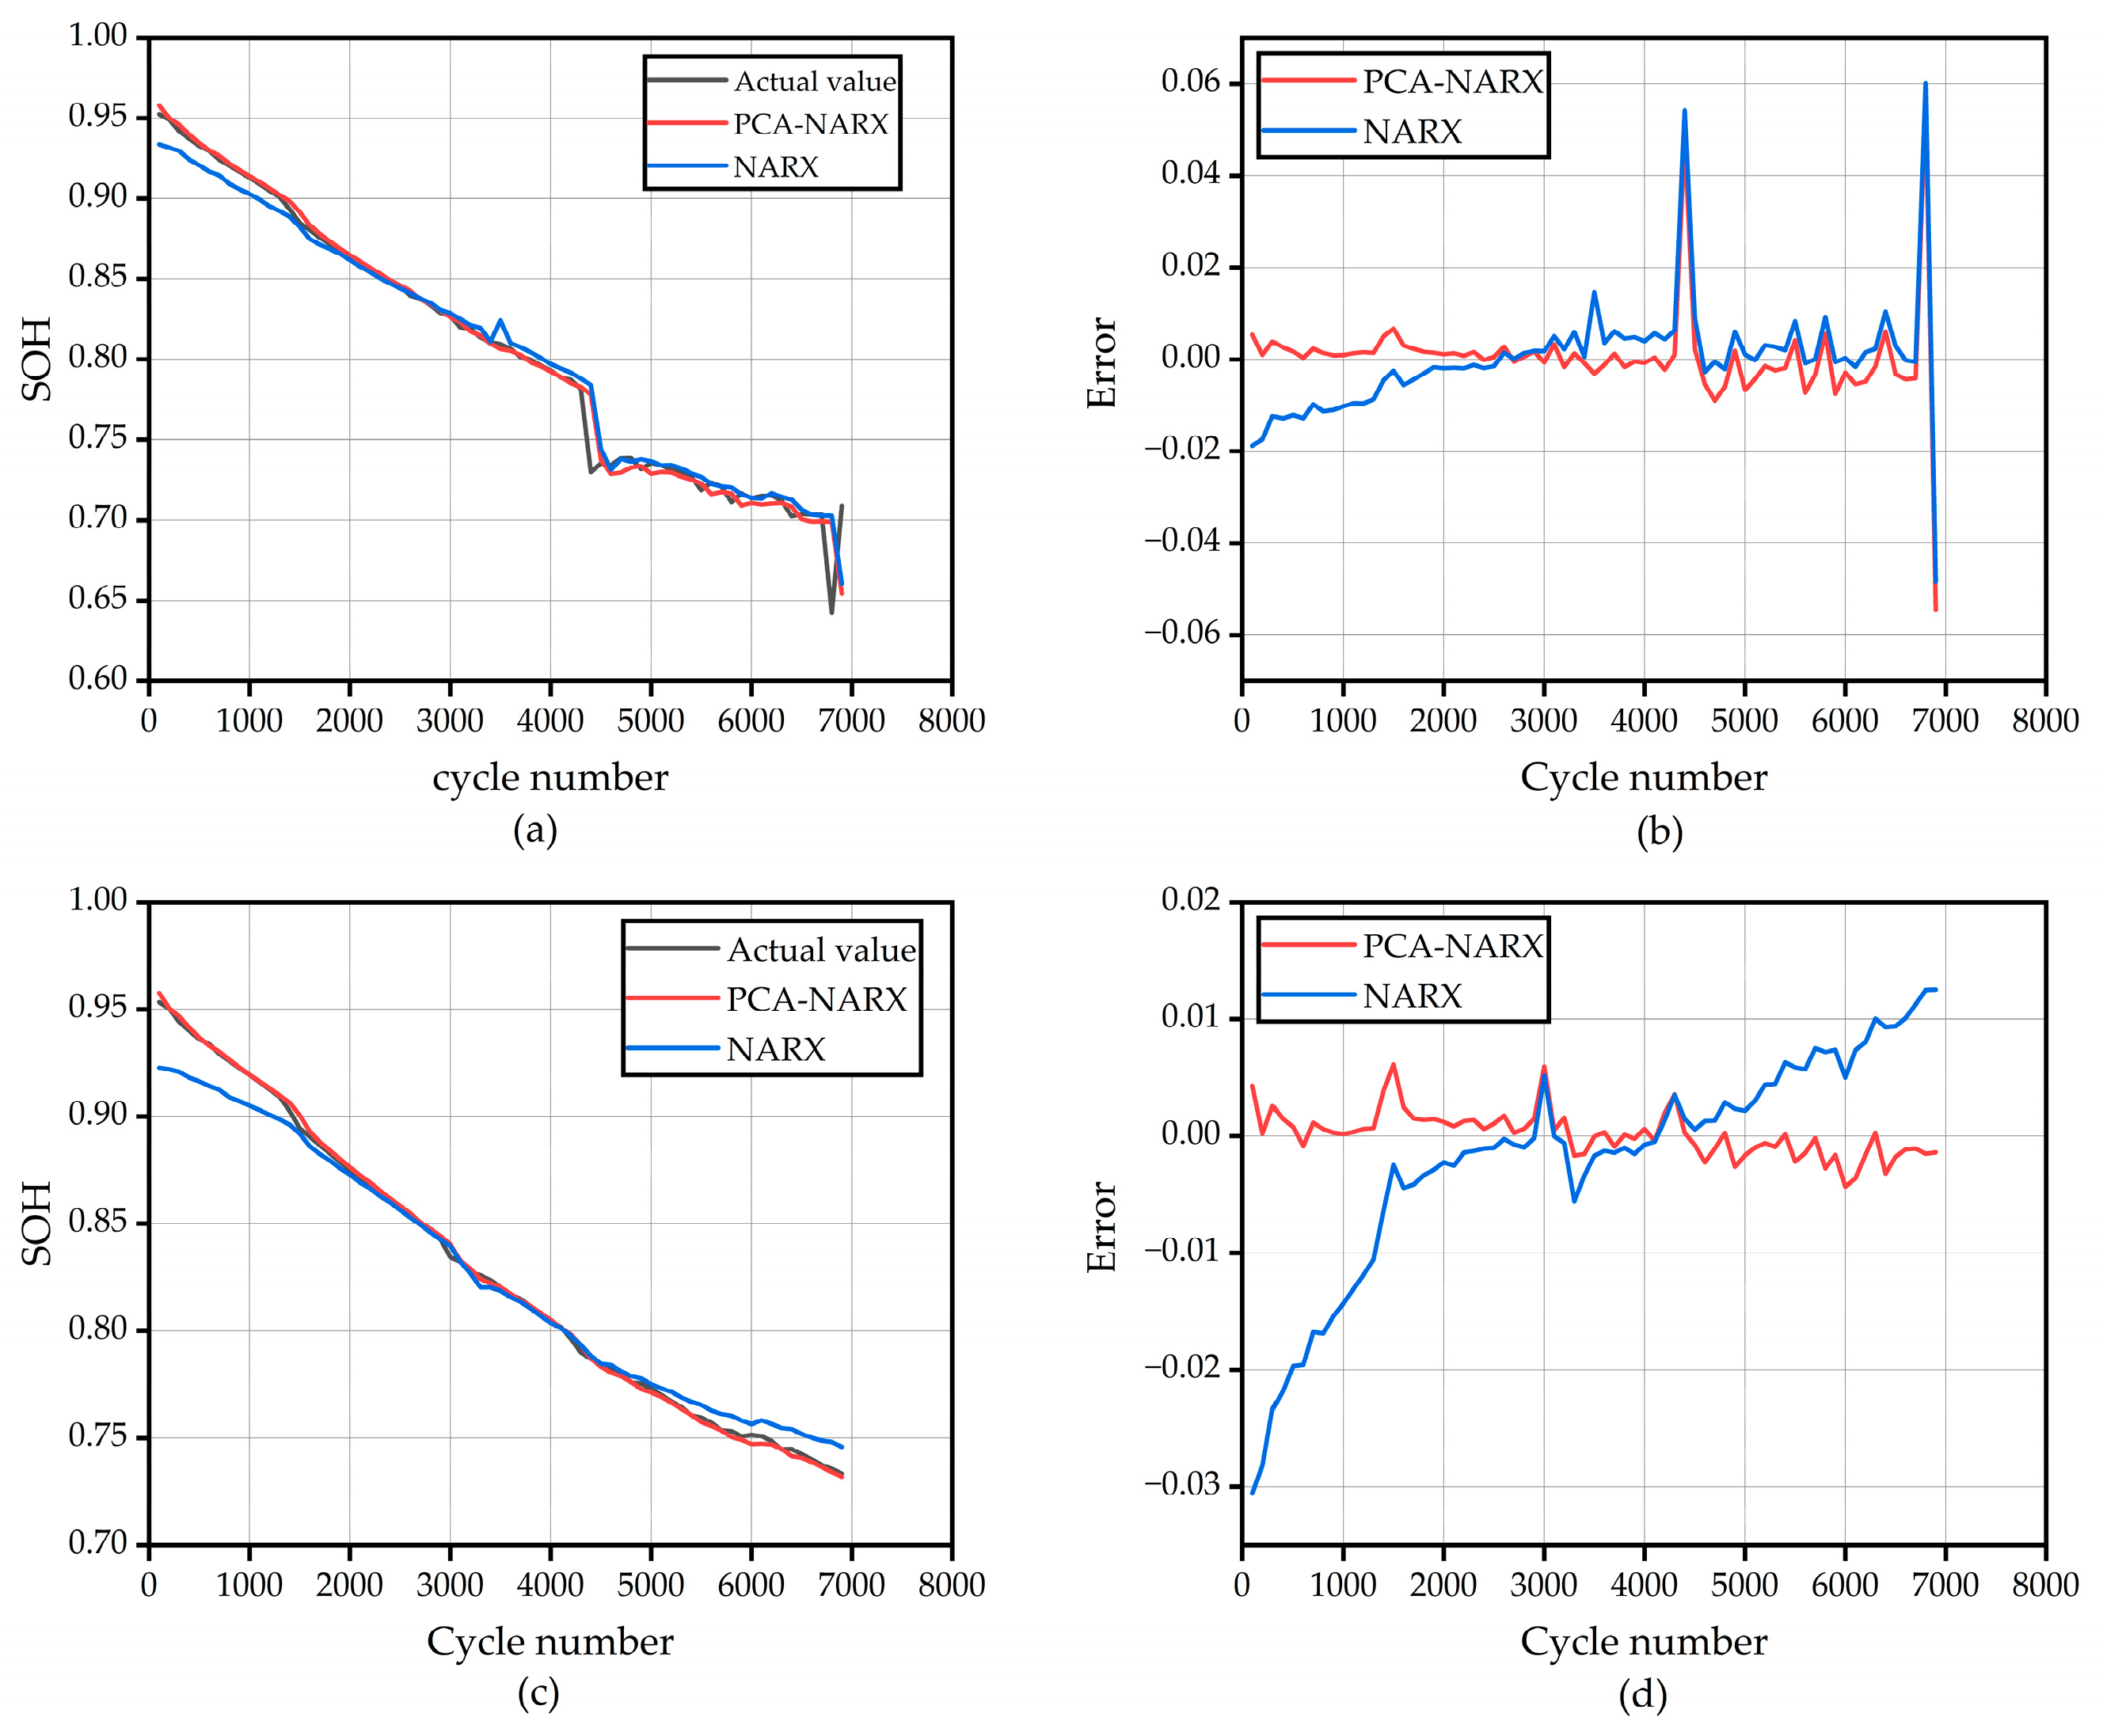
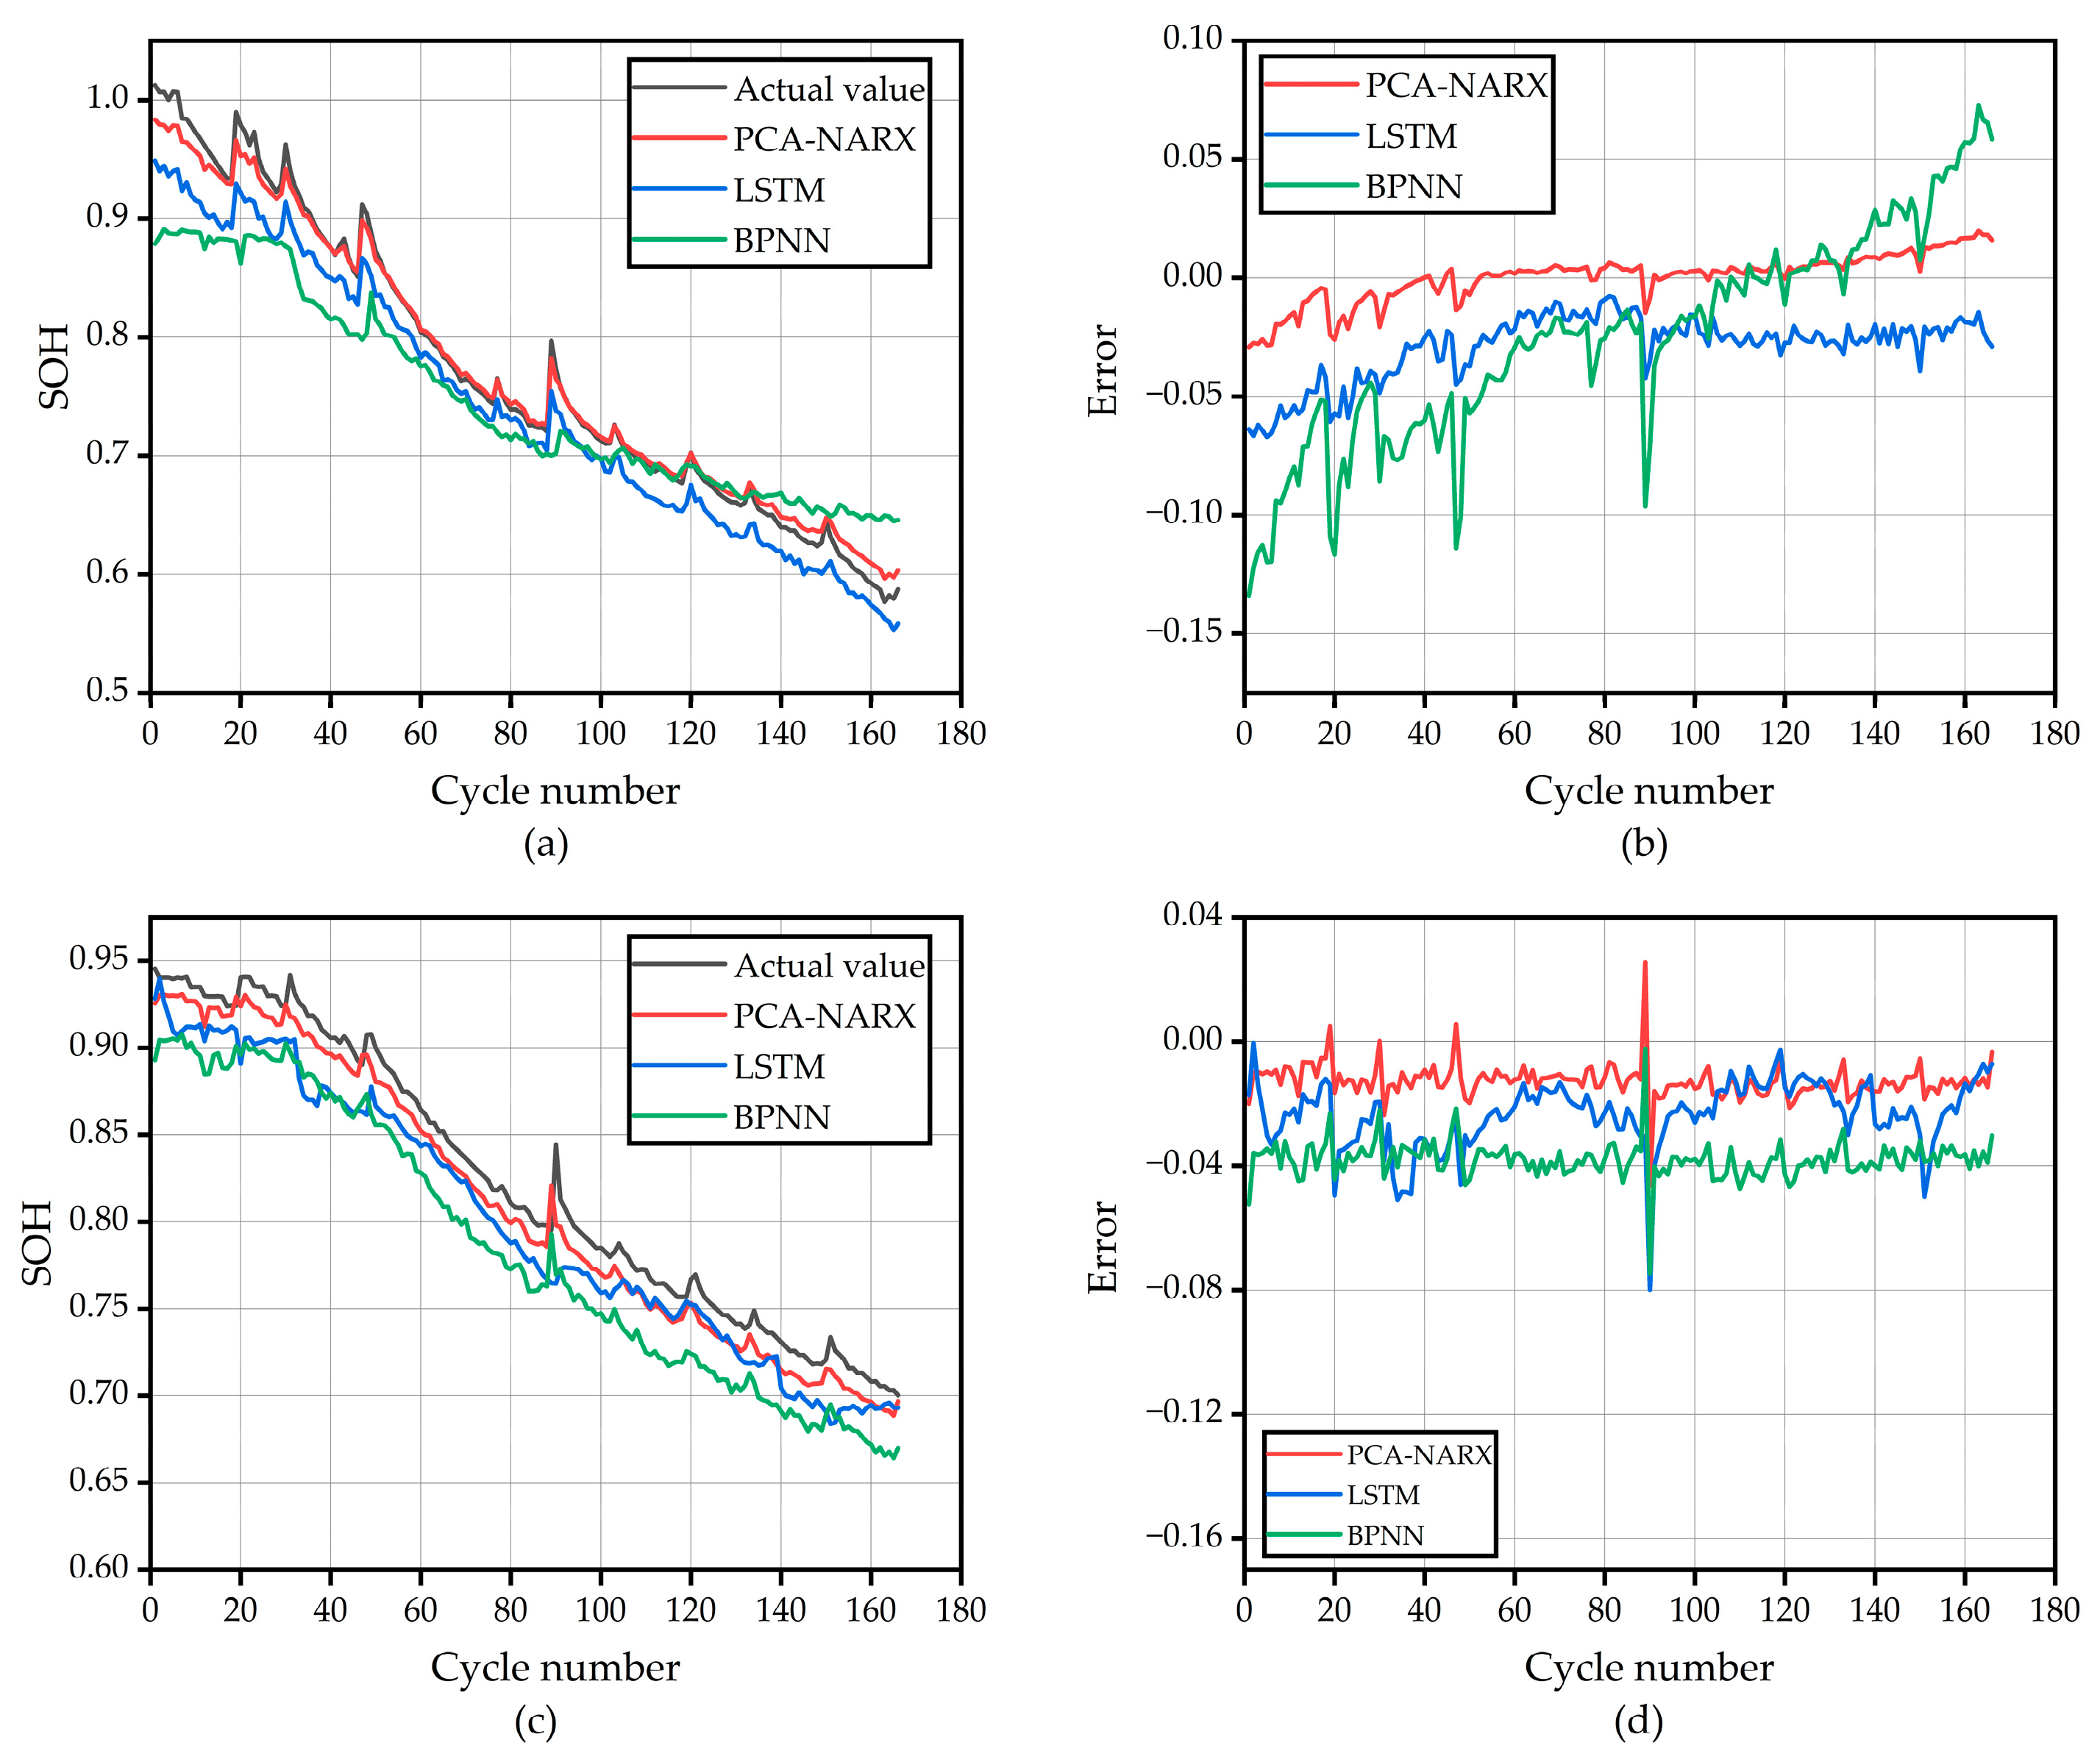
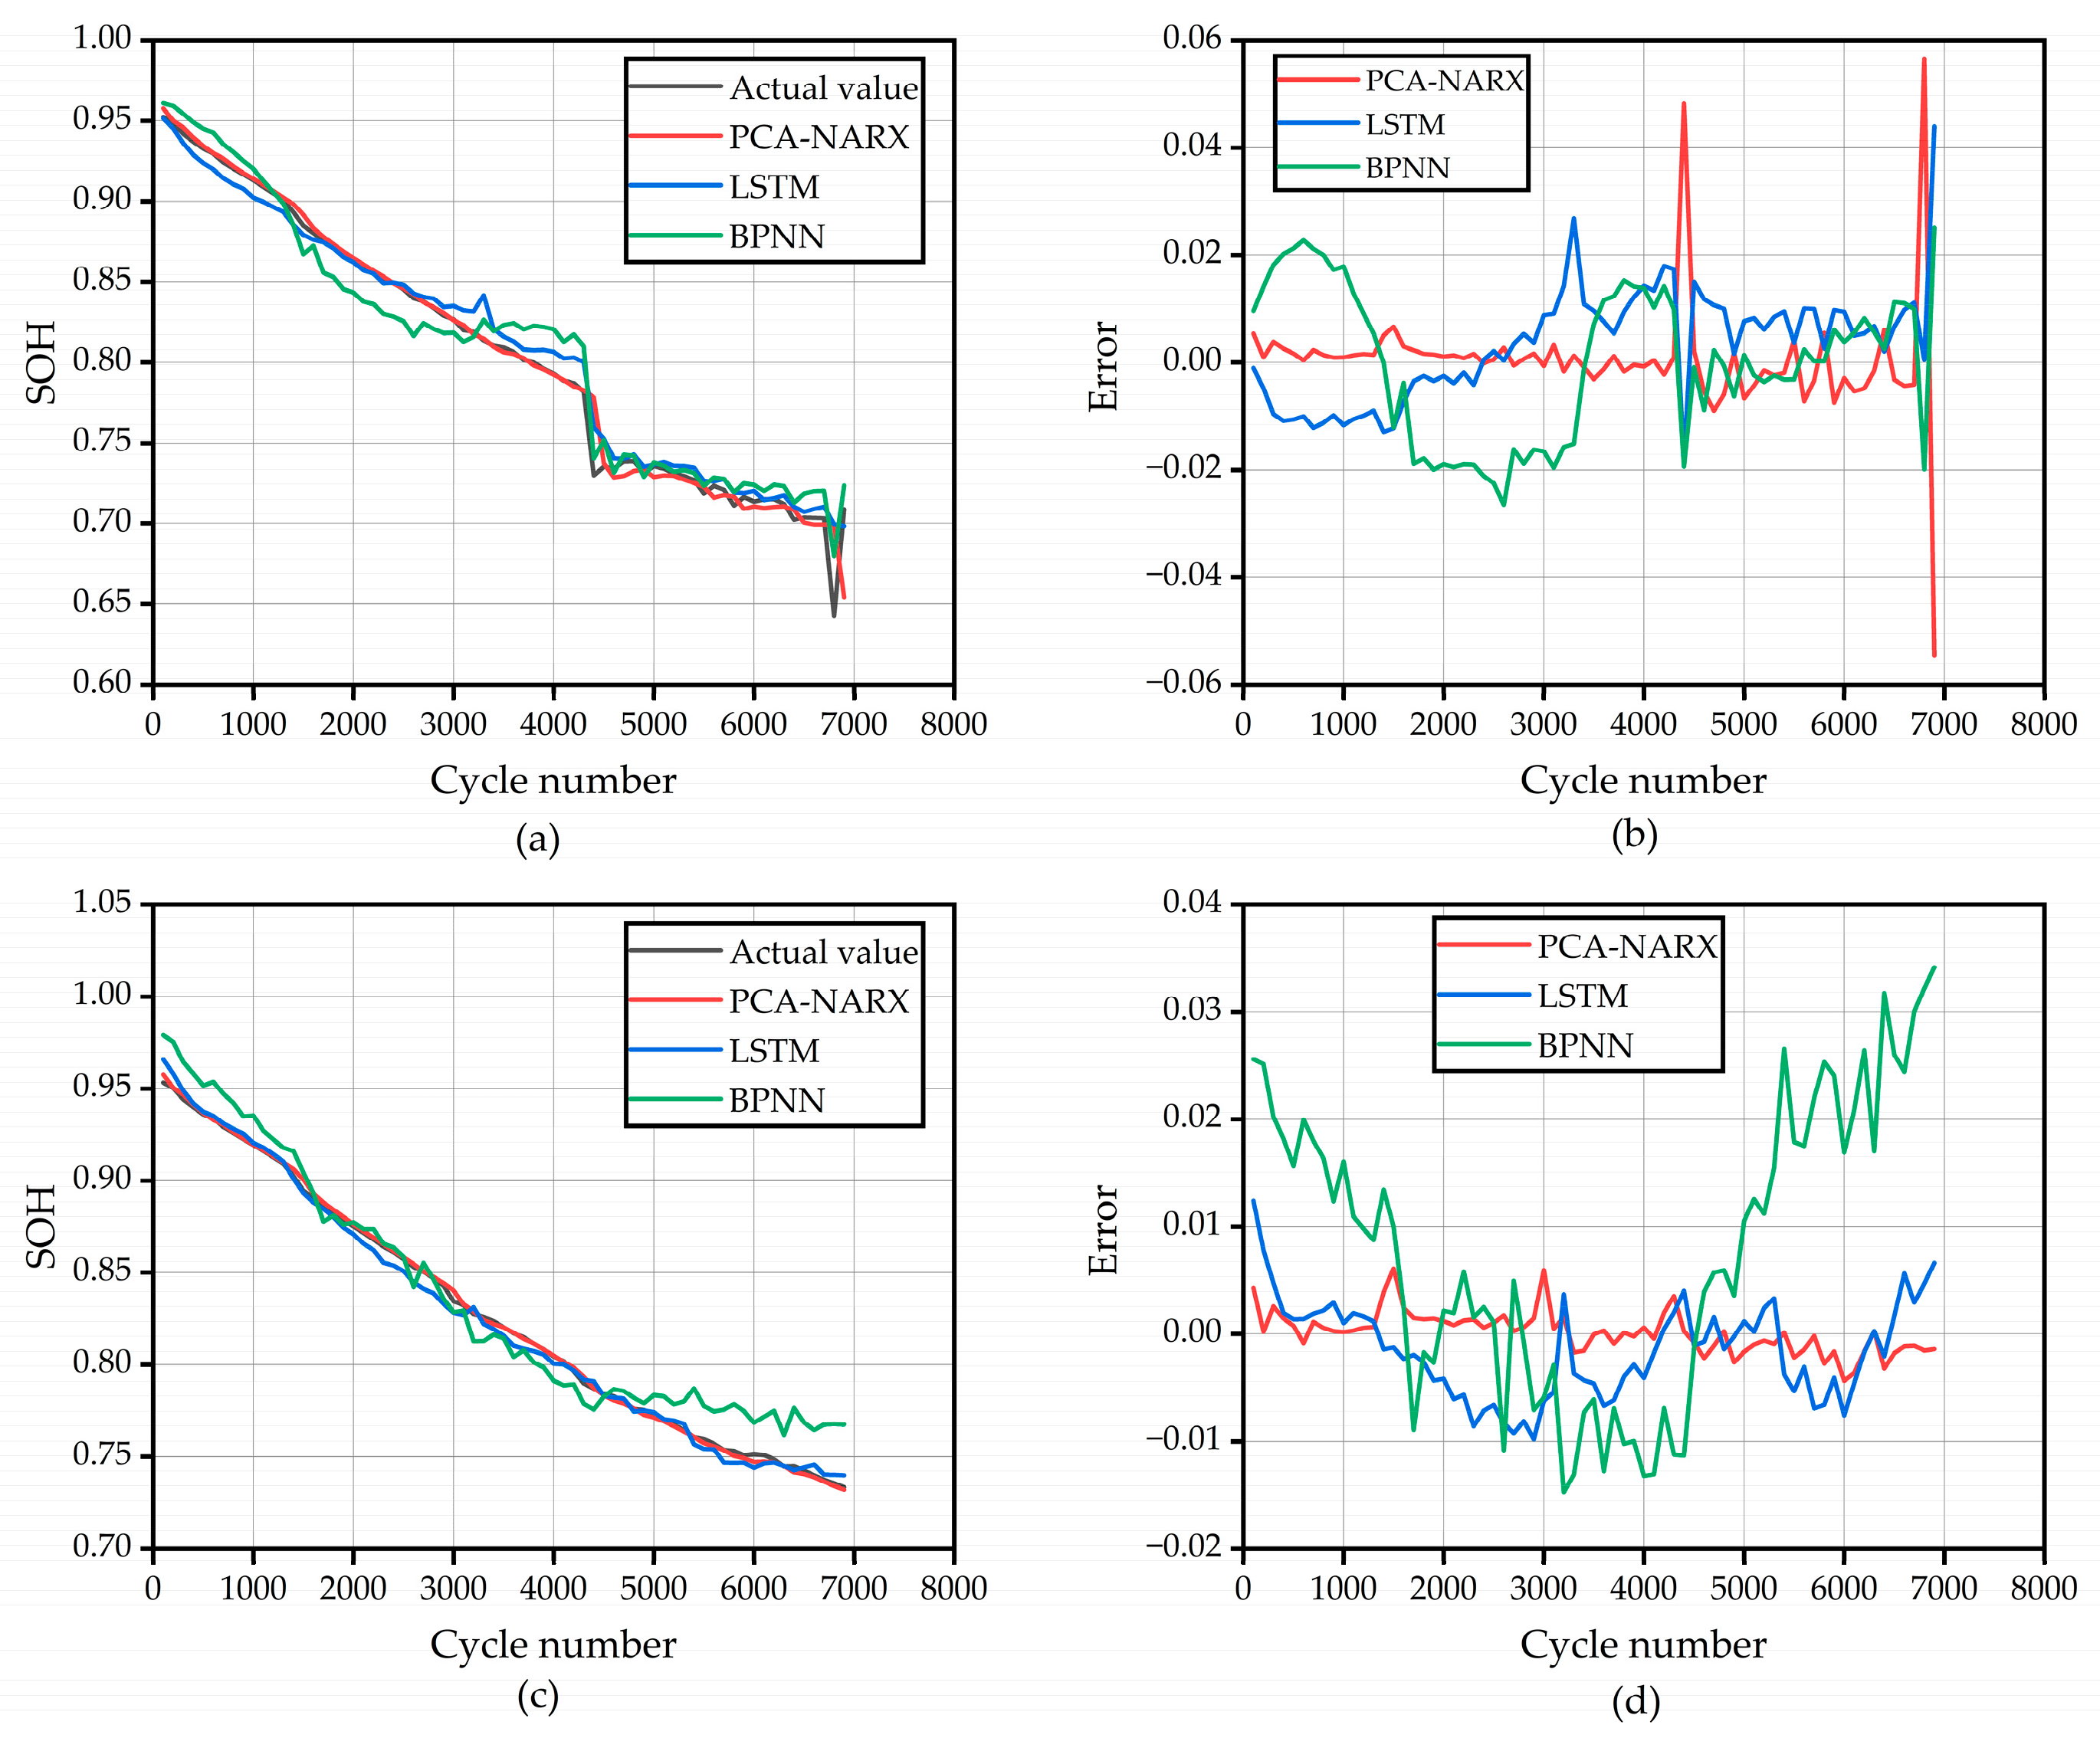
4.2. Comparison of Different SOH Estimation Methods

To validate the accuracy of the proposed model for SOH estimation, the proposed PCA-NARX model is compared with the BPNN and LSTM models. The BPNN and LSTM neural networks are trained in the same way, including the PCA pre-processing, number of hidden neurons, and number of training epochs.
Figure 7 and Figure 8 show the SOH estimation results of the three methods. It can be seen that the three methods are able to track the aging of the SOH, but the NARX method has better accuracy and smoothness. Specifically, the error of the PCA-NARX model in the early and late stages is smaller than that of the BPNN and LSTM in Figure 7 where the BPNN diverges in the late stages of the B0006 cell. The maximum error point for all three models occurs at the early stage of B0006 and at the capacity regeneration point of B0007. This is because the initial data is small and the capacity regeneration phase does not obey the time decay law. As can be seen in Figure 8, compared to Figure 7, the PCA-NARX model makes better predictions with relative errors around 0.01 and the BPNN model fluctuates more frequently. For the actual SOH of the cells, both LSTM and BPNN show varying degrees of fluctuation. The mean MAE and RMSE values of NARX method are less than 1%, while the mean MAE and RMSE values of LSTM method are more than 1%, the mean MAE values of BPNN method are more than 2%, and the mean RMSE values are more than 3%. As can be seen from Table 4, the mean MAE of the NARX model is 58.21% lower than that of the LSTM model and 50.42% lower than that of the BPNN model. The mean RMSE of the NARX model is 74.1% lower than that of the LSTM model and 69.38% lower than that of the BPNN model. Despite its relatively simple structure, BPNN has the largest fluctuations throughout the process, especially during the initial phase of the battery and the end of life (EOL) phase. According to the results, the proposed PCA-NARX model has a better estimation accuracy than the LSTM and BPNN models for SOH estimation. Compared with the LSTM and BPNN methods, the NARX estimation model is suitable for different types of batteries and can achieve accurate estimation results. Moreover, it can adapt to the divergence of the decay trend of the health state caused by battery inconsistency in the case of limited sample data.

4.3. Discussion

The above results demonstrate the effectiveness of charge-based multi-feature extraction and the performance of NARX neural network for SOH estimation, but there are still some limitations and deficiencies. Firstly, the extraction of HIs on the battery for relatively stable laboratory conditions neglects the effect of temperature changes and other conditions, and its feasibility in practical charging processes needs to be further verified. Secondly, this paper only focuses on SOH estimation methods for cell, while SOH estimation methods for the battery pack is not involved, which is also a direction for future research. Finally, parameters such as neurons and hidden layers in the NARX neural network are empirically chosen to be optimal values. Further optimization of the NARX network can be considered in the future. At the same time, it is worth exploring how to maintain a balance between computational load and model accuracy.

5. Conclusions

To address the problem of low accuracy of battery SOH estimation in real-world working conditions, the paper proposes an SOH estimation method for lithium-ion batteries based on the charging phase and PCA-NARX. First, health characteristics strongly correlated with battery capacity are investigated, where six health factors are extracted from the charging phase. Second, the PCA method is used to eliminate redundancy between the extracted HIs. To thoroughly validate the proposed method, two public datasets are utilized to develop and test the proposed method where the results show that the PCA-NARX model can achieve accurate and robust SOH estimation. In addition, LSTM and BPNN are built for comparison and validation. By comparing the simulation results, it is found that the proposed PCA-NARX model has better adaptation and prediction accuracy, where the average MAE and RMSE are 0.68% and 0.79%, respectively. Focusing on the extraction of HIs during the charging phase, the proposed method has more practical applications.
Our future work will focus on different battery types to validate the proposed approach and further optimize the health feature strategy to better match the actual usage conditions. We will then optimize the proposed algorithmic model with less computational effort and better accuracy and apply it to the SOH estimation of the battery pack.

Author Contributions

Conceptualization, C.D., R.Q. and Z.R.; methodology, C.D., R.Q. and Z.R.; software, C.D. and R.Q.; validation, C.D., R.Q. and D.X.; formal analysis, C.D.; resources, C.D.; data curation, C.D., R.Q. and D.X.; writing—original draft preparation, C.D. and R.Q.; writing—review and editing, C.D. and Z.R.; visualization, C.D. and R.Q.; supervision, C.D. and Z.R.; funding acquisition, C.D. All authors have read and agreed to the published version of the manuscript.

Funding

This research was funded by Key R&D project of Hubei Province, China, grant number 2021AAA006; Foshan Xianhu Laboratory of the Advanced Energy Science and Technology Guang-dong Laboratory, grant number XHD2020-003.

Institutional Review Board Statement

Not applicable.

Informed Consent Statement

Informed consent was obtained from all subjects involved in the study.

Data Availability Statement

The data of this paper is available on the following website: https://ora.ox.ac.uk/objects/uuid:03ba4b01-cfed-46d3-9b1a-7d4a7bdf6fac (accessed on 3 January 2023).

Conflicts of Interest

The authors declare no conflict of interest.

References

  1. RYang, S.; Zhang, C.; Jiang, J.; Zhang, W.; Wang, Y. Review on State-of-Health of Lithium-Ion Batteries: Characterizations, Estimations and Applications. J. Clean. Prod. 2021, 314, 128015. [Google Scholar]
  2. Kong, S.N.; Moo, C.S.; Chen, Y.P.; Hsieh, Y.C. Enhanced Coulomb Counting Method for Estimating State-of-Charge and State-of-Health of Lithium-Ion Batteries. Appl. Energy 2009, 86, 1506–1511. [Google Scholar]
  3. Galeotti, M.; Giammanco, C.; Cina, L.; Cordiner, S.; Carlo, A.D. Diagnostic Methods for the Evaluation of the State of Health (SOH) of NiMH Batteries through Electrochemical Impedance Spectroscopy. In Proceedings of the IEEE International Symposium on Industrial Electronics, Istanbul, Turkey, 1–4 June 2014. [Google Scholar]
  4. Kim, T.; Wei, Q.; Qu, L. Online SOC and SOH Estimation for Multicell Lithium-Ion Batteries Based on an Adaptive Hybrid Battery Model and Sliding-Mode Observer. In Proceedings of the Energy Conversion Congress & Exposition, Denver, CO, USA, 15–19 September 2013. [Google Scholar]
  5. Wang, R.; Feng, H. Lithium-Ion Batteries Remaining Useful Life Prediction Using Wiener Process and Unscented Particle Filter. J. Power Electron. 2020, 20, 270–278. [Google Scholar] [CrossRef]
  6. Berecibar, M.; Garmendia, M.; Gandiaga, I.; Crego, J.; Villarreal, I. State of Health Estimation Algorithm of LiFePO4 Battery Packs Based on Differential Voltage Curves for Battery Management System Application. Energy 2016, 103, 784–796. [Google Scholar] [CrossRef]
  7. Weng, C.; Cui, Y.; Jing, S.; Peng, H. On-Board State of Health Monitoring of Lithium-Ion Batteries Using Incremental Capacity Analysis with Support Vector Regression. J. Power Sources 2013, 235, 36–44. [Google Scholar] [CrossRef]
  8. Li, Y.; Abdel-Monem, M.; Gopalakrishnan, R.; Berecibar, M.; Nanini-Maury, E.; Omar, N.; Peter, V.; Mierlo, J. Van A Quick On-Line State of Health Estimation Method for Li-Ion Battery with Incremental Capacity Curves Processed by Gaussian Filter. J. Power Sources 2018, 373, 40–53. [Google Scholar] [CrossRef]
  9. Zhang, Y.; Liu, Y.; Wang, J.; Zhang, T. State-of-Health Estimation for Lithium-Ion Batteries by Combining Model-Based Incremental Capacity Analysis with Support Vector Regression. Energy 2022, 239, 121986. [Google Scholar] [CrossRef]
  10. Wu, Y.; Jossen, A. Entropy-Induced Temperature Variation as a New Indicator for State of Health Estimation of Lithium-Ion Cells. Electrochim. Acta 2018, 276, 370–376. [Google Scholar] [CrossRef]
  11. Cannarella, J.; Arnold, C.B. State of Health and Charge Measurements in Lithium-Ion Batteries Using Mechanical Stress. J. Power Sources 2014, 269, 7–14. [Google Scholar] [CrossRef]
  12. Liu, B.; Tang, X.; Gao, F. Joint Estimation of Battery State-of-Charge and State-of-Health Based on a Simplified Pseudo-Two-Dimensional Model. Electrochim. Acta 2020, 344, 136098. [Google Scholar] [CrossRef]
  13. Bhangu, B.S.; Bentley, P.; Stone, D.A.; Bingham, C.M. State-of-Charge and State-of-Health Prediction of Lead-Acid Batteries for Hybrid Electric Vehicles Using Non-Linear Observers. In Proceedings of the 2005 European Conference on Power Electronics and Applications, Dresden, Germany, 11–14 September 2005. [Google Scholar]
  14. Han, X.; Ouyang, M.; Lu, L.; Li, J. A Comparative Study of Commercial Lithium Ion Battery Cycle Life in Electric Vehicle: Capacity Loss Estimation. J. Power Sources 2014, 268, 658–669. [Google Scholar] [CrossRef]
  15. Wirth, M.; Shea, K.; Chen, T. 3D-Printing Textiles: Multi-Stage Mechanical Characterization of Additively Manufactured Biaxial Weaves. Mater. Des. 2023, 225, 111449. [Google Scholar] [CrossRef]
  16. Nasiri, S.; Khosravani, M.R. Applications of Data-Driven Approaches in Prediction of Fatigue and Fracture. Mater. Today Commun. 2022, 33, 104437. [Google Scholar]
  17. Shen, S.; Sadoughi, M.; Chen, X.; Hong, M.; Hu, C. A Deep Learning Method for Online Capacity Estimation of Lithium-Ion Batteries. J. Energy Storage 2019, 25, 100817. [Google Scholar] [CrossRef]
  18. Khumprom, P.; Yodo, N. A Data-Driven Predictive Prognostic Model for Lithium-Ion Batteries Based on a Deep Learning Algorithm. Energies 2019, 12, 660. [Google Scholar] [CrossRef]
  19. Zhao, Q.; Qin, X.; Zhao, H.; Feng, W. A Novel Prediction Method Based on the Support Vector Regression for the Remaining Useful Life of Lithium-Ion Batteries. Microelectron. Reliab. 2018, 85, 99–108. [Google Scholar] [CrossRef]
  20. Klass, V.; Behm, M.; Lindbergh, G. A Support Vector Machine-Based State-of-Health Estimation Method for Lithium-Ion Batteries under Electric Vehicle Operation. J. Power Sources 2014, 270, 262–272. [Google Scholar] [CrossRef]
  21. Dong, W.; Qiang, M.; Pecht, M. Prognostics of Lithium-Ion Batteries Based on Relevance Vectors and a Conditional Three-Parameter Capacity Degradation Model. J. Power Sources 2013, 239, 253–264. [Google Scholar]
  22. Wei, M.; Ye, M.; Wang, Q.; Wu, C.; Ma, Y. State-of-Health Estimation and Remaining Useful Life Prediction of Lithium-Ion Batteries Based on Extreme Learning Machine. J. Phys. Conf. Ser. 2021, 1983, 012058. [Google Scholar] [CrossRef]
  23. Richardson, R.R.; Osborne, M.A.; Howey, D.A. Gaussian Process Regression for Forecasting Battery State of Health. J. Power Sources 2017, 357, 209–219. [Google Scholar] [CrossRef]
  24. Richardson, R.R.; Osborne, M.A.; Howey, D.A. Battery Health Prediction under Generalized Conditions Using a Gaussian Process Transition Model. J. Energy Storage 2019, 23, 320–328. [Google Scholar] [CrossRef]
  25. Yang, D.; Wang, Y.; Pan, R.; Chen, R.; Chen, Z. State-of-Health Estimation for the Lithium-Ion Battery Based on Support Vector Regression. Appl. Energy 2018, 227, 273–283. [Google Scholar] [CrossRef]
  26. Li, P.; Zhang, Z.; Xiong, Q.; Ding, B.; Li, S. State-of-Health Estimation and Remaining Useful Life Prediction for the Lithium-Ion Battery Based on a Variant Long Short Term Memory Neural Network. J. Power Sources 2020, 459, 228069. [Google Scholar] [CrossRef]
  27. Ma, Y.; Shan, C.; Gao, J.; Chen, H. A Novel Method for State of Health Estimation of Lithium-Ion Batteries Based on Improved LSTM and Health Indicators Extraction. Energy 2022, 251, 123973. [Google Scholar] [CrossRef]
  28. Chaoui, H.; Ibe-Ekeocha, C.C.; Gualous, H. Aging Prediction and State of Charge Estimation of a LiFePO4 Battery Using Input Time-Delayed Neural Networks. Electr. Power Syst. Res. 2017, 146, 189–197. [Google Scholar] [CrossRef]
  29. Lin, C.; Xu, J.; Shi, M.; Mei, X. Constant Current Charging Time Based Fast State-of-Health Estimation for Lithium-Ion Batteries. Energy 2022, 247, 123556. [Google Scholar] [CrossRef]
  30. Bavand, A.; Khajehoddin, S.A.; Ardakani, M.; Tabesh, A. Online Estimations of Li-Ion Battery SOC and SOH Applicable to Partial Charge/Discharge. IEEE Trans. Transp. Electrif. 2022, 8, 3673–3685. [Google Scholar] [CrossRef]
  31. Wei, Z.; Ruan, H.; Li, Y.; Li, J.; Zhang, C.; He, H. Multistage State of Health Estimation of Lithium-Ion Battery with High Tolerance to Heavily Partial Charging. IEEE Trans. Power Electron. 2022, 37, 7432–7442. [Google Scholar] [CrossRef]
  32. Cui, Z.; Wang, C.; Gao, X.; Tian, S. State of Health Estimation for Lithium-Ion Battery Based on the Coupling-Loop Nonlinear Autoregressive with Exogenous Inputs Neural Network. Electrochim. Acta 2021, 393, 139047. [Google Scholar] [CrossRef]
  33. Dai, H.; Zhao, G.; Lin, M.; Ji, W.; Zheng, G. A Novel Estimation Method for the State of Health of Lithium-Ion Battery Using Prior Knowledge-Based Neural Network and Markov Chain. IEEE Trans. Ind. Electron. 2018, 66, 7706–7716. [Google Scholar] [CrossRef]
  34. Fan, Y.; Xiao, F.; Li, C.; Yang, G.; Tang, X. A Novel Deep Learning Framework for State of Health Estimation of Lithium-Ion Battery. J. Energy Storage 2020, 32, 101741. [Google Scholar] [CrossRef]
Figure 1. (a) Capacity curves of NASA dataset; (b) Capacity curves of Oxford dataset.
Energies 16 01420 g001
Figure 2. The charging curves of different cycles: (a) The voltage curves of B0006; (b) The current curves of B0006; (c) The temperature curves of B0006; (d) The voltage curves of Cell 1; (e) The capacity of Cell 1; (f) The temperature curves of Cell 1.
Energies 16 01420 g002
Figure 3. Relationship between HIs and battery charge cycles.
Energies 16 01420 g003
Figure 4. Topology of the NARX neural network.
Energies 16 01420 g004
Figure 5. (a) SOH estimation curves of B0006 before and after PCA; (b) Errors of SOH estimation of B0006 before and after PCA; (c) Comparison of SOH estimation curves of B0007 before and after PCA; (d) Errors of SOH estimation of B0007 before and after PCA.
Energies 16 01420 g005
Figure 6. (a) SOH estimation curves of Cell 2 before and after PCA; (b) Errors of SOH estimation of Cell 2 before and after PCA; (c) Comparison of SOH estimation curves of Cell 3 before and after PCA; (d) Errors of SOH estimation of Cell 3 before and after PCA.
Energies 16 01420 g006
Figure 7. (a) Comparison of SOH estimation curves of B0006 battery; (b) Errors of SOH estimation of B0006 battery; (c) Comparison of SOH estimation curves of B0007 battery; (d) Errors of SOH estimation of B0007 battery.
Energies 16 01420 g007
Figure 8. (a) Comparison of SOH estimation curves of Cell 2 battery; (b) Errors of SOH estimation of Cell 2 battery; (c) Comparison of SOH estimation curves of Cell 3 battery; (d) Errors of SOH estimation of Cell 3 battery.
Energies 16 01420 g008
Table 1. Principal component contribution rate of battery HIs.
Principal Element Serial NumberCharacteristic ValueContribution Rate (%)Cumulative Contribution Rate (%)
14.73872.966172.9661
21.087318.122491.0885
30.47377.895498.9839
40.05580.930599.9144
50.00440.07499.9884
60.00070.0117100
Table 2. Summary of MAE and RMSE before and after PCA.
PCA-NARXNARX
MAE (%)RMSE (%)MAE (%)RMSE (%)
B00060.781.041.541.75
B00071.311.391.491.57
Cell 20.480.531.871.88
Cell 3
Average
0.14
0.68
0.19
0.79
3.01
1.98
3.06
2.07
Table 3. Summary calculated rate of before and after PCA.
PCA-NARXNARX
Number of iterations
Calculate the time/s
5384
74128
Table 4. Summary of MAE and RMSE of different algorithms.
PCA-NARXLSTMBPNN
MAE (%)RMSE (%)MAE (%)RMSE (%)MAE (%) RMSE (%)
B00060.781.042.883.24.055.11
B00071.311.392.332.553.773.82
Cell 20.480.530.881.181.331.71
Cell 3
Average
0.14
0.68
0.19
0.79
0.42
1.63
0.51
1.86
1.36
2.63
1.64
3.07
Disclaimer/Publisher’s Note: The statements, opinions and data contained in all publications are solely those of the individual author(s) and contributor(s) and not of MDPI and/or the editor(s). MDPI and/or the editor(s) disclaim responsibility for any injury to people or property resulting from any ideas, methods, instructions or products referred to in the content.

