Abstract
Lithium-ion batteries are gaining more attention due to the rapid growth of electrical vehicles (EVs). Additionally, the industry is putting a lot of effort into reusing EV batteries in energy storage systems (ESS). The optimal performance of the repurposed battery system is highly dependent on the individual batteries used in it. These batteries need to be similar in terms of battery capacity, state of health (SOH), and remaining useful life (RUL). Therefore, battery grading techniques are expected to play a vital role in this newly emerging industry. There are various methods suggested to evaluate the aging of a battery in terms of capacity, SOH, and RUL. The use of ohmic resistance is one approach, as it varies with the aging of the battery. In order to measure the ohmic resistance, electrochemical impedance spectroscopy (EIS) is used, followed by the curve fitting procedures. In this research a novel method is suggested to measure the ohmic resistance without performing the broadband conventional EIS test and the curve fitting. Since the battery is perturbed for a specified frequency band (1 kHz to 100 Hz) using the linearly distributed phased multi-sine signal, only 1 sec perturbation is required, and the ohmic resistance can be directly calculated by using two impedance values. Thus, the measurement speed is several times faster than that of the conventional EIS methods. Hence, it is a suitable and convenient technique for the mass testing of the batteries. The accuracy and validity of the proposed technique are verified by testing three types of batteries. The percentage difference in the measured ohmic resistance value between the conventional and the proposed technique is less than 0.15% for all the batteries tested.
1. Introduction
In recent decades, the human race has been fighting hard against the climate change. Fossil fuel combustion engines in mobility applications and industrial emissions are major sources contributing to urban air pollution and global warming [1,2]. As a solution to these environmental problems, electric vehicles (EVs) and the usage of renewable energy resources are expanding across the globe [3]. The use of lithium-ion batteries in EVs and energy storage systems (ESS) is increasing due to their many advantages such as high charging and discharging efficiency, high specific energy, low cost, and long life cycle [4,5]. In most literature related to batteries and EVs, the end of life (EOL) of a battery is a 20% drop in capacity from its nominal value [6,7]. Even after serving its first life in EVs, the battery can still store a large amount of energy [8]. Therefore, they can be reused in second-life applications such as ESS [9]. In these repurposed systems, second-life batteries (SLB) are connected in various combinations according to power and energy requirements of the application. But it is a well-known fact that individual battery characteristics affect the optimal performance of the repurposed system [10]. Therefore, each battery should possess similar characteristics in terms of capacity, state of health (SOH), and remaining useful life (RUL) [11].
Once the battery is manufactured, various chemical and electrochemical reactions occurring inside the battery ignite the degradation processes [12,13,14]. In the case of lithium-ion battery, aging is caused by various phenomena such as corrosion of the current collector, binder decomposition, electrolyte depletion, gas evolution, and microcracks [15]. However, it is quite challenging to identify the phenomenon that causes the aging of the battery [16,17]. In most cases, measuring ohmic resistance is a suitable and convenient approach to evaluate the aging of a lithium-ion battery. It is well known that the decay of the battery capacity and the SOH are closely related to the ohmic resistance (see Appendix A, Figure A1 and Figure A2). Due to continuous degradation processes, the ohmic resistance increases while battery capacity and SOH decrease [18]. Thus, it is used as an indicator to estimate the aging of the battery. There are numerous methods to measure ohmic resistance. One such approach is to measure the DC internal resistance (DCIR) using a voltage drop while taking a DC load from the battery [19]. However, there is the imposition of resistance from various contributions. Consequently, it is difficult to completely separate pure ohmic resistance from the DCIR [20]. Equivalent circuit model (ECM) parameter extraction through electrochemical impedance spectroscopy (EIS) gives an insight into the internal electrochemical processes of the battery [21]. However, the EIS experiment is followed by curve fitting to extract the ECM parameters. Since it takes a long time to perform the EIS test and curve fitting, it is impossible to apply it to the mass testing of lithium-ion batteries. There is another simple technique that directly measures the ohmic resistance at a 1 kHz AC signal [22]. This method is based on the approximation that 1 kHz impedance is located near the zero-crossing point on the Nyquist impedance plot. This technique is fast, as the impedance at only 1 kHz needs to be measured. However, the impedance of the battery at 1 kHz is not always on the zero crossing of the real axis. Furthermore, the location of a 1 kHz impedance varies depending on the type of battery. Therefore, the ohmic resistance measured through this method is inherently inaccurate and coincidental.
In this paper, a novel technique is used to perturb the battery using a phased multi-sine signal in a specified narrow frequency band in which the ohmic resistance of a battery lies. The frequency range of the perturbation is selected after an extensive literature review on ohmic resistance and its frequency band of appearance. Since the ohmic resistance is the real-axis zero crossing point on the Nyquist plot, it is directly calculated by using two impedance points above and below the real axis without using additional curve fitting software. It has the following advantages as compared to conventional methods:
- In the proposed technique, the battery is perturbed by using a phased multi-sine signal with a narrow frequency range (1 kHz to 100 Hz), which drastically reduces the measurement time as compared to those of the conventional EIS methods.
- It perturbs the battery only for 1 s.
- Unlike the conventional EIS methods, it does not require additional curve fitting software to extract the ohmic resistance value.
- Contrary to the DCIR method, it measures the pure ohmic resistance value.
- The accuracy of the measurement by the proposed method is even better than that of the 1 kHz AC signal method.
- It is a good solution for the mass testing of xEVs batteries to evaluate their SOHs and RULs.
This paper is organized as follows: the conventional methods used for the ohmic resistance measurement are explained in Section 2, the proposed technique is discussed in Section 3, the software and hardware setup for the experiment are described in Section 4, the experimental results are presented in Section 5, and the work is concluded in the last section.
2. Conventional Ohmic Resistance Measurement Methods
2.1. DCIR Measurement
A conventional method to measure the internal resistance of a battery from the voltage change while taking the DC load from the battery, it is also termed as DCIR. In the literature, many phenomena are identified that contribute to this drop in voltage, and each of them is shown at a different frequency band. Figure 1a shows the Randles’ battery model. In Figure 1b, there is an instantaneous voltage drop due to pure ohmic resistance RS; in the first few seconds, the drop in voltage is due to charge transfer resistance Rct and double layer capacitance Cd; the voltage drop in the last few seconds is due to the polarization resistance and the decrease in SOC in the case of discharging [23].
where ΔV is the change in voltage and ΔI is the change in current.
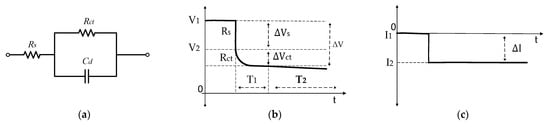
Figure 1.
(a) Randles’ equivalent circuit model of a battery; (b) voltage respone of a battery to a step load change; (c) current response of a battery.
One significant drawback of this method is the imposition of resistances from different contributions, which leads to the inability to completely separate pure ohmic resistance Rs from the rest of the different resistance components.
2.2. Electrochemical Impedance Spectroscopy (EIS)
EIS is a widely used tool as it provides detailed insight into the internal electrochemical processes of the battery. Figure 2 shows the complete process of EIS to measure the ohmic resistance Rs. The sinusoidal sweep is generated over a broadband frequency range to perturb the battery, and response to the AC perturbation is acquired [24]. The battery response obtained is processed to calculate the impedance spectrum. Later, the curve fitting is applied to the impedance spectrum to extract the ohmic resistance Rs and the other ECM parameters such as inductance Ls, charge transfer resistance Rd, constant phase element ZCPE, and Warburg impedance Zw [25].
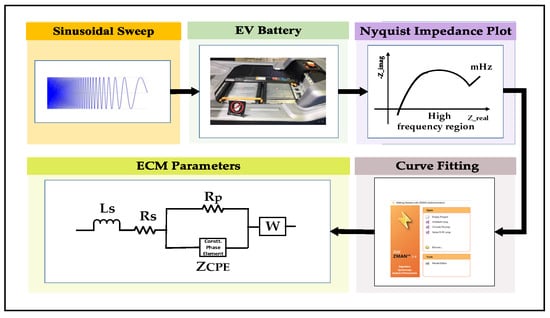
Figure 2.
Typical procedure for conventional electrochemical impedance spectroscopy (EIS).
The EIS approach is a good way to measure the ohmic resistance of a battery. However, it is required to measure the impedance over a wide frequency range, typically from several kHz to mHz. Therefore, the measurement time is quite long, and it cannot be used for mass battery testing. Equation (2) shows the total time required to measure the impedance spectrum of the battery.
In Equation (2), TEIS is the total time taken by the conventional EIS method, and Tf1, Tf2, Tf3….Tfn are the respective time periods of each frequency in the measurement spectrum.
Another downside of EIS is that value of ohmic resistance Rs cannot be directly obtained after performing the test. The curve-fitting procedure is required to extract the ECM parameters, including ohmic resistance Rs. Curve fitting itself is a time-consuming and complex process.
2.3. 1 kHz AC Signal Measurement
In this method, a 1 kHz AC signal represented by Equation (3) is applied to perturb the battery, and the corresponding impedance is calculated by using Equation (4) [26,27].
In Equation (3), Ip is the battery current response, Im is the peak amplitude, is the phase shift, and IDC is the DC offset, respectively.
where Zac is the AC impedance of a battery at 1 kHz, Vp is the voltage response, and Re_Zac and Img_Zac are the real and imaginary components of impedance, respectively.
The HIOKI battery tester (see Appendix A, Figure A3) uses the same concept to measure the ohmic resistance Rs of a battery. Although it is a simple and quick way to measure the ohmic resistance Rs, it is based on the approximation that 1 kHz impedance lies close to the zero-crossing point on the real axis of the Nyquist impedance plot. However, the 1 kHz AC impedance does not always lie on the zero crossing of the real axis, and its location on the Nyquist impedance plot varies depending on the kinds of batteries. Therefore, the inherent inaccuracy of this method is one of the main drawbacks, and the results obtained are coincidental. Table 1 shows the different types of batteries and their respective frequency ranges in which ohmic resistance lies. It can be observed from Table 1 that the ohmic resistance lies mostly below the 1 kHz frequency range. Thus, measuring battery impedance at 1 kHz and considering it as ohmic resistance Rs is an inaccurate approach.

Table 1.
List of batteries and their frequency ranges in which Ohmic resistance (Rs) lies.
3. Proposed Ohmic Resistance Measurement Technique
In the proposed technique, a phased multi-sine signal is used to perturb the battery to determine the frequency range in which ohmic resistance appears. Therefore, the measurement time is reduced by injecting all frequency components in a combined signal instead of perturbing the battery using a frequency sweep. Secondly, the ohmic resistance appears in the higher frequency range (as shown in Table 1). Thus, there is no need to perturb the battery for ohmic resistance measurement over a wide frequency range from several kHz to mHz. Consequently, the measurement time is further reduced by perturbing the battery only for the specified frequency range of 1 kHz to 100 Hz. This frequency range is selected after an extensive literature review about ohmic resistance and their correspondence frequency band of occurrence (as shown in Table 1).
In a multi-sine signal, all the frequency components are superimposed on the lowest frequency. Therefore, the time period of a multi-sine signal is equal to the time period of the lowest frequency, which is 100 Hz in the proposed technique.
However, if the frequency components used for the EIS test are combined with no modification, the crest factor (CF) of the combined signal becomes too large to use for perturbing the battery. Since the EIS test needs to be performed in the steady state of the battery, the variation of the charge in the battery needs to be limited and less than 5% of its full capacity to ensure the linearity of the measured impedance. Several methods have been suggested to use a multi-sine perturbation with a lower CF. One of these methods is to use linearly distributed spectral components with Schroder’s phases [28]. The resulting signal is called a phased multi-sine signal or pseudorandom noise. In this method, the phase of each component is adjusted and optimized to obtain the minimum CF and high signal-to-noise ratio (SNR) for the excitation. The primary benefit of this method is its lower CF due to the equally spaced frequency components as compared to the conventional multi-sine signal technique. Therefore, in order to obtain the optimized CF for the proposed perturbation, linearly distributed frequency components with Schroder’s phases are superimposed on the lowest frequency component (100 Hz). The frequency components selected to structure a phased multi-sine perturbation signal with respective Schroeder phases are listed in Table 2.
Table 2.
List of the used frequency components with their Schroeder phases in the proposed phased multi-sine perturbation signal.
The phased multi-sine perturbation signal acquired is represented by Equations (7) and (8). Where is the phased multi-sine signal, n is an integer, is the amplitude, is the optimized Schroeder phase, is the number of samples, m is the number of signals combined, is the sampling frequency, and is the kth signal frequency. The resulting phased multi-sine signal applied to perturb the battery is shown in Figure 3b.
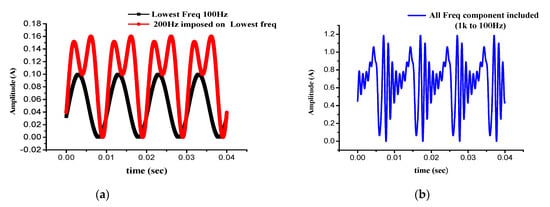
Figure 3.
(a) Lowest frequency 100 Hz, and 200 Hz frequency imposed on lowest frequency 100 Hz. (b) Combined phased multi-sine signal with all frequency components included.
The above phased multi-sine signal is applied to perturb the battery. The battery response (voltage and current signal) is sensed and processed by the Digital Lock-in Amplifier (DLIA). The impedance at each frequency component is calculated. In the proposed technique, two impedance points Z1 and Z2 are selected below and above the zero-crossing of the real axis on the Nyquist impedance plot as shown in Figure 4. Since, the selected impedances Z1 and Z2 are close to the real axis. Therefore, the ohmic resistance Rs can be calculated using the following approach.
where , , , and are the real and imaginary components of the selected impedance Z1 and Z2, respectively. An arbitrary impedance on the straight line between and is . If then . Therefore, the equation for the ohmic resistance Rs is given by Equation (13).
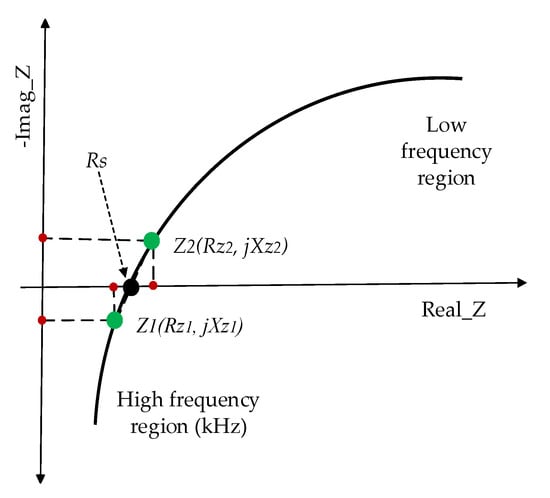
Figure 4.
Proposed technique to calculate the ohmic resistance Rs using Z1 and Z2.
In Figure 5, the procedure of the proposed technique is described. Comparing it with the procedure followed by the conventional EIS method (as shown in Figure 2). It is pointed out that no curve-fitting procedure is required for the proposed technique. Rather, Equation (13) is used to directly calculate the ohmic resistance of a battery. Along with this, a phased multi-sine signal is used to perturb the battery for a specified frequency band (1 kHz to 100 Hz), which makes the measurement speed of the proposed technique multi-times faster than those of the conventional EIS methods.
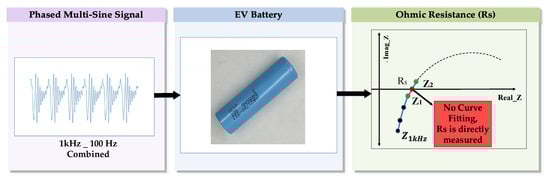
Figure 5.
Procedure of the proposed technique to measure the ohmic resistance of a battery.
4. Hardware and Software Setup for the Proposed Technique
In Figure 6, the block diagram of the hardware setup is given. The main hardware consists of the DSP (FRDMK64F), the perturbation-controlling circuit, sensing and conditioning circuit. The hardware is controlled by the PC using the graphical user interface (GUI) developed in LabVIEW. It is connected to the PC through a USB cable. As the START button is clicked on the GUI, a phased multi-sine signal is generated using a 12-bit internal DAC. The battery perturbation current flowing through the MOSFET is controlled by the phased multi-sine signal applied at the gate. The battery response (voltage and current) is read by the internal ADCs connected to the sensing and conditioning circuit [21].
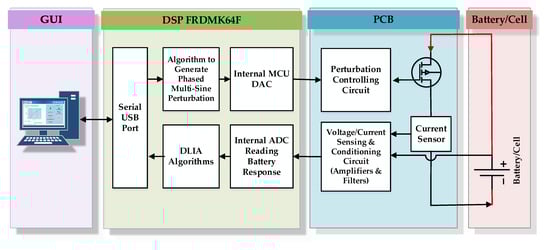
Figure 6.
Block diagram of the hardware to measure the impedance spectrum of the battery.
In Figure 7, the block diagram of the digital lock-in amplifier (DLIA) is given. The DLIA algorithms are divided into three sections. In the first section, the battery response is demodulated by mixing it with reference sine and cosine signals. During the second section, a low-pass filter is applied to extract the in-phase and quadrature components at the specified frequency. In the last section, the magnitudes and phases of the current, voltage, and impedance are calculated.
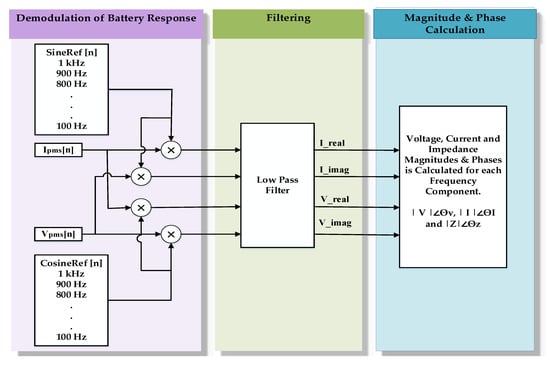
Figure 7.
DLIA block diagram for the impedance calculation.
The mathematical analysis of DLIA is given below. The current response quantized by the ADC is represented by Equation (14) with a phase shift . The reference sine and cosine signals are expressed by Equations (15) and (16) in the discrete-time domain, respectively.
where is the acquired current response of a battery, is the peak amplitude, is the number of samples, is the phase, are the reference signals, and is the peak amplitude. After mixing the acquired current response with the reference signal, the following equations are obtained by using the corresponding trigonometric identities.
where is the real and imaginary components of the acquired current signal, as shown in Equations (17) and (18), respectively. The AC components having two-times the frequency of the reference signal are eliminated by the low-pass filter. Only the DC terms are left, as shown by Equations (19) and (20).
The magnitude and phase of the extracted current and voltage signals are calculated using Equations (21) and (22). Finally, the impedance of the battery at a certain frequency component can be calculated by using Equation (23).
The flowchart of DSP codes for ohmic resistance measurement and LabVIEW GUI is shown in Figure 8. The hardware is detected by LabVIEW GUI through serial port COM. The starting command is sent from GUI to the DSP which generates a phased multi-sine perturbation, and the battery response is readback through ADCs. The DLIA algorithms processed the response of the battery and ohmic resistance Rs is calculated. Results obtained are send to the PC and displayed on the GUI.
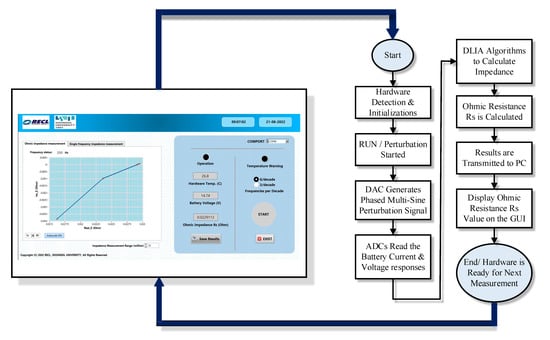
Figure 8.
Flowchart of algorithms to calculate ohmic resistance (Rs) and LabVIEW GUI for the control.
5. Experimental Results and Discussion
In this section, the discussion on the accuracy and validity of the proposed technique is carried out. To verify the accuracy and validity of the proposed method, the results measured are compared with those of the available commercial EIS instrument known as LVEIS manufactured by Batronics Co. Ltd. (Seoul, S.Korea) [29]. Three lithium-ion batteries are tested in the experiment, the experimental setup and the specifications of the batteries are shown in Figure 9 and Table 3 [30], respectively. The ohmic resistance of the mentioned batteries is measured through the 1 kHz AC signal method, LVEIS by Batronics Co. Ltd., and the proposed technique. The results recorded from the experiment are plotted and listed in Figure 10 and Figure 11, Table 4 and Table 5, respectively.
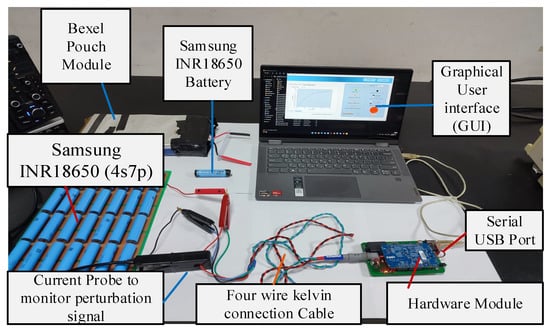
Figure 9.
Experimental setup.
Table 3.
Specification of the batteries used in the experiments.
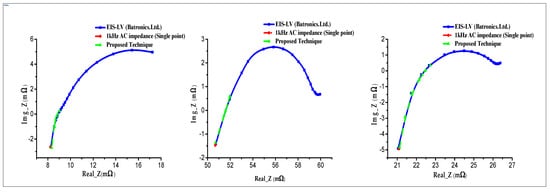
Figure 10.
Comparison of the Nyquist impedance spectrum of Bexel-158309 pouch module, Samsung INR18650, and Samsung INR18650 (4s7p) combination.
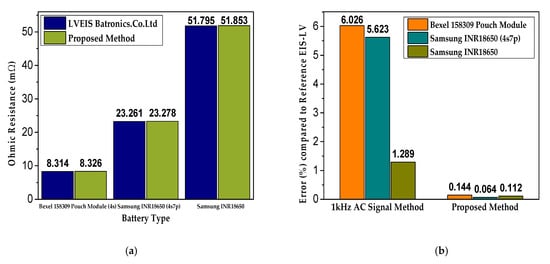
Figure 11.
(a) Comparison of ohmic resistance measured by the proposed technique and commercially available EIS instrument (LVEIS by Batronics Co., Ltd.); (b) percentage (%) error comparison of 1 kHz AC impedance method and the proposed technique with reference commercially available EIS instrument (LVEIS by Batronics Co., Ltd.).
Table 4.
Ohmic resistance Rs measured by LVEIS, 1kHz AC impedance and the proposed technique.
Table 5.
Battery perturbation time comparison between conventional EIS method and the proposed technique.
In Figure 11a, the ohmic resistance Rs measured by the LVEIS instrument, and the proposed technique are compared. Hence, it verifies the accuracy and validity of the proposed technique. The experimental results show that the 1 kHz AC signal method gives large errors as compared to the conventional EIS technique, with more than 5% error for Samsung INR18650 (4s7P) and Bexel Pouch (4s) batteries, as shown in Figure 11b. However, the results obtained through the proposed method are very accurate, with the percentage difference observed being less than 0.15% for all three batteries tested. As shown in Table 5, the battery perturbation time for the proposed method is just 1 sec. While for conventional EIS, the perturbation time is quite high (27 to 87 s). Therefore, the measurement speed of the proposed method is very high compared to the conventional EIS instrument. In addition, there is no need of complex curve-fitting software to extract the ohmic resistance Rs. Thus, it is displayed on the LabVIEW GUI immediately after the test completes. In view of the above advantages of the proposed technique, it is a more feasible solution for the mass testing of lithium-ion batteries and grading than the conventional methods.
6. Conclusions
In this paper, a novel technique is proposed to accurately measure the ohmic resistance of lithium-ion batteries, and a hardware setup is developed based on the proposed technique. The accuracy and validity of the proposed technique are verified by conducting the experiments and comparing the results with those obtained by the commercially available EIS instrument. An error of less than 0.15% is recorded in the ohmic resistance measured by the proposed technique as compared to the results with the conventional EIS method. In contrast, more than 5% error is recorded by the conventional 1 kHz AC signal method. Since the proposed technique uses a phased multi-sine signal with a narrow frequency band (1 kHz to 100 Hz), the battery perturbation time is just 1 sec. Therefore, it is simple and fast as compared to the conventional EIS method. In addition, it directly measures the ohmic resistance without using additional curve-fitting procedures. Therefore, it is a good solution to perform mass battery testing of xEV batteries for grading and quality assurance testing at the battery production line.
Author Contributions
M.S. wrote the original draft manuscript and implemented the prototype of the proposed method and revised the manuscript; W.C. reviewed the manuscript and supervised the research. All authors have read and agreed to the published version of the manuscript.
Funding
This research has been funded by the National Research Foundation of the Republic of Korea (Grant No. NRF2021R1A2C1011504 “Research on the High-Speed Multichannel Impedance Spectroscopy Technique for Battery Performance Evaluation”).
Data Availability Statement
Not applicable.
Conflicts of Interest
The authors declare no conflict of interest.
Appendix A

Figure A1.
Battery impedance spectrum acquired at different charging–discharging cycles [31].

Figure A2.
Relation between change in ohmic resistance and battery capacity loss [32].

Figure A3.
HIOKI battery tester (BT3554) to measure 1 kHz AC impedance of a battery [33].
References
- Pardhi, S.; Chakraborty, S.; Tran, D.-D.; El Baghdadi, M.; Wilkins, S.; Hegazy, O. A Review of Fuel Cell Powertrains for Long-Haul Heavy-Duty Vehicles: Technology, Hydrogen, Energy and Thermal Management Solutions. Energies 2022, 15, 9557. [Google Scholar] [CrossRef]
- Miskiewicz, R. Clean and Affordable Energy within Sustainable Development Goals: The Role of Governance Digitalization. Energies 2022, 15, 9571. [Google Scholar] [CrossRef]
- Xiong, R.; Zhang, Y.; Wang, J.; He, H.; Peng, S.; Pecht, M. Lithium-Ion Battery Health Prognosis Based on a Real Battery Management System Used in Electric Vehicles. IEEE Trans. Veh. Technol. 2019, 68, 4110–4121. [Google Scholar] [CrossRef]
- Harper, G.; Sommerville, R.; Kendrick, E.; Driscoll, L.; Slater, P.; Stolkin, R.; Walton, A.; Christensen, P.; Heidrich, O.; Lambert, S.; et al. Recycling lithium-ion batteries from electric vehicles. Nature 2019, 575, 75–86. [Google Scholar] [CrossRef] [PubMed]
- Sun, Q.; Lv, H.; Wang, S.; Gao, S.; Wei, K. Optimized State of Charge Estimation of Lithium-Ion Battery in SMES/Battery Hybrid Energy Storage System for Electric Vehicles. IEEE Trans. Appl. Supercond. 2021, 31, 4–9. [Google Scholar] [CrossRef]
- Janota, L.; Králík, T.; Knápek, J. Second Life Batteries Used in Energy Storage for Frequency Containment Reserve Service. Energies 2020, 13, 6396. [Google Scholar] [CrossRef]
- Montes, T.; Etxandi-Santolaya, M.; Eichman, J.; Ferreira, V.J.; Trilla, L.; Corchero, C. Procedure for Assessing the Suitability of Battery Second Life Applications after EV First Life. Batteries 2022, 8, 122. [Google Scholar] [CrossRef]
- Strickland, D.; Chittock, L.; Stone, D.; Foster, M.; Price, B. Estimation of Transportation Battery Second Life for Use in Electricity Grid Systems. IEEE Trans. Sustain. Energy 2014, 5, 795–803. [Google Scholar] [CrossRef]
- Martinez-Laserna, E.; Sarasketa-Zabala, E.; Sarria, I.V.; Stroe, D.-I.; Swierczynski, M.; Warnecke, A.; Timmermans, J.-M.; Goutam, S.; Omar, N.; Rodriguez, P. Technical Viability of Battery Second Life: A Study From the Ageing Perspective. IEEE Trans. Ind. Appl. 2018, 54, 2703–2713. [Google Scholar] [CrossRef]
- Hossain, E.; Murtaugh, D.; Mody, J.; Faruque, H.; Sunny, M.H.; Mohammad, N. A Comprehensive Review on Second-Life Batteries: Current State, Manufacturing Considerations, Applications, Impacts, Barriers & Potential Solutions, Business Strategies, and Policies. IEEE Access 2019, 7, 73215–73252. [Google Scholar] [CrossRef]
- Salek, F.; Resalati, S.; Morrey, D.; Henshall, P.; Azizi, A. Technical Energy Assessment and Sizing of a Second Life Battery Energy Storage System for a Residential Building Equipped with EV Charging Station. Appl. Sci. 2022, 12, 11103. [Google Scholar] [CrossRef]
- Zou, Y.; Hu, X.; Ma, H.; Li, S.E. Combined State of Charge and State of Health estimation over lithium-ion battery cell cycle lifespan for electric vehicles. J. Power Sources 2015, 273, 793–803. [Google Scholar] [CrossRef]
- Zhao, D.; Ge-Zhang, S.; Zhang, Z.; Tang, H.; Xu, Y.; Gao, F.; Xu, X.; Liu, S.; Zhou, J.; Wang, Z.; et al. Three-Dimensional Honeycomb-Like Carbon as Sulfur Host for Sodium-Sulfur Batteries without the Shuttle Effect. ACS Appl. Mater. Interfaces 2022, 14, 54662–54669. [Google Scholar] [CrossRef]
- Bo, R.; Zhang, F.; Bu, S.; Nasiri, N.; Di Bernardo, I.; Tran-Phu, T.; Shrestha, A.; Chen, H.; Taheri, M.; Qi, S.; et al. One-Step Synthesis of Porous Transparent Conductive Oxides by Hierarchical Self-Assembly of Aluminum-Doped ZnO Nanoparticles. ACS Appl. Mater. Interfaces 2020, 12, 9589–9599. [Google Scholar] [CrossRef]
- Jaguemont, J.; Boulon, L.; Venet, P.; Dubé, Y.; Sari, A. Lithium-Ion Battery Aging Experiments at Subzero Temperatures and Model Development for Capacity Fade Estimation. IEEE Trans. Veh. Technol. 2016, 65, 4328–4343. [Google Scholar] [CrossRef]
- Zhao, D.; Zhang, Z.; Ren, J.; Xu, Y.; Xu, X.; Zhou, J.; Gao, F.; Tang, H.; Liu, S.; Wang, Z.; et al. Fe2VO4 nanoparticles on rGO as anode material for high-rate and durable lithium and sodium ion batteries. Chem. Eng. J. 2023, 451, 138882. [Google Scholar] [CrossRef]
- Atalay, S.; Sheikh, M.; Mariani, A.; Merla, Y.; Bower, E.; Widanage, W.D. Theory of battery ageing in a lithium-ion battery: Capacity fade, nonlinear ageing and lifetime prediction. J. Power Sources 2020, 478, 229026. [Google Scholar] [CrossRef]
- El Mejdoubi, A.; Chaoui, H.; Gualous, H.; Van Den Bossche, P.; Omar, N.; Van Mierlo, J. Lithium-Ion Batteries Health Prognosis Considering Aging Conditions. IEEE Trans. Power Electron. 2019, 34, 6834–6844. [Google Scholar] [CrossRef]
- Cho, Y.K.; Jeong, Y.M.; Ahn, J.H.; Ryu, S.H.; Lee, B.K. A new SOC estimation algorithm without integrated error using DCIR repetitive calculation. In Proceedings of the 2014 17th International Conference on Electrical Machines and Systems (ICEMS), Hangzhou, China, 22–25 October 2014; pp. 865–870. [Google Scholar] [CrossRef]
- Christophersen, J.P. Battery Test Manual For Electric Vehicles, Revision 3; Idaho National Laboratory: Idaho Falls, ID, USA, 2015. [Google Scholar] [CrossRef]
- Rahim, G.; Choi, W. A Portable Impedance Spectroscopy Instrument for the Measurement of the Impedance Spectrum of High Voltage Battery Pack. J. Korean Inst. Power Electron. 2021, 26, 192–198. [Google Scholar] [CrossRef]
- Hioki, E.E. Corporation. Electrical Measurements of Lithium-Ion Batteries. 2020. Available online: https://hiokiusa.com/wp-content/uploads/2020/05/A_UG_BT0001E01.pdf (accessed on 4 January 2023).
- Barai, A.; Uddin, K.; Widanage, W.; McGordon, A.; Jennings, P. A study of the influence of measurement timescale on internal resistance characterisation methodologies for lithium-ion cells. Sci. Rep. 2018, 8, 21. [Google Scholar] [CrossRef]
- Barai, A.; Chouchelamane, G.; Guo, Y.; McGordon, A.; Jenning, P.S. A study on the impact of lithium-ion cell relaxation on electrochemical impedance spectroscopy. J. Power Sources 2015, 280, 74–80. [Google Scholar] [CrossRef]
- Sihvo, J.; Roinila, T.; Stroe, D.I. Novel Fitting Algorithm for Parametrization of Equivalent Circuit Model of Li-Ion Battery from Broadband Impedance Measurements. IEEE Trans. Ind. Electron. 2021, 68, 4916–4926. [Google Scholar] [CrossRef]
- Farooq, F.; Lee, S.J.; Choi, W. Development of the High Voltage EIS Instrument for the Evaluation of the Residual Useful Life of the Batteries. Proc. KIPE Conf. 2019, 11, 216–217. [Google Scholar]
- Schweiger, H.-G.; Obeidi, O.; Komesker, O.; Raschke, A.; Schiemann, M.; Zehner, C.; Gehnen, M.; Keller, M.; Birke, P. Comparison of Several Methods for Determining the Internal Resistance of Lithium Ion Cells. Sensors 2010, 10, 5604–5625. [Google Scholar] [CrossRef]
- Althoff, H.; Eberhardt, M.; Geinitz, S.; Linder, C. Advances in Crest Factor Minimization for Wide-Bandwidth Multi-Sine Signals with Non-Flat Amplitude Spectra. Comput. Sci. Math. Forum 2022, 2, 11. [Google Scholar] [CrossRef]
- Batronics Co. Ltd. Available online: http://recl.ssu.ac.kr/ (accessed on 28 December 2023).
- Specification of Product. Lithium-Ion Rechargeable Cell for Power Tools. Model Name: INR18650-25R. Available online: https://dalincom.ru/datasheet/SAMSUNG%20INR18650-25R.pdf (accessed on 24 January 2023).
- Galeotti, M.; Cinà, L.; Giammanco, C.; Cordiner, S.; Di Carlo, A. Performance analysis and SOH (state of health) evaluation of lithium polymer batteries through electrochemical impedance spectroscopy. Energy 2015, 89, 678–686. [Google Scholar] [CrossRef]
- Wang, T.; Pei, L.; Wang, T.; Lu, R.; Zhu, C. On-Board State-of-Health Estimation at a Wide Ambient Temperature Range in Lithium-Ion Batteries. Energies 2015, 8, 8467–8481. [Google Scholar] [CrossRef]
- BATTERY TESTER BT3554 (Bluetooth® not installed). Available online: https://www.hioki.com/global/products/resistance-meters/battery/id_6614 (accessed on 29 January 2023).
Disclaimer/Publisher’s Note: The statements, opinions and data contained in all publications are solely those of the individual author(s) and contributor(s) and not of MDPI and/or the editor(s). MDPI and/or the editor(s) disclaim responsibility for any injury to people or property resulting from any ideas, methods, instructions or products referred to in the content. |
© 2023 by the authors. Licensee MDPI, Basel, Switzerland. This article is an open access article distributed under the terms and conditions of the Creative Commons Attribution (CC BY) license (https://creativecommons.org/licenses/by/4.0/).