Article

Performance Characteristic Analysis of Metallic and Non-Metallic Oxide Nanofluids for a Compound Parabolic Collector: Improvement of Renewable Energy Technologies in Buildings

1
Department of Energy Engineering, University of Engineering and Technology, Taxila 47050, Pakistan
2
Department of Mechanical Engineering, University of Engineering and Technology, Taxila 47050, Pakistan
3
Department of Mechanical Engineering, International Islamic University, Islamabad 44000, Pakistan
4
Facultad de Ingeniería, Universidad Autónoma de Yucatán, Av. Industrias No Contaminantes por Anillo Periférico Norte, Apdo. Postal 150, Cordemex, Mérida 97203, Mexico
5
Departamento de Sistemas y Computación, Tecnológico Nacional de México/IT de Mérida, Mérida 97118, Mexico
6
Faculty of Science and Technology, Jan Dlugosz University in Czestochowa, Armii Krajowej 13/15, 42-200 Czestochowa, Poland
*
Authors to whom correspondence should be addressed.
Energies 2023, 16(3), 1298; https://doi.org/10.3390/en16031298
Submission received: 17 December 2022 / Revised: 16 January 2023 / Accepted: 19 January 2023 / Published: 26 January 2023
(This article belongs to the Topic Sustainable Energy Technology, 2nd Volume)

Abstract

:
The building sector is targeting net-zero emissions through the integration of renewable energy technologies, especially for space cooling and heating applications. In this regard, the use of solar thermal concentrating collectors is of vital importance. The performance of these collectors increases by using an efficient fluid such as a nanofluid due to their high thermal conductivity. This research addresses the preparation, stability analysis, and characterisation of metallic and non-metallic oxide nanofluids and their experimental analysis in a compound parabolic collector (CPC) system. Five different combinations of nanofluids are used with different volumetric concentrations (0.025%, 0.05%, and 0.075%) including multi-wall carbon nanotube with water (MWCNT–H2O), multi-wall carbon nanotube with ethylene glycol (MWCNT–EG), aluminium oxide with water (Al2O3–H2O), aluminium oxide with ethylene glycol (Al2O3–EG), and magnesium oxide with ethylene glycol (MgO–EG). The prepared nanofluids are characterised in terms of thermal conductivity and viscosity. Detailed experimentation is performed to investigate the CPC system integrated with the nanofluids. The results obtained from the detailed characterisation of the MWCNT–H2O nanofluid showed that the nanofluids have a 37.17% better thermal conductivity than distilled water as a primary fluid, and the MWCNT–EG nanofluid has demonstrated an increase in viscosity by 8.5% compared to ethylene glycol (EG). The experimental analysis revealed that the thermal efficiency of the collector integrated with the MWCNT–H2O nanofluid is increased by 33% compared to water. Meanwhile, the thermal efficiency of the collector with MWCNT–EG was increased by 24.9% compared to EG. Moreover, a comparative analysis among metallic nanofluids was also performed, i.e., Al2O3–H2O, Al2O3–EG, and MgO–EG. In each case, the thermal efficiency of the collector was recorded, which was greater than the base fluid by percentages of 29.4%, 22.29%, and 23.1%, respectively. The efficiency of non-metallic nanofluids is better than metallic nanofluids by 7.7%. From the obtained results, it can be concluded that the CPC system performed best with MWCNT–H2O compared to any other combination of nanofluids.

1. Introduction

Due to the global climate change, emphasis is now on clean energy sources. Clean energy sources are not only environmentally friendly by playing an essential role in controlling the rampant global warming but are also cheap in comparison to the conventional sources of energy. Solar energy is a sustainable energy source that has the potential to be used to meet the industrial/domestic heating and power generation demands [1]. The potential for solar energy is enormous in Pakistan and its neighbouring countries, such as Iran, Afghanistan, and India. Pakistan, for instance, has a potential for direct normal solar radiation of 5.5 kWh/m2/day on average annually [2]. Throughout the year, there are almost 300 sunny days, with around 8 h of sunshine per day, especially in the Baluchistan region, with an average daily direct normal solar irradiation of roughly 6–6.5 kWh/m2/day [3].
With the rising population and increasing demand for energy and power in the domestic sector, integrating efficient solar technologies in the building sector can significantly lessen the need for fossil fuel-driven heating applications [4,5,6]. For solar thermal applications, different types of solar collectors have been used to gather solar energy with the ability to transform it into a useful output. Low-temperature applications employ flat and evacuated tube collectors, whereas low-to-medium-temperature applications use compound parabolic collectors. Among the concentrating collectors, the parabolic trough collector is a proven industrial-scale heat generation technology [7]. Thermal enhancement technologies such as modifying absorber tubes and/or using nanofluids rather than standard/normal fluids can improve heat transmission between the working fluid and the absorber tube. Applications of nanotubes can also be found in adsorption cooling and desalination systems, as they have the potential to enhance their performance [8,9,10]. Nanofluids usually have higher density, viscosity, and thermal conductivity than traditional fluids such as water, but a lower specific heat capacity. One of the positives is increased heat conductivity, while one of the negatives is the greater viscosity of nanofluids. When nanofluids are used, the required pumping power increases [11].
Extensive literature is available on the application of nanofluids in solar energy usage. The use of nanofluid as SFT has shown potential, for instance, for a collector area of 0.828 m2 having a concentration ratio of 4.17, the performance of the Al2O3–H2O nanofluid in CPC has been reported. The length of the evacuated tubes used for the experimentation was 1.85 m. A temperature difference of 10 °C resulted in a 19% increase in efficiency compared to water as a heat-transfer fluid [12]. Another study examined MWCNTs with plasma and acid-functionalised groups for high-temperature applications with temperatures up to 150 °C when dispersed in propylene glycol and Therminol-55 [13]. Acacia gum and oleic acid were utilised as the surfactants for the water and Therminol-66, respectively, in the two-step procedure used to prepare MWCNT–water and Therminol-66 nanofluid with weight concentrations from 0.05% to 0.5%. The water and Therminol-66-based nanofluids with 0.5% weight concentration had maximum thermal conductivities of 35.7% and 37.67%, respectively [14].
In evacuated tube solar collectors, MWCNT-water nanofluid has been employed with weight fractions of 0.005%, 0.01%, and 0.05%. At a flow rate of 1 L/min with the 0.05 wt% MWCNT–water nanofluid, the maximum average energy and exergy efficiency were 55% and 10%, respectively [15]. This study produced Al2O3–solar glycol + water-based nanofluids at three different volumetric concentrations, namely 0.15%, 0.35%, and 0.45%, with ultrasonication times ranging from 30 to 70 min. As a surfactant, oleic acid is employed to improve the stability of the nanofluid. A UV–Vis spectrophotometer, zeta potential, and visual examination are used to establish the nanofluid’s stability. The nanofluids have a shelf life of over 45 days [16]. The preparation of nano-PCM by dispersing functionalised graphene nanoplatelets with deionised water was investigated as the impact of volumetric flow rates and heat transfer fluid (HTF) input temperature on the total charging and discharging time of a 35-spherical energy storage tank. The most significant decrease in overall charging and discharging time for various HTF settings is, respectively, 18.26% and 22.81%. The amount of latent heat energy stored is approximately 5.5 times greater than the amount of sensible heat stored at the HTF temperature of 4 °C. A total energy recovery of 2637 kJ, or 85.89%, of the actual energy stored (3070 kJ) in the storage tank, is recorded during the discharging process [17]. In this work, multi-walled carbon nanotubes based on Therminol-55 are synthesised at volumetric concentrations of 0.09, 0.18, and 0.3 vol% with ultrasonication periods ranging from 30 to 120 min. An increase in the sonication period of up to 120 min improves the colloidal stability of the nanofluid. The colloidal stability of the nanofluid was tested one month after formulation using a zeta potential investigation and a visual inspection approach [18]. SWCNT–DI water nanofluids with concentrations of 0.05, 0.1, and 0.2 vol% were employed in evacuated tube solar collectors. At a 0.2 vol% SWCNT–DI water nanofluid concentration, the highest efficiency enhancement was reported to be 10% [19]. Another research study investigated the MWCNT–water nanofluid with nanoparticles of diameter 10–40 nm having 29 nm length to test the efficiency of a flat-plate solar collector at 0.01, 0.05, and 0.1 wt% concentrations. MWCNT–water nanofluids with 0.01, 0.05, and 0.1 wt% concentrations at a 1.5 L/min flow rate enhanced efficiency by 16%, 21%, and 34.13%, respectively [20]. A prepared SWNT–water nanofluid was employed in an evacuated tube solar collector at flow rates of 0.008, 0.017, and 0.025 kg/s with volume concentrations of 0.05, 0.1, and 0.2 vol%. The experiment followed the guidelines of ASHRAE Standard 93–2003 [21]. The highest collector efficiency for the SWCNT–water nanofluid at a flow rate of 0.025 kg/s is reported at 93.43% with 0.02 vol% and 71.84% [22]. In flat-plate solar collectors, SWNCT–water nanofluids at concentrations of 0.1 and 0.3 vol% were utilised with sodium dodecyl sulphate as a surfactant. Compared to water, which had maximum energy and exergy efficiencies of 42.07% and 8.77%, respectively, the flat-plate solar collector’s energy and exergetic efficiencies are reported to increase up to 95.12% and 26.25%, respectively [23]. The discussion on the use of different materials (both metals and non-metals) for the preparation of nanofluids is primarily linked with the enhancement of thermal conductivity caused by the nanoparticles. In this regard, Table 1 provides a comprehensive summary of the thermal conductivity of metallic and non-metallic oxide nanofluids as reported in different literature and research works.
Water-based nanofluids comprising different nanoparticles including CuO, Al2O3, TiO2, SiO2, MWCNTs, and GNP, are reportedly used in flat-plate solar collectors with a 0.75% volume concentration at a flow rate of 0.025 kg/s. The highest energy efficiencies of the collector for MWCNT–water, GNP–water, CuO–water, Al2O3–water, TiO2–water, and SiO2–water are reported as 23.47%, 16.97%, 12.64%, 8.28%, 5.09%, and 4.08%, respectively [24]. In another study, a stable MWCNT–water nanofluid is employed in the parabolic trough collector to study the thermal energy gain by the MWCNT–water nanofluid by 5.2%, 7.3%, and 7.2%, compared to water at flow rates of 0.0069, 0.0138, and 0.0207 kg/s, respectively [25]. In liquid flat-plate solar collectors, the GGNP–water nanofluid with weight concentrations of 0.025%, 0.05%, and 0.1% was utilised at flow rates of 0.8, 1.2, and 1.5 L/min, respectively. With 0.1 wt% of GGNPs and at 1.5 L/min flow rate, the maximum efficiency improvement for liquid flat-plate solar collectors is reported at 24.09% [26]. Using 0.05 wt% of MWCNT–water nanofluid in both evacuated tubes and flat-plate collectors, another study reported the maximum average energy efficiencies of 95% and 55% for flat-plate and evacuated tube, respectively, at a 0.020 kg/ms flux rate [27]. The stable SWCNT–Therminol® nanofluid is also used in another study as a working fluid for a parabolic trough solar collector at 0.25, 0.5, 1, and 2.5% volumetric concentrations. A thermal efficiency increase up to 4.4% is reported for up to 2.5 vol% of nanoparticles concentration at a 28 m3 h−1 flow rate [28]. While comparing metallic and non-metallic nanoparticles, a research study used water-based carbon and metallic oxides nanofluids in a flat-plate solar collector with various volume fractions (0.25, 0.5, 0.75, and 1 vol%) at 0.0085, 0.017, and 0.0255 kg/s mass flow rates. The highest efficiencies were 64.45%, 67.03%, 72.45%, and 76.56% for SiO2–water, Al2O3–water, Gr–water, and GNPs–water, respectively [29].
For non-water-based nanofluids, a study utilised a stable alcohol-based TiO2 nanofluid as a heat-transfer fluid in heat pipes. The investigation claims a 10.60% thermal efficiency at a 0.10 vol% TiO2 nanoparticles concentration, which is reportedly higher than alcohol as a working fluid [30]. Another investigation on the blending metallic and non-metallic nanoparticles reported used of MWCNT–Fe3O4 dispersion in distilled water with 0.1% and 0.3% particle concentrations, respectively. Hybrid nanofluids offer controllable variation of thermal conductivity with different hybridisation ratios. The maximum increase in thermal conductivity was observed at 60 °C with a 0.3% particle concentration in the base fluid [31]. Another reported result used a refrigerant-based TiO2 nanofluid with a 0.1% nanoparticles concentration. The heat pipe used for the investigation was a straight copper tube with an outside diameter of 15.600 mm, and it was tilted at an angle of 60°. Heat pipe efficiency is reportedly 1.40 times greater than that of pure refrigerant as a working fluid [32].
For the solar thermal collector application, different hybridisation and variations of nanofluids have been reported as heat-transfer fluids. In this regard, numerous observations of successful use of different hybrid and mono nanofluids are reported in the literature. For instance, a research work used stable Al2O3–water and TiO2–water nanofluids at the same concentration of 0.1 wt%. Using the simple nanofluids Al2O3–water, TiO2–water, and a combination of these two nanofluids (hybrid), each expressed a maximum thermal efficiency improvement of 19%, 21%, and 26%, respectively [33]. In a research study, an Al2O3–water nanofluid with volume concentrations varying in the range of 1–3% was employed in a “two-phase” closed thermosyphon. When the Al2O3–water nanofluid was used instead of pure water, the maximum efficiency was raised by 14.7%. [34]. One study employed direct-absorption solar parabolic trough collectors with a 0.2 vol% Al2O3–0.008 vol% CuO–water hybrid nanofluid. The greatest thermal efficiency of the solar collector was 48.03% [35]. Stable Fe3O4 (EG–water) nanofluids were used in FPSC at 0.2, 0.6, and 1.0 vol% concentrations. A maximum efficiency improvement of 15.27% at 1.0 vol% Fe3O4 with a flowrate of 30 L/h was recorded [36]. In another research, the CeO2–distilled water nanofluid was utilised in flat-plate solar collectors with particle concentrations of 0.0167%, 0.0333%, and 0.0666% by vol. A maximum collector efficiency improvement of 10.74% was noted for the 0.066% CeO2–water-nanofluid [37]. In FPSC, the Al2O3–water nanofluid with nanoparticle concentrations of 0.1, 0.5, 1, 2, and 3 vol% was employed. The maximum efficiency enhancement was of 18% at high-temperature differences [38]. In a separate study, the stable MgO–distilled water nanofluid with weight concentrations of 0.25, 0.5, 0.75, 1.0, 1.25, and 1.5 wt% was utilised in FPSC. The maximum thermal conductivity was of 9.34%, and the maximum exergy efficiency was of 32.23% for a 0.75 vol% nanoparticle concentration at 1.5 L/min flow rate [39]. In a different application, Al2O3–water nanofluid was utilised in a direct-absorption solar collector with concentrations of 0.001, 0.005, 0.01, and 0.05 vol%. The highest increase in efficiency was of 39.6% for the 0.05 vol% Al2O3–water nanofluid [40]. In another research study, the CuO–water dispersed nanofluid with 3% volumetric concentration was used in FPSC. A 38.5% maximum enhancement in efficiency was noted [41]. The above-mentioned literature provides a great deal of overview on the successful use of hybrid and mono nanofluids with a focus on solar thermal applications. In this regard, Table 2 summarises the literature studies on the stability of metallic oxides, non-metallic oxides, and hybrid nanofluids as a comprehensive guide.
It is evident from the literature mentioned above that nanofluids are integrated into solar collectors for the enhancement of thermal efficiency. However, it is clear from the extensive literature review that no study is reported related to comparative experimental and characteristic analysis of metallic and non-metallic-based nanofluids with multiple base fluids (water and ethylene glycol) in CPC applications. A single comparative ground basis/application for different types of nanofluids (with varying particle types, ratios, and base fluids) is required for future reference. Therefore, in this study, the stability and characterisation of metallic and non-metallic oxide-based nanofluids are investigated here. Moreover, the experimental investigation of CPC is carried out at two different flow rates of 0.025 kg/s and 0.015 kg/s by using nanofluids based on metallic and non-metallic oxides (MWCNT–H2O, MWCNT–EG, Al2O3–H2O, Al2O3–EG, MgO–EG) with multiple volumetric concentrations, i.e., 0.025%, 0.05%, and 0.075% as primary heat-absorbing fluids for the subtropical climate conditions. At the same flow rates, the results are also compared to conventional fluids such as water and ethylene glycol.

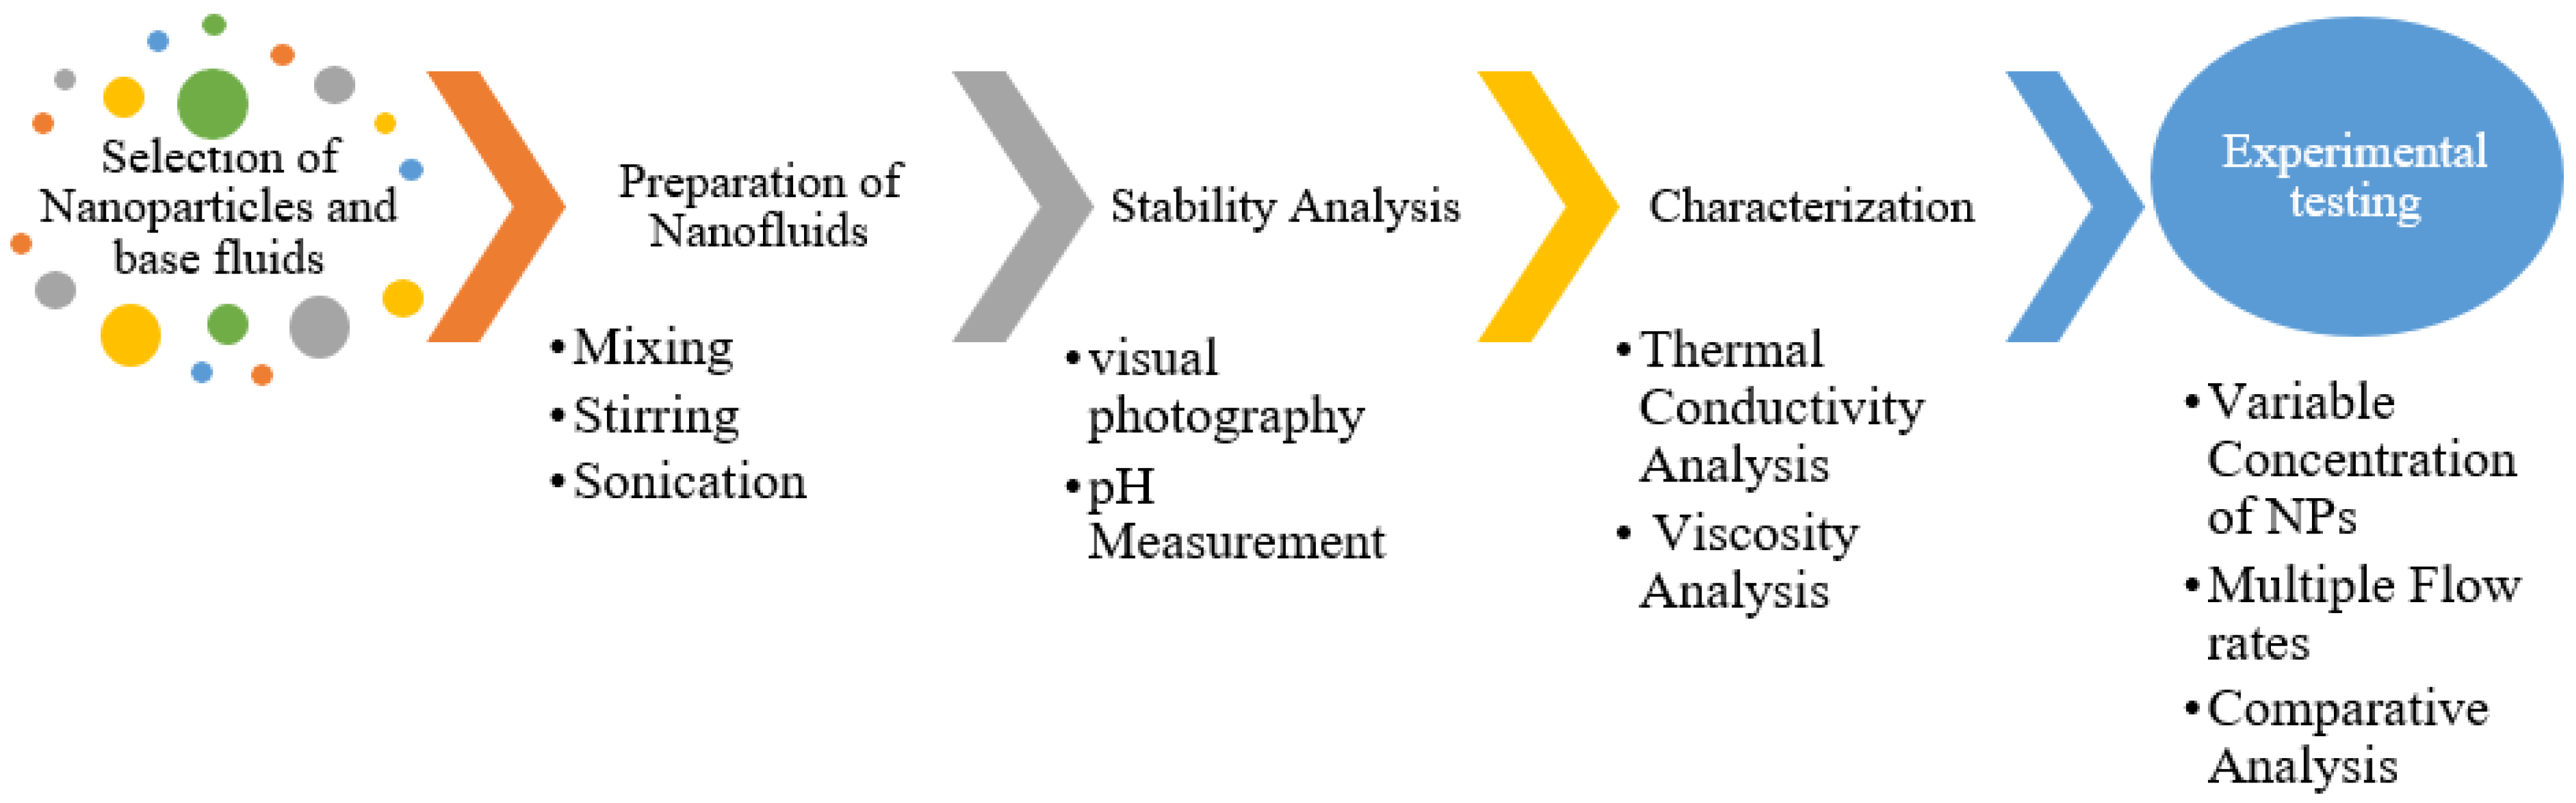
2. Materials and Methods: Selection and Preparation of Nanofluids

This section discusses nanoparticle selection, base fluids, the nanofluid preparation method, and colloidal suspension characterisation. Additionally, the experimental setup and the main performance measures used to estimate the performance of CPC solar collectors are described. Figure 1 shows a flow diagram of the research activities. Testing in CPC is based on various flow rates and nanoparticle concentrations. The tested nanofluids are compared to determine the best choice for CPC collectors.

2.1. Selection of Nanoparticles

The nanoparticles are chosen based on two essential criteria: nanoparticle viscosity and thermal conductivity, after dispersion in conventional heat-transfer fluids. MgO nanoparticles exhibit the greatest thermal conductivity gain, lowest viscosity, and highest thermal conductivity among other metallic oxide-based nanofluids. When ethylene glycol is utilised as the base fluid, Al2O3 nanoparticles perform better than MgO and other different metallic oxide-based nanofluids. Moreover, in non-metallic nanoparticles, MWCNT offers relatively higher thermal conductivity, low viscosity, and density. Distilled water and ethylene glycol were chosen as the base fluids for these three nanoparticles. US Research Nanomaterials, Inc. provided pure nanoparticles with a 20 nm average diameter. Table 3 contains a list of the nanoparticles’ properties.

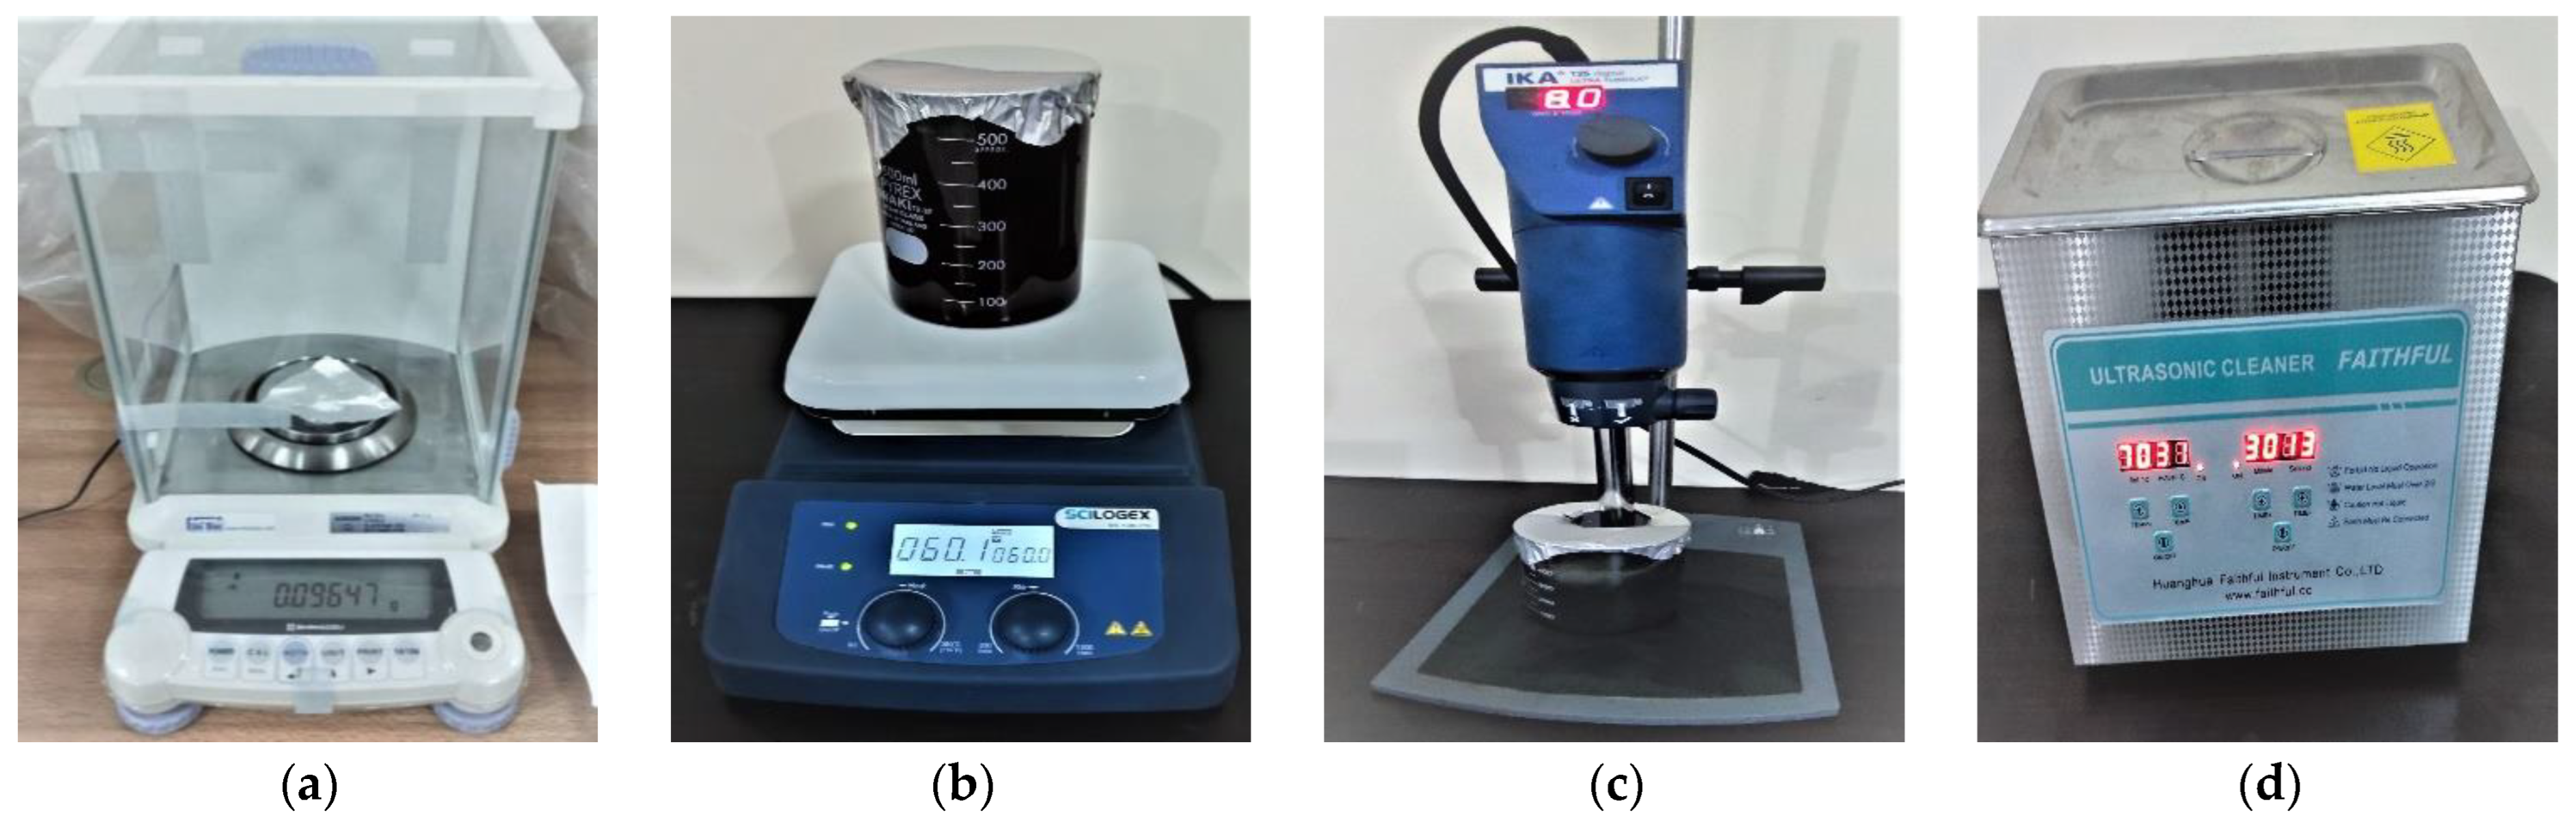
2.2. Preparation of Nanofluids

The current study used a two-step process for synthesising nanofluids. An ultrasonic bath, a magnetic stirrer, and an Ultra-Turrax shear homogeniser are employed in the preparation process to synthesise nanofluids such as MWCNT–H2O, MWCNT–EG, Al2O3–H2O, Al2O3–EG, and MgO–EG at different volumetric concentrations (0.025, 0.05, and 0.075%).
First, a precise analytical digital scale with 0.01 mg accuracy was used to calculate the weight of the nanoparticles. Nanoparticles were placed into the base fluids and physically mixed with a glass stirring rod before being dispersed into the base fluids using a magnetic stirrer at 60 °C and up to 900 rpm. The Ultra-Turrax shear homogeniser is utilised at high rpm to better homogenise the mixture. Sodium dodecyl benzene sulphonate (SDBS) is presently used as a surfactant in nanofluids and in a bath sonicator for up to two to three hours at a frequency of 40 kHz to erase the clustering of the nanoparticles. Table 4 shows the complete specifications of the instruments utilised in this study to synthesise the nanofluids. Figure 2 represents the step-by-step preparation of the nanofluids. In order to reduce the harmful effects of surfactant addition, the surfactant is used in precise quantities since many researchers have found that too much surfactant causes foaming on the surface of the nanofluids, which is a barrier to improving their overall efficiency. The anionic surfactant called SDBS is also utilised to stabilise nanomaterials, as suggested in the literature. It is compatible with water and EG [62,63,64]. All the nanofluids are prepared without adjusting the pH. Table 5 shows the detailed equipment operating speed, temperature, time, and stability duration of the nanofluids used in this study.

2.3. pH Measurement

The pH measures the relative amount of free hydrogen (H+) and hydroxyl (OH-) ions in the water. The amount of hydrogen and hydroxyl ions present determines the water’s acidity or basicity. The water is assumed to be neutral at a pH of 7.0 and is a critical indicator for investigating water purity. The pH of aqueous-based nanofluids is directly influenced by the nanoparticle concentration, and it fluctuates in relation to the sedimentation and aggregation of nanoparticles within the host base fluids. The relative change in pH can be used as a standard tool for assessing nanofluid dispersion stability. The pH of the nanofluids was carefully monitored over time while avoiding any disruption of the nanofluids, and the temperature of the nanofluid samples was kept constant at 30 °C. The concentration of nanoparticles inside the materials under study was measured throughout using standard samples of nanofluids with known concentrations and the associated pH as a reference. The stability of the nanofluids’ dispersion is significantly impacted by the pH of the colloidal system. Due to the fact that very low pH (especially less than 4.0) or high pH (typically more than 9.0) may cause corrosion and cause heat transfer devices to malfunction, neutral nanofluids are preferred. In any nanofluids system, corrosion is likely to introduce impurities, which lowers the stability of the nanofluids and limits their thermal performance. The inner area (stern layer) and the outer region of the base fluid surrounding the nanoparticles are separated by a thin layer (diffuse layer). At the intersection of these two layers, there is a potential known as zeta potential [65]. The zeta potential, which shows the electrical charge density on the surface of the nanoparticles, is closely related to the pH of the fluid. The strength of the attractive or repulsive forces between particles depends on the density of electrical charges on their surfaces. These forces vary with any pH shift, which interferes with the stability of the nanofluids. Nanoparticles have no net electrical charge at a specific pH level, and the associated zeta potential is zero. The electrostatic forces between the nanoparticles are no longer strong enough to keep them apart at this point. This point is referred to as the system’s point of zero charge (PZC) or isoelectric point (IEP). At this point, the zeta potential is strong, particle clotting is almost negligible, nanoparticle aggregation and sedimentation are at their highest at pH levels far from IEP, and a stable suspension results. The stability of the nanofluids can be impacted by the concentration of nanoparticles and the inclusion of surfactants, which can change the pH of the nanofluids from the corresponding IEP. The IEP values for Al2O3, MgO, and MWCNT nanofluids are 9.2, 13.0, and 4.0, respectively [66]. According to the figure, the calculated values had an error of up to 0.002 pH. The main details of the pH meter’s specifications are listed in Table 4. It demonstrates the measuring system’s maximum accuracy and the accuracy of the results recorded for the correct assessment of nanofluid stability using this method.

2.4. Thermal Conductivity Measurement

It is still challenging to assess the nanofluids’ thermal conductivity with sufficient accuracy. Therefore, the techniques used to calculate thermal conductivity must have as low errors and uncertainties as possible. Another source of contradictory results is convection errors in the liquid medium. Hence, the measurement duration should be kept as short as possible to avoid this problem. The transient hot wire (THW) technique has drawn the best consideration of all the described methods due to its high accuracy; it measures rapidly and records repeatable data. Conduction distributes heat from the sensor submerged in the nanofluid to the surrounding area. The nanofluid’s thermal conductivity determines the temperature increase caused by this heat input. A thermal conductivity result will be more reliable if the device’s measured error is less than 0.01 or 1.0%. Convection errors can be reduced or eliminated by placing the sensor probe vertically in the centre of the sample holder and establishing a thermally and acoustically stable environment around the sample holder. Using the thermal properties analyser TEMPOS (Meter Group, USA), the thermal conductivity of metallic and non-metallic oxide nanofluids was calculated in this study, known as KD2 Pro [67]. For an accurate assessment of the thermal conductivity of nanofluids, each measurement was taken 4–6 times, and the average of the data was utilised for the study. The KS-3 sensor was used in this experiment. The main technical details of the KS-3 thermal analyser and sensor are shown in Table 4. A special stainless-steel sensor called the TEMPOS KS-3 is designed to measure the thermal conductivity of the nanofluids. The sensor was validated with a known thermal conductivity glycerin solution to obtain reliable thermal conductivity measurements. The calibration findings revealed a less than 1.0% inaccuracy. The nanofluid sample container has the sensor vertically positioned in the middle of it.

2.5. Viscosity Measurement

Nanofluid viscosity is critical because it causes a significant pressure to drop in heat-transfer equipment and requires more pumping power. The measurement of the viscosity of the nanofluids with sufficient accuracy is a complex issue, and researchers have employed many types of viscosity-measuring tools to accomplish this. Viscometers and rheometers are well-known devices used to measure the viscosity of nanofluids. Each instrument has its drawbacks and difficulties. Working with nanofluids makes things more difficult since the types of nanoparticles scattered in the base fluid behave differently depending on the operating constraints. A rheometer is used in this study to determine the viscosity of nanofluids (Rheotest RN 5.1) [68] at 20, 40, and 60 °C in conjunction with a LAUDA ECO RE 620 [69] for device temperature stabilisation. Table 4 contains the key specifications detail of the rheometer. The study of the flow properties and deformation of matter is known as rheology. It displays a stress–strain connection between neighbouring fluid layers when subjected to an external force. A rheometer is a particular device that measures large ranges of stress, strain, and strain rate while studying the material of interest under controlled environmental conditions held in a limited geometrical configuration. The rheometer can measure the rheological behaviour of various nanofluids under various shear stress and shear strain conditions. The effects of temperature, shear rate, nanoparticle size, and volume concentration of the base fluid’s nanoparticles on the viscosity of nanofluids are examined in this experimental investigation.

2.6. Key Performance Indicators

A system’s thermal efficiency is used to determine how efficiently it performs, i.e., how much heat is transformed into electricity or work [62].
The CPC’s thermal efficiency is determined using:
η = Q u   Q s
The usable solar thermal collector gain is determined using the following equation:
Q u = m ˙ C p T o T i
The solar energy that enters the collector is obtained through
Q s = A a G e

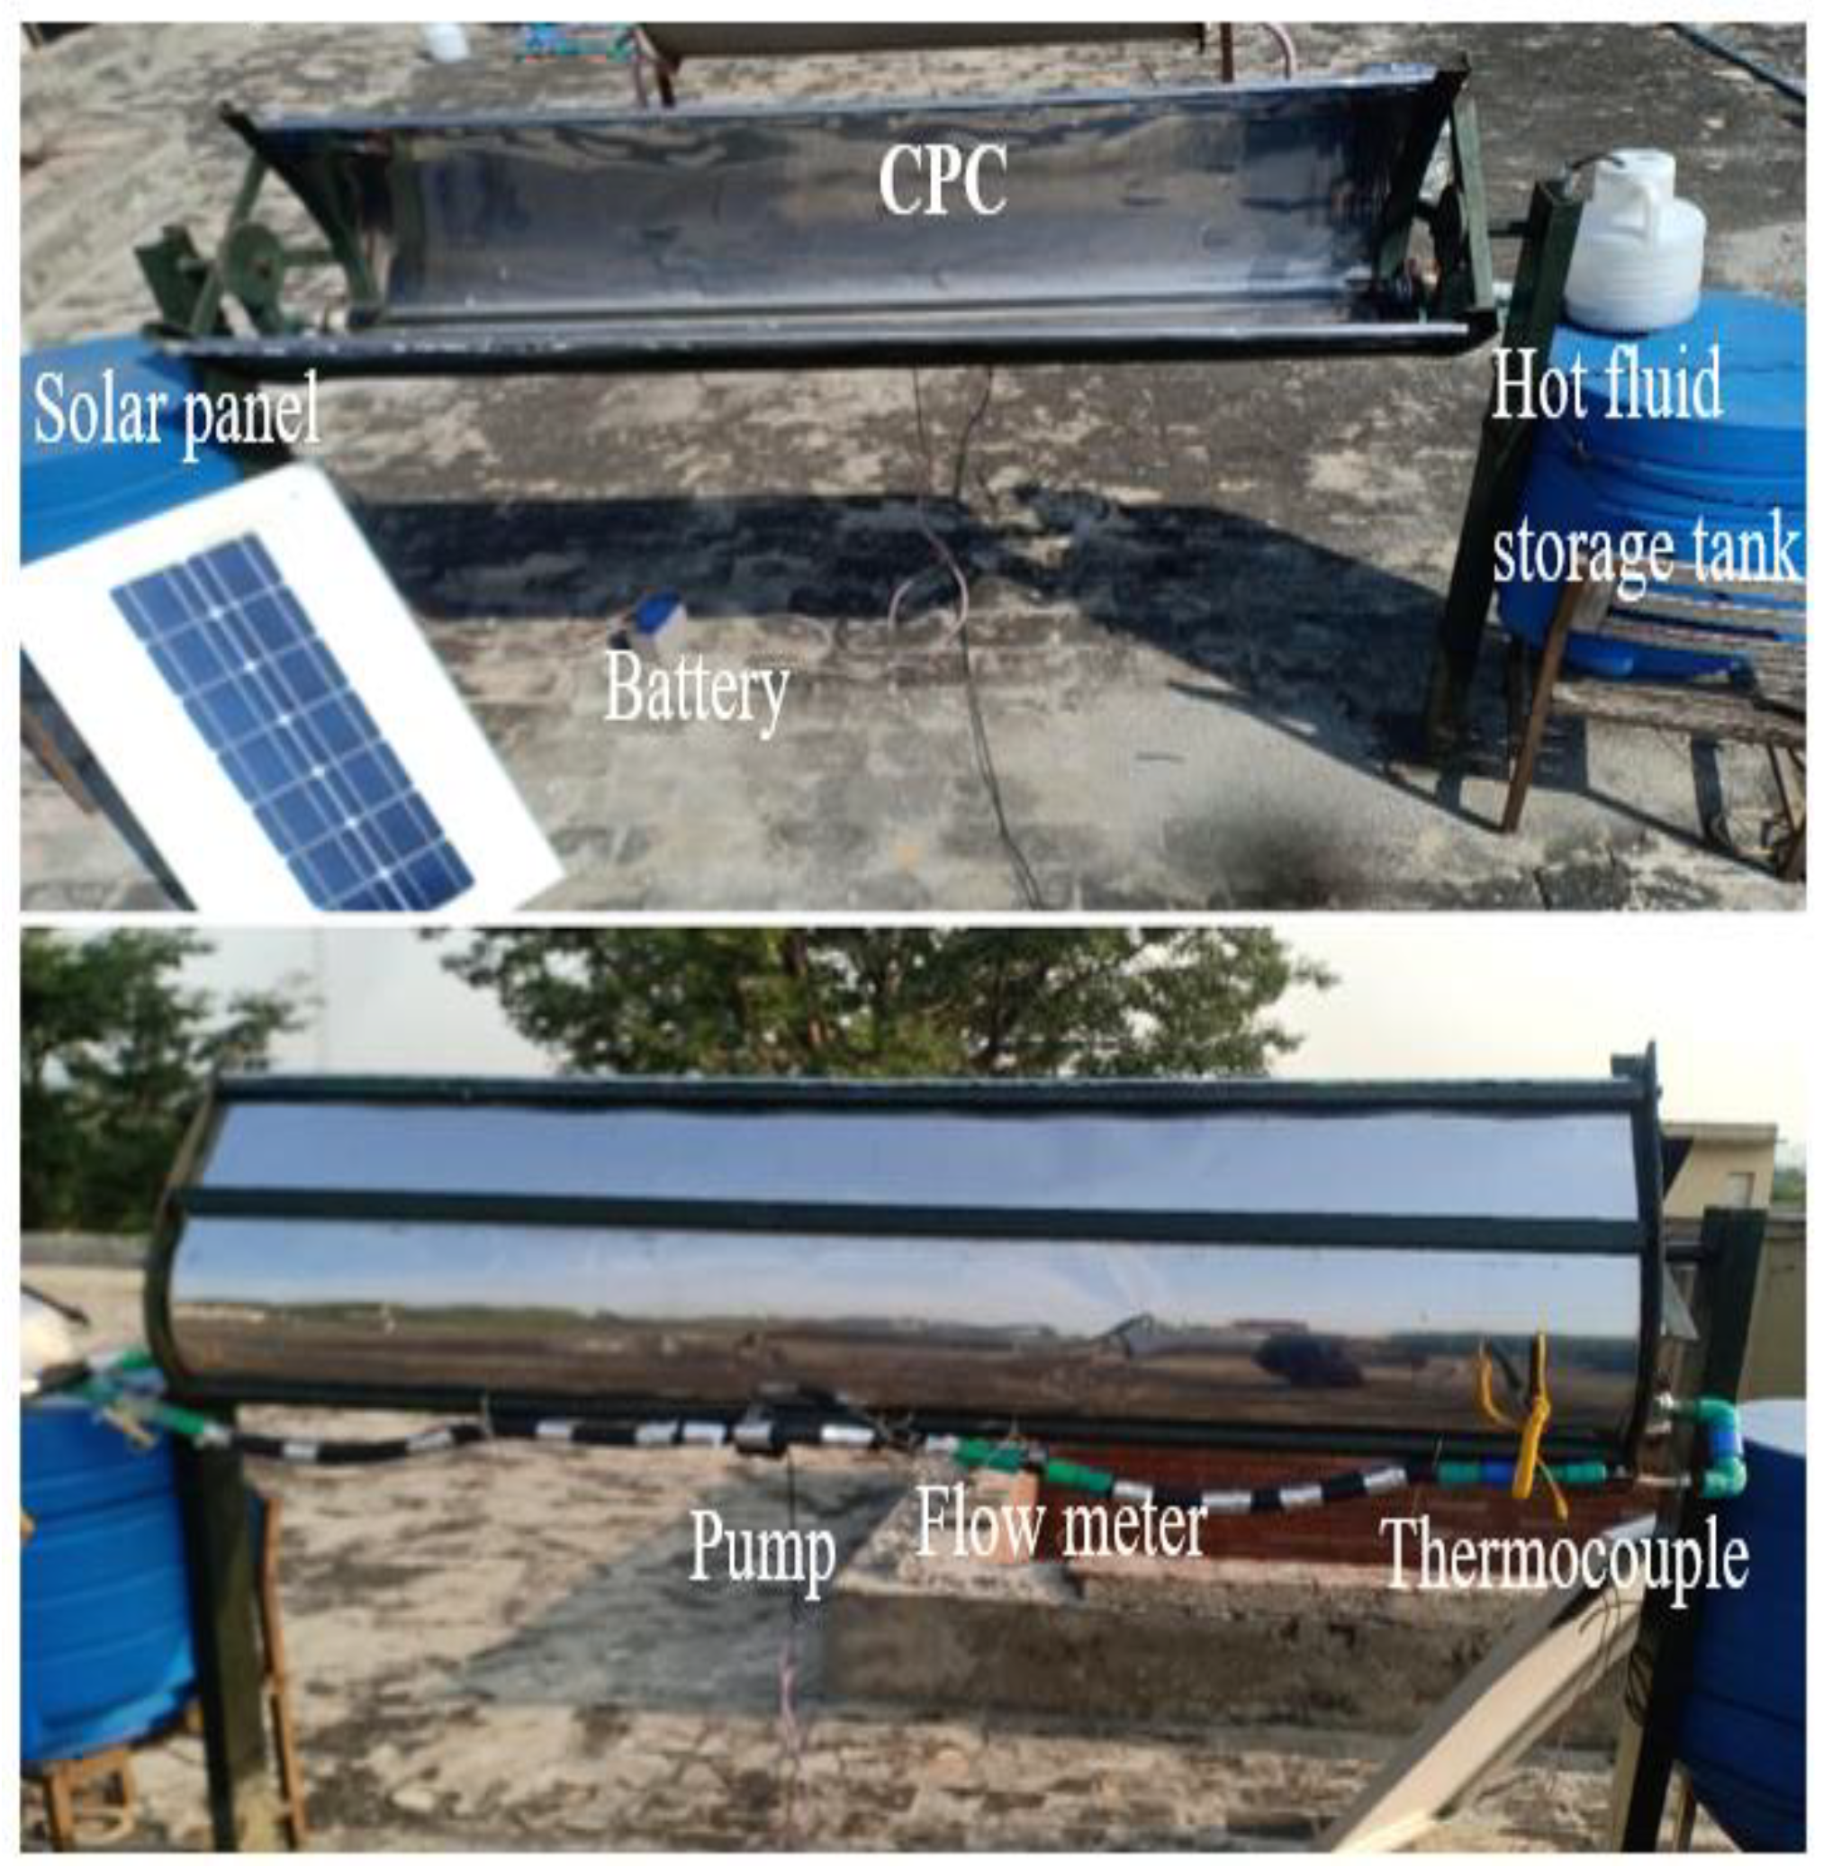
2.7. Experimental Setup and Measurement Procedure

The experimental test arrangement for the current inquiry includes a CPC trough installed on a steel frame, storage tanks, and accompanying plumbing, as shown in Figure 3. The polished stainless steel and non-magnetic reflective sheet used to build the CPC trough are riveted to the ends of steel strips twisted into compound parabolic forms. The size and concentration ratios of a solar collector system affect its performance. This collector has a concentration ratio of 4.17 and a collecting area of 0.8 m2. The evacuated tube has a surface area of 0.2 m2 and a length of 1.85 m. The specifications of the compound parabolic collector are listed in Table 6. The compound parabolic collector is oriented East–West throughout the experiment because more sunshine hours are available in this direction. Seasonal tilt is required for the receiver to capture incident radiation effectively. In the CPC, experiments with nanofluids and working fluids such as water and EG are conducted in closed loops.
With the support of a pump, cold fluid is introduced into the absorber, which eventually boosts fluid temperature by exchanging heat with the absorber tube. A hot fluid storage tank collects this hot fluid and returns it to the absorber’s intake side. Temperature is measured using K-type thermocouples positioned at the absorber’s input and exit. The fluid flow is measured using a flowmeter connected to an Arduino. The Pyranometer is used to measure the sun radiations every hour. The ambient temperature is measured using a fibre optic temperature sensor. To ensure mixing and avoid stability issues, the nanofluid must be prepared after each experiment before the next day’s experimentation. The investigation runs from 10:00 a.m. to 3:00 p.m. for six hours daily.

2.8. Uncertainty Analysis

Uncertainty analysis of the CPC collector is performed to check for errors in the collector’s experimentally obtained results. The root sum square (RSS) method is employed for this purpose. Due to the fact that efficiency is a function of mass flow rate, temperature, and solar radiation, these variables are utilised to assess system uncertainty. The list of sensors applied in the experimentation and their uncertainty are listed in Table 7. The theoretically calculated uncertainty of CPC came out as 2.6%. The RSS method is described in Equation (4) as mentioned below.
σ η = d η d T 2 σ T 2 + d η d I T 2 σ I T 2 + d η d m ˙ 2 σ m ˙ 2

3. Results and Discussion

This section of results and discussion includes experimental results from measurements of the metallic and non-metallic oxide nanofluids’ dispersion stability, thermal conductivity, and viscosity. Under a wide range of real-time climatic conditions, the thermal efficiency of the system and the temperature difference are used to assess the performance of the nanofluids.

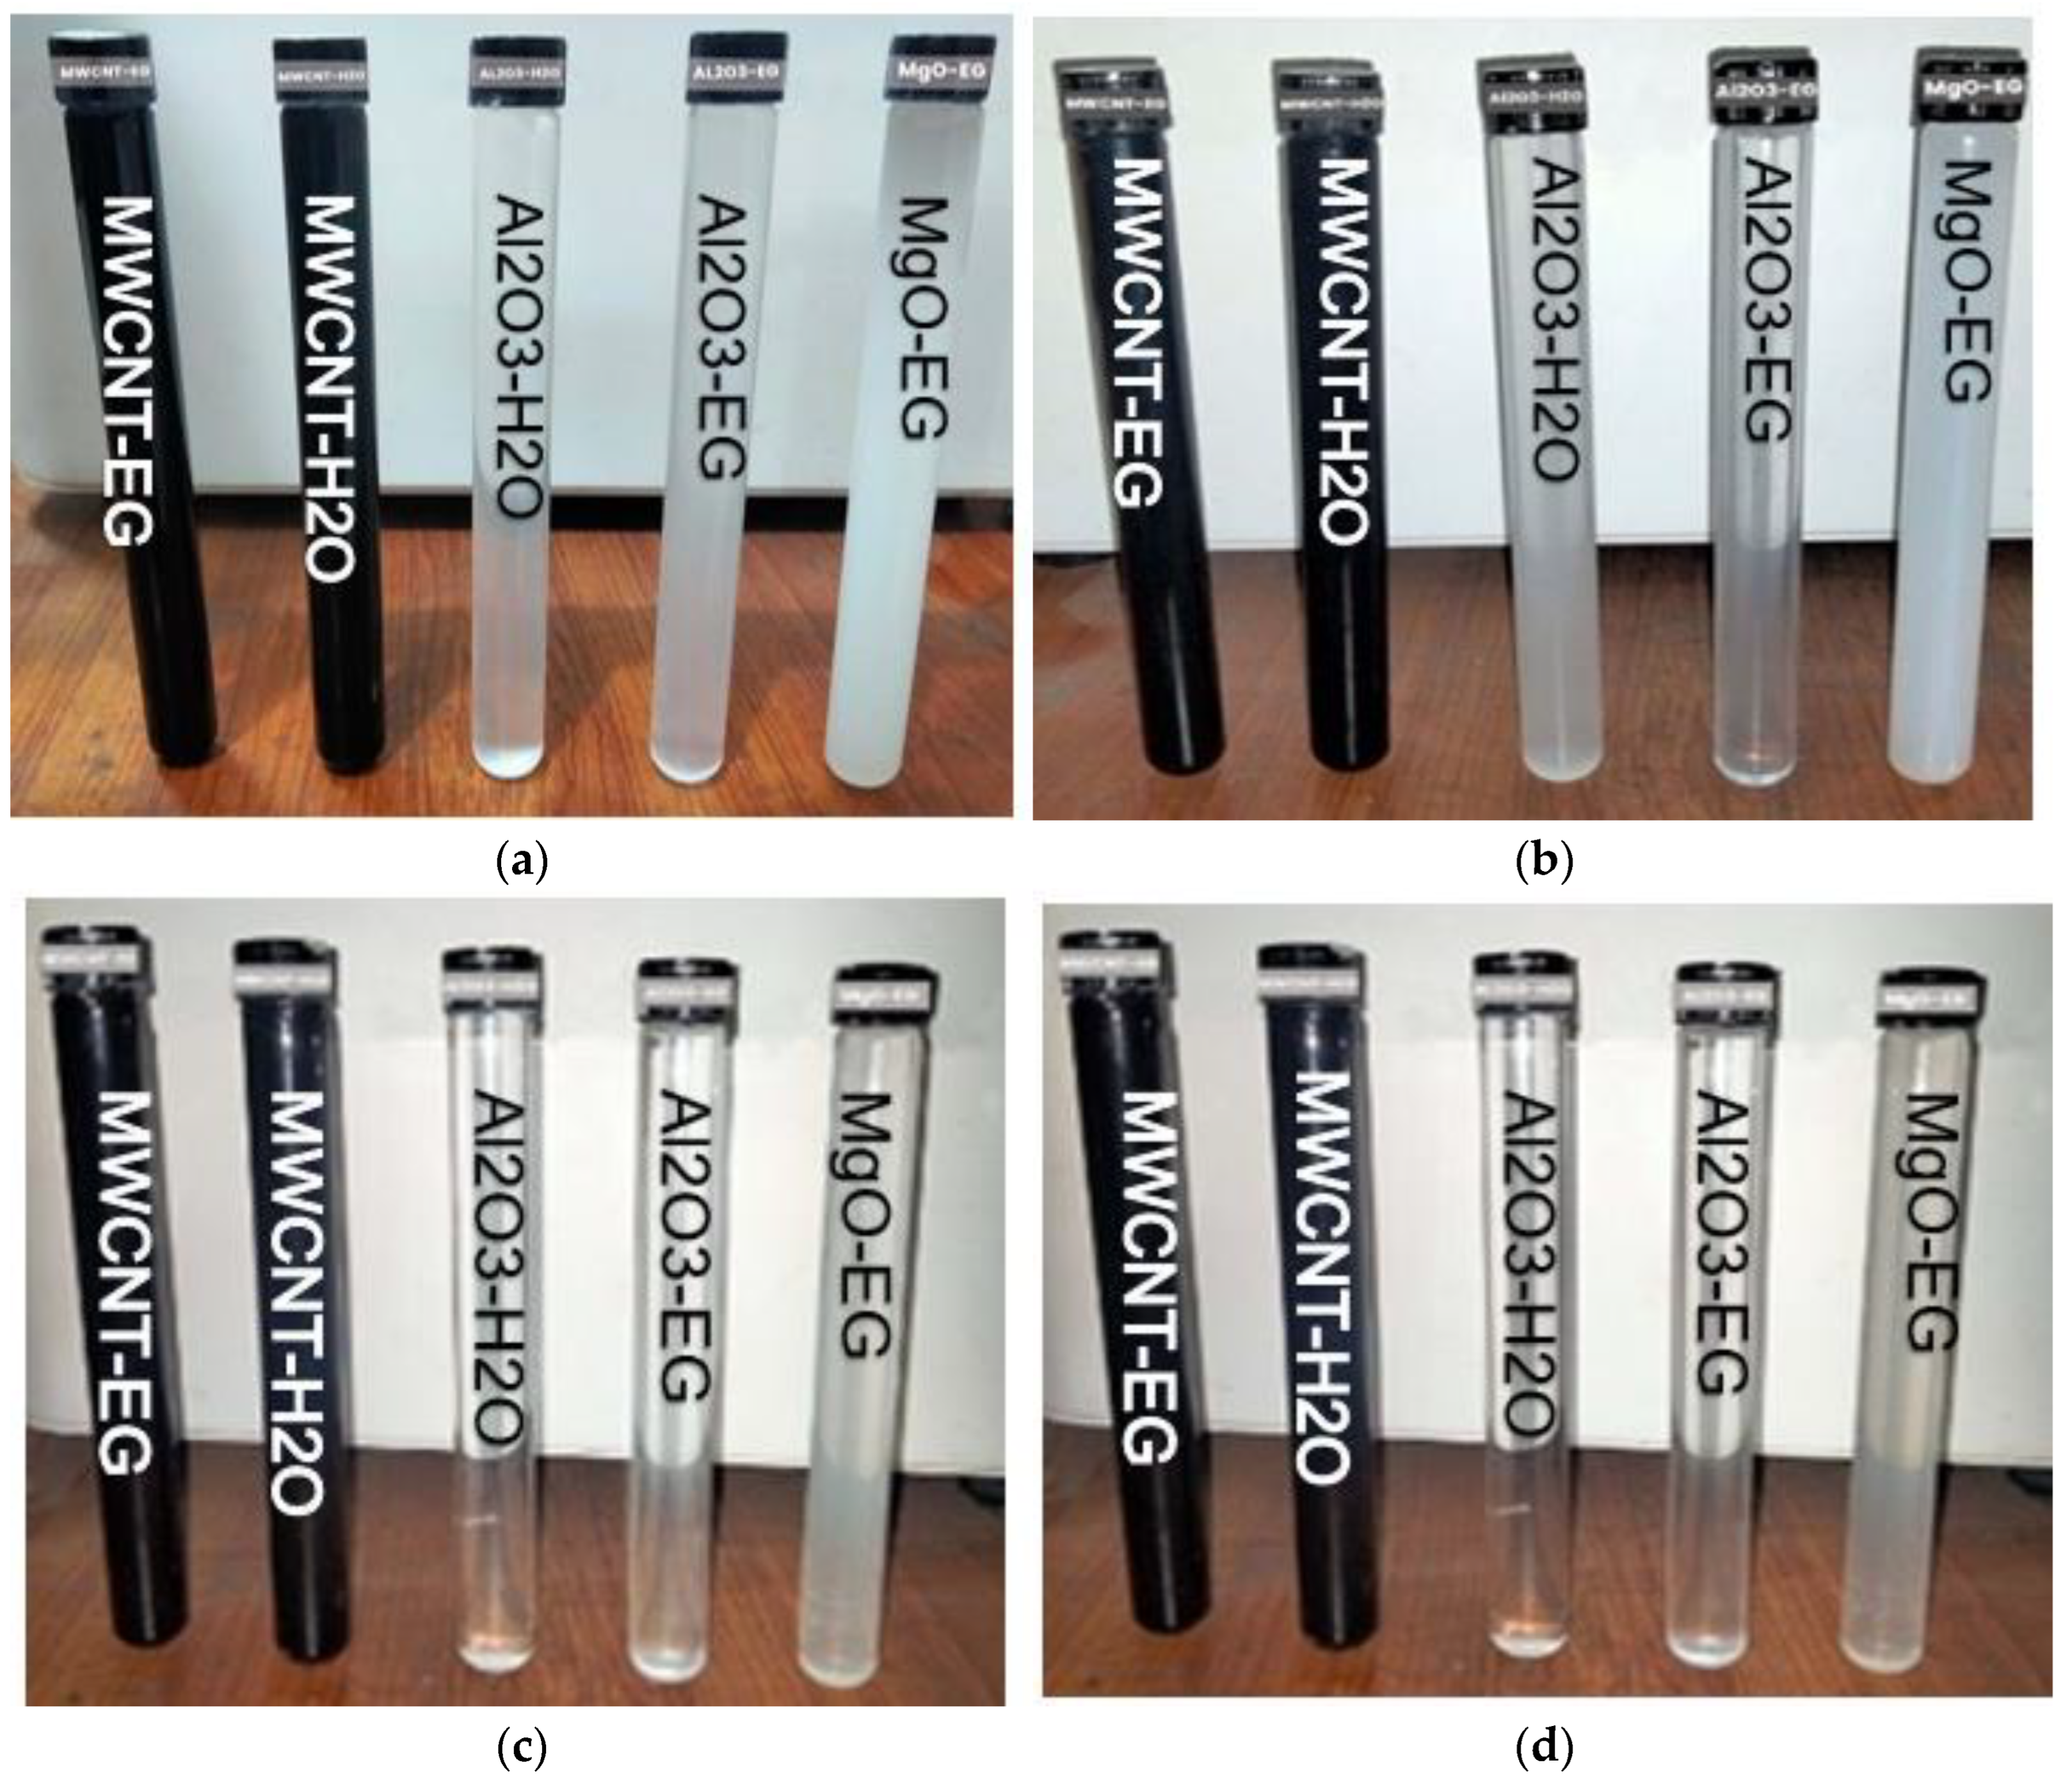
3.1. Stability and Characterisation Analysis of Nanofluids

Visual photography and pH testing were used to assess the stability of metallic and non-metallic oxide nanofluids. The thermal conductivity and viscosity of the generated metallic and non-metallic oxide nanofluids were determined at various volumetric concentrations and temperature ranges. Viscosity and thermal conductivity enhancement are compared to the reference values for base fluids, water, and ethylene glycol.

3.1.1. Visual Stability

A digital camera was used for the visual photography, which was conducted at regular intervals. In order to determine the sedimentation rate, the clear section of nanofluids in a glass vial was calculated due to nanoparticle settling. This is a conventional method and is a direct and fast way to estimate any signs of nanoparticle sedimentation with the uniform dispersions of nanofluids [66]. However, this method cannot predict the quantitative estimates of the nanoparticle sedimentation or accumulation. Figure 4a–d shows the visual stability of MWCNT–H2O, MWCNT–EG, Al2O3–H2O, Al2O3–EG, and MgO–EG nanofluids right after preparation and after 20, 30, 40, and 60 h, respectively. The noted observation proved the stability of all nanofluids.

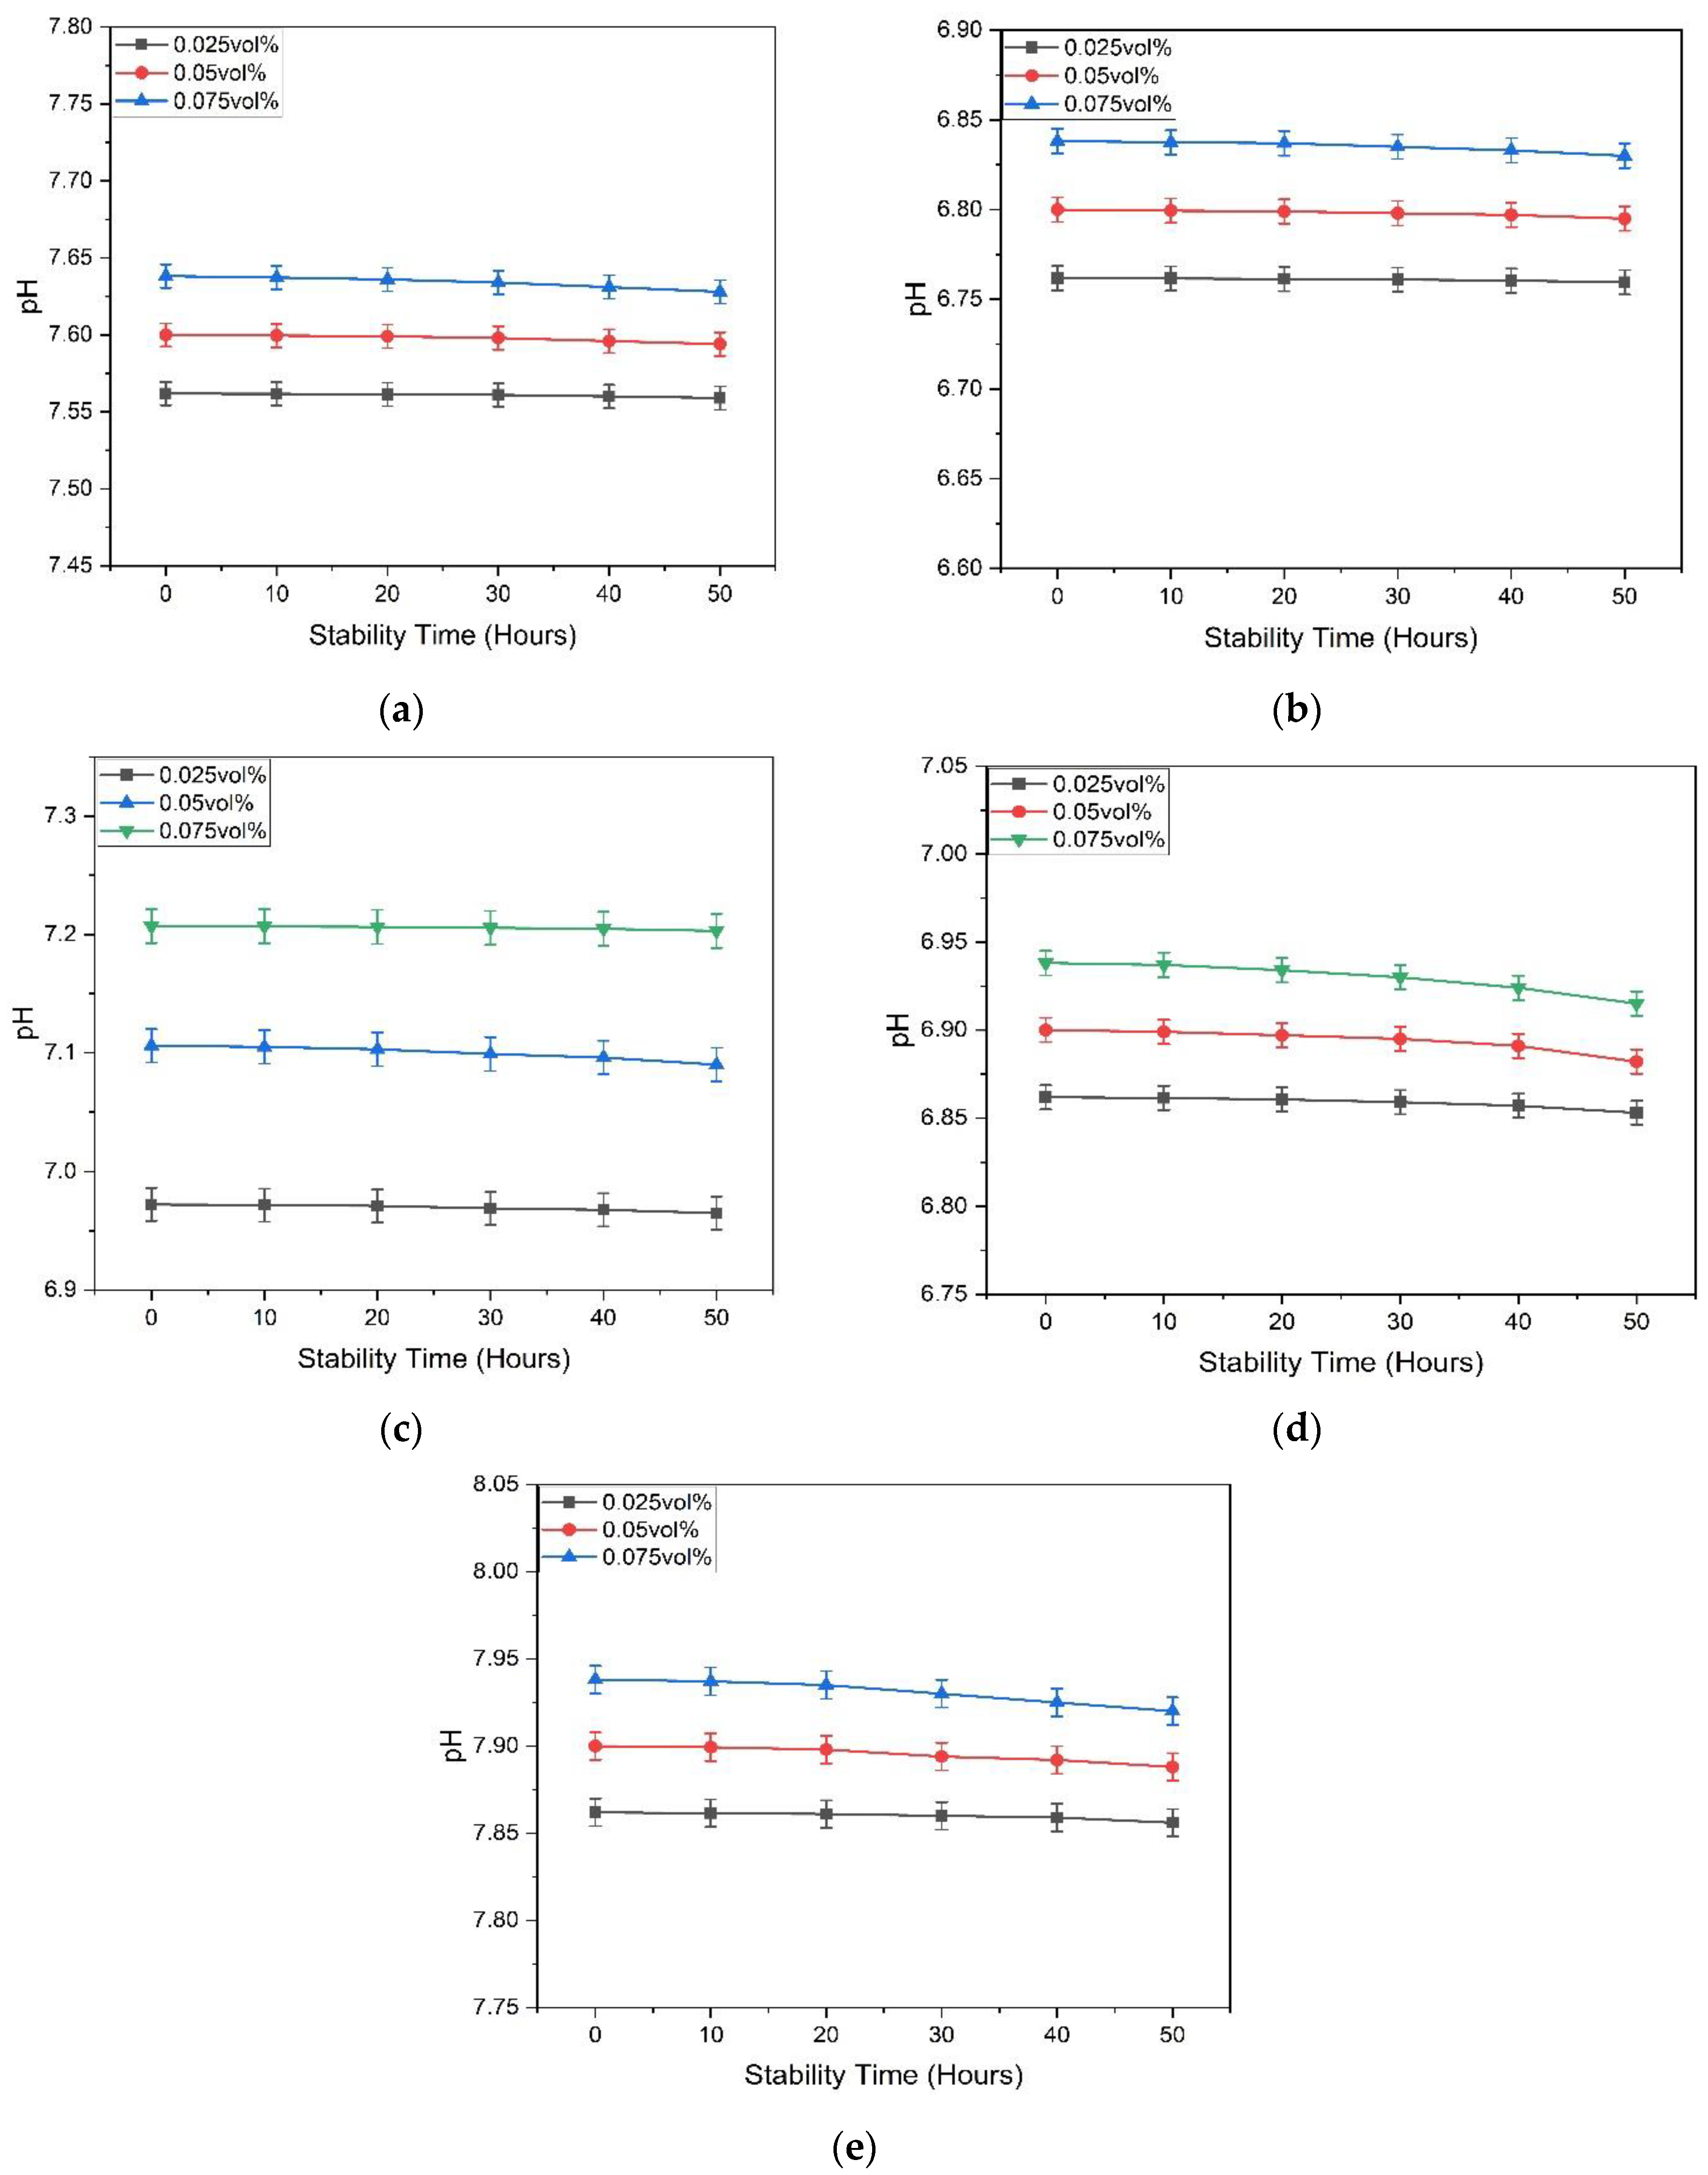
3.1.2. pH Measurement

MWCNT nanoparticles in distilled water, increasing the pH of the nanofluid, are shown in Figure 5a. A similar behaviour was noted in MWCNT–EG, as shown in Figure 5b and Al2O3–H2O, Al2O3–EG, and MgO–EG nanofluids shown in Figure 5c–e, respectively. This study also found a clear relationship between the concentration of nanoparticles and the pH of nanofluids. In order to determine the nanoparticle sedimentation rate, the pH of the nanofluid sample was compared to the pH of the reference samples created for this purpose. Over a 40 h period, the highest drop in volumetric concentration for the MWCNT–H2O nanofluid was 6.4% at 0.075 vol%. Over a 60 h observation period, the volumetric content of Al2O3–H2O, Al2O3 –EG, MWCNT–EG, and MgO–EG nanofluids dropped by 6.46%, 13.18%, 4.6%, and 12%, respectively. This demonstrates the measurement device’s greatest precision and the correctness of the recorded findings for estimating the stability of nanofluids using this approach.

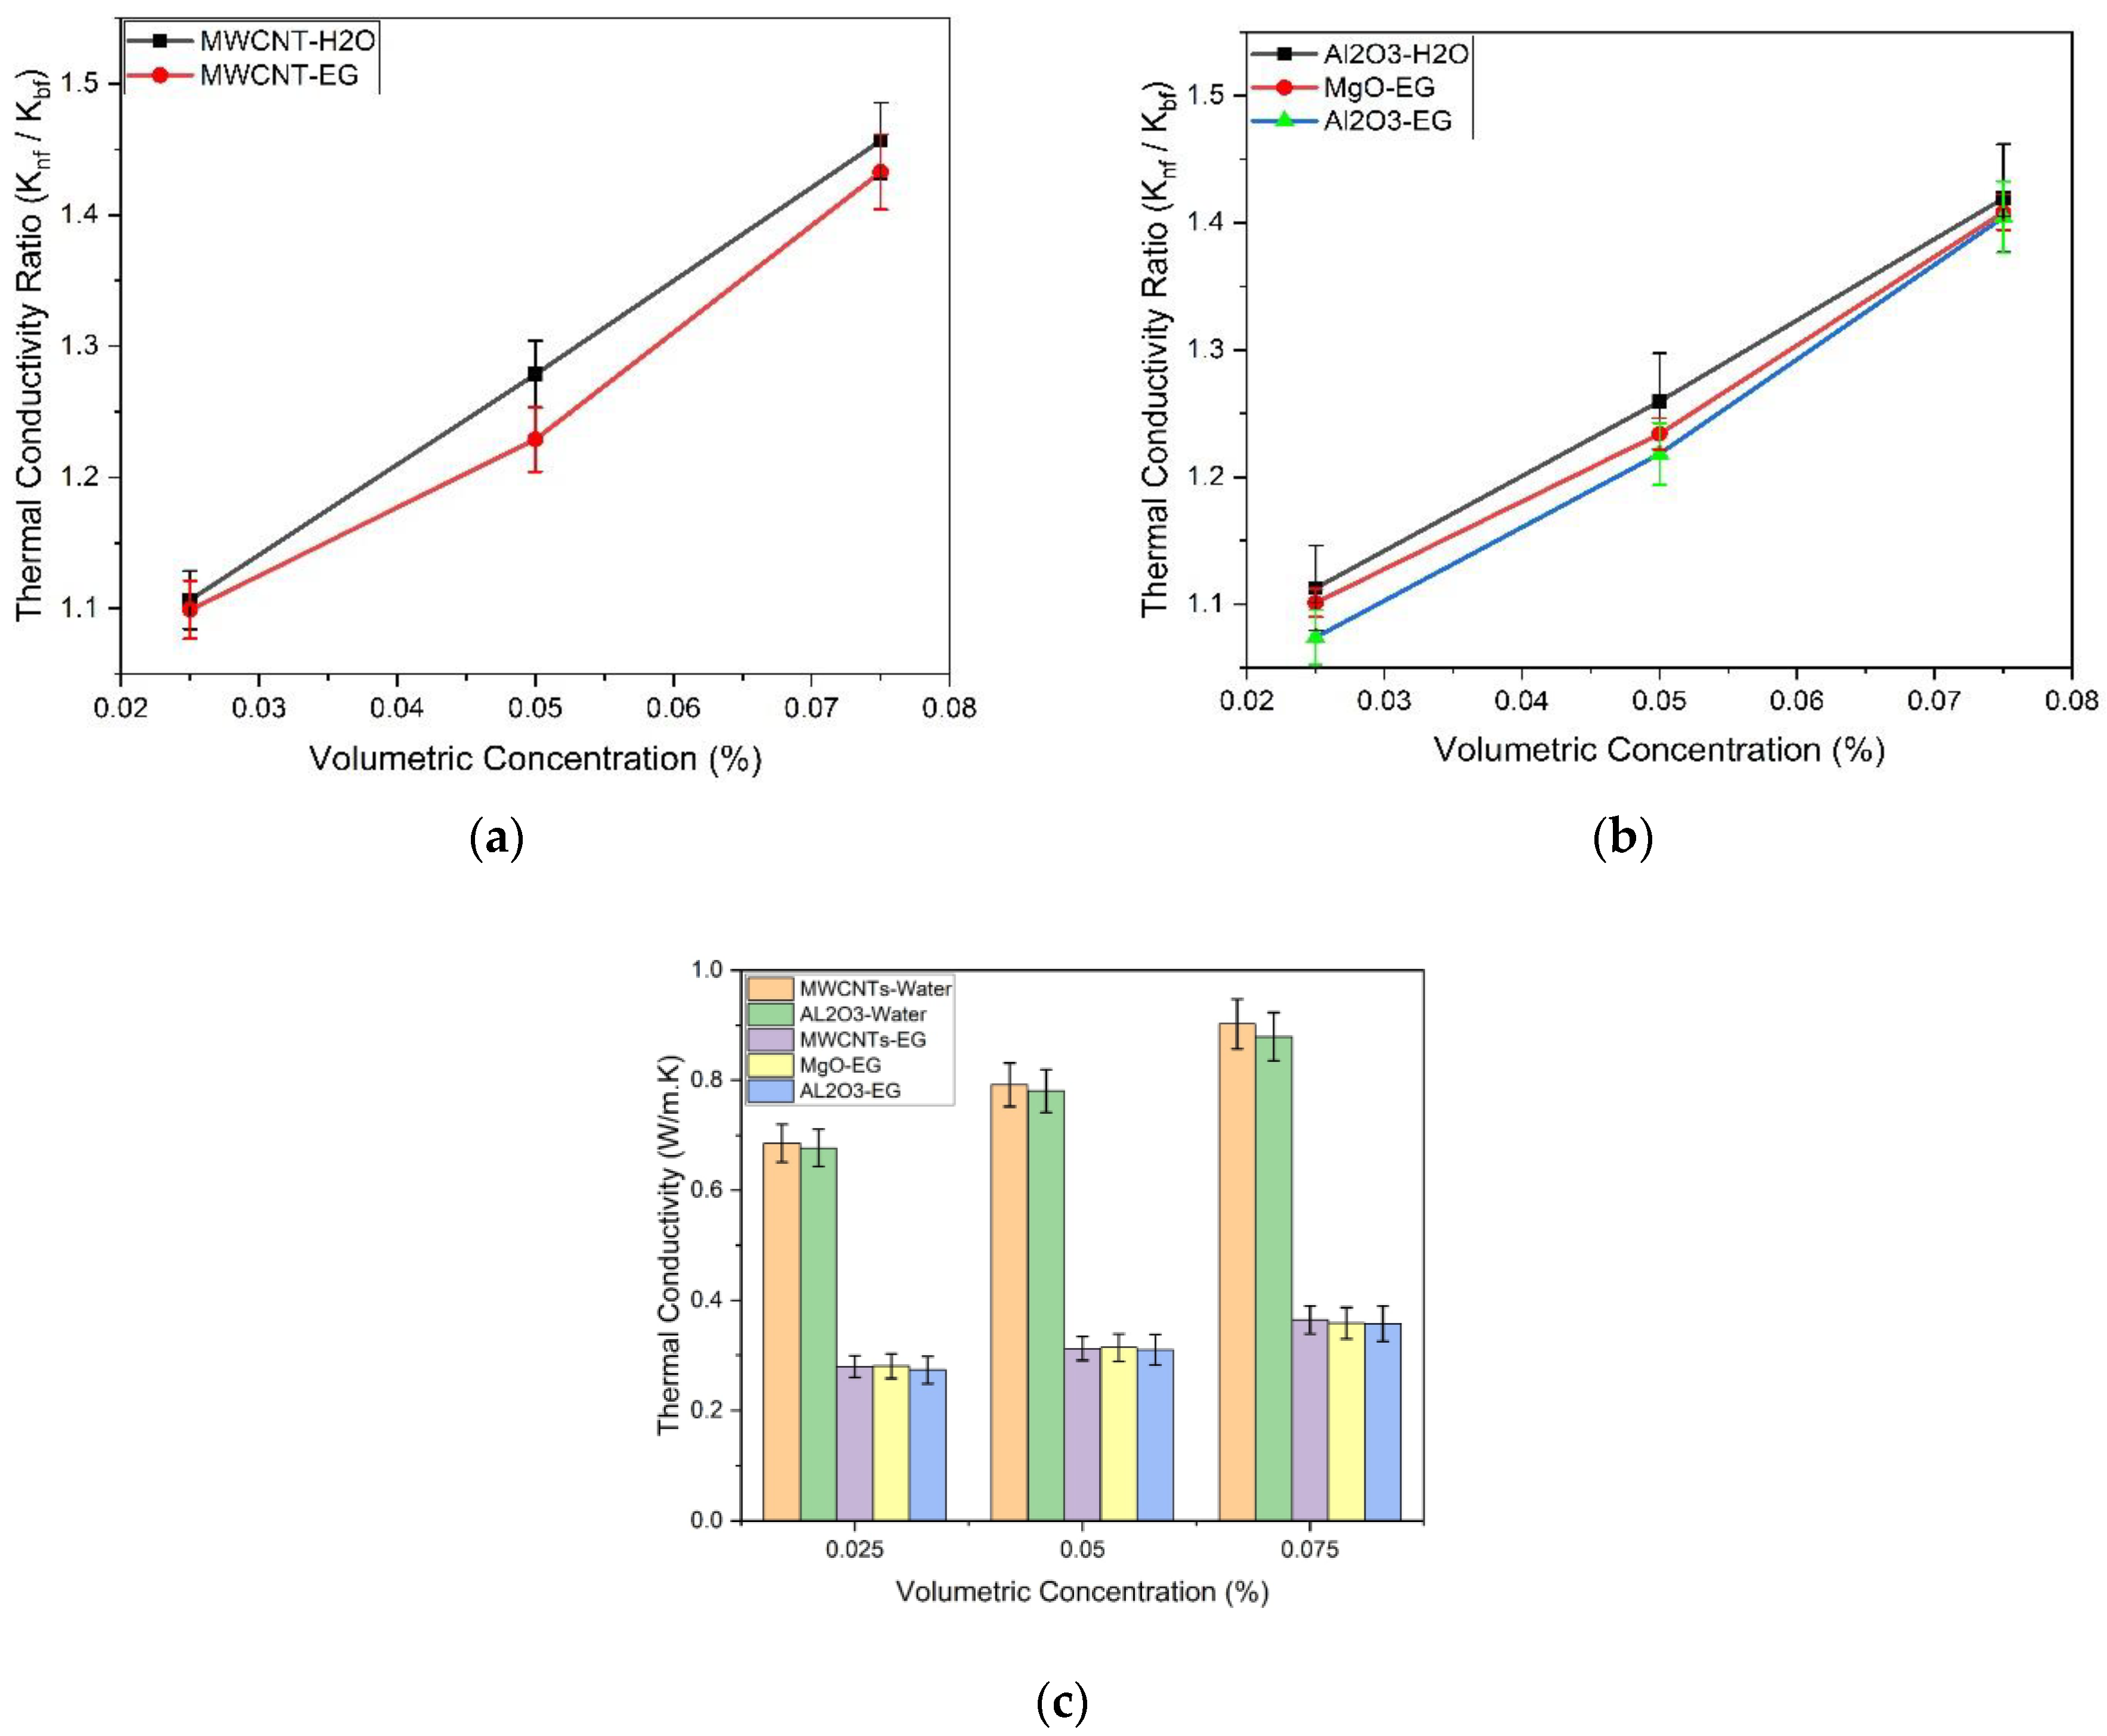
3.1.3. Thermal Conductivity Analysis

The thermal conductivity of the nanofluids was measured at 30 °C using the TEMPOS thermal analyser device at volumetric concentrations of 0.025, 0.05, and 0.075%. The temperature was stabilised using a hot water bath. Due to the fact that the volumetric concentration of particles and the thermal conductivity of the nanofluid have a direct relationship, the thermal conductivity increases as the volume percentage of particles in the base fluid increases. The dispersion stability of the nanofluid is crucial due to little or weak dispersion, due to which the KS-3 sensor’s needle may become a stick with nanoparticles, which may cause the thermal conductivity value to fluctuate, and results will not be according to expectation. The thermal conductivity ratio of the MWCNT–H2O and MWCNT–EG nanofluids is show in Figure 6a. Distilled water has a thermal conductivity of 0.6194 W/m.K. At a 0.075 vol% concentration, the greatest thermal conductivity increase for the MWCNT–H2O nanofluid is of 37.17%. The maximum rise in thermal conductivity ratio in the case of the MWCNT–EG nanofluid was recorded at 35.57%, temperature of 30 °C, and nanoparticles concentration of 0.075 vol%. Figure 6b represents experimental data on the thermal conductivity ratio of the Al2O3–H2O, Al2O3–EG, and MgO–EG nanofluids. The Al2O3–EG nanofluid thermal conductivity ratio lies in the range of 1.07389–1.40448 W/mK. At 30 °C, ethylene glycol has a thermal conductivity of 0.2544 W/mK. The maximum thermal conductivity enhancement is 33.64% at 0.075 vol% concentration in the case of the Al2O3–EG nanofluid. Figure 6b shows the thermal conductivity of the MgO–EG nanofluid at three volumetric concentrations. At a 0.075 vol% nanoparticle concentration, the greatest thermal conductivity improvement of 33.91% is obtained. As a reference, the thermal conductivity of ethylene glycol is 0.2544 W/mK at 30 °C. The MgO–EG dispersion stability is crucial in thermal conductivity measurements since it is more stable than the Al2O3/EG nanofluid. Figure 6c shows the evaluation of the thermal conductivity of metallic and non-metallic oxide nanofluids. MWCNT–H2O nanofluids have maximum thermal conductivity with high nanoparticle concentrations, and Al2O3–EG nanofluids have minimum thermal conductivity compared to other nanofluids.

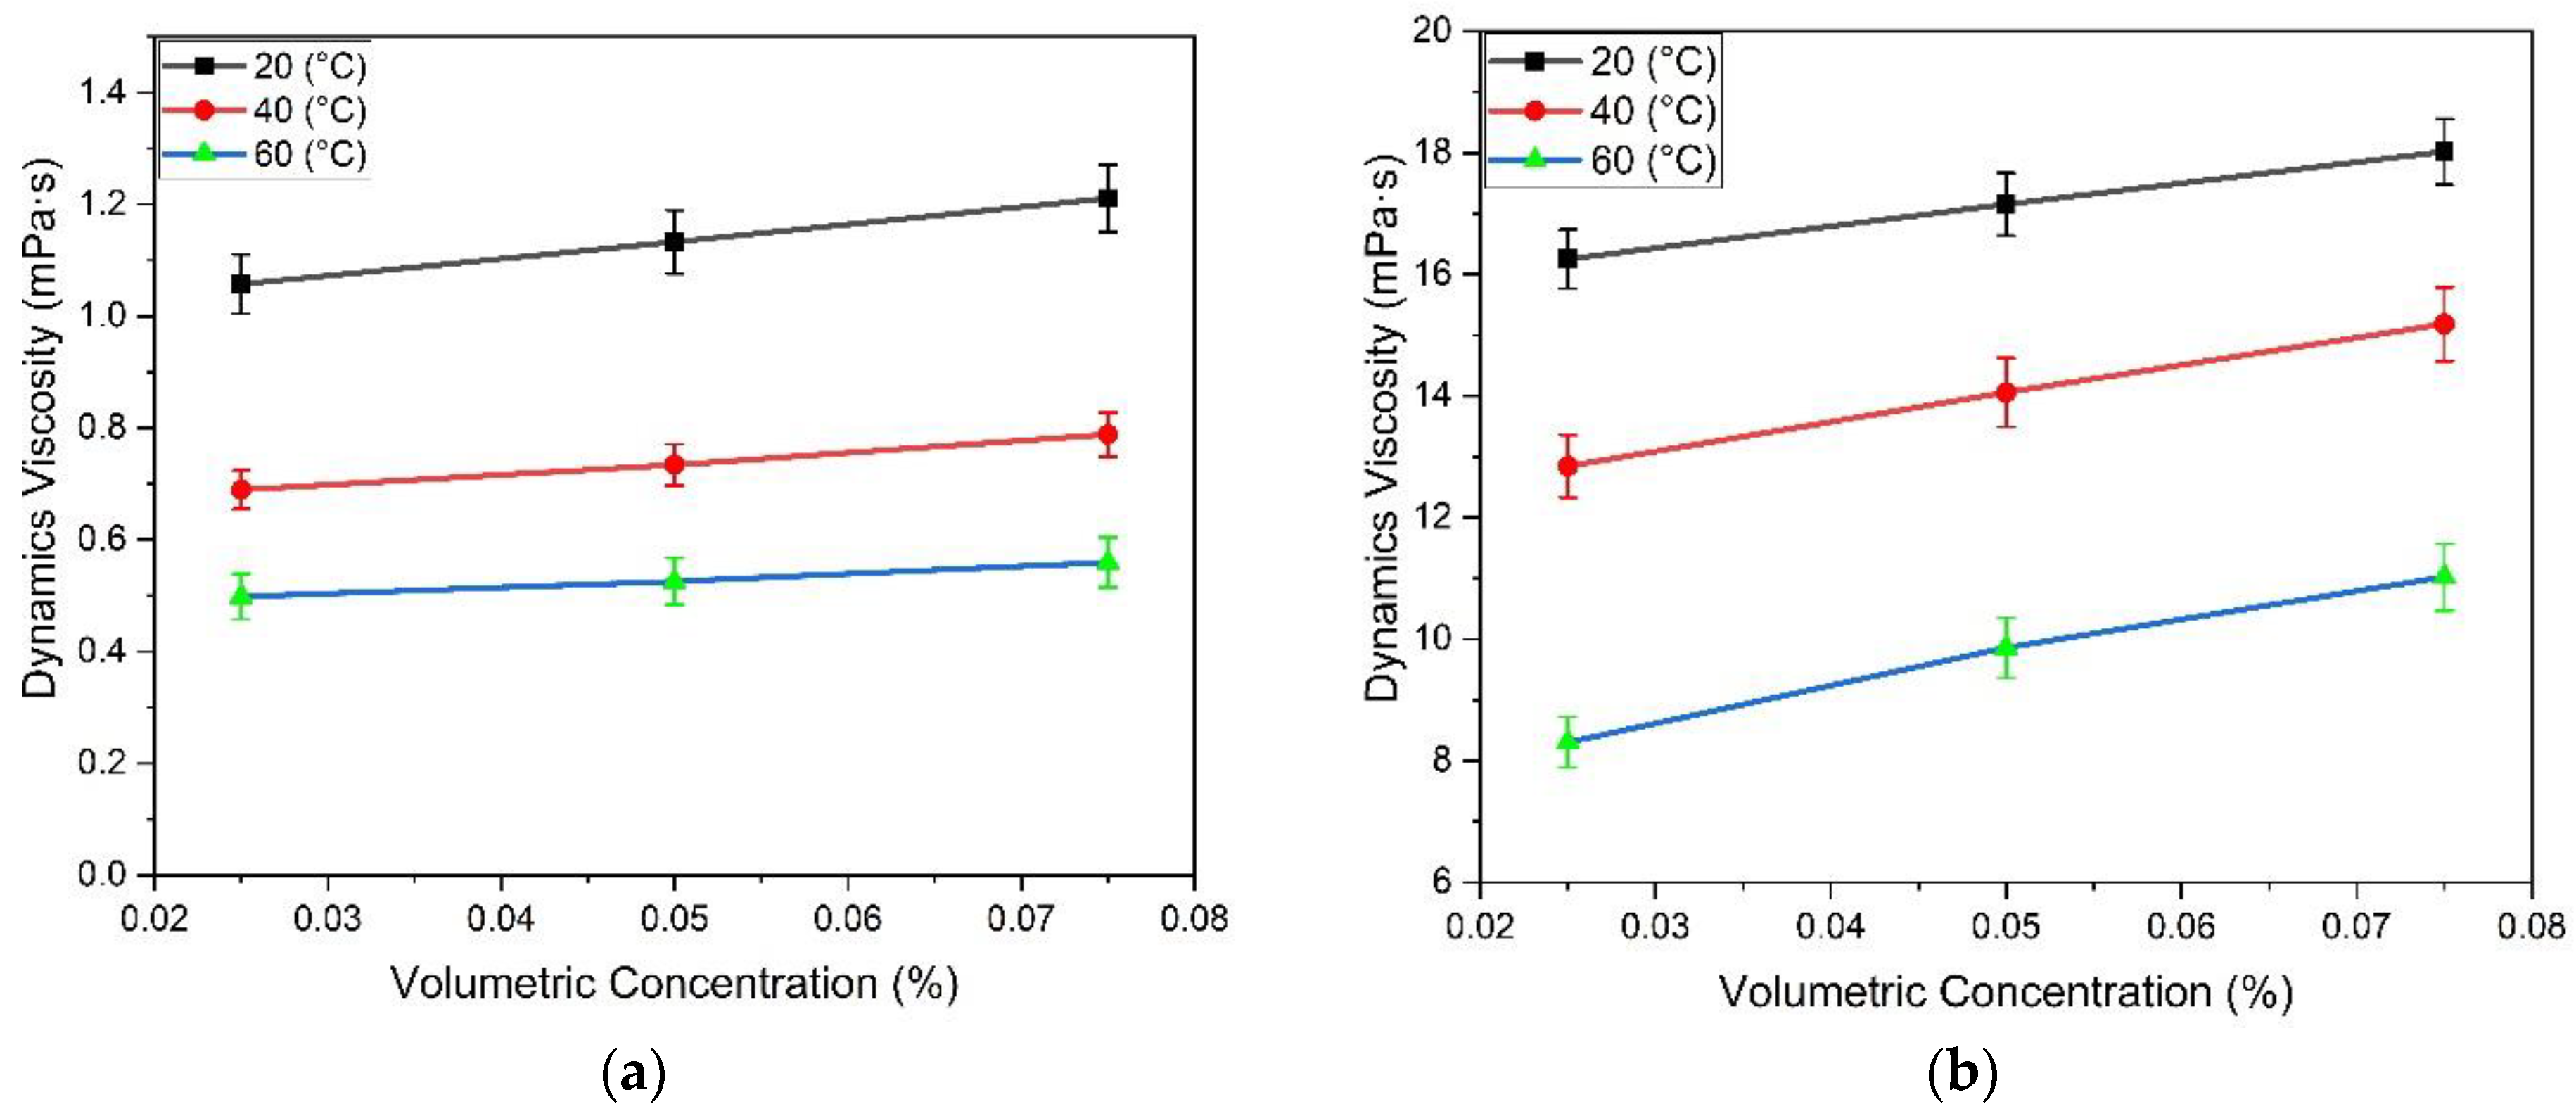
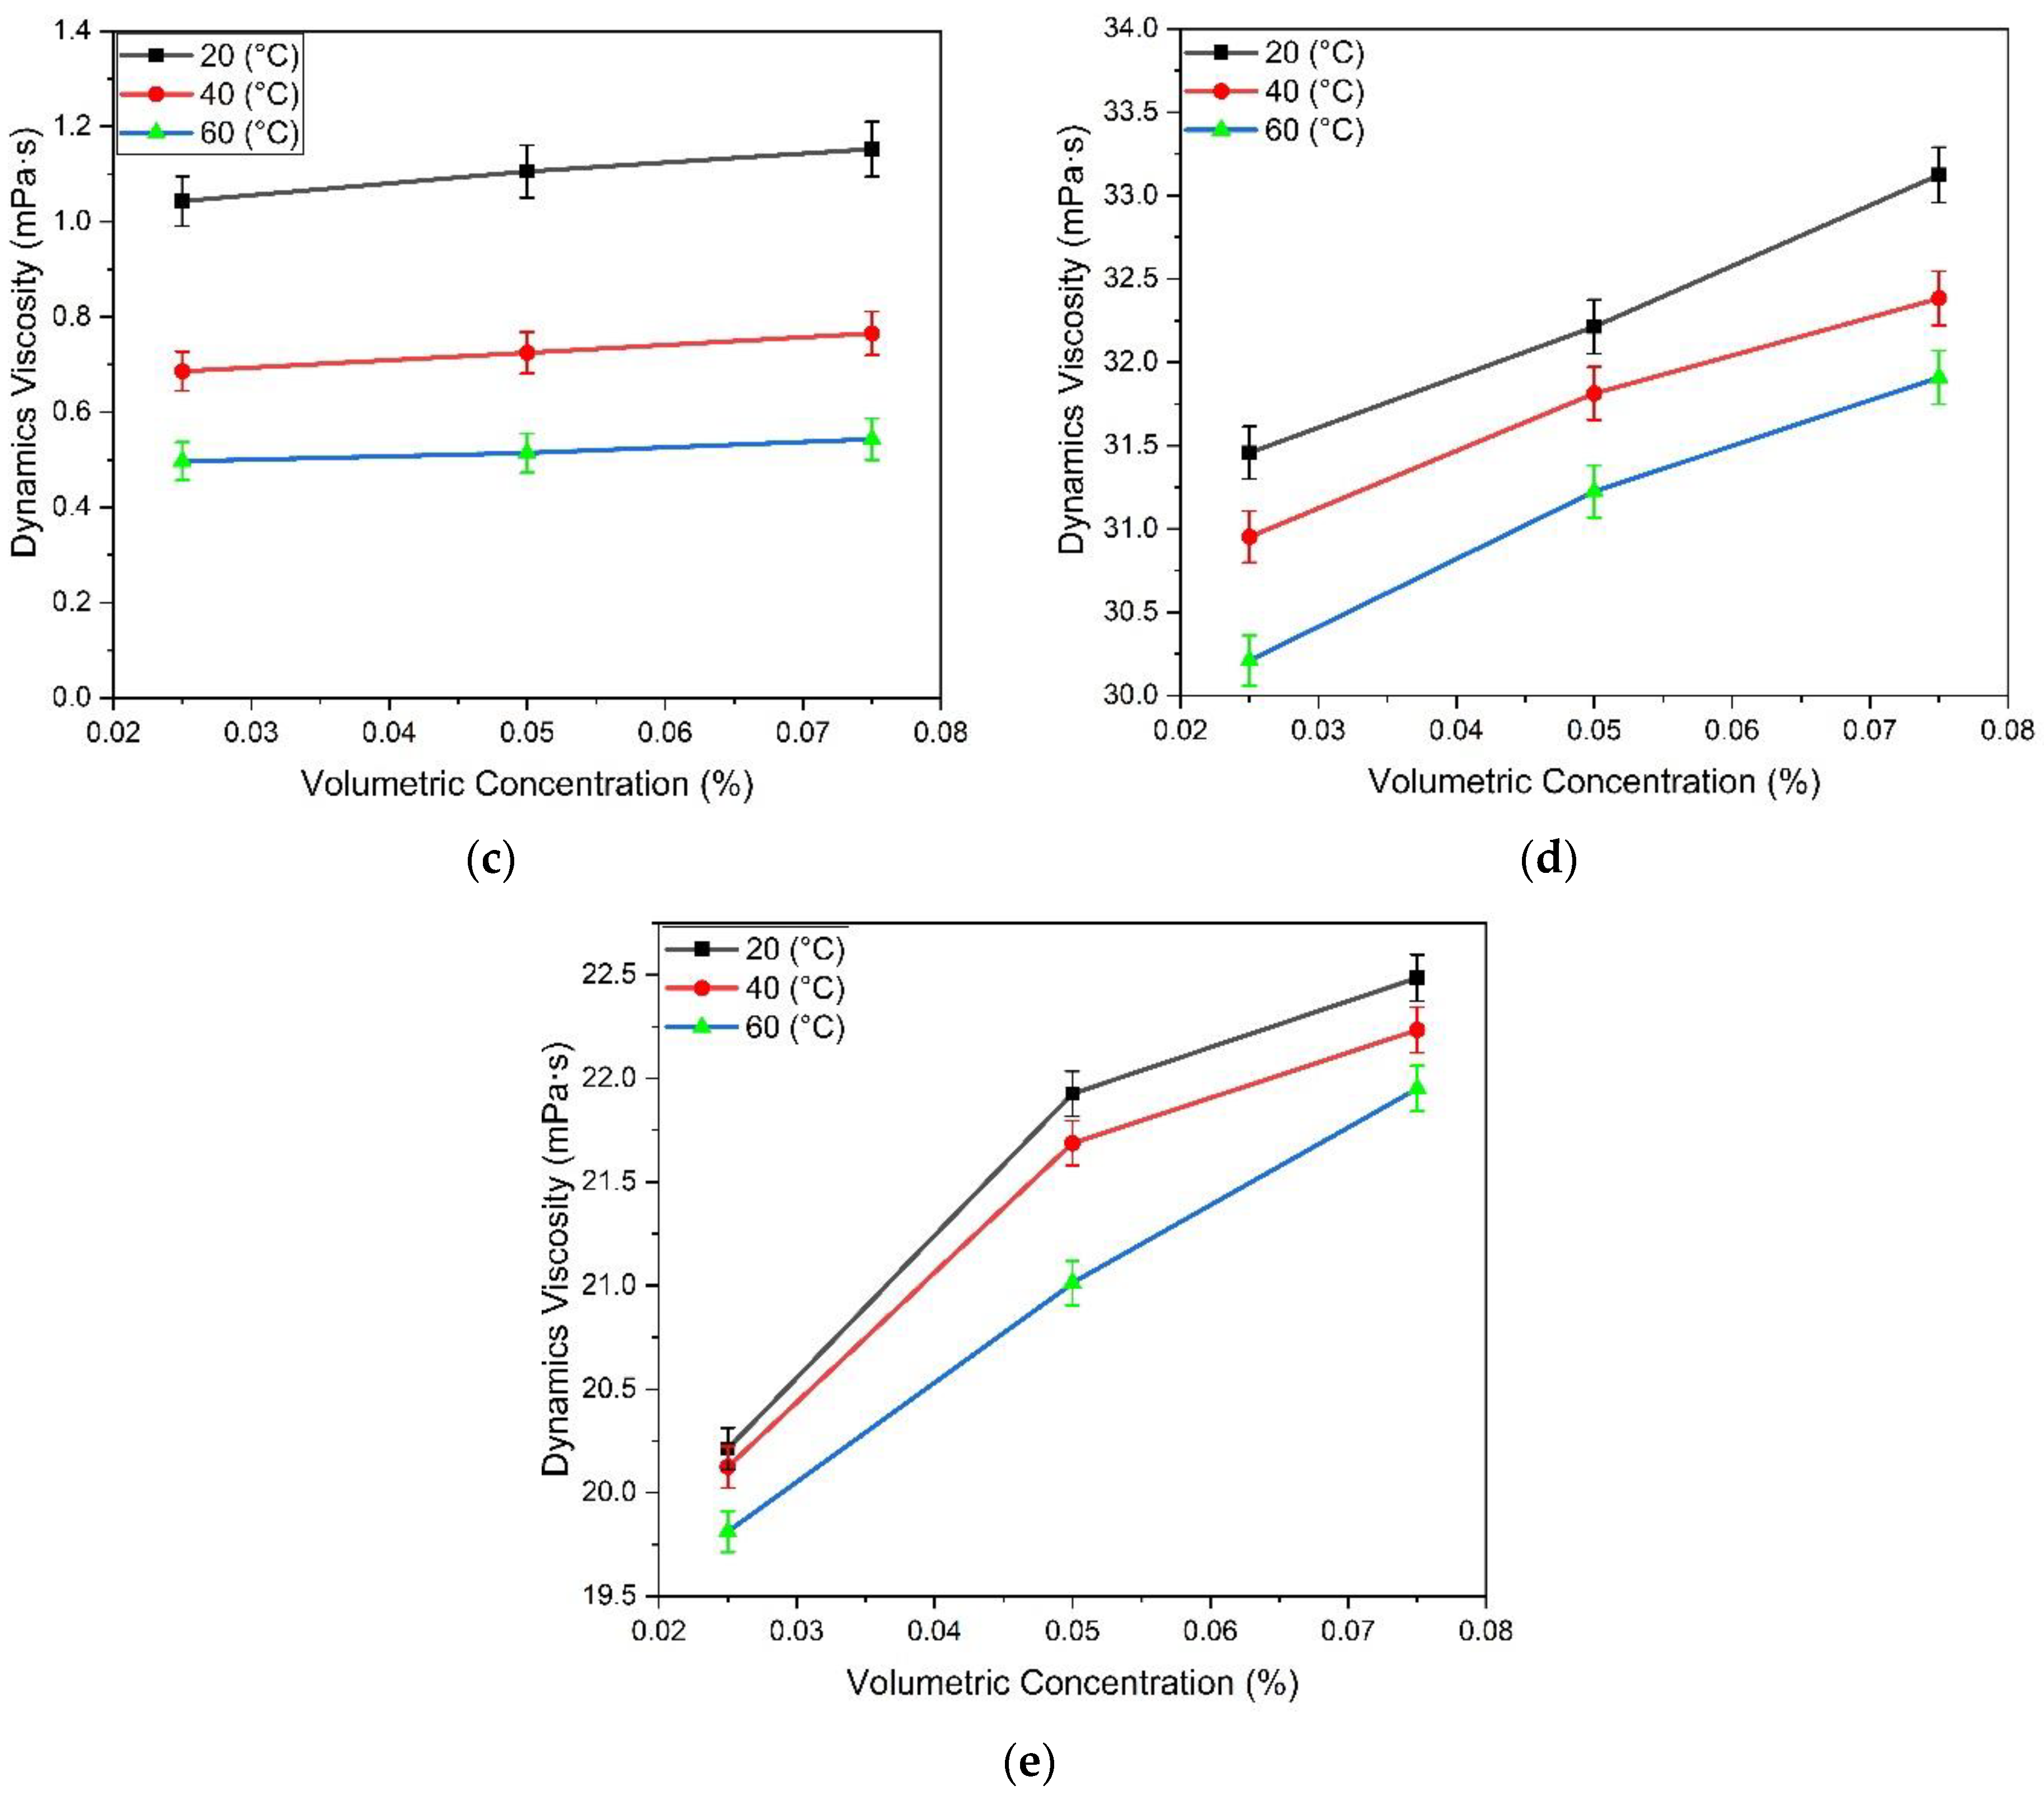
3.1.4. Viscosity Analysis

By dispersing nanoparticles, traditional heat transfer fluids become more thermally conductive, which enhances the overall efficiency of heat transfer in thermal systems. Adding solid particles to base fluids, on the other hand, increases viscosity, which negatively impacts flow qualities. As a result, it is vital to investigate how inserting nanoparticles into base fluids affects the viscosity of the resulting nanofluids. In this investigation, the viscosity of the nanofluids is evaluated along with the volumetric concentration of nanoparticles in the base fluid and the impacts of temperature, shear rate, nanoparticle size, and nanoparticle size.

Effect of Temperature at Constant Shear Rate

The relationship between nanofluid viscosity, rheological properties, and operating temperature is critical. The operating temperature should be the most important and determining parameter, according to the whole nanofluids research community. The intermolecular interactions between the host base fluid and the nanoparticles are weakened by the temperature increase, lowering the overall viscosity of the nanofluids and vice versa. As shown in Figure 7, the viscosity of the nanofluids decreases with increasing temperature and shear rate, although the change is nonlinear. At high temperatures and shear rates, the fluid molecules absorb more energy, move more rapidly, and, therefore, the intermolecular forces decrease. This causes the viscosity to decrease. The viscosity of metallic and non-metallic oxide nanofluids was examined at temperatures of 20, 40, and 60 °C. They exposed an inverse relation between nanofluid viscosity and operational temperature.

Effect of Temperature at Constant Shear Rate

The nanofluid’s viscosity is proportional to the particle size and volumetric concentration of the nanoparticles. The size and concentration of the nanoparticles increase, and the viscosity of the nanofluid rises exponentially, making it unstable due to strong attraction relations between the nanoparticles. Figure 7 shows the viscosity analysis of metallic and non-metallic oxide nanofluids at a shear rate of 200 s−1. The minimum increase in viscosity is 8.302 mPa·s, and 0.4969 mPa·s is recorded at 0.025 vol% of nanoparticle concentration of the MWCNT–EG and Al2O3–H2O nanofluids at 60 °C, respectively. The viscosity of the Al2O3–EG and MgO–EG nanofluids at different temperatures and constant shear rate is shown in Figure 7d,e, respectively. The minimum thermal conductivity of 30.21 and 19.81 mPa·s is measured at 0.025 vol% of nanoparticle concentration of the Al2O3–EG and MgO–EG nanofluids at 60 °C, respectively. Additionally, the minimum increase in viscosity of 0.4969 mPa·s is recorded with 0.025 vol% concentration at 60 °C in the case of the Al2O3–H2O nanofluid and also 33.123 mPa·s maximum viscosity with 0.075 vol% concentration at 20 °C for the Al2O3 –EG nanofluid.

3.2. Experimental Analysis in CPC System

The efficiency of the design CPC solar collector is evaluated by comparing the difference in temperature from across receiver tubes and the system’s thermal efficiency. As heat-transfer fluids, metallic and non-metallic oxide nanofluids (MWCNT–H20, MWCNT–EG, MgO–EG, Al2O3–EG, Al2O3–H2O) with three volumetric concentrations (0.025%, 0.05%, and 0.075%) were utilised at two flow rates (0.015 and 0.02 kg/s). The results of utilising metallic and non-metallic oxide nanofluids as the working fluid were compared to those of using standard heat-transfer fluids, such as water and EG.

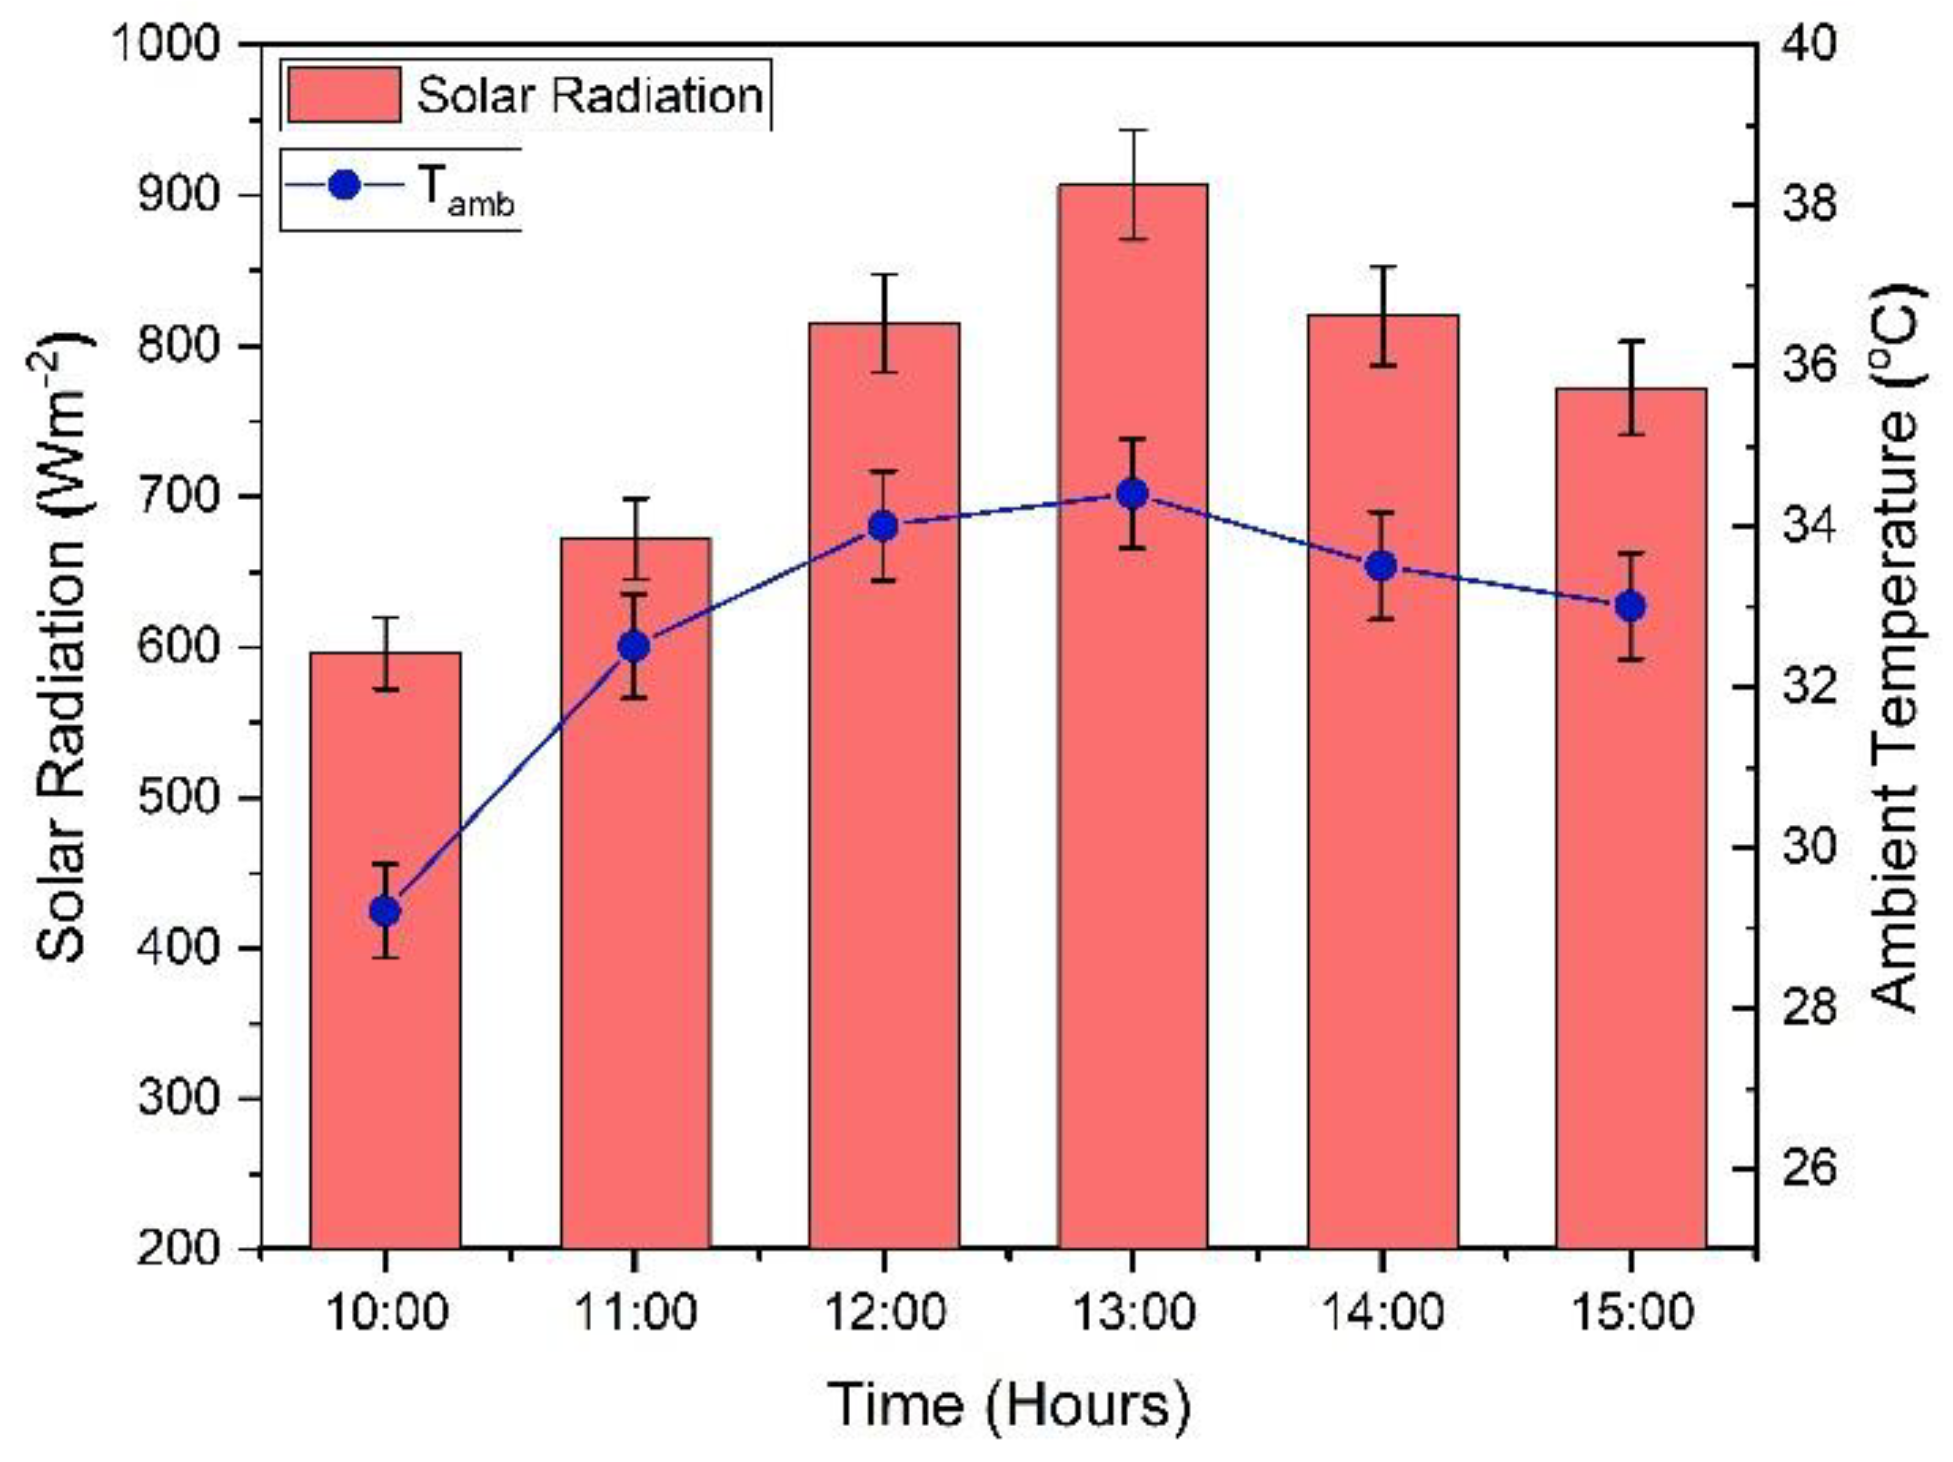
3.2.1. Variation in Climatic Conditions during Testing

The variations in climatic data for ambient temperature and solar radiation were measured using digital K-type thermometers and pyranometers. Additionally, the current study is based on metallic and non-metallic oxide nanofluids used in CPC at three volumetric concentrations and two flow rates. The collector produces an average output temperature of up to 70 °C. Figure 8 demonstrates that the solar radiations and ambient temperature reach their highest around 13:00 p.m. During the whole experimentation time, the average radiations measured with a pyranometer were collected for 6 h. The total effects of variations were measured in an ambient temperature between 29.2 °C and 34.4 °C. The solar system’s efficiency may rise or decrease depending on the intensity of the solar radiation.

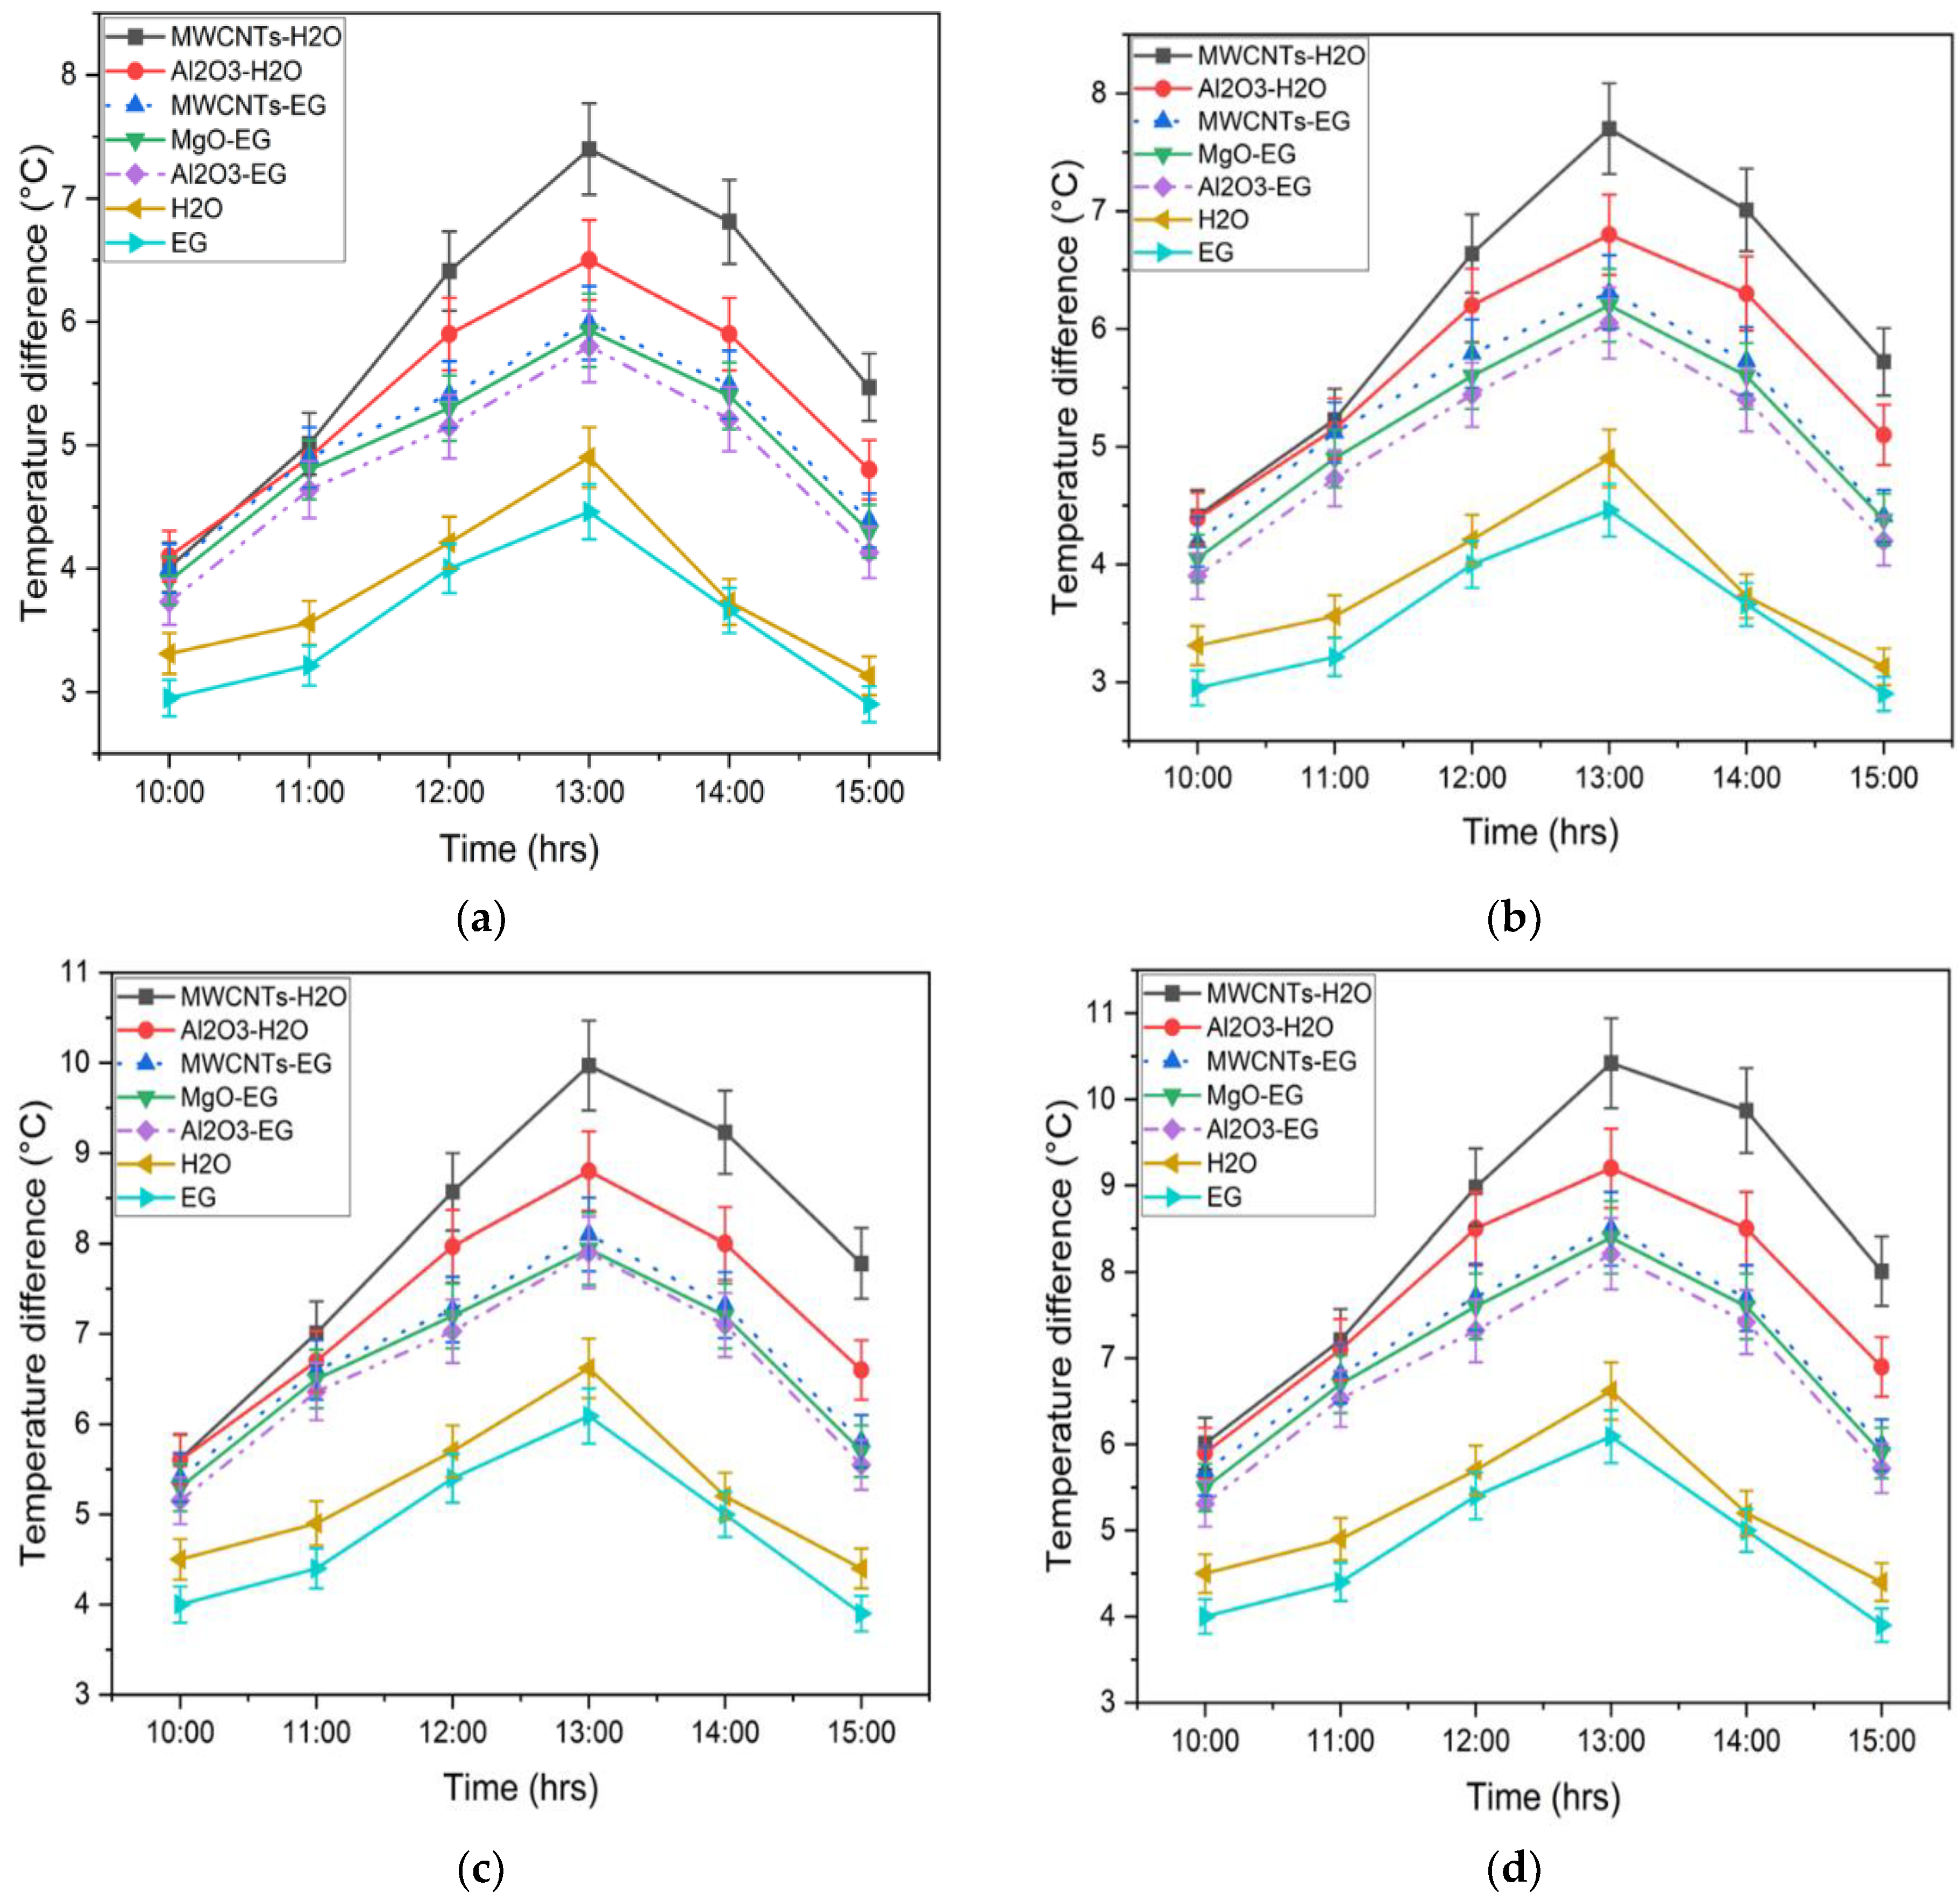
3.2.2. Comparison of Temperature Difference

Temperature differences in metallic and non-metallic oxide nanofluids at flow rates of 0.02 and 0.015 kg/s) with different volumetric concentrations of nanoparticles were compared, as shown in Figure 9. The better result is achieved at 13:00 p.m., when maximum radiations are measured using a pyranometer. After 13:00 p.m., there is a gradual decline. Distilled water and ethylene glycol were used as working fluids in this experiment. With the use of nanofluids, there is a noticeable rise in temperature change. The base fluid’s nanoparticle volumetric concentration is measured at its maximum level. Figure 9a shows the temperature difference at a 0.025 vol% nanoparticles concentration of metallic and non-metallic oxide nanofluids. The maximum temperature differences were 7.4, 6.5, 5.99, 5.93, and 5.8 °C at 13:00 p.m. for 0.025 vol% of nanoparticle concentrations of MWCNT–H2O, Al2O3–H2O, MWCNT–EG, MgO–EG, and Al2O3–EG nanofluids, respectively. Additionally, from Figure 9b, maximum 7.7, 6.8, 6.31, 6.2, and 6.05 °C temperature differences are recorded at a 0.075 vol% nanoparticles concentration for MWCNT–H2O, Al2O3–H2O, MWCNT–EG, MgO–EG, and Al2O3–EG nanofluids, respectively, at a 0.02 kg/s flow rate. Temperature differences of 4.9 and 4.46 °C are recorded for water and ethylene glycol, respectively, used as a working fluid in the CPC at a 0.02 kg/s flow rate. The temperature difference increases significantly when nanofluids are used. The MWCNT–H2O nanofluid is used to achieve a greater temperature difference due MWCNTs having a higher thermal conductivity (3000 W/m·K) than many metallic oxide particles. The maximum temperature differences for a 0.025% volumetric concentration in MWCNT–H2O, Al2O3–H2O, MWCNT–EG, MgO–EG, and Al2O3–EG nanofluids are 9.97, 8.8, 8.1, 7.94, and 7.9 °C, respectively. The minimum temperature difference is achieved by using the Al2O3–EG nanofluid. From Figure 9d, temperature differences of 10.42, 9.2, 8.5, 8.4, and 8.21 °C are achieved for a 0.075% volumetric concentration in the MWCNT–H2O, Al2O3–H2O, MWCNT–EG, MgO–EG, and Al2O3–EG nanofluids, respectively. Temperature differences of 6.62 and 6.09 °C are achieved for water and ethylene glycol, respectively, at a 0.015 kg/s flow rate.

3.2.3. Comparison of Thermal Efficiency

A thermal efficiency comparison of metallic and non-metallic oxide nanofluids at various volumetric nanoparticle concentrations of 0.025 vol% and 0.075 vol% at 0.02 and 0.015 kg/s flow rates is presented in Figure 10. The solar thermal collector’s overall performance is characterised by its thermal efficiency, which is directly related to solar radiation intensity. Due to the nanofluids’ improved surface area heat-transfer capabilities, CPC’s thermal performance increases with consistent flow rate and weather. The best thermal efficiency of CPC is obtained by utilising the MWCNT–H2O nanofluid. From Figure 10a, thermal efficiency is measured at a 0.02 kg/s flow rate and a 0.025% volumetric concentration. Thermal efficiencies of 74.06%, 76.28%, 67.94%, 61.53%, 60.91%, and 59.58% are recorded for MWCNT–H2O, Al2O3–H2O, MWCNT–EG, MgO–EG, and Al2O3–EG nanofluids, respectively. The thermal efficiency of CPC decreases as the system flowrate increases. The efficiency of the collector is highest at 13:00 because, according to the location where the experimental setup was installed, a solar moon occurred at 13:00 h, so at this moment maximum beam radiations were captured by the system and at this time the performance of the collector was at its maximum. The temperature difference improvement obtained at a low flow rate increases the system’s efficiency. Figure 10b shows that the maximum thermal efficiencies of 77.03%, 71.05%, 64.79%, 63.66%, and 62.12%, are achieved at a 0.075 vol% nanoparticle concentration at a 0.02 kg/s flow rate. At 0.02 kg/s, ethylene glycol and water have a higher thermal efficiency of 56.35% and 50.89%, respectively. Figure 10c,d compares the efficiency increase in metallic and non-metallic oxide nanofluids at a flow rate of 0.015 kg/s. The Al2O3–EG nanofluid has the lowest thermal efficiency enhancement, compared to the MWCNT–H2O nanofluid. Thermal efficiency is increased by 78.18% and 74.83% for the MWCNT–H2O nanofluid at 0.075 vol% and 0.025 vol% nanoparticle concentrations, respectively. Similarly, 63.22% and 60.86% thermal efficiencies are obtained for the Al2O3–EG nanofluid at 0.075 vol% and 0.025 vol% nanoparticle concentrations, respectively. In contrast, the increase in efficiency of 62.40% and 65.46% is recorded for MWCNT–EG at 0.075 vol% and 0.025 vol% concentrations, respectively. Thermal efficiencies of 57.10% and 52.12% are recorded for water and ethylene glycol at 0.015 kg/s, respectively.

4. Conclusions

This study addresses the preparation, stability analysis, and characterisation of metallic and non-metallic oxide nanofluids and their application in the CPC collectors under real-time climatic conditions of sub-tropical climate for domestic applications. In CPC, performance is evaluated using three volumetric concentrations (0.025%, 0.05%, and 0.075%) and two different mass flow rates (0.02 kg/s and 0.015 kg/s).
It should be concluded that the nanofluids, having stability for over 96 h, performed well with the maximum collector outlet temperature obtained of 70 °C. MWCNT–H2O exhibits the highest increase in thermal conductivity (33%), and MWCNT–EG nanofluids have the lowest increase in viscosity (8.5%) at a 0.075% volumetric concentration. The MWCNT–H2O nanofluid, with a 0.075% volumetric concentration, achieves a maximum temperature difference of 10.4 °C at a lower flow rate of 0.015 kg/s. Using nanofluids as primary heat-absorption fluids instead of regular tap water results in a considerable increase in the thermal efficiency of CPC. At 0.015 kg/s and 0.02 kg/s flow rates, Al2O3–H2O nanofluids boost the thermal efficiency by 29.4% and 29%, respectively. Thermal efficiency is enhanced by 23.1% and 22.4% when MgO–EG nanofluids are utilised at flow rates of 0.015 and 0.02 kg/s, respectively. Finally, as seen from the results, the MWCNT–H2O nanofluid is very stable and increases the thermal efficiency of CPC. MWCNT–H2O nanofluids with a volumetric concentration of 0.075% obtain the highest thermal efficiency of 78.1%. The current work concludes that the experimental values of thermal conductivity and stability of MWCNT–H2O are greater than metallic oxide nanofluids for the same application and working conditions. Additionally, the experimental study suggests, during experimentation and for better results in terms of thermal efficiency, that the MWCNT–H2O nanofluid should be used in CPC in place of metallic oxide-based nanofluids, i.e., Al2O3–H2O, Al2O3–EG, and MgO–EG.
In addition, the results provide a comprehensive comparative study and recommendation on the hybrid nanofluids. Let us keep in mind that data engineering in the age of digital twin modelling is gaining popularity as a surrogate modelling of thermodynamics and mechanical systems. Thus, in the future, it is suggested to use these results/database for the development of an empirical correlation to provide a direct performance measurement [69,70,71,72,73].

Author Contributions

All authors (M.K., M.A., N.A.S., J.A., R.T. and J.K.) have equally contributed to conceptualisation, methodology, software, validation, formal analysis, investigation, resources, data curation, writing—original draft preparation, writing—review and editing, visualisation, supervision, project administration, and funding acquisition. All authors have read and agreed to the published version of the manuscript.

Funding

The authors are thankful to the Higher Education Commission of Pakistan (HEC) for their financial support of this research work through the NRPU-10483 project.

Data Availability Statement

Not applicable.

Conflicts of Interest

The authors declare no conflict of interest.

Abbreviations

AArea (m2)
AaAperture Area (m2)
Al2O3Aluminium oxide
AuGold
AgSilver
CeO2Ceric oxide
CNTsCarbon nanotubes
CuOCupric oxide
CPCCompound parabolic collector
CpSpecific heat capacity (J kg−1 K−1)
EGEthylene glycol
Fe3O4Iron oxide
FPSCFlat-plate solar collector
GNPsGraphene nanoplatelets
GeTotal effective solar irradiance on collector’s aperture (Wm−2)
MgOMagnesium oxide
MWCNTsMulti-walled carbon nanotubes
m ˙ Mass flow rate (kg s−1)
Q u Useful solar heat gain (W)
QsSolar power entering into collector’s aperture (W)
SiO2Silicon dioxide
SiCSilicon carbide
SDBSSodium dodecyl benzene sulphonate
SFTSingle flow through
TiO2Titanium oxide
TTemperature (°C)
ToOutlet temperature (°C)
TiInlet temperature (°C)
Δ T Temperature difference
ZnOZinc oxide
Greek Symbols
ρ Density (kg·m−3)
ϕ Volumetric concentration (%)
η Thermal efficiency (%)
Subscripts
aAperture
bfBase fluid
iInlet
nfNanofluid
npNanoparticle
oOutlet

References

  1. Mittelman, G.; Epstein, M. A Novel Power Block for CSP Systems. Sol. Energy 2010, 84, 1761–1771. [Google Scholar] [CrossRef]
  2. Bhutto, A.W.; Bazmi, A.A.; Zahedi, G. Greener Energy: Issues and Challenges for Pakistan-Solar Energy Prospective. Renew. Sustain. Energy Rev. 2012, 16, 2762–2780. [Google Scholar] [CrossRef]
  3. Ashraf Chaudhry, M.; Raza, R.; Hayat, S.A. Renewable Energy Technologies in Pakistan: Prospects and Challenges. Renew. Sustain. Energy Rev. 2009, 13, 1657–1662. [Google Scholar] [CrossRef]
  4. Grabowska, K.; Zylka, A.; Kulakowska, A.; Skrobek, D.; Krzywanski, J.; Sosnowski, M.; Ciesielska, K.; Nowak, W. Experimental Investigation of an Intensified Heat Transfer Adsorption Bed (IHTAB) Reactor Prototype. Materials 2021, 14, 3520. [Google Scholar] [CrossRef]
  5. Skrobek, D.; Krzywanski, J.; Sosnowski, M.; Kulakowska, A.; Zylka, A.; Grabowska, K.; Ciesielsak, K.; Nowak, W. Prediction of sorption processes using the deep learning methods (long short-term memory). Energies 2020, 13, 6601. [Google Scholar] [CrossRef]
  6. Kulakowska, A.; Pajdak, A.; Krzywanski, J.; Grabowska, K.; Zylka, A.; Sosnowski, M.; Wesolowka, M.; Sztekler, K.; Nowak, W. Effect of Metal and Carbon Nanotube Additives on the Thermal Diffusivity of a Silica Gel-Based Adsorption Bed. Energies 2020, 13, 1391. [Google Scholar] [CrossRef] [Green Version]
  7. Hachicha, A.A.; Rodríguez, I.; Capdevila, R.; Oliva, A. Heat Transfer Analysis and Numerical Simulation of a Parabolic Trough Solar Collector. Appl. Energy 2013, 111, 581–592. [Google Scholar] [CrossRef] [Green Version]
  8. Krzywanski, J.; Grabowska, K.; Sosnowski, M.; Zylka, A.; Kulakowska, A.; Czakiert, T.; Sztekler, K.; Wesolowska, M.; Nowak, W. Heat transfer in adsorption chillers with fluidized beds of silica gel, zeolite, and carbon nanotubes. Heat Transf. Eng. 2021, 43, 172–182. [Google Scholar] [CrossRef]
  9. Skrobek, D.; Krzywanski, J.; Sosnowski, M.; Kulakowska, A.; Zylka, A.; Grabowska, K.; Ciesielska, K.; Nowak, W. Implementation of deep learning methods in prediction of adsorption processes. Adv. Eng. Softw. 2022, 173, 103190. [Google Scholar] [CrossRef]
  10. Pajdak, A.; Kulakowska, A.; Liu, J.; Berent, K.; Kudasik, M.; Krzywanski, J.; Kalawa, W.; Sztekler, K.; Skoczylas, N. Accumulation and Emission of Water Vapor by Silica Gel Enriched with Carbon Nanotubes CNT-Potential Applications in Adsorption Cooling and Desalination Technology. Appl. Sci. 2022, 12, 5644. [Google Scholar] [CrossRef]
  11. Kasaeian, A.B.; Bakhsh, A. Convection Heat Transfer Modeling of Ag Nanofluid Using Different Viscosity Theories. IIUM Eng. J. 2012, 13, 1–11. [Google Scholar] [CrossRef]
  12. Akhtar, F.; Ali, M.; Sheikh, N.A.; Shehryar, M. Experimental Investigation of Solar Compound Parabolic Collector Using Al2O3/H2O Nanofluid in A Subtropical Climate. Therm. Sci. 2021, 25, 3453–3465. [Google Scholar] [CrossRef]
  13. Mesgari, S.; Coulombe, S.; Hordy, N.; Taylor, R.A. Thermal Stability of Carbon Nanotube-Based Nanofluids for Solar Thermal Collectors. Mater. Res. Innov. 2015, 19, S5650–S5653. [Google Scholar] [CrossRef]
  14. Singh, T.; Almanassra, I.W.; Ghani Olabi, A.; Al-Ansari, T.; McKay, G.; Ali Atieh, M. Performance Investigation of Multiwall Carbon Nanotubes Based Water/Oil Nanofluids for High Pressure and High Temperature Solar Thermal Technologies for Sustainable Energy Systems. Energy Convers. Manag. 2020, 225, 113453. [Google Scholar] [CrossRef]
  15. Eltaweel, M.; Abdel-Rehim, A.A.; Attia, A.A.A. Energetic and Exergetic Analysis of a Heat Pipe Evacuated Tube Solar Collector Using MWCNT/Water Nanofluid. Case Stud. Therm. Eng. 2020, 22, 100743. [Google Scholar] [CrossRef]
  16. Ganesh Kumar, P.; Sakthivadivel, D.; Thangapandian, N.; Salman, M.; Kumar Thakur, A.; Sathyamurthy, R.; Chul Kim, S. Effects of Ultasonication and Surfactant on the Thermal and Electrical Conductivity of Water—Solar Glycol Mixture Based Al2O3 Nanofluids for Solar-Thermal Applications. Sustain. Energy Technol. Assess. 2021, 47, 101371. [Google Scholar] [CrossRef]
  17. Sathishkumar, A.; Cheralathan, M. Charging and Discharging Processes of Low Capacity Nano-PCM Based Cool Thermal Energy Storage System: An Experimental Study. Energy 2023, 263, 125700. [Google Scholar] [CrossRef]
  18. Kumar, P.G.; Prabakaran, R.; Sakthivadivel, D.; Somasundaram, P.; Vigneswaran, V.S.; Kim, S.C. Ultrasonication Time Optimization for Multi-Walled Carbon Nanotube Based Therminol-55 Nanofluid: An Experimental Investigation. J. Therm. Anal. Calorim. 2022, 147, 10329–10336. [Google Scholar] [CrossRef]
  19. Mahbubul, I.M.; Khan, M.M.A.; Ibrahim, N.I.; Ali, H.M.; Al-Sulaiman, F.A.; Saidur, R. Carbon Nanotube Nanofluid in Enhancing the Efficiency of Evacuated Tube Solar Collector. Renew. Energy 2018, 121, 36–44. [Google Scholar] [CrossRef]
  20. Eltaweel, M.; Abdel-Rehim, A.A. Energy and Exergy Analysis of a Thermosiphon and Forced-Circulation Flat-Plate Solar Collector Using MWCNT/Water Nanofluid. Case Stud. Therm. Eng. 2019, 14, 100416. [Google Scholar] [CrossRef]
  21. ANSI Standard B198.1; Methods of Testing to Determine the Thermal Performance of Solar Collectors. ASHARE: Peachtree Corners, GA, USA, 1977. Available online: https://webstore.ansi.org/preview-pages/ASHRAE/preview_ANSI+ASHRAE+93-2003.pdf (accessed on 1 August 2022).
  22. Sabiha, M.A.; Saidur, R.; Hassani, S.; Said, Z.; Mekhilef, S. Energy Performance of an Evacuated Tube Solar Collector Using Single Walled Carbon Nanotubes Nanofluids. Energy Convers. Manag. 2015, 105, 1377–1388. [Google Scholar] [CrossRef]
  23. Said, Z.; Saidur, R.; Sabiha, M.A.; Rahim, N.A.; Anisur, M.R. Thermophysical Properties of Single Wall Carbon Nanotubes and Its Effect on Exergy Efficiency of a Flat Plate Solar Collector. Sol. Energy 2015, 115, 757–769. [Google Scholar] [CrossRef]
  24. Verma, S.K.; Tiwari, A.K.; Chauhan, D.S. Experimental Evaluation of Flat Plate Solar Collector Using Nanofluids. Energy Convers. Energy Convers. Manag. 2017, 134, 103–115. [Google Scholar] [CrossRef]
  25. Bernard, S.S.; Suresh, G.; Ahmed, M.D.J.; Mageshwaran, G.; Madanagopal, V.; Karthikeyan, J. Performance Analysis of MWCNT Fluid Parabolic Trough Collector for Whole Year. Mater. Today Proc. 2021, 45, 1308–1311. [Google Scholar] [CrossRef]
  26. Kumar, L.H.; Kazi, S.N.; Masjuki, H.H.; Zubir, M.N.M.; Jahan, A.; Bhinitha, C. Energy, Exergy and Economic Analysis of Liquid Flat-Plate Solar Collector Using Green Covalent Functionalized Graphene Nanoplatelets. Appl. Therm. Eng. 2021, 192, 116916. [Google Scholar] [CrossRef]
  27. Eltaweel, M.; Abdel-Rehim, A.A.; Attia, A.A.A. A Comparison between Flat-Plate and Evacuated Tube Solar Collectors in Terms of Energy and Exergy Analysis by Using Nanofluid. Appl. Therm. Eng. 2021, 186, 116516. [Google Scholar] [CrossRef]
  28. Mwesigye, A.; Yılmaz, İ.H.; Meyer, J.P. Numerical Analysis of the Thermal and Thermodynamic Performance of a Parabolic Trough Solar Collector Using SWCNTs-Therminol®VP-1 Nanofluid. Renew. Energy 2018, 119, 844–862. [Google Scholar] [CrossRef] [Green Version]
  29. Liu, S.; Afan, H.A.; Aldlemy, M.S.; Al-Ansari, N.; Yaseen, Z.M. Energy Analysis Using Carbon and Metallic Oxides-Based Nanomaterials inside a Solar Collector. Energy Rep. 2020, 6, 1373–1381. [Google Scholar] [CrossRef]
  30. Naphon, P.; Assadamongkol, P.; Borirak, T. Experimental Investigation of Titanium Nanofluids on the Heat Pipe Thermal Efficiency. Int. Commun. Heat Mass Transf. 2008, 35, 1316–1319. [Google Scholar] [CrossRef]
  31. Sundar, L.S.; Singh, M.K.; Sousa, A.C.M. Enhanced Heat Transfer and Friction Factor of MWCNT-Fe3O4/Water Hybrid Nanofluids. Int. Commun. Heat Mass Transf. 2014, 52, 73–83. [Google Scholar] [CrossRef]
  32. Naphon, P.; Thongkum, D.; Assadamongkol, P. Heat Pipe Efficiency Enhancement with Refrigerant-Nanoparticles Mixtures. Energy Convers. Manag. 2009, 50, 772–776. [Google Scholar] [CrossRef]
  33. Farajzadeh, E.; Movahed, S.; Hosseini, R. Experimental and Numerical Investigations on the Effect of Al2O3/TiO2[Sbnd]H2O Nanofluids on Thermal Efficiency of the Flat Plate Solar Collector. Renew. Energy 2018, 118, 122–130. [Google Scholar] [CrossRef]
  34. Noie, S.H.; Heris, S.Z.; Kahani, M.; Nowee, S.M. Heat Transfer Enhancement Using Al2O3/Water Nanofluid in a Two-Phase Closed Thermosyphon. Int. J. Heat Fluid Flow 2009, 30, 700–705. [Google Scholar] [CrossRef]
  35. Menbari, A.; Alemrajabi, A.A.; Rezaei, A. Experimental Investigation of Thermal Performance for Direct Absorption Solar Parabolic Trough Collector (DASPTC) Based on Binary Nanofluids. Exp. Therm. Fluid Sci. 2017, 80, 218–227. [Google Scholar] [CrossRef]
  36. Choudhary, S.; Sachdeva, A.; Kumar, P. Time-Based Analysis of Stability and Thermal Efficiency of Flat Plate Solar Collector Using Iron Oxide Nanofluid. Appl. Therm. Eng. 2021, 183, 115931. [Google Scholar] [CrossRef]
  37. Sharafeldin, M.A.; Gróf, G. Experimental Investigation of Flat Plate Solar Collector Using CeO2-Water Nanofluid. Energy Convers. Energy Convers. Manag. 2018, 155, 32–41. [Google Scholar] [CrossRef]
  38. Hawwash, A.A.; Abdel Rahman, A.K.; Nada, S.A.; Ookawara, S. Numerical Investigation and Experimental Verification of Performance Enhancement of Flat Plate Solar Collector Using Nanofluids. Appl. Therm. Eng. 2018, 130, 363–374. [Google Scholar] [CrossRef]
  39. Verma, S.K.; Tiwari, A.K.; Chauhan, D.S. Performance Augmentation in Flat Plate Solar Collector Using MgO/Water Nanofluid. Energy Convers. Energy Convers. Manag. 2016, 124, 607–617. [Google Scholar] [CrossRef]
  40. Gupta, H.K.; Das Agrawal, G.; Mathur, J. An Experimental Investigation of a Low Temperature Al2O3-H2O Nanofluid Based Direct Absorption Solar Collector. Sol. Energy 2015, 118, 390–396. [Google Scholar] [CrossRef]
  41. Faizal, M.; Saidur, R.; Mekhilef, S.; Alim, M.A. Energy, Economic and Environmental Analysis of Metal Oxides Nanofluid for Flat-Plate Solar Collector. Energy Convers. Energy Convers. Manag. 2013, 76, 162–168. [Google Scholar] [CrossRef]
  42. Eastman, J.A.; Choi, S.U.S.; Li, S.; Yu, W.; Thompson, L.J. Anomalously Increased Effective Thermal Conductivities of Ethylene Glycol-Based Nanofluids Containing Copper Nanoparticles. Appl. Phys. Lett. 2001, 78, 718–720. [Google Scholar] [CrossRef]
  43. Choi, S.U.S.; Li, S.; Eastman, J.A. Measuring Thermal Conductivity of Fluids Containing Oxide Nanoparticles. J. Heat Transf. 1999, 121, 280–289. [Google Scholar] [CrossRef]
  44. Hong, T.K.; Yang, H.S.; Choi, C.J. Study of the Enhanced Thermal Conductivity of Fe Nanofluids. J. Appl. Phys. 2005, 97, 064311. [Google Scholar] [CrossRef]
  45. Xie, H.; Wang, J.; Xi, T.; Liu, Y. Thermal Conductivity of Suspensions Containing Nanosized SiC Particles. Int. J. Thermophys. 2002, 23, 571–580. [Google Scholar] [CrossRef]
  46. Patel, H.E.; Das, S.K.; Sundararajan, T.; Sreekumaran Nair, A.; George, B.; Pradeep, T. Thermal Conductivities of Naked and Monolayer Protected Metal Nanoparticle Based Nanofluids: Manifestation of Anomalous Enhancement and Chemical Effects. Appl. Phys. Lett. 2003, 83, 2931–2933. [Google Scholar] [CrossRef] [Green Version]
  47. Xie, H.; Lee, H.; Youn, W.; Choi, M. Nanofluids Containing Multiwalled Carbon Nanotubes and Their Enhanced Thermal Conductivities. J. Appl. Phys. 2003, 94, 4967–4971. [Google Scholar] [CrossRef]
  48. Assael, M.J.; Chen, C.F.; Metaxa, I.; Wakeham, W.A. Thermal Conductivity of Suspensions of Carbon Nanotubes in Water. Int. J. Thermophys. 2004, 25, 971–985. [Google Scholar] [CrossRef]
  49. Choi, S.U.S.; Zhang, Z.G.; Yu, W.; Lockwood, F.E.; Grulke, E.A. Anomalous Thermal Conductivity Enhancement in Nanotube Suspensions. Appl. Phys. Lett. 2001, 79, 2252–2254. [Google Scholar] [CrossRef]
  50. Murshed, S.M.S.; Leong, K.C.; Yang, C. Enhanced Thermal Conductivity of TiO2—Water Based Nanofluids. Int. J. Therm. Sci. 2005, 44, 367–373. [Google Scholar] [CrossRef]
  51. Yiamsawas, T.; Mahian, O.; Dalkilic, A.S.; Kaewnai, S.; Wongwises, S. Experimental Studies on the Viscosity of TiO2 and Al2O3 Nanoparticles Suspended in a Mixture of Ethylene Glycol and Water for High Temperature Applications. Appl. Energy 2013, 111, 40–45. [Google Scholar] [CrossRef]
  52. Ouikhalfan, M.; Labihi, A.; Belaqziz, M.; Chehouani, H.; Benhamou, B.; Sarı, A.; Belfkira, A. Stability and Thermal Conductivity Enhancement of Aqueous Nanofluid Based on Surfactant-Modified TiO2. J. Dispers. Sci. Technol. 2020, 41, 374–382. [Google Scholar] [CrossRef]
  53. Teng, T.P.; Fang, Y.B.; Hsu, Y.C.; Lin, L. Evaluating Stability of Aqueous Multiwalled Carbon Nanotube Nanofluids by Using Different Stabilizers. J. Nanomater. 2014, 2014, 693459. [Google Scholar] [CrossRef] [Green Version]
  54. Nikkam, N.; Ghanbarpour, M.; Saleemi, M.; Haghighi, E.B.; Khodabandeh, R.; Muhammed, M.; Palm, B.; Toprak, M.S. Experimental Investigation on Thermo-Physical Properties of Copper/Diethylene Glycol Nanofluids Fabricated via Microwave-Assisted Route. Appl. Therm. Eng. 2014, 65, 158–165. [Google Scholar] [CrossRef]
  55. Gupta, N.; Gupta, S.M.; Sharma, S.K. Synthesis, Characterization and Dispersion Stability of Water-Based Cu–CNT Hybrid Nanofluid without Surfactant. Microfluid. Nanofluid. 2021, 25, 14. [Google Scholar] [CrossRef]
  56. Sundar, L.S.; Singh, M.K.; Sousa, A.C.M. Investigation of Thermal Conductivity and Viscosity of Fe3O4 Nanofluid for Heat Transfer Applications. Int. Commun. Heat Mass Transf. 2013, 44, 7–14. [Google Scholar] [CrossRef]
  57. Shahsavar, A.; Salimpour, M.R.; Saghafian, M.; Shafii, M.B. Effect of Magnetic Field on Thermal Conductivity and Viscosity of a Magnetic Nanofluid Loaded with Carbon Nanotubes. J. Mech. Sci. Technol. 2016, 30, 809–815. [Google Scholar] [CrossRef]
  58. Gallego, A.; Cacua, K.; Herrera, B.; Cabaleiro, D.; Piñeiro, M.M.; Lugo, L. Experimental Evaluation of the Effect in the Stability and Thermophysical Properties of Water-Al2O3 Based Nanofluids Using SDBS as Dispersant Agent. Adv. Powder Technol. 2020, 31, 560–570. [Google Scholar] [CrossRef]
  59. Kumar, P.C.M.; Muruganandam, M. Stability Analysis of Heat Transfer MWCNT with Different Base Fluids. J. Appl. Fluid Mech. 2017, 10, 51–59. [Google Scholar] [CrossRef]
  60. Bin-Abdun, N.A.; Razlan, Z.M.; Bakar, S.A.; Voon, C.H.; Ibrahim, Z.; Wan, W.K.; Ridzuan, M.J.M. Heat Transfer Improvement in Simulated Small Battery Compartment Using Metal Oxide (CuO)/Deionized Water Nanofluid. Heat Mass Transf. 2020, 56, 399–406. [Google Scholar] [CrossRef]
  61. US Research Nanomaterials, Inc. Available online: https://www.us-nano.com/ (accessed on 1 August 2022).
  62. Bellos, E.; Korres, D.; Tzivanidis, C.; Antonopoulos, K.A. Design, Simulation and Optimization of a Compound Parabolic Collector. Sustain. Energy Technol. Assess. 2016, 16, 53–63. [Google Scholar] [CrossRef]
  63. Ali, A.; Ilyas, S.U.; Garg, S.; Alsaady, M.; Maqsood, K.; Nasir, R.; Abdulrahman, A.; Zulfiqar, M.; Mahfouz, A.B.; Ahmed, A.; et al. Dynamic Viscosity of Titania Nanotubes Dispersions in Ethylene Glycol/Water-Based Nanofluids: Experimental Evaluation and Predictions from Empirical Correlation and Artificial Neural Network. Int. Commun. Heat Mass Transf. 2020, 118, 104882. [Google Scholar] [CrossRef]
  64. Khairul, M.A.; Shah, K.; Doroodchi, E.; Azizian, R.; Moghtaderi, B. Effects of Surfactant on Stability and Thermo-Physical Properties of Metal Oxide Nanofluids. Int. J. Heat Mass Transf. 2016, 98, 778–787. [Google Scholar] [CrossRef]
  65. Qamar, A.; Anwar, Z.; Ali, H.; Shaukat, R.; Imran, S.; Arshad, A.; Ali, H.M.; Korakianitis, T. Preparation and Dispersion Stability of Aqueous Metal Oxide Nanofluids for Potential Heat Transfer Applications: A Review of Experimental Studies. J. Therm. Anal. Calorim. 2022, 147, 23–46. [Google Scholar] [CrossRef]
  66. Qamar, A.; Anwar, Z.; Ali, H.; Imran, S.; Shaukat, R.; Mujtaba Abbas, M. Experimental Investigation of Dispersion Stability and Thermophysical Properties of ZnO/DIW Nanofluids for Heat Transfer Applications. Alex. Eng. J. 2022, 61, 4011–4026. [Google Scholar] [CrossRef]
  67. Impact Test Equipment. Available online: https://www.impact-test.co.uk/products/5420-kd2-pro-thermal-properties-meter/ (accessed on 1 August 2022).
  68. RHEOTEST® RN 5.1. Available online: https://www.rheotest.de/dsr-rheometer-rheotest-rn-5-1/ (accessed on 1 August 2022).
  69. Tariq, R.; Ali, M.; Sheikh, N.A.; Shahzad, M.W.; Bin Xu, B. Deep learning artificial intelligence framework for sustainable desiccant air conditioning system: Optimization towards reduction in water footprints. Int. Commun. Heat Mass Transf. 2023, 140, 106538. [Google Scholar] [CrossRef]
  70. Tariq, R.; Abatal, M.; Bassam, A. Computational intelligence for empirical modeling and optimization of methylene blue adsorption phenomena using available local zeolites and clay of Morocco. J. Clean. Prod. 2022, 370, 133517. [Google Scholar] [CrossRef]
  71. Tariq, R.; Torres-Aguilar, C.; Sheikh, N.A.; Ahmad, T.; Xamán, J.; Bassam, A. Data engineering for digital twining and optimization of naturally ventilated solar façade with phase changing material under global projection scenarios. Elsevier Renew. Energy 2022, 187, 1184–1203. [Google Scholar] [CrossRef]
  72. Tariq, R.; Torres-Aguilar, C.; Xamán, J.; Zavala-Guillén, I.; Bassam, A.; Ricalde, L.J.; Carvente, O. Digital twin models for optimization and global projection of building-integrated solar chimney. Elsevier Build. Environ. 2022, 213, 108807. [Google Scholar] [CrossRef]
  73. Tariq, R.; Cetina-Quiñones, A.; Cardoso-Fernández, V.; Daniela-Abigail, H.-L.; Soberanis, M.A.E.; Bassam, A.; De Lille, M.V. Artificial intelligence assisted technoeconomic optimization scenarios of hybrid energy systems for water management of an isolated community. Sustain. Energy Technol. Assess. 2021, 48, 101561. [Google Scholar] [CrossRef]
Figure 1. Research activity flow diagram.
Energies 16 01298 g001
Figure 2. Step-by-step nanofluids preparation: (a) weight balance; (b) magnetic stirring; (c) shear homogenisation; (d) ultrasonication.
Energies 16 01298 g002
Figure 3. Experimental setup.
Energies 16 01298 g003
Figure 4. Visual stability with 0.075 vol% (a) after preparation, (b) after 20 h, (c) after 40 h, (d) after 60 h.
Energies 16 01298 g004
Figure 5. Variation in maximum pH (a) MWCNT–H2O (b) MWCNT–EG (c) Al2O3–H2O (d) Al2O3–EG (e) MgO–EG.
Energies 16 01298 g005
Figure 6. Variation in thermal conductivity ratio with different volumetric concentrations at 30 °C (a) MWCNT–H2O, MWCNT–EG, (b) Al2O3–H2O, Al2O3–EG, MgO–EG, (c) Comparison of thermal conductivity of metallic and non-metallic oxide nanofluids.
Energies 16 01298 g006
Figure 7. Variation in viscosity with temperature and volumetric concentrations at shear rate 200 s−1: (a) MWCNT–H2O, (b) MWCNT–EG, (c) Al2O3–H2O, (d) Al2O3-EG, (e) MgO–EG.
Energies 16 01298 g007aEnergies 16 01298 g007b
Figure 8. Average solar radiations and ambient temperature.
Energies 16 01298 g008
Figure 9. Comparison of change in temperature with regard to time: (a) 0.025 vol% at 0.02 kg/s, (b) 0.075 vol% at 0.02 kg/s, (c) 0.025 vol% at 0.015 kg/s, (d) 0.075 vol% at 0.015 kg/s.
Energies 16 01298 g009
Figure 10. Comparison of thermal efficiency with regard to time: (a) 0.025 vol% at 0.02 kg/s, (b) 0.075 vol% at 0.02 kg/s, (c) 0.025 vol% at 0.015 kg/s, (d) 0.075vol% at 0.015 kg/s.
Energies 16 01298 g010
Table 1. Summary of comparison of thermal conductivity of metallic and non-metallic oxide nanofluids.
ReferenceBase FluidNanoparticlesAverage Particle
Size
Volumetric
Concentration
Thermal
Conductivity
Enhancement
Xuan et al. [42]WaterCu100 nm7.5%78%
Lee et al. [43]WaterAl2O333 nm4.3%15%
Hong et al. [44]EGFe10 nm0.55%18%
Xie et al. [45]WaterSiC26 nm4.2%16%
Patel et al. [46]WaterAg60–80 nm0.001%17%
Choi et al. [43]EGCu10 nm0.3%40%
Patel et al. [46]WaterAu10–20 nm0.026%21%
Lee et al. [43]WaterCuO36 nm3.4%12%
Xie et al. [47]EG–WaterMWCNT15 nm1%20%
Assael et al. [48]WaterMWCNT100 nm0.6%38%
Choi et al. [49]Synthetic oilMWCNT25 nm1%150%
Murshed et al. [50]WaterTiO215 nm5%30%
Table 2. Comparison of stability of nanofluid with respect to the preparation method.
ReferencesNanoparticlesBase FluidStirring Time
(min)
Homogeniser
Time/min
Sonication
Time/H
Stability Study
Method
Stability
Duration/Day
Gupta et al. [51] CU–CNTsDI Water15301Zeta potential7
Choudhary et al. [52]Al2O3DI Water--3pH16
Kakati et al. [53] Al2O3DI Water10--pH4–5
Li et al. [54]Ag, AuWater60--Zeta potential60
Chen et al. [55] Al2O3Paraffin30–45-2.75–3.5Zeta potential60
Esmaeili et al. [53] AlN–CEG60-0.5Zeta potential90
Chen et al. [56] MWCNTDI Water45-1Zeta potential, UV–Vis,60
Mukesh Kumar et al. [57] MWCNTEngine oil30-1Visual observation30
Afzal et al. [58] ZnODI Water35-2–8Zeta potential74
Ilyas et al. [52] MWCNTThermal oil-301Visual observation30
Hamid et al. [59] TiO2–SiO2EG–Water180-2pH14
Teng et al. [53] MWCNTsWater110301Zeta potential30
Yousefi et al. [60]MWCNTsDI Water--0.5pH10
Table 3. Nanoparticle properties [61].
PropertiesAl2O3MgOMWCNT
Morphology (γ)SphericalSphericalAligned shape
Average diameter (nm)202010–20
Particle colourWhiteWhiteBlack
Particle density (kg/m3)389035802100
Particle-specific heat (J/kg.K)8801030796
Thermal conductivity (W/m.k)36423000
Table 4. Specifications for equipment used in nanofluid preparation and characterisation.
NameModelSpecifications
Analytical balanceAWU-220D ShimadzuMinimum display: 0.01 mg; standard deviation: 0.1 mg;
response time: 2–14 s; measuring capacity: 0–83 g.
Hot plate magnetic stirrerSCILOGE
MS-H380-Pro
Temperature range: 20–380 °C; stirring capacity: 2 dm3;
temperature range accuracy: ±1 °C; maximum speed: 1400 rpm.
Shear homogeniserULTRA-TURRAX T25 Permissible ambient temperature: 5–40 °C;
speed range: 3000–25,000 rpm; volume range: 1–2000 dm3.
Ultrasonication
bath
FSF-020SUltrasonic frequency: 50 Hz; effective ultrasonic power: 100 W; heat output: 400 W; temperature range: 30–80 °C.
pH meteredge® pH HI2002pH range: −2.0–16.0 pH; temperature Range: −20.0–120.0 °C.
Rotary rheometerRHEOTEST
RN 5.1
Torque resolution: 0.002 mNm; viscosity range: 1–3 × 10⁹ mPa·s;
temperature range: −60–200 °C.
Cylinder measuringsystemRHEOTEST
RN 5.1
Measuring cup diameter: 38 mm; rotor length: 52.56 mm, viscosity range: 20–105 mPa·s, rotor diameter: 35.04 mm, shear rate range: 0–1300 s−1.
Thermal conductivity analyserTEMPOSSensor operating range: −50–150 °C; accuracy: ±10%;
thermal conductivity range: 0.02–2 W/mK.
Table 5. Nanofluid sample preparation condition.
NanofluidsParticle
Concentration
SurfactantEquipment UsedOperating Time
(Hours)
Operating Speed and Temperature
Al2O3–H200.025–0.075%SDBSMagnetic Stirrer1800 rpm, 60 °C
Ultra-Turrax T250.59000 rpm
Ultrasonic Bath2Up to 60 °C
Al2O3–EG0.025–0.075%SDBSMagnetic Stirrer1800 rpm, 60 °C
Ultra-Turrax T250.59000 rpm
Ultrasonic Bath2Up to 60 °C
MgO–EG0.025–0.075%SDBSMagnetic Stirrer1800 rpm,
Ultra-Turrax T250.59000 rpm
Ultrasonic Bath2.5Up to 60 °C
MWCNT–H2O0.025–0.075%SDBSMagnetic Stirrer2900 rpm, 70 °C
Ultra-Turrax T250.515,000 rpm
Ultrasonic Bath3Up to 70 °C
MWCNT–EG0.025–0.075%SDBSMagnetic Stirrer2900 rpm, 40 °C
Ultra-Turrax T250.515,000 rpm
Ultrasonic Bath3Up to 70 °C
Table 6. Solar system design parameters.
ParameterInput Value
Collector area0.828 m2
Aperture width 0.4456 m
Aperture length 1.858 m
Collector fin efficiency0.7
Half acceptance angle24°
Truncation ratio0.2
Concentration ratio4.17
Absorber length 1.858 m
Incident radiations 945 W/m2
Glass outer diameter 60 mm
Thickness 2.5 mm
Absorber outer diameter 34 mm
Table 7. Instrumentation used during experimentation and their uncertainty.
ParameterMeasuring InstrumentUncertainty
Solar radiationsPyranometer±2%
Inlet, outlet, and ambient temperaturesK-Type thermocouple±0.1 °C
Flow rateWater flow meter±2%
Disclaimer/Publisher’s Note: The statements, opinions and data contained in all publications are solely those of the individual author(s) and contributor(s) and not of MDPI and/or the editor(s). MDPI and/or the editor(s) disclaim responsibility for any injury to people or property resulting from any ideas, methods, instructions or products referred to in the content.

